1. Introduction
In China, the world’s second largest economy, corporations are increasingly interested in sustainability information disclosure, including corporate social responsibility (CSR) disclosure. The number of CSR reports by Chinese companies increased by nearly 53% in the decade from 2006 to 2015 [
1]. Increasing attention has been paid to CSR activities in China’s capital market [
2,
3,
4,
5,
6,
7,
8,
9,
10], and this increased attention has provided many opportunities for scholars to conduct quantitative research on CSR activities and related information disclosure activities based on China’s capital market [
11,
12,
13,
14]. In this regard, a large number of studies have focused on the driving factors and economic consequences of CSR activities and related disclosure activities of Chinese companies, especially in the past five years. These studies inevitably involve quantitative issues of CSR performance and CSR disclosure quality. Currently, two methods are mainly used. In the first category, researchers, such as Li and Zhang [
15], use content analysis to perform subjective scoring based on custom criteria. However, this method has problems related to the reproducibility and comparability of the research conclusions due to differences in the selection of the ranking system and differences in the subjective judgement of researchers. The second category directly uses third-party rating scores. To some extent, this approach helps improve the reproducibility of research and the comparability between studies, although such improvements must be based on the rationality of the design and use of these scores.
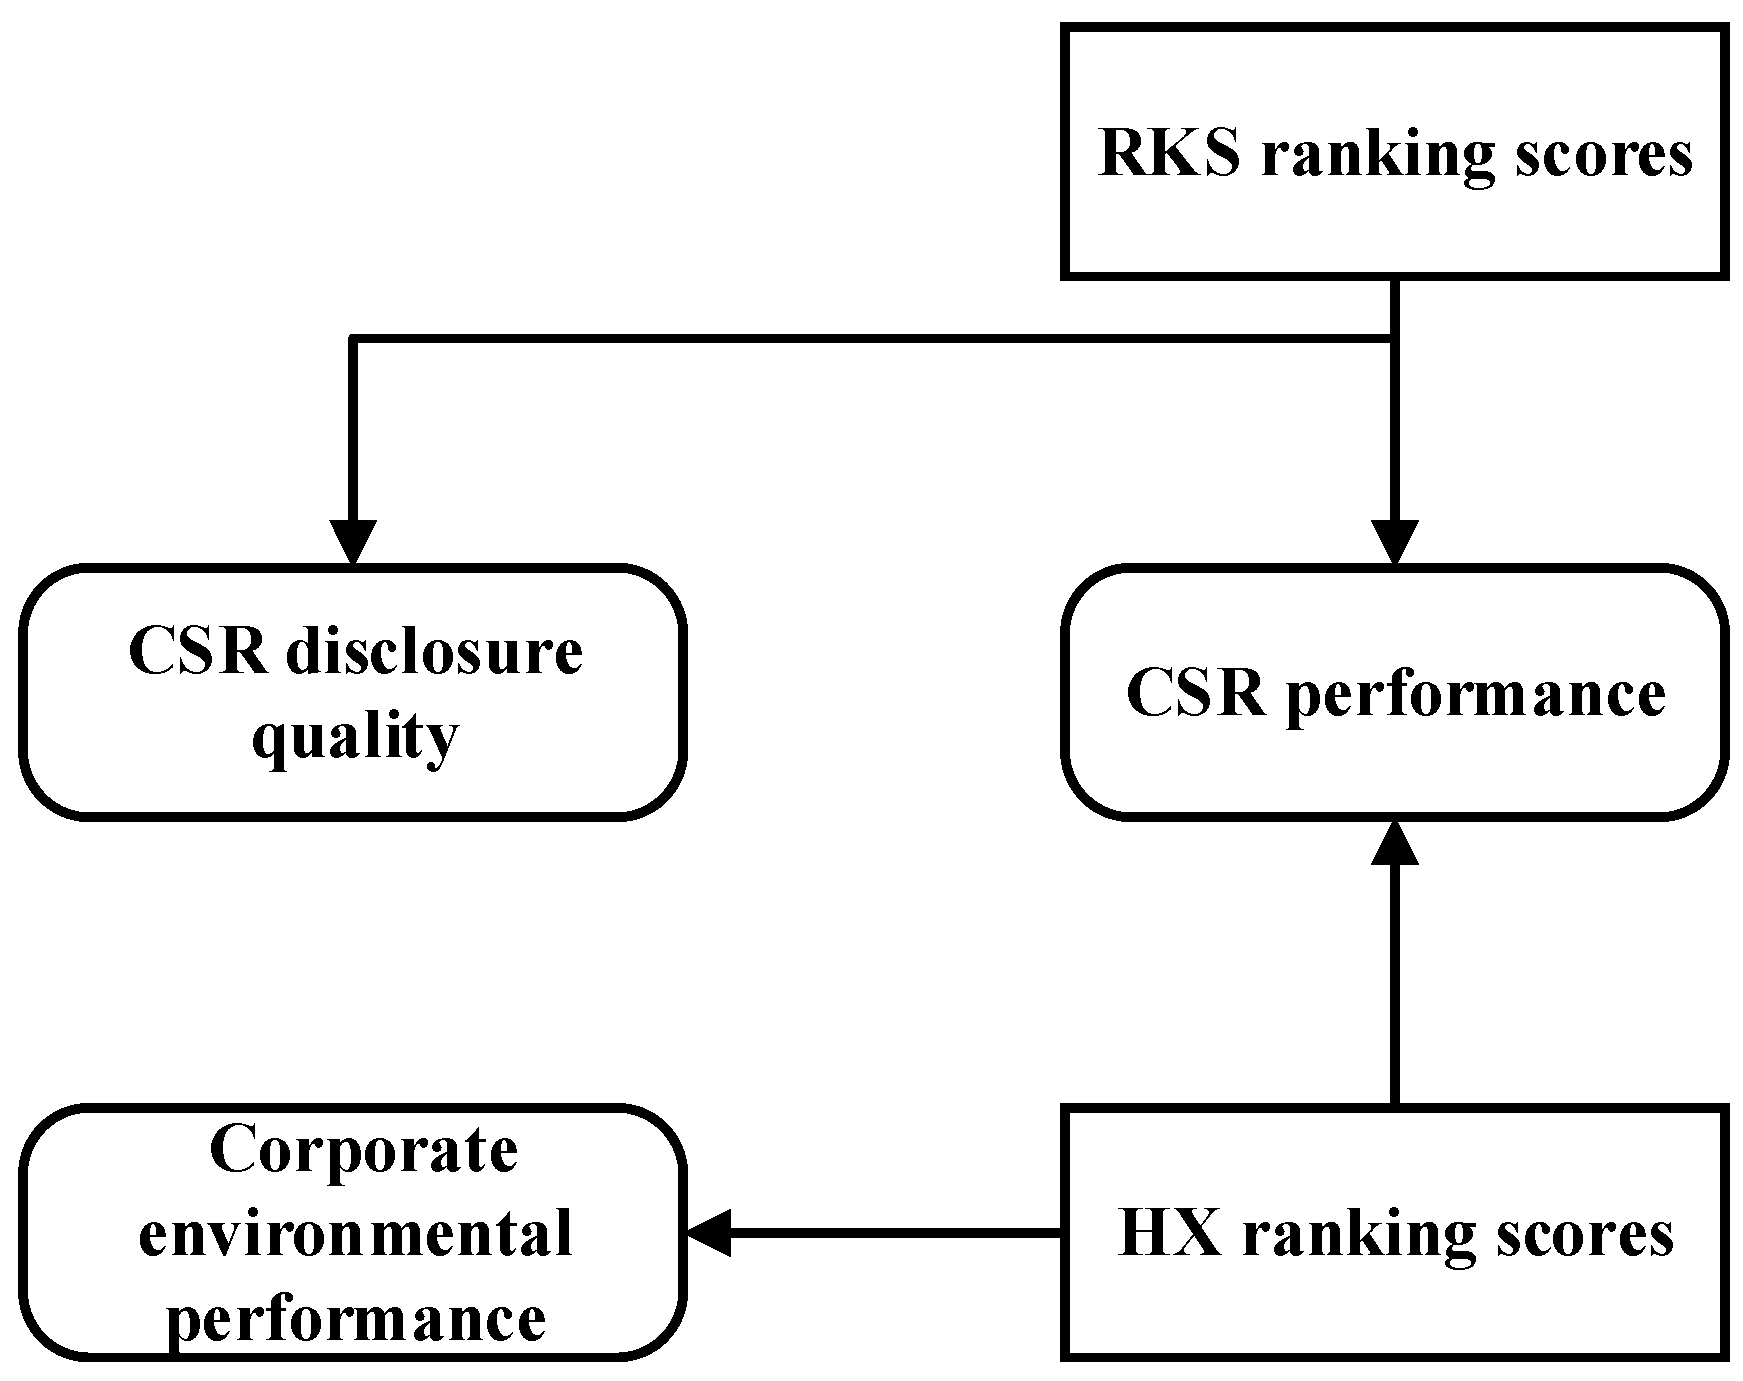
In China’s capital market, existing research on CSR mainly uses Runlin Global’s Rankings rating (hereafter referred to as RKS) and Hexun’s CSR rating (hereafter referred to as HX). In previous empirical research, overlaps and differences are observed in the employment of these two scores as shown in
Figure 1: (1) The RKS score is used not only to represent the quality of CSR disclosure but also for CSR performance levels, such as in research on the drivers of CSR disclosure quality [
16,
17,
18,
19], the mechanisms of economic consequences [
20,
21,
22,
23], the drivers of CSR performance [
24,
25,
26,
27,
28,
29], and economic consequences [
30,
31,
32,
33,
34,
35]; and (2) the HX score is used only as a proxy for the CSR performance level, such as in research on the drivers of CSR performance [
36,
37,
38,
39,
40] and the economic consequences of CSR performance [
19,
33,
41,
42,
43]. Some studies even use the level-1 sub-indicator of the HX score, the environmental dimension HXE, to score a firm’s environmental performance level [
44,
45].
When researchers do not consider the characteristics of these ratings and rashly use them to measure CSR-related constructs, their results may suffer from two important problems: First, is it reasonable for the RKS score to be used as a proxy, not only for CSR performance but also for CSR disclosure quality? If the RKS score is designed to be biased towards measuring the CSR disclosure quality, then in practice, its use to measure the CSR performance may exhibit poor construct validity. For example, if a researcher wants to determine whether a firm with high CSR performance will obtain a lower or higher capital cost, he may use RKS scores as a proxy for the CSR performance in the research design. However, empirical analyses performed to test whether firms with a high CSR disclosure quality obtain a lower or higher capital cost may not obtain accurate results, because companies with a higher CSR disclosure quality may not necessarily have a better CSR performance. Existing research has found that there is a gap between CSR performance and CSR disclosure quality, because some companies with a lower CSR performance will make a high-quality CSR disclosure for CSR-washing or green-washing [
46,
47,
48]. Second, for the measurement of CSR performance constructs, some studies choose RKS scores while others choose HX scores; however, it is not reasonable that studies do not test the conclusions based on the simultaneous use of these two scores. If there is a large difference between the two ranking systems of these scores, then the robustness of the relevant research conclusions will be highly problematic [
43]. If the two indicator systems have significant differences in their theoretical basis, scoring design, scoring method, information source, and firm coverage, then the use of both to measure the same CSR construct is likely to present a convergent validity problem. Unfortunately, research has not been performed to analyze the differences between and convergence of these two scores.
In view of the above research gaps, this paper first compares and analyzes the design of the RKS and HX rating systems, and then reveals the possible problems of convergent validity based on quantitative analysis methods, such as Spearman correlation analysis. This paper finds the following: First, based on a comparison and theoretical analysis of information sources, scoring methods, and indicator design, RKS is more suitable for measuring the quality of CSR information disclosure, while HX is more suitable for measuring CSR performance; second, based on Spearman correlation analysis, we found that the correlation between the two is very low, indicating that the convergent validity of the two is very poor; and finally, this paper analyzes the weights of the sub-indicators of the RKS and HX indicator systems year-by-year, and finds that the HX score sub-indicator weights begin to show strong inconsistency after 2013, while the RKS scoring system maintains strong stability and convergent validity.
The main contributions of this paper are as follows: (1) This paper helps non-Mandarin language researchers interested in CSR topics in China’s capital market form a more comprehensive understanding of the two most widely used CSR rating systems in China; (2) the conclusions of our analysis can help researchers in the area of CSR in China’s capital market better understand the difference between the two scores, and they provide a reference for the design of subsequent quantitative research; and (3) this article helps socially responsible investors, business managers, CSR rating researchers, and other practitioners strengthen their understanding of China’s CSR evaluation system and better understand the scope and significance of China’s CSR rating systems, and it also provides a reference for CSR rating system designers to improve the rating systems in the future.
The remainder of this paper is organized as follows. In
Section 2, we review the background and make comparisons. In
Section 3, we describe the data resources, variable definitions and descriptive statistics. In
Section 4, the quantitative analysis results are presented. Finally, we present our main conclusions in
Section 5.
2. Background and Comparison of Ranking Systems
Since the Reform and Opening-up policy was enacted in 1978, China’s market has made tremendous progress in economic development, which has provided a favorable development space for the development of the CSR system. Prior to 2008, the information disclosure system related to the CSR concept was scattered among various legal provisions, such as the Environmental Protection Law in 1989, the Consumer Protection Law in 1993, and the Public Welfare Donation Law in 1999. Since 2003, the “Code of Corporate Governance for Listed Companies in China” issued by the China Securities Regulatory Commission (CSRC) has signaled that market regulators have officially introduced the concept of CSR. Subsequently, the market regulator further strengthened the legal status of CSR in 2005, specifically in the fifth revision of the newly revised Company Law, which states that corporations should abide by social ethics and business ethics and undertake social responsibilities. In 2008, the Chinese government officially launched the construction of a mandatory disclosure system for social responsibility information for large state-owned enterprises and important listed companies, and it includes the “Guiding Opinions on the Implementation of Social Responsibilities of Central Enterprises” released by the State Council, and a series of notices from of the Shanghai Stock Exchange (SSE) and the Shenzhen Stock Exchange (SZSE). As a result, the number of China’s CSR reports has surged, thus providing space for the development of third-party CSR rating activities. Since 2008, there have been five major rating agencies in the Chinese market: The CSR Research Center of the Chinese Academy of Social Sciences, SynTao, Golden Bee, Runlin, and Hexun. However, the first three rating agencies are more focused on providing CSR report consulting services, only publish rating data of active rating companies, or do not provide whole rating data and only publish certain lists, such as the list of top 100 companies in CSR ratings. Only Runlin and Hexun provide complete rating data, namely, RKS and HX scores. Therefore, in the existing Mandarin and English literature, quantitative research mainly uses Runlin’s RKS score and Hexun’s HX score.
Following previous studies [
5,
49,
50], CSR disclosure is defined as “the process of communicating the social effects of organizations’ economic actions to particular interest groups within society and to society at large”. CSR performance is “regarded as a ‘pragmatic approach’ to addressing CSR, specifically, to model and measure social responsibility in terms of performance”. Due to the lack of a mandatory information quality assurance system for non-financial information in China’s market, e.g., mandatory disclosure formats or auditing requirements, the quality or level of CSR disclosure cannot be equivalent to the level of CSR performance. For example, a firm may claim to produce a very detailed and exquisite CSR report and other information disclosure when, in actuality, the firm has not made a high investment in CSR activities and does not present higher CSR performance. Thus, this firm only has a high level of CSR disclosure instead of CSR performance, which reflects the “CSR-washing” or “green-washing” problem.
2.1. RKS Rating
RKS ranking scores are a product of the Runlin Global Consulting Limited Company (hereafter referred to as Runlin Global). The characteristics of the RKS rating system mainly include the following three points.
First, the RKS information sources are basically corporate CSR reports and sustainability reports (collectively referred to as CSR reports). The official website of RKS discloses that the sources of information are as follows: (1) The disclosure data of the Shanghai Stock Exchange (SSE) are collected from the information disclosure column of the official website of the SSE; and (2) the disclosure data of the Shenzhen Stock Exchange (SZHE) are collected from the website of Juchao.com. The RKS ranking only covers companies that have published CSR reports.
Second, the RKS rating system is more original in design. Compared with the international mainstream, the design of the RKS level-1 indicators is not based on the stakeholder perspective or the social responsibility component classification. Rather, the RKS system includes four level-1 sub-indicators: Macrocosm (M), content (C), technical (T), and industry (I). The development of the RKS-rated indicator system has gone through three phases from the 2009 beta version to the 2012_1.2i version (additional details are reported in
Table A1 of the
Appendix A). The standard referenced by RKS at the beginning of the design was the Global Reporting Initiative (GRI) G3 Guide and Sustainability Report Evaluation Guide, which included only three level-1 indicators: Macrocosm (M), content (C), and technical (T). Among them, the level-2 sub-indicators of the content-level indicator C were designed based on the stakeholder perspective, including economic performance, labour and human rights, the environment, and consumers. In 2010, the ranking system was improved with reference to ISO 26000 and the industry sub-indicator I was added. The rating manual version currently used by the RKS scoring system is the MCT 2012_1.2i version, in which 16 level-2 indicators and 70 level-3 indicators fall under three level-1 indicators: M, C, and T. In addition, under the fourth level-1 indicator, for industry I, 141 sub-indicators were designed according to 22 industry classifications.
Third, the RKS scoring method is based on content analysis, which does not involve horizontal comparisons of specific CSR indicators. The specific scoring progress of RKS is as follows: First, each level-3 indicator is manually scored by rating personnel, with a score range of 0 to 4 points and a minimum unit of 0.5 points. The rules defining the scoring are as follows: No information description or no representation at all: 0 points; only sporadic fuzzy information or sporadic information mentioned: 0.5 points; information is literally mentioned or there is no open disclosure: 1 point; language statement information disclosure: 1.5 points; system category and a small amount of data-based information disclosure: 2 points; system and some data-based information disclosure: 2.5 points; system and a large amount of data-based information disclosure: 3 points; basic and complete data-based information disclosure: 3.5 points; and complete and clear data-based information disclosure: 4 points. RKS then adds the level-3 sub-indicator scores directly to the level-1 indicator scores and multiplies the sum by a weight to obtain the total score. RKS discloses only the level-1 indicator score, whereas the scores of the level-2 to level-3 sub-indicators are not published. The indicator system for the currently used ratings is detailed in
Table A2 of the
Appendix A.
2.2. HX Rating
The HX score is from Hexun.com, which is controlled by Hexun Information Technology Limited Company (hereafter referred to as the Hexun Company). The HX CSR rating business is derived from a cooperative venture with Runlin Global. In September 2010, the Hexun Company co-hosted the second “A-share listed company CSR report forum” with Runlin Global and Det Norske Veritas (DNV). Since then, the Hexun Company and Runlin Global have carried out CSR rating cooperation. On 13 September, 2013, the Hexun Company began to independently release CSR evaluation products on Hexun.com, and they are still in use today. Compared with the RKS rating system, the HX rating system has the following characteristics.
First, HX has a wider range of information sources and every listed company that publishes its annual report is covered by the rating. The sources of information used by the HX ratings are not only the CSR reports, but also the annual reports from the SSE and SZSE official websites. For example, if the rated company does not publish a CSR report, then HX will still determine a CSR rating based on its annual report information while RKS will not rate it. Thus, the HX scores cover more firms that do not release CSR disclosures, while the RKS scores have much more narrow coverage. For example, the number of firm-years for rating companies from 2010 to 2017 is reported in Table 3, and the observations of HX are 25,156, which is nearly 4.5 times more than that of RKS. As a result, the Hexun rating system has a much wider range than the RKS rating system.
Second, the design of the HX sub-indicator system includes the following three main aspects: (1) In the design of the level-1 indicator system, HX applies a theoretical stakeholder framework, including five level-1 sub-indicators: Shareholder equity responsibility HXSH, employee responsibility HXST, supplier, customer and consumer rights responsibility HXC, environmental responsibility HXE, and social responsibility contribution HXS; (2) to consider industry differences, HX adopts weight adjustment, wherein the weights of the level-1 indicators are adjusted according to the industry of the rated firms; in contrast, RKS establishes an industry-level sub-indicator; and (3) in terms of the design of the underlying indicators, the range of indicators covered by HX is small, which causes a more serious problem in the non-shareholder responsibility indicators. HX includes only 13 level-2 indicators and 37 level-3 indicators, which is far fewer than the RKS scoring system, and there are 18 level-3 indicators that fall under the shareholder equity responsibility HXSH dimension, which accounts for nearly 50% of the indicators for this level. The sub-indicator system and indicator weights of the HX rating system are detailed in
Table A3 of
Appendix A.
Third, in terms of scoring methods, HX uses a weighted summation method involving horizontal comparisons of specific indicators at various levels. The scoring process completely discloses all scores from the first level to the bottom level-3 sub-indicators. The specific scoring method of HX is as follows: First, the HX level-3 indicators are assigned by the rating staff. Here, scores for numerical indicators, such as the return on net assets, are calculated according to the data model, while scores for qualitative indicators, such as environmental awareness, are scored according to whether the social responsibility report discloses the indicator and the disclosure is detailed; if the reporting company does not disclose the indicator, then the value is 0. Then, HX normalizes the values of the level-3 sub-indicators to calculate the value, multiplies it by the corresponding weight, and sums the products to generate the final total score.
Therefore, in its scoring process, HX is more automated and objective than the RKS rating system. Although HX scoring staff play major roles as information collectors, they do not make important subjective judgements in the scoring process. For example, when calculating the quantitative indicators of HX, the HX staff only need to substitute the values of the indicators collected from the annual report or CSR report into the calculation formula system; and when calculating the qualitative index, they only score 0 or 1 according to whether the related information is disclosed and then substitute the number into the calculation formula system. The final scoring results of HX are highly dependent on the initial evaluation formula system and do not depend on the subjective judgement of the scoring staff. However, RKS staff are tasked with evaluating the information disclosure level of all the underlying level-3 sub-indicators and scoring a specific value from 0 to 4 points, item by item. Therefore, the final RKS scoring results are more dependent on the subjective judgement of the scoring staff.
2.3. Summary of the Comparison
In summary, as shown in
Table 1, the main differences between the RKS and HX rating systems are as follows.
First, the scope of the firms covered by the RKS scores is small, with only firms listed in the SSE and SZHE that publish CSR reports covered, and the scoring method is content analysis. The analytical methods do not involve horizontal comparisons of specific indicator values. A higher RKS evaluation means that the information disclosure in the CSR reports issued by rated firms is more detailed and specific; however, this does not mean that the firms have a higher level of specific CSR input or performance. For example, according to RKS rating rules, when a rating company only reports its charitable donation indicator without an additional detailed explanation, it may only be rated 2 points or lower in the rating sub-indicators of RKS. However, when another company reports the same indicator and explains it in detail, even if its value is much less than that of the former firm, it will still get a high score of 4 points from RKS. Conversely, the HX rating rules will compare the amount of charitable donations and do not consider which company explained more. Companies with a high value on charitable donation will receive higher scores for the corresponding sub-indicators. Therefore, RKS scores are more suitable for measuring the quality of the information disclosure in CSR reports.
Second, HX scores have greater coverage, including all listed companies in the SSE and SZSE. The HX rating method is mainly based on the numerical calculation of specific CSR indicators, which can provide horizontal comparisons between firms with specific indicators. Thus, HX scores are more suitable for measuring CSR performance instead of CSR reporting quality. However, the scope of the sub-indicators of the HX rating is relatively small and the proportion of the shareholder equity responsibility sub-indicators is too high. As a result, some of the sub-indicators identified at the beginning of the design may be invalidated by changes in the CSR information disclosure system of the rated firms. In addition, the design included too few level-3 indicators; as a result, the HX ratings may be flawed in their ability to measure the validity of the concept of each CSR dimension.
3. Data, Variable Definitions, and Descriptive Statistics
In terms of data sources, the rating data used in our analysis were obtained from the RKS rating database and the HX rating database. Since the earliest available year for the HX data is 2010, we set the sample period from 2010 to 2017. The number of observations for RKS and HX was 4675 and 21,622, respectively.
Table 2 reports the variable definitions of the total indicators and level-1 sub-indicators for RKS and HX.
Table 3 reports the definitions and observations as well as the mean, standard deviation, minimum, quartile, and maximum values for the total indicators and level-1 sub-indicators of the RKS and HX ratings.
Here, the second row presents the descriptive statistics of the total indicators of RKS. The theoretical upper limit of the indicators is 100, the actual maximum value is 89.3, and the mean and median values are 40.68 and 37.71, respectively. The 75% quantile is 47.03, indicating that more than 75% of companies fail to score more than half. The third row presents a descriptive statistic for the HX total indicator. The theoretical upper limit is also 100 points, and the actual maximum value is 90.87. However, the mean and median values of the HX total indicators are only 25.45 and 21.64, respectively, and the 75% quantile is 27.35, indicating that the HX total indicator scores are lower than that of RKS. This result may be related to the large number of rated companies that do not issue CSR reports in the HX sample. Most of these companies score a non-zero value only on the shareholder equity sub-indicator HXSH. The fourth to seventh rows present descriptive statistics for the four level-1 sub-indicators of the RKS scoring system: Macrocosm sub-indicator RKSM, content sub-indicator RKSC, technical sub-indicator RKST, and industry sub-indicator RKSI. Compared with theoretical weights of 30, 45, 15, and 10%, the contributions of the macrocosm dimension sub-indicator RKSM and the content dimension sub-indicator RKSC scores are consistent with the theoretical design; whereas the contributions of the technical sub-indicator RKST and the industry sub-indicator RKSI are lower than the levels of the theoretical design. The remaining rows present the descriptive statistics of the five level-1 sub-indicators of the HX ratings: The shareholder equity dimension sub-indicator HXSH, the employee dimension sub-indicator HXST, the consumer rights dimension sub-indicator HXC, the environmental responsibility dimension sub-indicator HXE, and the social contribution dimension sub-indicator HXSR. Among them, sub-indicators HXC and HXE have a 75% quantile of 0, indicating that a large number of sample companies do not disclose information pertaining to the employee and environmental indicators, and this situation is particularly serious after 2015. This result may be related to the adoption of a new environmental code in 2014, which caused firms to issue additional environmental information disclosures that are no longer relevant in the annual report and CSR report. The mean values of the five level-1 sub-indicators, i.e., HXSH, HXST, HXC, HXE, and HXSR, were 14.25, 2.703, 1.809, 1.831, and 5.25, respectively; the percentages of these values in relation to the total score were 56, 10.32, 7.11, 7.19, and 20.63%, respectively, which are quite different from the theoretical weights. Specifically, the weight of the shareholder equity sub-indicator HXSH was too large and the weights of the consumer rights and environmental dimension sub-indicators HXC and HXE were too small.
4. Quantitative Analysis Results
In this section, this analysis mainly consists of two parts. First, the Spearman correlation analysis results of the RKS and HX scores, which are used to evaluate the degree of coverage between them. The Spearman correlation coefficient is calculated based on the nonparametric (distribution-free) rank, which is less affected by the data distribution and extreme values. Therefore, it is more robust than the Pearson correlation coefficient. Hauke and Kossowski [
51] provide detailed explanations and a comparison of the Spearman correlation and the Pearson correlation. Chatterji [
52] also use the Spearman correlation method to analyze the convergence validity of the CSR ratings in the European and U.S. capital markets. Therefore, this paper uses the Spearman correlation coefficient as a reference for the degree of aggregation between the two indexing indicator systems. Second, the annual analysis of the weights of the RKS and HX sub-indicators, which are used to evaluate the rationality and stability of the weighting design of the sub-indicator systems.
4.1. Spearman Analysis Results
Table 4 reports the Spearman correlation matrix between the total and level-1 sub-indicators of RKS and HX. In column two, row three, the correlation coefficient between the RKS and HX total indicators is 0.0254, which indicates that the difference between the two rating systems is extremely large and that the convergent validity is very low; thus, there is only a weak positive correlation. In column two, rows from two to seven, the RKS total indicator is highly consistent with the RKS level-1 indicators RKSM, RKSC, RKST, and RKSI, with coefficients between 0.6430 and 0.9118. The remaining rows in column two show that the correlations between the RKS total indicator and the HX sub-indicators are still relatively low. Although, the correlations between the shareholder equity sub-indicator HXSH and the social contribution sub-indicator HXSR are positive, and the coefficient values are very small at only 0.1486 and 0.0917, respectively. The coefficients of the sub-indicators in the employee, consumer rights, and environmental dimensions are negative, i.e., −0.0375, −0.0604, and −0.1196, respectively. These correlation coefficients indicate that the low-aggregation validity of the RKS and HX rating systems does not exist only in terms of the total indicators, because there are also significant differences in the design of the sub-indicators that originate from the dimensions of the grassroots. In column three, rows four to seven, the correlation between the HX total indicator and the RKS sub-indicator is also very low. Except for the correlation with the content indicator RKSC, which is maintained at a level above 0.1, the correlations with the other variables are all less than 0.1 and the correlations with the macrocosm indicator RKSM and the technical indicator RKST are even negative, i.e., −0.0201 and −0.1462, respectively. The remaining rows in column four present the correlations between the total HX sub-indicator and each HX level-1 sub-indicator; the correlation coefficient of the shareholder equity sub-indicator HXSH is higher, above 0.7, and the correlations of the other sub-indicators are between 0.5 and 0.6. The above analysis supports the findings of our previous comparison analysis. In the indicator design, an enormous difference is observed between the RKS rating and the HX rating, which leads to a very low level of convergent validity.
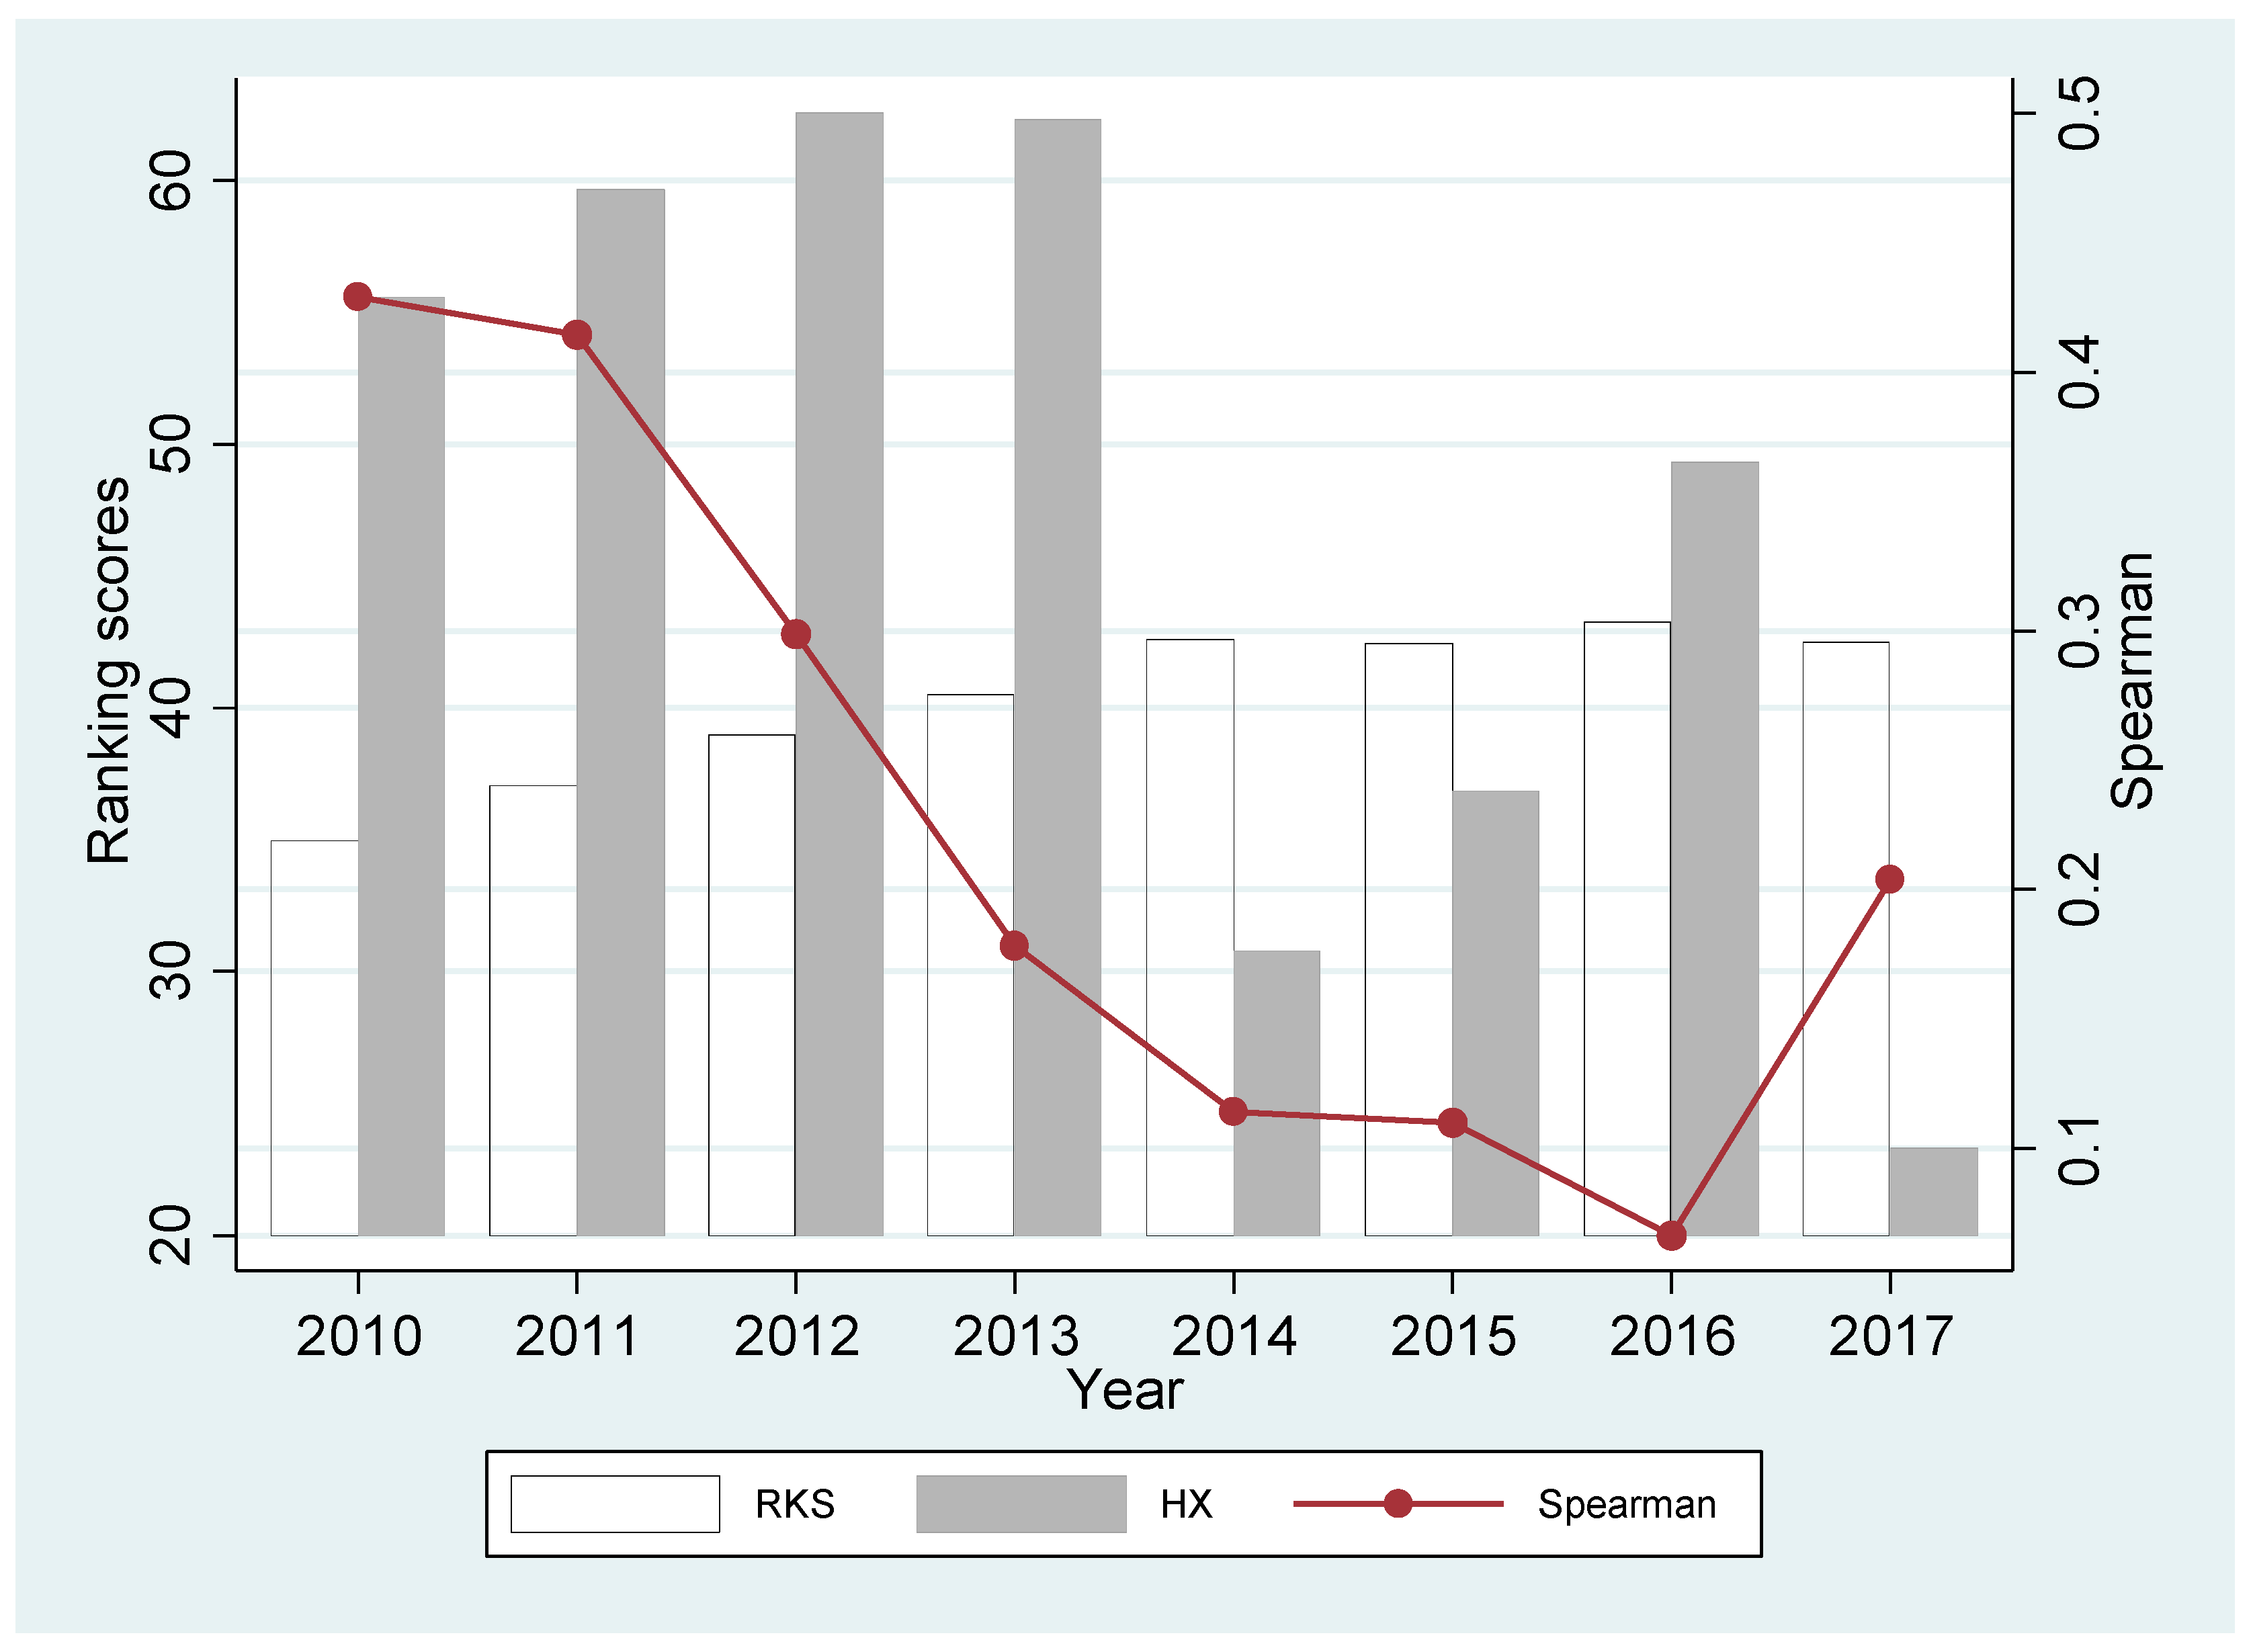
Table 5 reports the annual mean value and Spearman correlation results of the RKS and HX total indicators in 2010 to 2017. First, the RKS score showed an upward trend year-by-year, indicating that the overall quality of CSR reports in China showed an upward trend year-by-year, which was consistent with the previous research conclusions [
53]. Despite the lack of verification and guidance systems, the CSR report level of Chinese firms still improved significantly; however, the annual trend of the HX scores was more confusing. Before 2013, the HX scores showed an increasing trend year-by-year, whereas in 2014, a steep decline occurred, with the mean value dropping from 62.32 to 30.77, which represented a decline of more than 50%. From 2015 to 2016, this value gradually increased to 49.31 but plummeted to 23.31 in 2017. As shown in
Table 5 and
Figure 2, the annual Spearman correlation analysis results of the two systems indicated that between 2010 and 2012, the Spearman correlation coefficient remained approximately 0.4; however, it then decreased year-by-year, dropping to within 0.07 in 2016, and the significance test level also decreased, with the
p-value increasing to 0.0605. Although it recovered in 2017, the Spearman correlation coefficient was still only 0.2040, which was far from 0.4. Therefore, in general, the difference between the two systems gradually expanded and the convergent validity worsened.
4.2. Sub-Indicator Weight Analysis Results
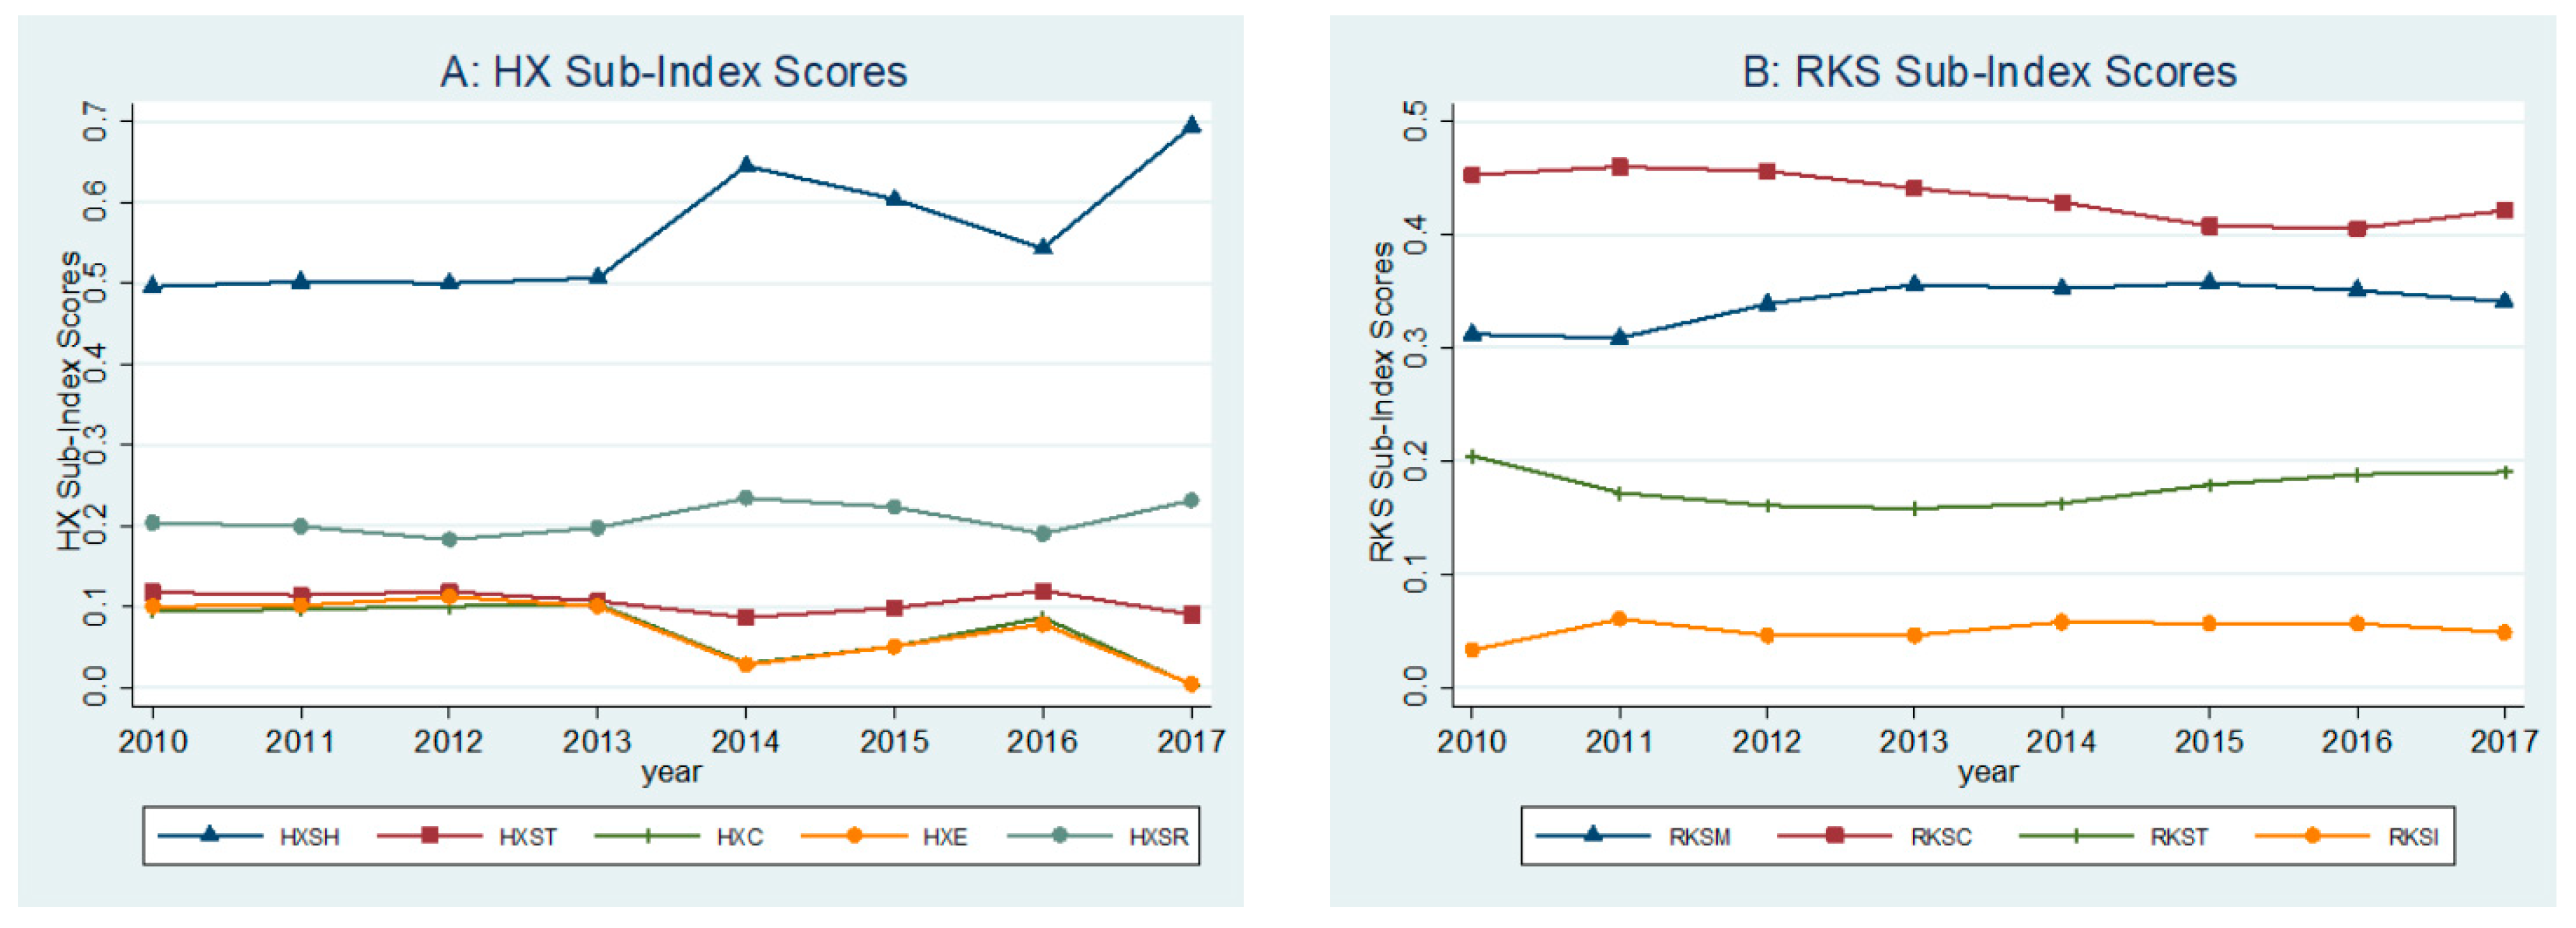
To further investigate the differences in the scoring system between RKS and HX, panel A of
Table 6 reports the mean value and actual weight of the HX level-1 sub-indicators year-by-year, while panel B reports the same statistics of the RKS level-1 sub-indicators year-by-year. This analysis is based on a sample of all firms that receive RKS and HX ratings. We also tried to use the common coverage sample of each rating, and the analysis results are similar. Based on panel A, we found that before 2013, the deviation between the proportional weight and the theoretical weight of each sub-indicator of HX is still small. For example, the sub-indicator HXSH of the shareholder equity dimension is maintained at approximately 0.5 and the theoretical weight is 0.3; however, in 2015, the weights of sub-indicators at various levels fluctuate greatly. For example, the sub-indicator HXSH reaches 0.69 in 2017, which is more than 2.3 times the theoretical weight. The theoretical weight refers to the ratio of the upper limit of the sub-indicator dimension to the upper limit of the total indicator dimension in the design of the rating indicator. For example, the upper limit of the sub-indicator HXSH is 30 and the upper limit of the HX total indicator is 100. Therefore, the theoretical weight is equal to 30 divided by 100, namely, 30%. The proportional weight refers to the ratio of the mean value of the actual neutron index dimension to the mean of the total indicator dimension, e.g., the average value of the sub-indicator HXSH in 2010 is 13.49 and the average value of the HX total indicator in 2010 is 27.22. Therefore, the theoretical weight is equal to 13.49 divided by 27.22, which is 49.56%. The actual weight fluctuation of such sub-indicators is very abnormal, which shows that after 2014, the design of the HX rating system has become unreasonable due to possible systematic changes in the CSR reporting system of Chinese listed companies.
Panel B of
Table 6 reports the analysis results of the RKS rating system. The sub-indicators of RKS maintain actual weight ratios that are similar to the theoretical weight. The mean value of each sub-indicator is similar to the average of the total indicators and basically maintains the overall upward trend. Parts A and B of
Figure 3 more intuitively describe the year-on-year trend of the HX and RKS weights. The fluctuations of the HX sub-indicator weights are more severe, and the fluctuations of the RKS sub-indicator weights are more stable. In summary, we believe that after 2014, the rationality of the design of the HX rating system began to become problematic. This phenomenon reached its peak in 2017. The total score of the HX rating is highly dependent on the HXSH score, which represents corporate economic performance, with a weight that reaches 69%. This dependence can cause considerable problems with measurement validity. For example, if a firm has a high score on the economic performance dimension sub-indicator, namely, the HXSH score, but low scores for the non-economic performance dimension sub-indicators, then it is still possible to obtain a high HX score. However, a firm with a low HXSH score but large scores for the non-economic performance dimension, which means it may spend more on the CSR input, is more likely to receive a low HX total score. In fact, we found in the pre-analysis that between 2013 and 2017, the Spearman correlation coefficient between a firm’s total return on assets (ROA) and the total score of HX was as high as 0.5729, which was significant at >1%, while the coefficient of the total score of RKS was only −0.0088, which was not significant. This finding leads to the conclusion that after 2013, if HX is used as a proxy variable for the CSR performance, it will be largely polluted by the economic performance of the firm, whereas the RKS index system can still maintain a reasonable score weight.
5. Conclusions
RKS and HX ratings are the two most widely used CSR ratings in China’s capital market, and their effectiveness in measuring CSR-related concepts, including CSR performance and CSR disclosure quality, has not received adequate attention. To fill this gap, this paper compares the system characteristics and conducts a Spearman correlation analysis based on the 2010–2017 period. We find that the RKS and HX rating systems have significant differences in terms of information sources, indicator design, and scoring methods. As a result, there are serious validity problems in the measurement of CSR-related concepts. For example, the Spearman correlation coefficient between the RKS and HX total scores is very small at only 0.0254. Furthermore, this paper compares the year-on-year changes in the means and weights of the HX sub-indicator system and the RKS sub-indicator system and finds that in 2013 and subsequent years, the weights in the HX sub-indicator system show abnormal fluctuations, which may be related to the systematic changes in the CSR reporting system for China’s companies.
Based on the above analysis results, we draw the following inferences. (1) Based on the information sources, indicator design, and evaluation methods used for rating, RKS scores are more suitable for measuring CSR information disclosure quality. If RKS scores are used to measure the CSR performance, then there will be a potential difference between a company that has a high CSR reporting quality and a company with a high CSR performance, which will be significantly different from actual conditions. For example, due to the problem of green-washing caused by information asymmetry, companies with a lower CSR performance can still disguise themselves as high-performance companies by providing high-quality CSR disclosures. (2) HX scores are more suitable for measuring CSR performance. However, due to the defects related to design problems in the HX sub-indicator system and the systematic changes in China’s CSR information reporting system, after 2013, HX scores have become increasingly dependent on corporate economic performance, and the rationality of the indicator system has been affected. (3) RKS scores better maintain a relatively stable weight in each year. As shown in part B of
Figure 3, the difference between the actual weight and the theoretical weight is not obvious. The sub-dimension index weight of the HX score fluctuated drastically after 2013. These observations indicate that the sub-indicators selected by the HX scoring index system may not be suitable for the changes of China’s new CSR information and other related information disclosure systems.
The main limitations of the research are as follows. (1) Due to the disclosures of the scoring processes restricted by the RKS and HX ratings, we cannot specifically know that the two are in the lower-level design and calculation process of rating indicators; therefore, we cannot further compare the characteristics of the underlying indicator design. Specifically, for RKS, it fails to disclose the ratings of the level-2 and level-3 sub-indicators and allows some dimensions to be compared with some indexes of HX, e.g., RKS content dimension level-1 sub-indicator RKSC contains level-2 sub-indicators “C1 Economic performance”, “C2 Labour and human rights”, “C3 Environment”, “C5 Consumers”, etc., which can be highly correlated with HX level-1 sub-indicators HXSH, HXST, HXE, HXC, etc., respectively. Unfortunately, RKS did not disclose the scores of these sub-indicators, which prevented us from further opening the research black box. For HX, although it discloses the values of all rating sub-indicators, it does not disclose the formula for calculating the three-level indicators to the second-level indicators and a more specific process, which also limits our in-depth exploration. (2) Due to space limitations, we were unable to evaluate the impact of the robustness and validity of the empirical research findings on CSR performance and CSR disclosure quality issues in China’s capital markets using these two ratings. Specifically, if a study uses RKS as a proxy variable for the CSR performance and finds that firms with a high CSR performance can achieve lower financing costs, then does this conclusion still stand when using HX as a proxy? Or does it actually reach the empirical conclusion that firms with a high CSR disclosure quality get lower financing costs? In addition, we also attempted to conduct a correlation analysis on the two scores and some major firm characteristic variables, such as asset size, financial leverage, political connection, financial performance, etc., in a pre-analysis. Due to space limitations, we did not report the results in the text. A large difference was observed in the correlation coefficient between the two scores. Therefore, these pre-analysis results mean that the validity and robustness of the empirical research findings observed in previous studies deserve further investigation.
The future direction of this research mainly includes the following: (1) The low degree of convergence between the RKS and HX scores may imply the divergence between CSR performance and CSR disclosure levels. That is, some companies with poor CSR performance may also choose high-quality CSR disclosures, which may be related to “CSR-washing” behavior and warrant further exploration. (2) According to our analysis conclusions, the two main CSR scores in China, RKS and HX, are not suitable for use as proxy variables for CSR performance. The question of how to more reasonably measure the CSR performance of China’s companies warrants further in-depth discussion. (3) In recent years, China’s CSR information disclosure system has been further developed. For example, the implementation of a new environmental law in 2015 and new corporate governance guidelines in 2019 may strengthen the disclosure quality of environmental and CSR information. These institutional changes may further affect the effectiveness of the RKS and HX evaluation systems, and the validity of the two issues needs further tracking in the future.


