Monitoring Spatial Changes in Manufacturing Firms in Seoul Metropolitan Area Using Firm Life Cycle and Locational Factors
Abstract
1. Introduction
2. Literature Review
3. Research Design and Data
3.1. Research Design
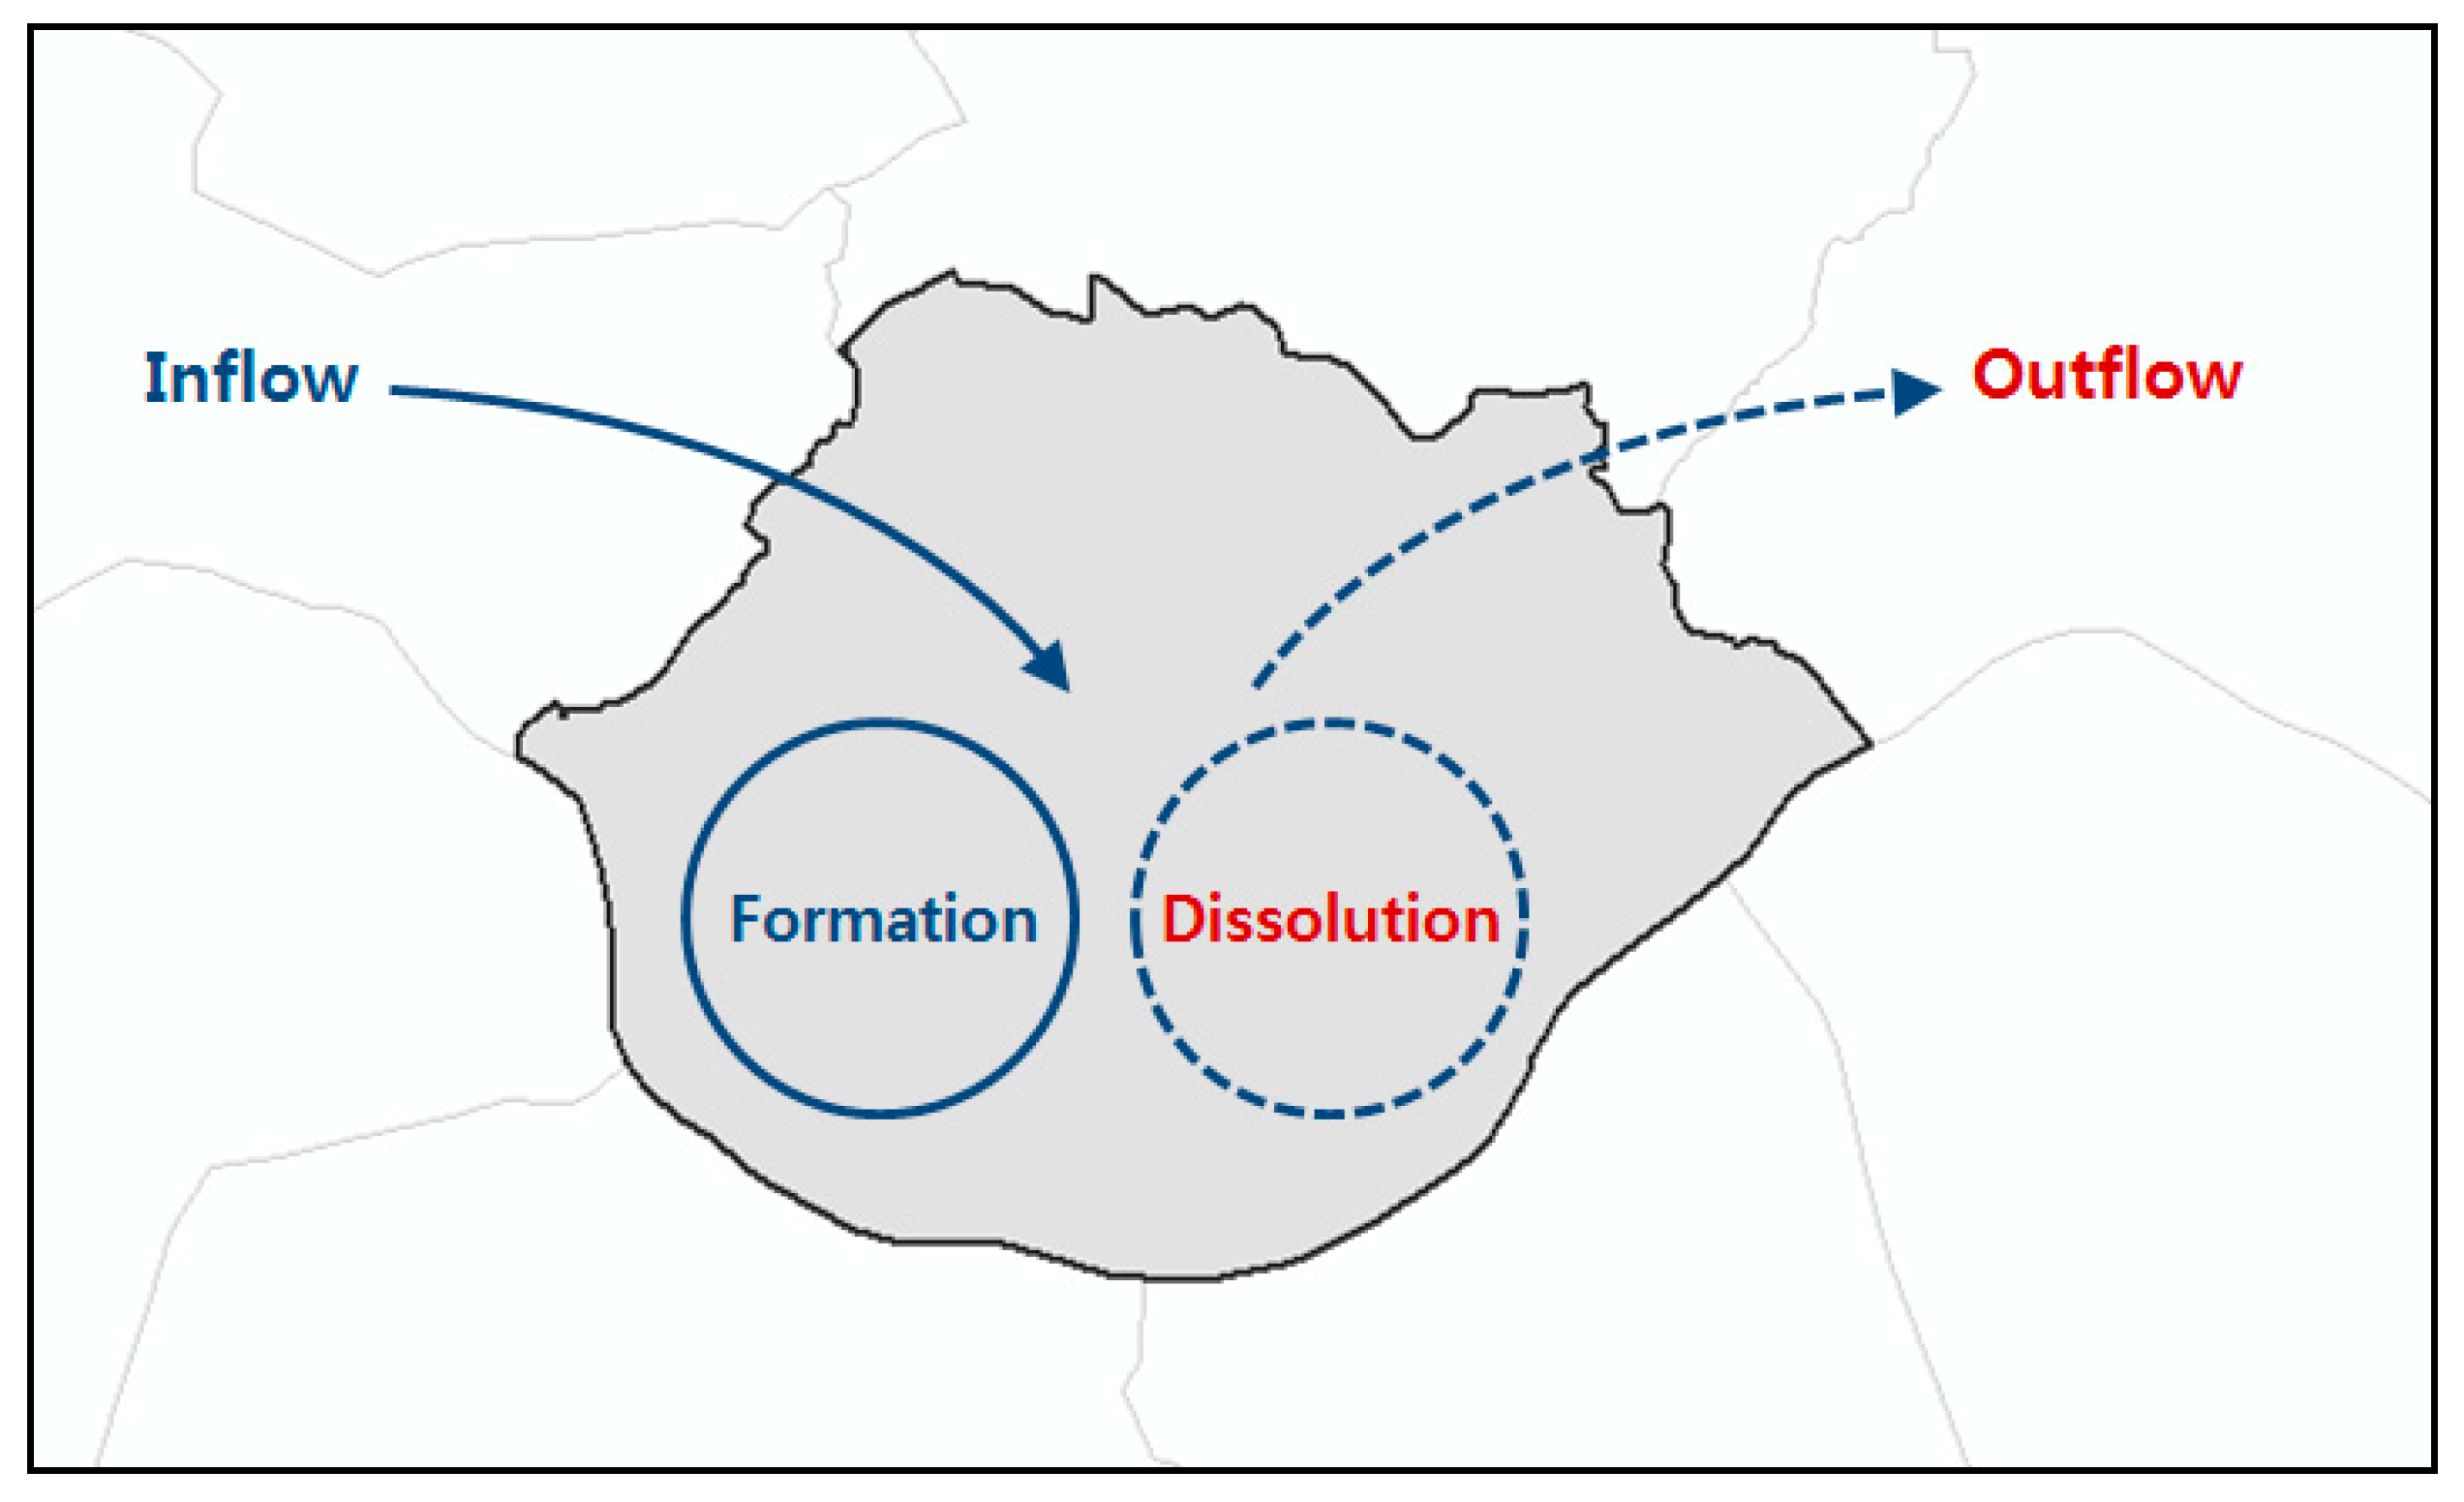
3.1.1. Life-Cycle Perspective
- ;
- ;
- ;
- ;
- .
3.1.2. Regression Analysis with Spatial Autocorrelation
- : Dependent variable in city (number of new/closure/inflow/outflow firms);
- : Independent variables (firm location factor);
- : Constant : Parameters : Errors.
3.2. Data
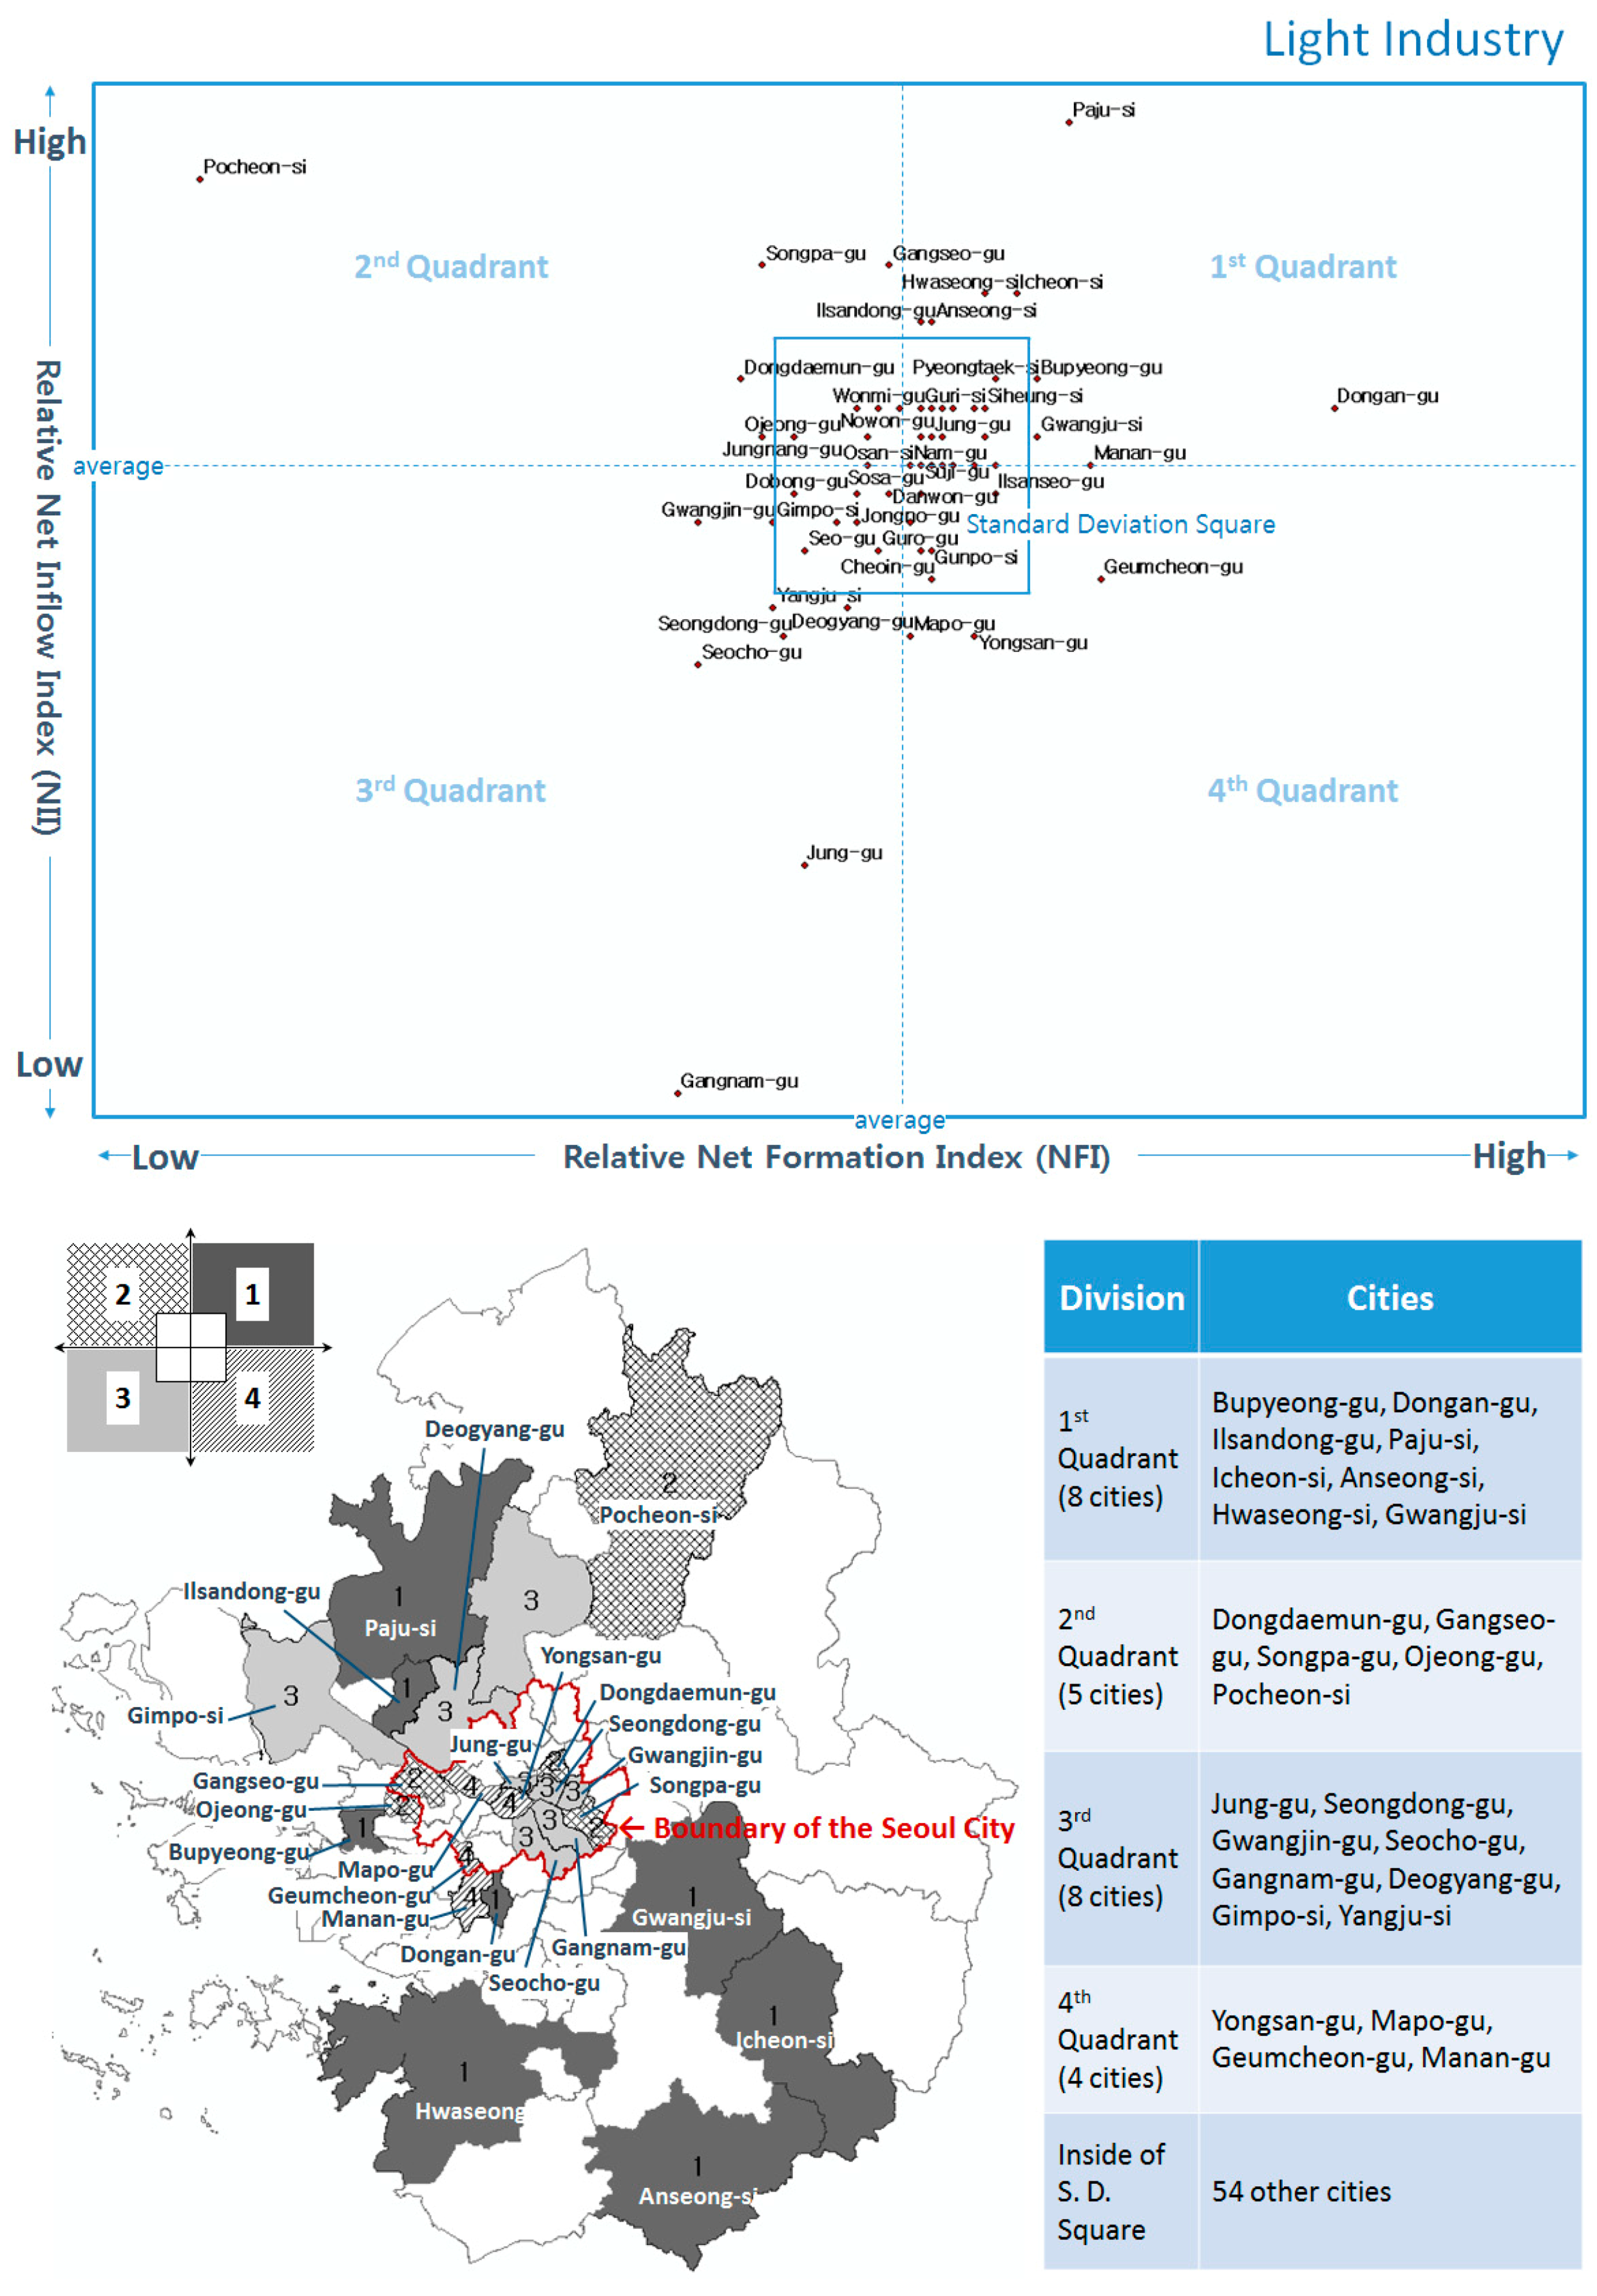
4. Portfolio Analysis
5. Regression Analysis
5.1. Setting Independent Variables
5.2. Fit a Baseline OLS Model without Considering Spatial Autocorrelation
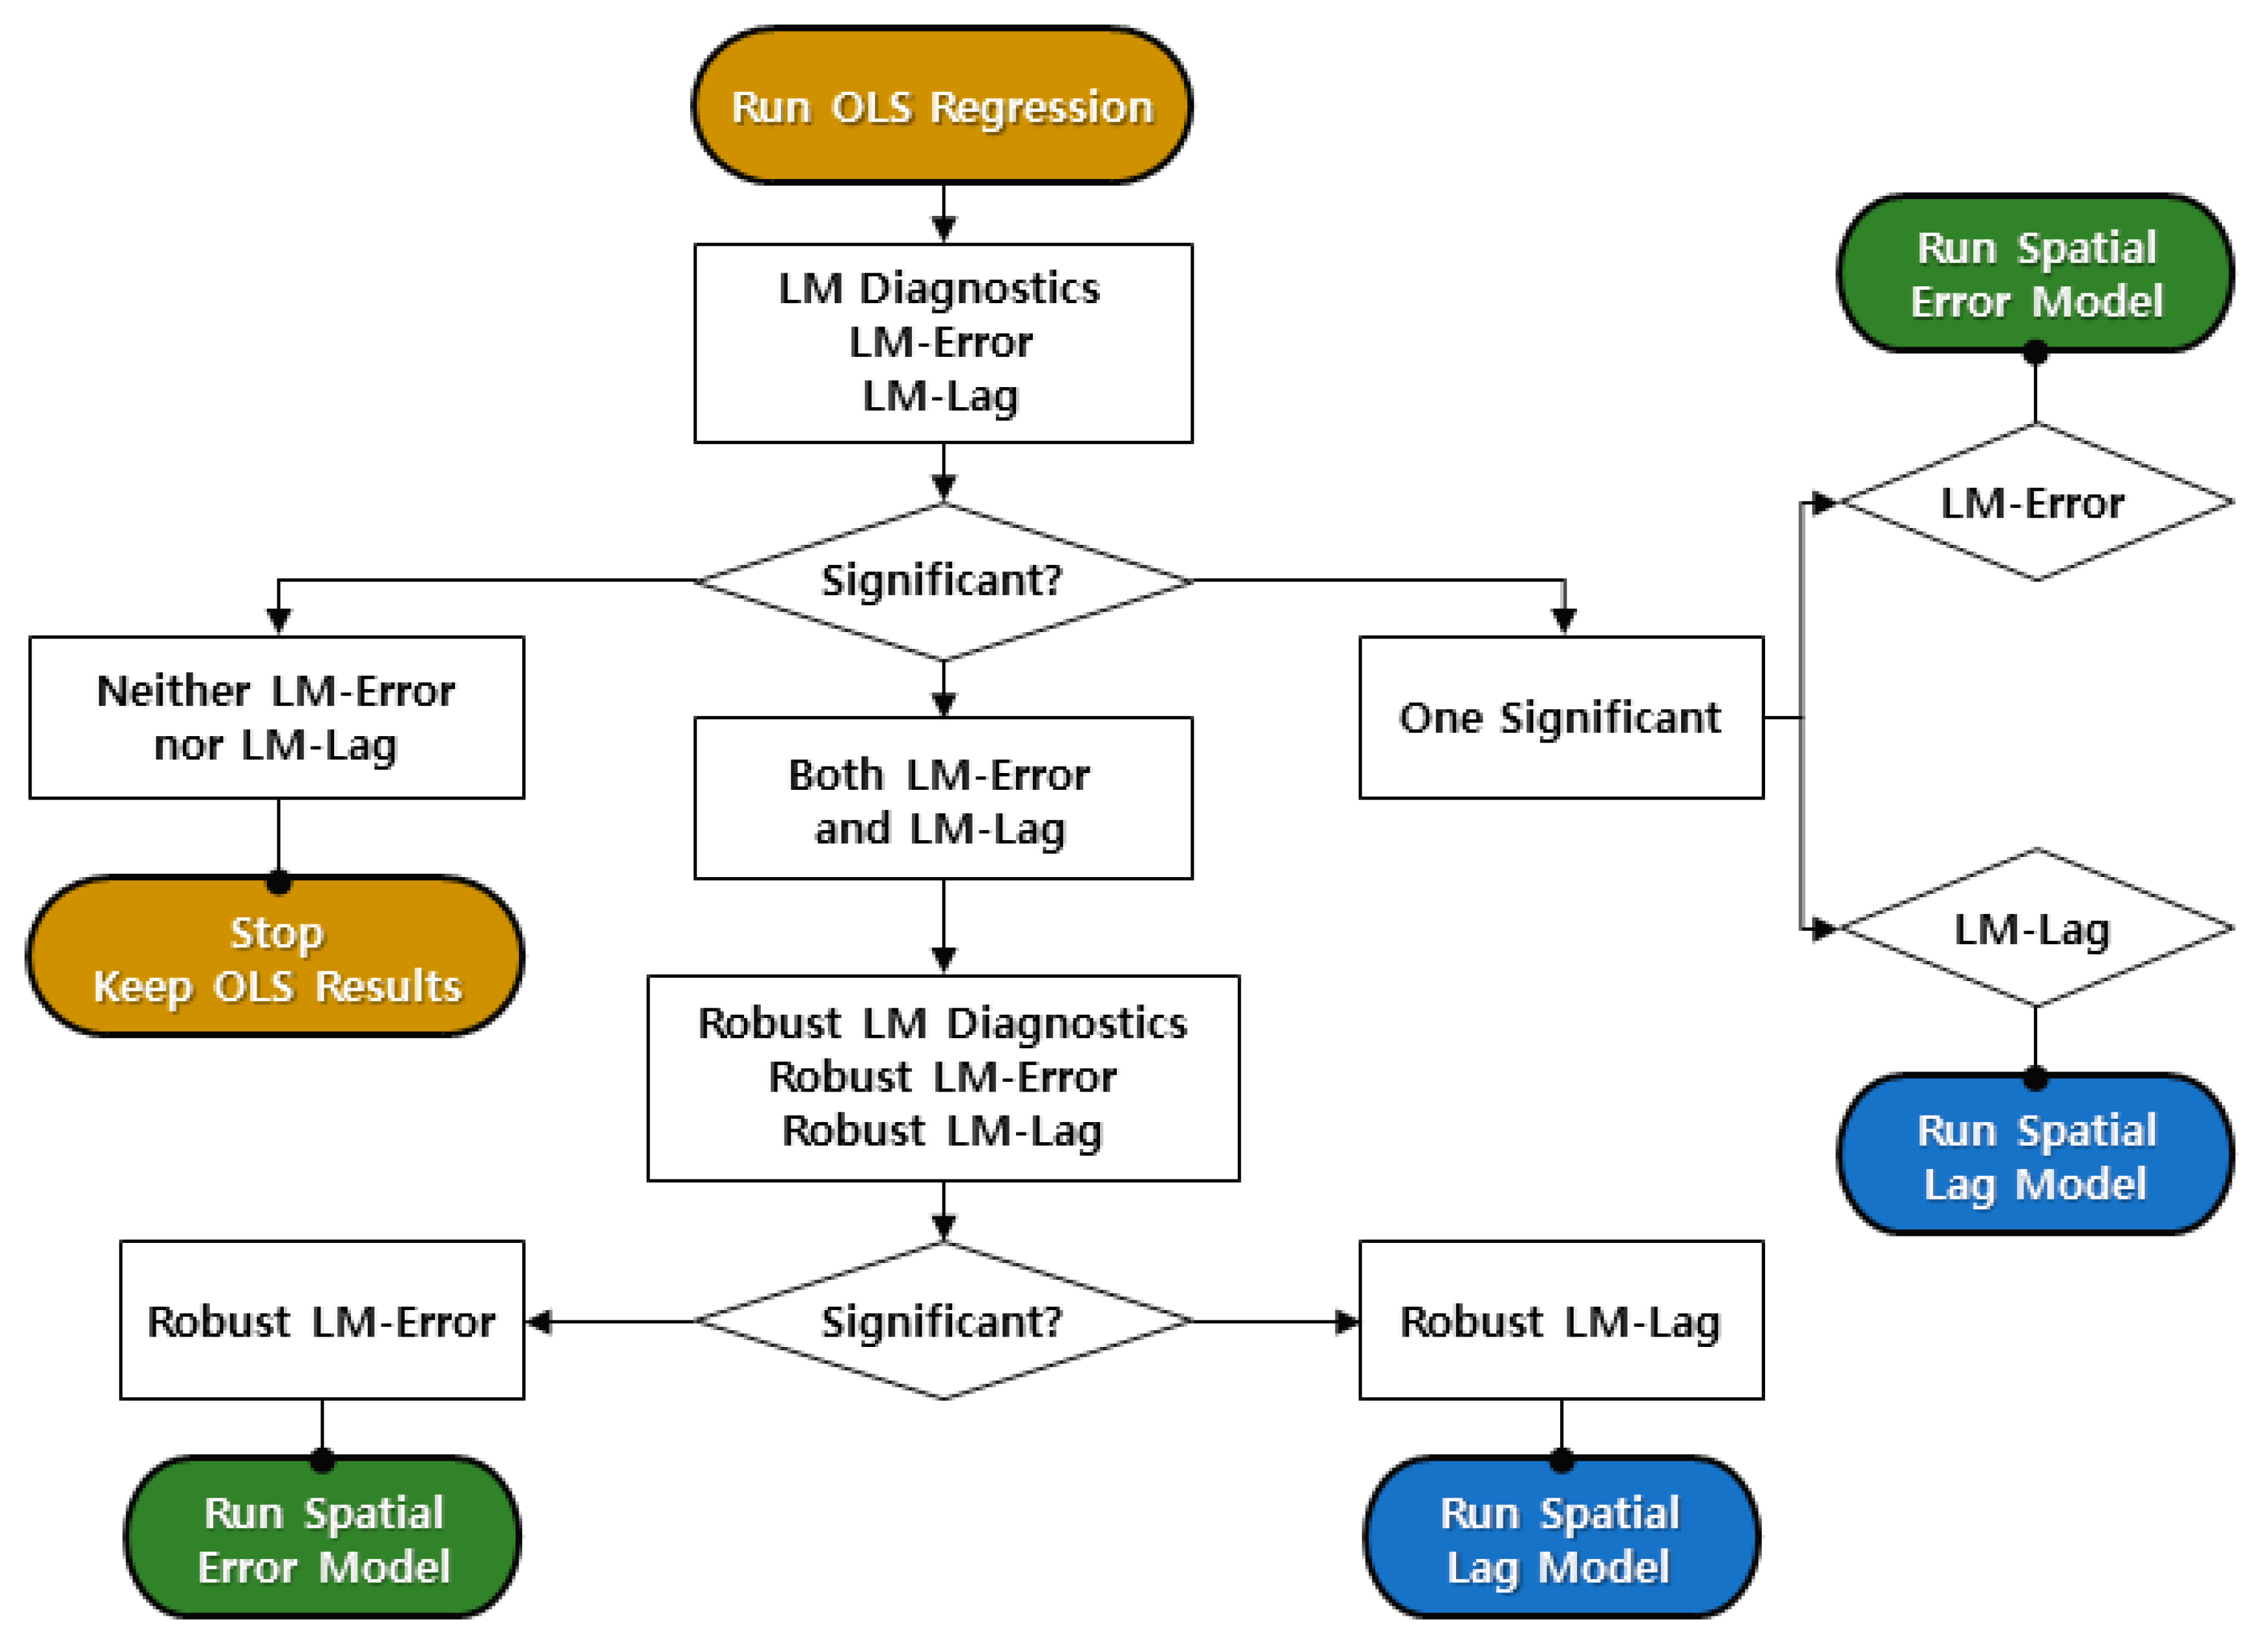
5.3. Diagnostics for Spatial Dependence
5.4. Results of Regression Analysis
5.4.1. Light Industry
5.4.2. Heavy Industry
5.4.3. High-Tech Industry
6. Conclusions
Author Contributions
Funding
Acknowledgments
Conflicts of Interest
References
- Wegener, M. Operational urban models: State of the art. J. Am. Plan. Assoc. 1994, 60, 17–29. [Google Scholar] [CrossRef]
- Hyter, R. The Dynamics of Industrial Location: The Factory, the Firm and Production System; Department of Geography, Simon Fraser University: Burnaby, BC, Canada, 2004. [Google Scholar]
- Korean Statistical Information Service. 2016. Available online: http://kosis.kr/ (accessed on 5 February 2018).
- Lee, S.; An, Y.; Kim, K. Relationship between transit modal split and intra-city trip ratio by car for compact city planning of municipalities in the Seoul Metropolitan Area. Cities 2017, 70, 11–21. [Google Scholar] [CrossRef]
- Arauzo-Carod, J.; Liviano-Solis, D.; Manjón-Antolín, M. Empirical studies in industrial location: An assessment of their methods and results. J. Reg. Sci. 2010, 50, 685–711. [Google Scholar] [CrossRef]
- Artz, G.M.; Kim, Y.; Orazem, P.F. Does Agglomeration Matter Everywhere? New firm location decisions in rural and urban markets. J. Reg. Sci. 2016, 56, 72–95. [Google Scholar] [CrossRef]
- Sivakumar, A.; Bhat, C. Comprehensive, unified framework for analyzing spatial location choice. Transp. Res. Rec. 2007, 2003, 103–111. [Google Scholar] [CrossRef]
- Li, C.; Song, Y.; Chen, Y. Infrastructure Development and Urbanization in China. In China’s Urbanization and Socioeconomic Impact; Springer: Singapore, 2017; pp. 91–107. [Google Scholar]
- De Bok, M. Using firmographic microsimulation for land use and transport scenario valuation: Model calibration. In Proceedings of the 45th ERSA Congress, Amsterdam, The Netherlands, 23–27 August 2005; pp. 1–26. [Google Scholar]
- Alanón, A.; Arauzo, J.M.; Myro, R. Accessibility, agglomeration and location. Entrep. Ind. Locat. Econ. Growth 2007, 247–267. [Google Scholar]
- Arauzo-Carod, J.-M.; Viladecans, E. Industrial location at the intra-metropolitan level: The role of agglomeration economies. Reg. Stud. 2009, 43, 545–558. [Google Scholar] [CrossRef]
- Bhat, C.R.; Paleti, R.; Singh, P. A Spatial multivariate count model for firm location decisions. J. Reg. Sci. 2014, 54, 462–502. [Google Scholar] [CrossRef]
- Buczkowska, S.; de Lapparent, M. Location choices of newly created establishments: Spatial patterns at the aggregate level. Reg. Sci. Urban Econ. 2014, 48, 68–81. [Google Scholar] [CrossRef]
- Pellenbarg, P.H.; van Wissen, L.J.G.; van Dijk, J. Firm Relocation: State of the Art and Research Prospects; University of Groningen: Groningen, The Netherlands, 2002. [Google Scholar]
- Lee, B. A study on the determinants of manufacturing productivity. Korea Econ. Rev. 2000, 48, 291–322. [Google Scholar]
- Keeble, D.; Wever, E. New Firms and Regional Development in Europe; Taylor & Francis: Milton Park, UK, 1986. [Google Scholar]
- Papke, L.E. Interstate business tax differentials and new firm location: Evidence from panel data. J. Public Econ. 1991, 45, 47–68. [Google Scholar] [CrossRef]
- Wang, F.; Chen, C.; Xiu, C.; Zhang, P. Location analysis of retail stores in Changchun, China: A street centrality perspective. Cities 2014, 41, 54–63. [Google Scholar] [CrossRef]
- Fahmi, F.Z.; Koster, S.; van Dijk, J. The location of creative industries in a developing country: The case of Indonesia. Cities 2016, 59, 66–79. [Google Scholar] [CrossRef]
- Musil, R.; Eder, J. Towards a location sensitive R&D policy. Local buzz, spatial concentration and specialisation as a challenge for urban planning—Empirical findings from the life sciences and ICT clusters in Vienna. Cities 2016, 59, 20–29. [Google Scholar] [CrossRef]
- Moeckel, R. Microsimulation of firm location decisions. In Proceedings of the 9th International Conference on Computers in Urban Planning and Urban Management, London, UK, 7 June 2005; pp. 2005–2029. [Google Scholar]
- Van Wissen, L. A micro-simulation model of firms: Applications of concepts of the demography of the firm. Pap. Reg. Sci. 2000, 79, 111–134. [Google Scholar] [CrossRef]
- Van Wissen, L. Demography of the firm: A useful metaphor? Eur. J. Pop. 2002, 18, 263–279. [Google Scholar] [CrossRef]
- An, Y.; Kang, Y.; Lee, S. A study on the impact of soft location factors in the relocation of service and manufacturing firms. Int. J. Urban Sci. 2014, 18, 327–339. [Google Scholar] [CrossRef]
- Van Wissen, L. The Concept of Carrying Capacity in the Demography of Firms. In Population and Families in the Low Countries; van den Brekel, H., Deven, F., Eds.; Kluwer Academic Publishers: Dordrecht, The Netherlands, 1997; pp. 219–244. [Google Scholar]
- Van Dijk, J.; Pellenbarg, P.H. Firm relocation decisions in The Netherlands: An ordered logit approach. Pap. Reg. Sci. 2000, 79, 191–219. [Google Scholar] [CrossRef]
- Chin, A.; Hong, J. The Location Decisions of Foreign Logistics Firms in China: Does Transport Network Capacity Matter? East Asian Bureau of Economic Research: Canberra, Australia, 2005. [Google Scholar]
- Koenig, W.D.; Knops, J.M.H. Testing for spatial autocorrelation in ecological studies. Ecography 1998, 21, 423–429. [Google Scholar] [CrossRef]
- Koenig, W.D. Spatial autocorrelation of ecological phenomena. Trends Ecol. Evol. 1999, 14, 22–26. [Google Scholar] [CrossRef]
- Anselin, L. Local indicators of spatial association—LISA. Geogr. Anal. 1995, 27, 93–115. [Google Scholar] [CrossRef]
- Smith, T.E. Notebook on Spatial Data Analysis. 2016. Available online: http://www.seas.upenn.edu/~ese502/#notebook (accessed on 25 February 2018).
- Michael, D.W.; Kristian, S.G. Spatial Regression Models; SAGE Publications, Inc.: Thousand Oaks, CA, USA, 2008. [Google Scholar]
- Woodward, D.P. Locational determinants of Japanese manufacturing start-ups in the United States. South. Econ. J. 1992, 58, 690–708. [Google Scholar] [CrossRef]
- Cheng, L.K.; Kwan, Y.K. What are the determinants of the location of foreign direct investment? The Chinese experience. J. Int. Econ. 2000, 51, 379–400. [Google Scholar] [CrossRef]
- Lee, H.; Lee, B. An analysis of firm relocation in the manufacturing industries. J. Korea Plan. Assoc. 2002, 37, 103–116. [Google Scholar]
- Korea Chamber Commerce and Industry (KCCI). Available online: http://www.korcham.net/ (accessed on 5 February 2018).
- The National Law Information Center, the Korea Representative Legal Information Web Site. Available online: http://www.law.go.kr/ (accessed on 5 February 2018).
- Hurlbert, S.H. Pseudoreplication and the design of ecological field experiments. Ecol. Monogr. 1984, 54, 187–211. [Google Scholar] [CrossRef]
- Stephen, A.M. GeoDa and Spatial Regression Modelling; Population Research Institute: Front Royal, VA, USA, 2006. [Google Scholar]
- Yi, C. An Analysis on the Determinants of the Agglomeration by Industrial Type in Seoul Metropolitan Region with Spatial Econometrics. Gyeonggi Res. Inst. 2016, 16, 1–33. [Google Scholar]
- An, Y.; Wan, L. Modelling industrial firm relocation with impacts of spatial dependence. Int. J. Urban Sci. 2018, 22, 80–103. [Google Scholar] [CrossRef]
- Korea Chamber Commerce and Industry. Business Yearbook. Maeil Business News Korea, 2009 and 2010.
- Anselin, L. Exploring Spatial Data with GeoDaTM: A Workbook; Center for Spatially Integrated Social Science: Santa Barbara, CA, USA, 2005. [Google Scholar]
- Bartik, T.J. Business location decisions in the United States: Estimates of the effects of unionization, taxes, and other characteristics of states. J. Bus. Econ. Stat. 1985, 3, 14–22. [Google Scholar]
- Agarwal, R.; Audretsch, D.B. Does entry size matter? The impact of the life cycle and technology on firm survival. J. Ind. Econ. 2001, 49, 21–43. [Google Scholar] [CrossRef]
- Henderson, V.; Kuncoro, A.; Turner, M. Industrial development in cities. J. Political Econ. 1995, 103, 1067–1090. [Google Scholar] [CrossRef]
- Do, H.; Lee, Y. Empirical study on firm relocation choice in Seoul metropolitan area. Seoul Stud. 2008, 9, 131–144. [Google Scholar]
- Erickson, R.A.; Wasylenko, M. Firm relocation and site selection in suburban municipalities. J. Urban Econ. 1980, 8, 69–85. [Google Scholar] [CrossRef]
- Braun, M.T.; Oswald, F.L. Exploratory regression analysis: A tool for selecting models and determining predictor importance. Behav. Res. Methods 2011, 43, 331–339. [Google Scholar] [CrossRef]
- Choi, U.; Kwon, O.; Lee, E.; Son, D.; Cho, M.; Chung, Y. Evaluating of Sigumajang Aroma by Stepwise Multiple Regression Analysis of Gas Chromatographic Profiles. J. Microbiol. Biotechnol. 2000, 10, 476–481. [Google Scholar]
- Rubalcaba, L.; Michel, S.; Sundbo, J.; Brown, S.W.; Reynoso, J. Shaping, organizing, and rethinking service innovation: A multidimensional framework. J. Serv. Manag. 2012, 23, 696–715. [Google Scholar] [CrossRef]
- Heckman, J.S. Survey of Location Decisions in The South. Econ. Rev. 1982, 6, 6–19. [Google Scholar]
- Oum, T.H.; Park, J.H. Multinational firms’ location preference for regional distribution centers: Focus on the Northeast Asian region. Transp. Res. Part E Logist. Transp. Rev. 2004, 40, 101–121. [Google Scholar] [CrossRef]
- Yan, J. A Study on the Changing Location of Office Space in Seoul Metropolitan Area; Seoul Institute: Seoul, Korea, 2004. [Google Scholar]
- Choi, J.Y.; Oh, K.S. An Analysis of Relocation of SW Industries using GIS Flow Map. J. Korea Spat. Inf. Soc. 2010, 18, 41–52. [Google Scholar]
- Hong, S. Choice of Location Regarding to the Type of Business and the Trait of Regions; Yonsei University: Seoul, Korea, 2006. [Google Scholar]
- Wan, L.; An, Y. Identifying growth patterns of the high-tech manufacturing industry across the Seoul metropolitan area using latent class analysis. J. Urban Plan. Dev. 2017, 143, 04017011. [Google Scholar] [CrossRef]
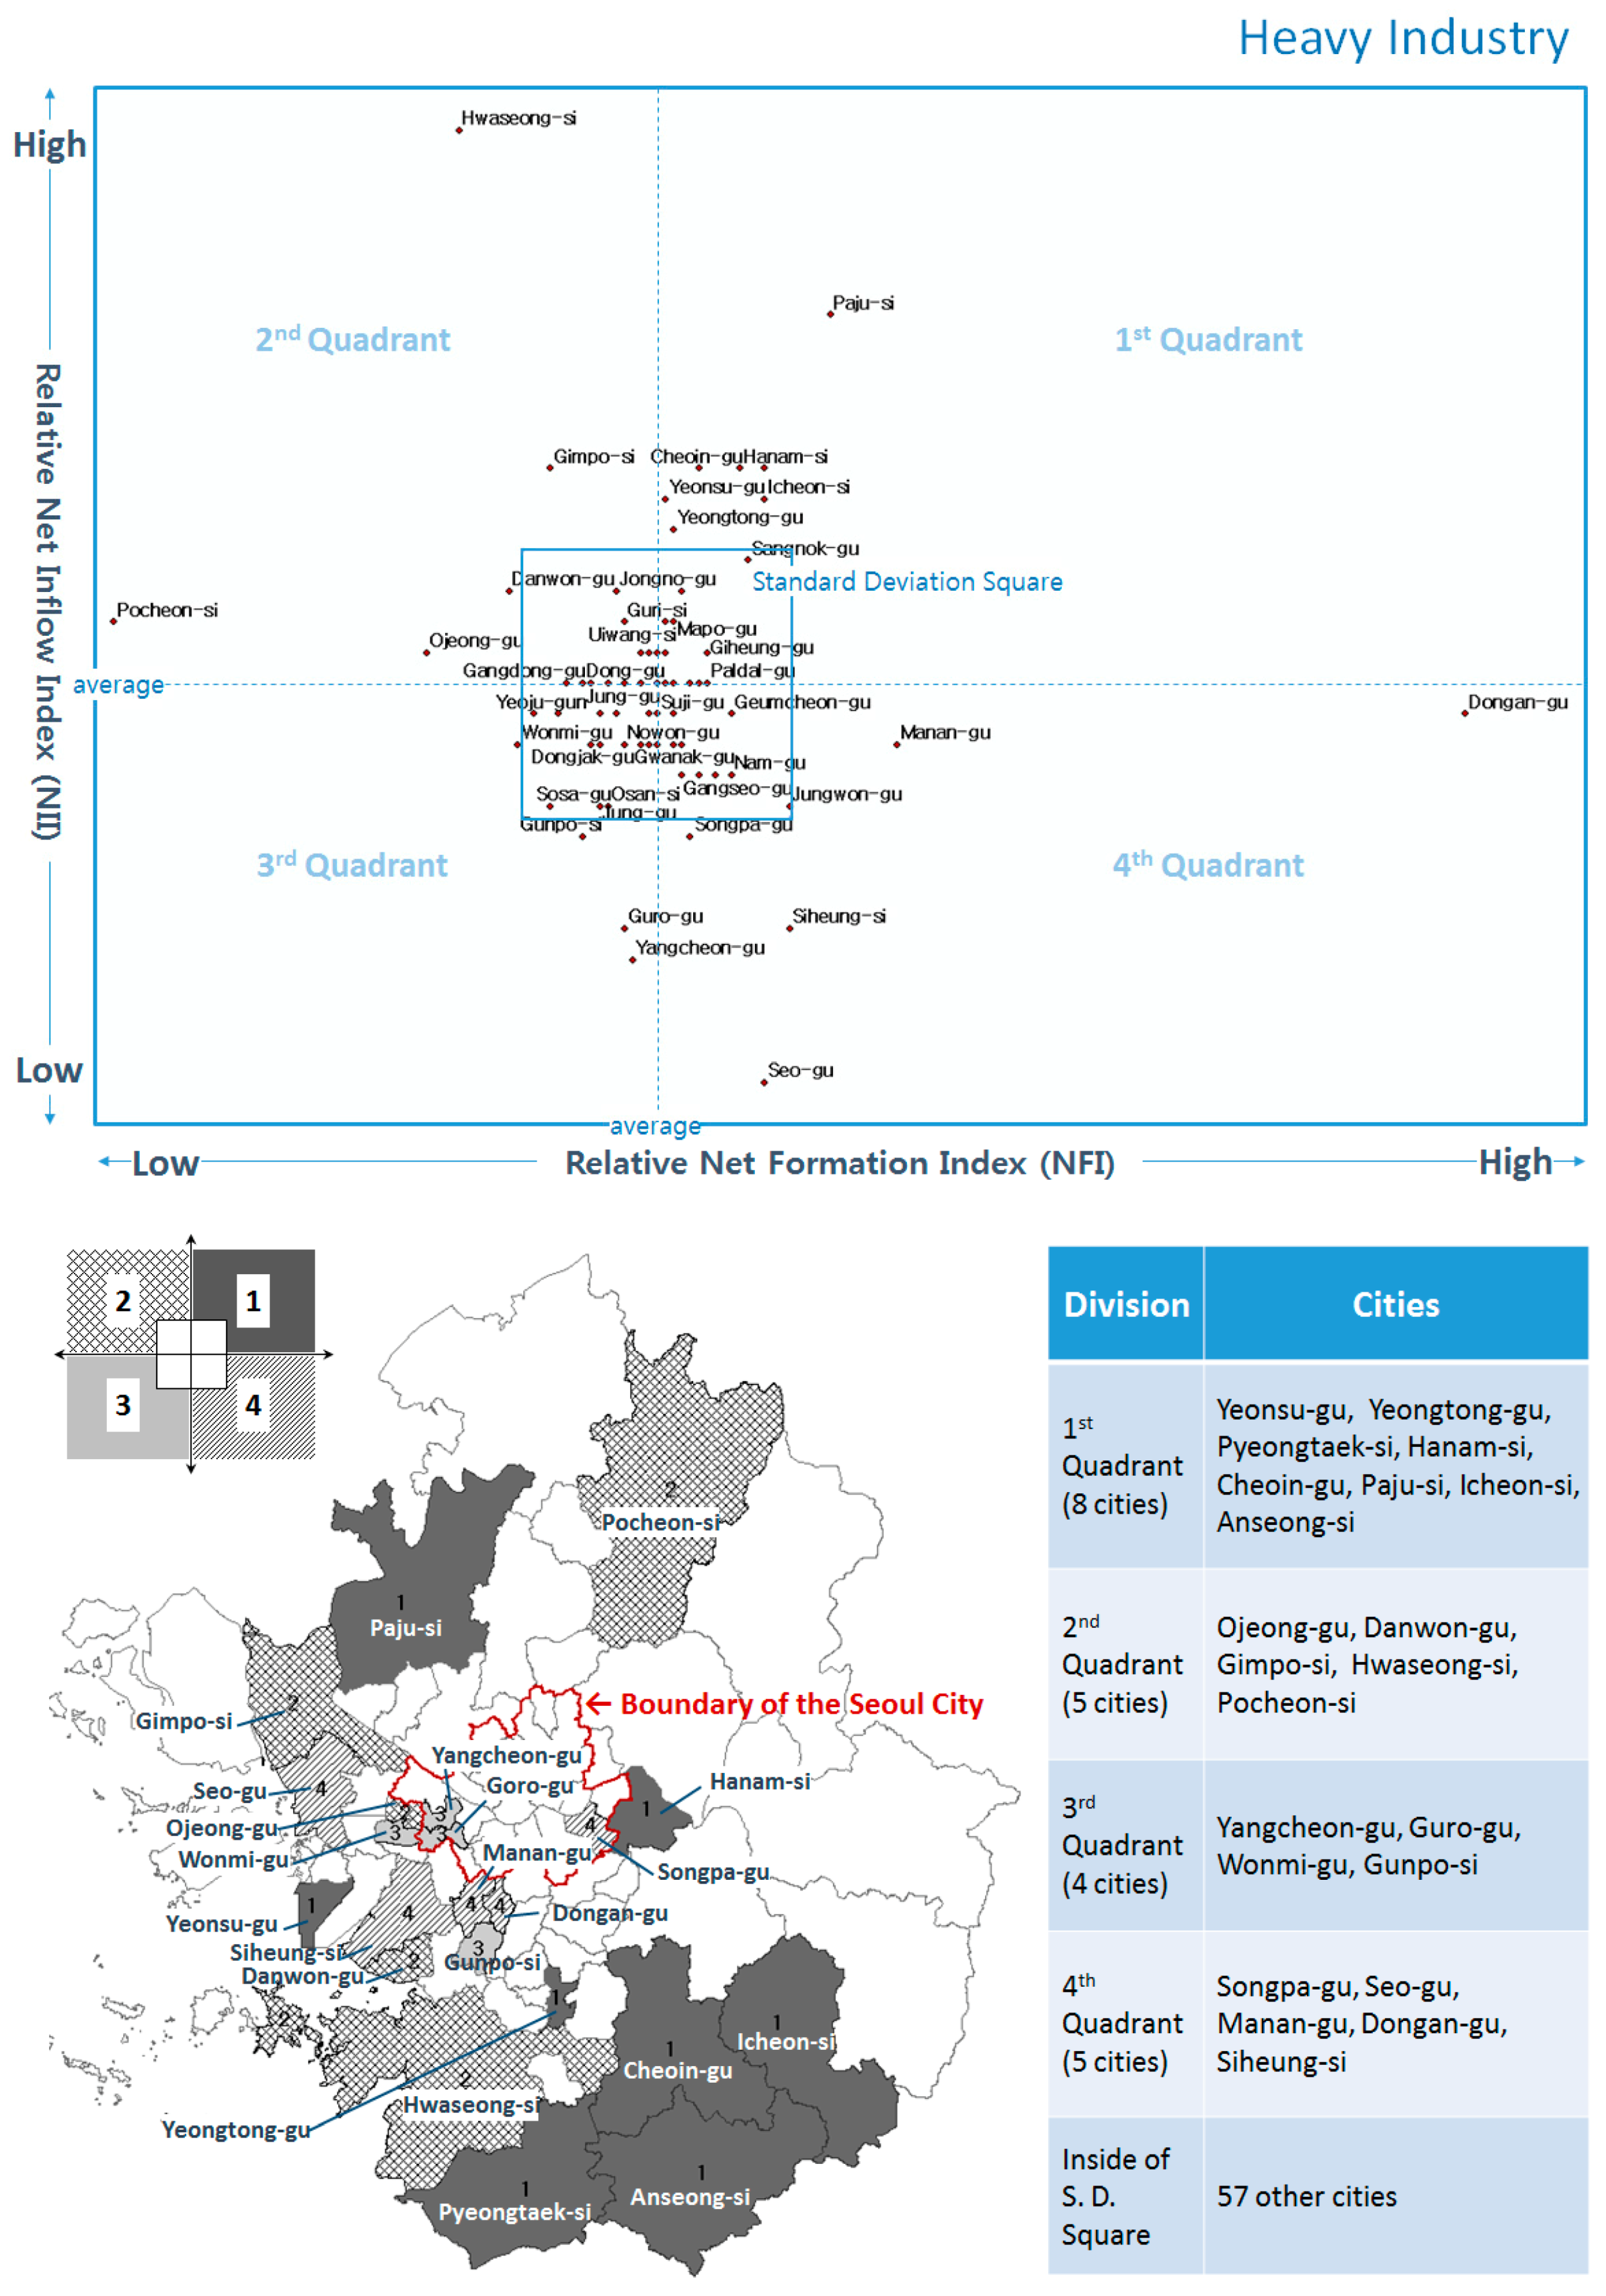
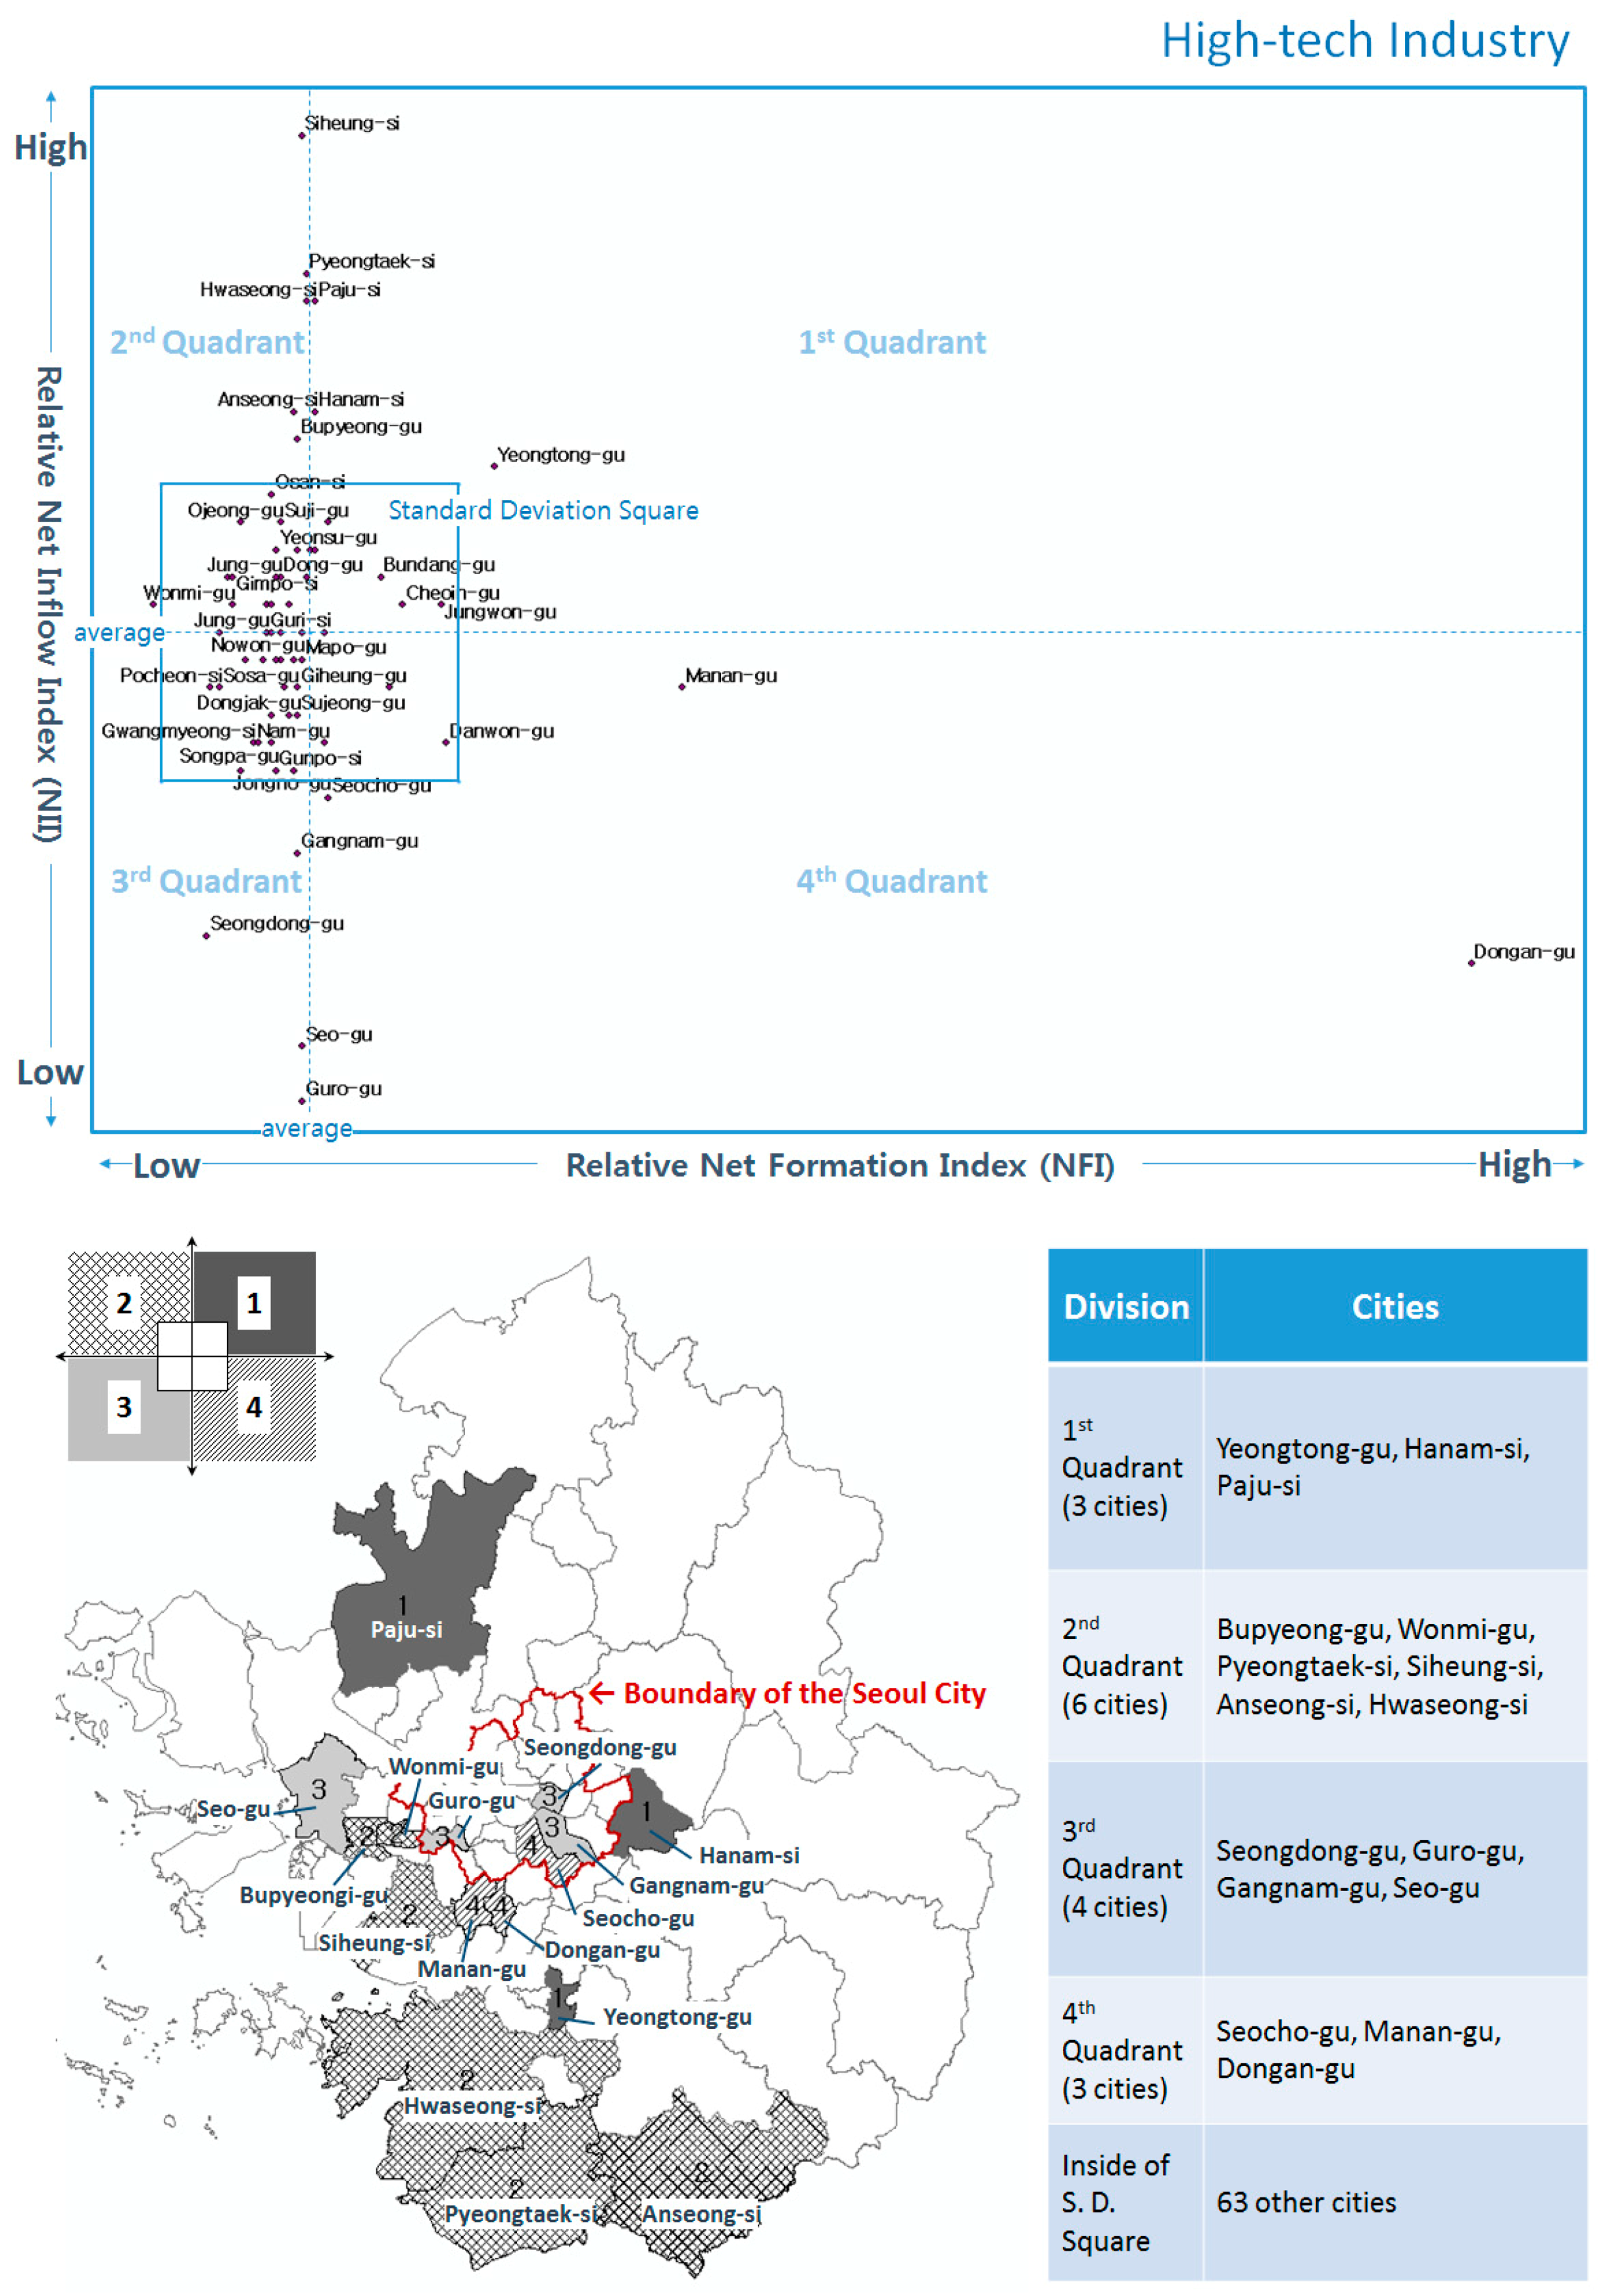
| Industry Type | Total Firms *** (2010) | New Firms (2010) | Closure Firms (2010) | Relocated Firms (2009–2010) | |||||||
|---|---|---|---|---|---|---|---|---|---|---|---|
| Total Relocation | Intra-City * Relocation | Inter-City ** Relocation | |||||||||
| No. | Ratio | No. | Ratio | No. | Ratio | No. | Ratio | No. | Ratio | ||
| Light Industry | 10,596 | 1877 | 17.7% | 2097 | 19.8% | 1232 | 11.6% | 888 | 8.4% | 344 | 3.2% |
| Heavy Industry | 14,994 | 2755 | 18.4% | 2675 | 17.8% | 1372 | 9.2% | 983 | 6.4% | 389 | 2.6% |
| High-Tech Industry | 15,788 | 3410 | 21.6% | 2711 | 12.2% | 2046 | 13.0% | 1468 | 9.3% | 578 | 3.7% |
| Total | 41,378 | 8042 | 19.4% | 7483 | 18.1% | 4650 | 11.2% | 3339 | 8.1% | 1311 | 3.2% |
| Division | Variable | N | Avg. | Sum | Min. | Max. | S. d. | ||
|---|---|---|---|---|---|---|---|---|---|
| Light Industry | Formation | 79 | 23.8 | 1877 | 0 | 113 | 22.0 | ||
| Dissolution | 79 | 26.5 | 2097 | 0 | 132 | 26.8 | |||
| Relocation | Inflow | 79 | 4.4 | 344 | 0 | 20 | 4.3 | ||
| Outflow | 79 | 4.4 | 344 | 0 | 42 | 6.5 | |||
| Heavy Industry | Formation | 79 | 34.9 | 2755 | 1 | 263 | 43.5 | ||
| Dissolution | 79 | 33.9 | 2675 | 0 | 286 | 44.6 | |||
| Relocation | Inflow | 79 | 4.9 | 389 | 0 | 36 | 6.0 | ||
| Outflow | 79 | 4.9 | 389 | 0 | 32 | 5.7 | |||
| High-tech Industry | Formation | 79 | 43.2 | 3410 | 0 | 343 | 59.0 | ||
| Dissolution | 79 | 34.3 | 2711 | 0 | 258 | 44.1 | |||
| Relocation | Inflow | 79 | 7.32 | 578 | 0 | 44 | 7.9 | ||
| Outflow | 79 | 7.32 | 578 | 0 | 35 | 8.1 | |||
| Type of Variables | Marks | Definition | Sources | Year | Descriptive Statistics | |||
|---|---|---|---|---|---|---|---|---|
| Min. | Max. | Mean | Std. Dev. Dev. | |||||
| Density Variables | Pop_Den | Residential population (10,000 persons) per km2 | KOSIS * | 2010 | 456.9 | 27,578.1 | 9572.8 | 7131.9 |
| Emp_Den | Number of existing employees (10,000 persons) per km2 | KOSIS | 2010 | 146.0 | 16,724.1 | 3854.4 | 3638.6 | |
| Firm_Den | Number of existing manufacturing firms per km2 | KOSIS | 2010 | 38.2 | 2311.0 | 695.1 | 558.8 | |
| L_Firm_Den | Number of existing light industry firms per km2 | KOSIS | 2010 | 0.3 | 363.2 | 28.3 | 47.2 | |
| H_Firm_Den | Number of existing heavy industry firms per km2 | KOSIS | 2010 | 1.1 | 194.5 | 27.0 | 34.9 | |
| T_Firm_Den | Number of existing high-tech industry firms per km2 | KOSIS | 2010 | 0.0 | 258.4 | 16.8 | 35.9 | |
| Human Capital | Sec_Deg | Percentage of working persons with high school degree | KOSIS | 2010 | 0.1 | 0.4 | 0.3 | 0.0 |
| Ter_Deg | Percentage of working persons with bachelor’s degree or higher | KOSIS | 2010 | 0.0 | 0.1 | 0.0 | 0.0 | |
| Wage | Average wage per household (1–10, 10: high, 1: low) | Biz-GIS ** | 2010 | 1.7 | 7.1 | 3.6 | 1.0 | |
| Economic Variables | GRDP | Total amount of GRDP (100 million won) | KOSIS | 2010 | 39.816 | 3890.731 | 679.497 | 604.829 |
| Land_P | Land price (1 million won) per m2 | Official Data | 2010 | 618.8 | 75,591.1 | 16,885.6 | 15,710.2 | |
| FS_R_HS | Rent fee of residential floorspace (10,000 won) per m2 | Official Data | 2010 | 0.1 | 1.8 | 0.9 | 0.4 | |
| FS_R_Ind | Rent fee of industrial floorspace (10,000 won) per m2 | Official Data | 2010 | 1.0 | 1.9 | 1.2 | 0.2 | |
| FS_R_Off | Rent fee of official floorspace (10,000 won) per m2 | Official Data | 2010 | 2.4 | 6.7 | 3.4 | 0.9 | |
| Floorspace | FS_HS | Total amount of residential floorspace (km2) | KOSIS | 2010 | 0.56378 | 43.07060 | 11.10036 | 0.788842 |
| FS_Ind | Total amount of industrial floorspace (km2) | KOSIS | 2010 | 0.11236 | 14.29020 | 2.10715 | 2.81322 | |
| FS_Off | Total amount of office floorspace (km2) | KOSIS | 2010 | 0.09951 | 11.49820 | 1.33440 | 1,079,954 | |
| FS_Vacan_HS | Total amount of vacant residential floorspace (m2) | KOSIS | 2010 | 51,111 | 2,888,580 | 495,886 | 476,905 | |
| FS_Vacan_Ind | Total amount of vacant industrial floorspace (m2) | KOSIS | 2010 | 7640 | 1,228,960 | 187,815 | 254,909 | |
| FS_Vacan_Off | Total amount of vacant office floorspace (m2) | KOSIS | 2010 | 12,936 | 655,397 | 98,564 | 110,519 | |
| Location Quotient | LQ_light | Location quotient of light industry | KOSIS | 2010 | 0.1 | 4.8 | 1.0 | 1.1 |
| LQ_heavy | Location quotient of heavy industry | KOSIS | 2010 | 0.0 | 0.2 | 0.0 | 0.0 | |
| LQ_high | Location quotient of high-tech industry | KOSIS | 2010 | 0.0 | 0.2 | 0.0 | 0.0 | |
| LQ_all | Location quotient of all industry | KOSIS | 2010 | 0.1 | 3.2 | 1.0 | 0.8 | |
| Transport | Sub_Den | Number of subway stations per km2 | NGII *** | 2010 | 0.0 | 0.9 | 0.2 | 0.2 |
| Road_Ratio | Length of road in km2 | NGII | 2010 | 0.0 | 0.2 | 0.1 | 0.1 | |
| Dis2Har | Distance to an international harbor from center point each city (km) | NGII | 2010 | 8.5 | 11.4 | 10.4 | 0.6 | |
| Industry Type | Dependent Variable | Adj. R2 | AICc | JB | K (BP) | VIF | Moran’s I (p-Value) | Model |
|---|---|---|---|---|---|---|---|---|
| Light | New firms | 0.77 | 599.62 | 0.00 | 0.50 | 2.66 | 0.0199 (0.50) | − Ter_Deg *** + GRDP *** + FS_R_Ind *** + Dis2Har *** + LQ_all *** |
| Closed firms | 0.79 | 621.72 | 0.44 | 0.00 | 1.72 | −0.0328 (0.69) | + Sec_Deg + GRDP *** + Dis2Har *** + LQ_light *** + LQ_all *** | |
| Flowed in firms | 0.60 | 388.71 | 0.05 | 0.00 | 1.15 | −0.0103 (0.96) | + Pop_Den + Wage *** + GRDP *** + Dis2Har *** + LQ_light ** | |
| Flowed out firms | 0.78 | 404.78 | 0.11 | 0.00 | 2.01 | 0.0254 (0.44) | + Sec_Deg ** + GRDP *** + Dis2Har *** − FS_Vacan_Ind *** + LQ_all *** | |
| Heavy | New firms | 0.77 | 703.51 | 0.00 | 0.01 | 3.05 | −0.1060 (0.05) | + H_Firm_Den *** + GRDP *** + FS_R_HS ** + FS_Vacan_Ind *** + LQ_heavy |
| Closed firms | 0.84 | 680.84 | 0.00 | 0.00 | 2.49 | −0.1015 (0.06) | + GRDP *** + FS_HS *** − FS_Vacan_HS *** +FS_Vacan_Ind **+LQ_heavy *** | |
| Flowed in firms | 0.76 | 396.81 | 0.00 | 0.00 | 3.98 | −0.0976 (0.08) | + H_Firm_Den *** + GRDP *** + FS_Ind *** − FS_Vacan_Off | |
| Flowed out firms | 0.65 | 418.75 | 0.00 | 0.01 | 1.57 | −0.0319 (0.70) | + Emp_Den *** + H_Firm_Den *** − Dis2Har * + FS_Vacan_Ind *** | |
| High-tech | New firms | 0.53 | 808.35 | 0.00 | 0.58 | 3.65 | −0.0259 (0.75) | + FS_R_HS ** + FS_Ind *** + FS_Vacan_Off + LQ_high *** − LQ_all *** |
| Closed firms | 0.80 | 694.70 | 0.00 | 0.00 | 2.53 | −0.0888 (0.12) | + GRDP *** + FS_HS *** + FS_Ind *** − FS_Vacan_HS *** + LQ_high *** | |
| Flowed in firms | 0.81 | 426.14 | 0.08 | 0.00 | 3.44 | −0.0406 (0.58) | + Emp_Den *** + FS_HS *** + FS_Ind *** + LQ_high *** − LQ_all *** | |
| Flowed out firms | 0.62 | 481.07 | 0.01 | 0.00 | 3.49 | −0.0407 (0.57) | + Emp_Den + Land_P ** + FS_Vacan_Ind *** + LQ_high *** − LQ_all *** |
| Industry Type | Dependent Variable | Values | Lagrange Multiplier | Robust LM | Diagnostic | ||
|---|---|---|---|---|---|---|---|
| Lag | Error | Lag | Error | ||||
| Light | New firms | Value | 0.1264 | 0.0116 | 0.1459 | 0.0311 | OLS |
| p-value | 0.7222 | 0.9143 | 0.7025 | 0.8601 | |||
| Closed firms | Value | 1.1244 | 1.4917 | 0.1700 | 0.5373 | OLS | |
| p-value | 0.2890 | 0.2220 | 0.6801 | 0.4636 | |||
| Flowed in firms | Value | 0.9066 | 0.5011 | 0.4061 | 0.0007 | OLS | |
| p-value | 0.3410 | 0.4790 | 0.5239 | 0.9791 | |||
| Flowed out firms | Value | 0.2567 | 0.0103 | 0.5729 | 0.3265 | OLS | |
| p-value | 0.6124 | 0.9191 | 0.4491 | 0.5677 | |||
| Heavy | New firms | Value | 4.5384 | 5.9632 | 0.9545 | 2.3794 | SEM |
| p-value | 0.0331 | 0.0146 ** | 0.3286 | 0.1230 | |||
| Closed firms | Value | 2.7767 | 5.4318 | 0.5838 | 3.2388 | SEM | |
| p-value | 0.0957 | 0.0198 ** | 0.4449 | 0.0719 * | |||
| Flowed in firms | Value | 4.8131 | 3.2229 | 1.9974 | 0.4071 | SLM | |
| p-value | 0.0282 ** | 0.0726 * | 0.1576 | 0.5234 | |||
| Flowed out firms | Value | 0.3585 | 0.7435 | 0.0113 | 0.3963 | OLS | |
| p-value | 0.5493 | 0.3885 | 0.9154 | 0.5290 | |||
| High-tech | New firms | Value | 1.9852 | 0.2269 | 2.4523 | 0.6940 | OLS |
| p-value | 0.1588 | 0.6338 | 0.1174 | 0.4048 | |||
| Closed firms | Value | 0.1259 | 3.0961 | 0.2963 | 3.2664 | SEM | |
| p-value | 0.7227 | 0.0785 * | 0.5862 | 0.0707 * | |||
| Flowed in firms | Value | 0.6105 | 0.1418 | 0.4724 | 0.0037 | OLS | |
| p-value | 0.4346 | 0.7065 | 0.4919 | 0.9517 | |||
| Flowed out firms | Value | 0.9618 | 0.4200 | 0.5434 | 0.0017 | OLS | |
| p-value | 0.3267 | 0.4610 | 0.5169 | 0.9676 | |||
| Firm Life Cycle | Independent Variable | Coefficient | t(z)-Value | Model | Mode Performance | ||
|---|---|---|---|---|---|---|---|
| Adj.R2 (R2) | Log Likelihood | AIC (SC) | |||||
| New Firms | Constant | −149.07 *** | −6.00 | OLS | 0.765896 (0.781097) | −292.009 | 596.018 (610.158) |
| Ter_Deg | −295.27 *** | −3.53 | |||||
| GRDP | 2.5 × 10⁻⁶ *** | 8.17 | |||||
| FS_R_Ind | 37.49 *** | 3.47 | |||||
| Dis2Har | 10.17 *** | 4.58 | |||||
| LQ_all | 12.30 *** | 7.04 | |||||
| Close Firms | Constant | −143.49 *** | −4.33 | OLS | 0.790968 (0.804542) | −303.061 | 618.123 (632.263) |
| Sec_Deg | 66.33 * | 1.96 | |||||
| GRDP | 3.4 × 10⁻⁶ *** | 13.02 | |||||
| Dis2Har | 10.34 *** | 3.68 | |||||
| LQ_light_ | 317.94 *** | 5.06 | |||||
| LQ_all | 7.16 *** | 2.98 | |||||
| Inflow Firms | Constant | −20.79 *** | −3.40 | OLS | 0.598220 (0.624310) | −186.556 | 385.111 (399.251) |
| Pop_Den | 8.5 × 10⁻⁵ * | 1.82 | |||||
| Wage | 0.93 ** | 2.71 | |||||
| GRDP | 4.5 × 10⁻⁷ *** | 8.24 | |||||
| Dis2Har | 1.56 ** | 2.70 | |||||
| LQ_light | 39.71 *** | 3.51 | |||||
| Outflow Firms | Constant | −26.95 *** | −3.43 | OLS | 0.779076 (0.793422) | −194.592 | 401.184 (415.324) |
| Sec_Deg | 16.61 * | 1.84 | |||||
| GRDP | 1.2 × 10⁻⁶ *** | 14.90 | |||||
| Dis2Har | 1.88 *** | 2.92 | |||||
| FS_Vacan_Ind | −1.2 × 10⁻⁵ *** | −6.20 | |||||
| LQ_all | 2.46 *** | 4.16 | |||||
| Firm Life Cycle | Independent Variable | Coefficient. | t(z)-Value | Model | Mode Performance | ||
|---|---|---|---|---|---|---|---|
| Adj.R2 (R2) | Log Likelihood | AIC (SC) | |||||
| New Firms | Constant | −33.13 *** | −4.84 | SEM | - (0.813982) | −340.442 | 692.883 (707.023) |
| H_Firm_Den | 0.18 *** | 3.02 | |||||
| GRDP | 1.5 × 10⁻⁶ *** | 3.28 | |||||
| FS_R_HS | 27.23 *** | 3.71 | |||||
| FS_Vacan_Ind | 1.1 × 10⁻⁴ *** | 8.52 | |||||
| LQ_heavy | 8.28 ** | 2.44 | |||||
| Lambda (λ) | −0.65 *** | −3.30 | |||||
| Close Firms | Constant | −19.81 *** | −5.57 | SEM | - (0.862736) | −329.962 | 671.923 (686.064) |
| GRDP | 2.5 × 10⁻⁶ *** | 7.50 | |||||
| FS_HS | 1.3 × 10⁻⁶ *** | 3.63 | |||||
| FS_Vacan_HS | −2.7 × 10⁻⁵ *** | −4.57 | |||||
| FS_Vacan_Ind | 7.3 × 10⁻⁵ *** | 7.52 | |||||
| LQ_heavy | 22.19 *** | 8.80 | |||||
| Lambda (λ) | −0.53 ** | −2.40 | |||||
| Inflow Firms | Constant | 0.56 | 0.69 | SLM | - (0.784754) | −189.953 | 391.906 (406.046) |
| H_Firm_Den | 0.04 *** | 5.03 | |||||
| GRDP | 3.8 × 10⁻⁷ *** | 3.65 | |||||
| FS_Ind | 1.3 × 10⁻⁶ *** | 9.64 | |||||
| FS_Vacan_Off | −9.2 × 10⁻⁶ * | −1.63 | |||||
| Rho (ρ) | −0.23 ** | −1.76 | |||||
| Outflow Firms | Constant | 13.60 * | 1.86 | OLS | 0.647335 (0.665655) | −202.783 | 415.567 (427.351) |
| Emp_Den | 5.0 × 10⁻⁴ *** | 4.01 | |||||
| H_Firm_Den | 0.05 *** | 5.04 | |||||
| Dis2Har | −1.30 * | −1.88 | |||||
| FS_Vacan_Ind | 7.7 × 10⁻⁶ *** | 4.45 | |||||
| Firm Life Cycle | Independent Variable | Coefficient | t(z)-Value | Model | Mode Performance | ||
|---|---|---|---|---|---|---|---|
| Adj.R2 (R2) | Log Likelihood | AIC (SC) | |||||
| New Firms | Constant | −26.20 | −1.40 | OLS | 0.529758 (0.560293) | −396.375 | 804.75 (818.891) |
| FS_R_HS | 39.10 ** | 2.13 | |||||
| FS_Ind | 1.1 × 10⁻⁵ *** | 4.99 | |||||
| FS_Vacan_Off | 7.6 × 10⁻⁵ | 1.49 | |||||
| LQ_high | 1089.08 *** | 5.07 | |||||
| LQ_all | −34.54 *** | −2.98 | |||||
| Close Firms | Constant | −15.75 ** | −2.62 | SEM | - (0.678434) | −361.471 | 734.942 (749.083) |
| GRDP | 1.8 × 10⁻⁶ *** | 3.51 | |||||
| FS_HS | 2.9 × 10⁻⁶ *** | 5.02 | |||||
| FS_Ind | 6.9 × 10⁻⁶ *** | 4.57 | |||||
| FS_Vacan_HS | −4.6 × 10⁻⁵ *** | −4.97 | |||||
| LQ_high | 14.26 *** | 3.73 | |||||
| Lambda (λ) | 0.11 | 0.46 | |||||
| Inflow Firms | Constant | −0.52 | −0.57 | OLS | 0.806362 (0.818936) | −205.268 | 422.537 (436.677) |
| Emp_Den | 6.3 × 10⁻⁵ *** | 5.50 | |||||
| FS_HS | 1.2 × 10⁻⁷ ** | 2.34 | |||||
| FS_Ind | 1.7 × 10⁻⁶ *** | 9.25 | |||||
| LQ_high | 148.86 *** | 8.31 | |||||
| LQ_all | −4.58 *** | −4.71 | |||||
| Outflow Firms | Constant | −0.64 | −0.48 | OLS | 0.619042 (0.643780) | −232.734 | 477.467 (491.608) |
| Emp_Den | 4.5 × 10⁻⁴ * | 1.70 | |||||
| Land_P | 1.6 × 10⁻⁶ ** | 2.44 | |||||
| FS_Vacan_Ind | 1.5 × 10⁻⁵ *** | 4.81 | |||||
| LQ_high | 171.08 *** | 6.32 | |||||
| LQ_all | −5.15 *** | −3.70 | |||||
© 2019 by the authors. Licensee MDPI, Basel, Switzerland. This article is an open access article distributed under the terms and conditions of the Creative Commons Attribution (CC BY) license (http://creativecommons.org/licenses/by/4.0/).
Share and Cite
An, Y.; Wan, L. Monitoring Spatial Changes in Manufacturing Firms in Seoul Metropolitan Area Using Firm Life Cycle and Locational Factors. Sustainability 2019, 11, 3808. https://doi.org/10.3390/su11143808
An Y, Wan L. Monitoring Spatial Changes in Manufacturing Firms in Seoul Metropolitan Area Using Firm Life Cycle and Locational Factors. Sustainability. 2019; 11(14):3808. https://doi.org/10.3390/su11143808
Chicago/Turabian StyleAn, Youngsoo, and Li Wan. 2019. "Monitoring Spatial Changes in Manufacturing Firms in Seoul Metropolitan Area Using Firm Life Cycle and Locational Factors" Sustainability 11, no. 14: 3808. https://doi.org/10.3390/su11143808
APA StyleAn, Y., & Wan, L. (2019). Monitoring Spatial Changes in Manufacturing Firms in Seoul Metropolitan Area Using Firm Life Cycle and Locational Factors. Sustainability, 11(14), 3808. https://doi.org/10.3390/su11143808


