Article

The Effects of Extreme Heat Adaptation Strategies under Different Climate Change Mitigation Scenarios in Seoul, Korea

1
Interdisciplinary Program in Landscape Architecture, Seoul National University, Seoul 08826, Korea
2
Department of Landscape Architecture and Rural System Engineering, College of Agriculture Life Science, Seoul National University, Seoul 08826, Korea
*
Author to whom correspondence should be addressed.
Sustainability 2019, 11(14), 3801; https://doi.org/10.3390/su11143801
Submission received: 16 May 2019 / Revised: 23 June 2019 / Accepted: 8 July 2019 / Published: 11 July 2019

Abstract

:
The impacts of extreme heat in Seoul, Korea, are expected to increase in frequency and magnitude in response to global warming, necessitating certain adaptation strategies. However, there is a lack of knowledge of adaptation strategies that would be able to reduce the impacts of extreme heat to cope with an uncertain future, especially on the local scale. In this study, we aimed to determine the effect of adaptation strategies to reduce the mortality risk under two climate change mitigation scenarios, using Representative Concentration Pathways (RCP) 2.6 and 8.5. We selected four street-level adaptation strategies: Green walls, sidewalk greenways, reduced-albedo sidewalks and street trees. As an extreme heat assessment criterion, we used a pedestrian mean radiant temperature threshold, which was strongly related to heat mortality. The results, projected to the 2050s, showed that green walls, greenways and reduced-albedo sidewalks could adequately reduce the extreme heat impacts under RCP2.6; however, only street trees could reduce the extreme heat impacts under RCP8.5 in the 2050s. This implies that required adaptation strategies can vary depending on the targeted scenario. This study was conducted using one street in Seoul, but the methodology can be expanded to include other adaptation strategies, and applied to various locations to help stakeholders decide on effective adaptation options and make local climate change adaptation plans.

1. Introduction

Climate change is expected to increase extreme temperature and precipitation events [1], which impacts diverse sectors, including public health, infrastructure, and agriculture [2]. In addition, climate change mitigation and adaptation measures can affect the overall impacts and any vulnerability to climate change [3]. In 2018, the Intergovernmental Panel on Climate Change (IPCC) issued a special report on the global warming limit of 1.5 °C, which stressed that the global mean temperature should be maintained within 1.5 °C above pre-industrial levels. The IPCC further noted that ambitious mitigation actions are indispensable to limit warming to 1.5 °C [4]. Without such mitigation actions, the substantial global impacts of climate change will not be inevitable [5]. In other words, the degree of mitigation efforts undertaken will result in different degrees of the impact of climate change.
The impacts of global warming are manifesting at regional and local scales [6]; thus, it is important to identify the changes at both the local and global scales. In particular, increasing heat stress due to rising temperature has severe impacts on public health at the local scale [7,8].
Extreme heat events are expected to increase in frequency and magnitude under climate change [9], which could cause heat-related health problems [10,11]. Therefore, it is important to predict the increases in the impacts of extreme heat to prepare for and respond to such health problems.
Many studies have assumed that cities will endure increased extreme heat events (including heat waves) in the future [12,13,14]. For instance, eastern Mediterranean cities, such as Athens and Florina have been projected to experience further lengthening of extreme hot seasons compared to the increase from 1971 to 2000 by approximately one month in 2021–2050, and two months in 2071–2100 [14]. Pakistan is also expected to face more severe impacts from climate extremes, especially a large increase in the frequencies and magnitudes of extreme heat [12]. In the subtropical areas of Brisbane, Australia, dangerous heat stress will occur on a minimum of 1–2 days per year during 2041–2050 [13]. In addition, cities in Korea are vulnerable to the frequency, magnitude and duration of hot events [15], which will cause a 5–7.2 times the number of deaths in the 2050s than before [16]. Because extreme heat events due to climate change are expected to increase worldwide, there is a need to prepare climate change adaptations in response to extreme heat to reduce the impacts upon human health.
Despite its importance, there is a lack of academic effort on assessment of local scale extreme heat adaptation. To prepare climate change adaptation and making effective plans, decision makers must know the effects of adaptation measures on the local scale (defined here, as representing a micro scale that has a similar thermal condition). Studies on heat reduction strategies can help in the selection of adaptation measures based on quantifiable metrics, such as air temperature reduction, radiant heat load, or human discomfort indexes. Diverse strategies related to tree/vegetation, surface material, water bodies, and urban geometry have been discovered as effective heat reduction strategies on the micro-scale [1,17,18,19,20,21,22,23]. However, these studies have limitations in supporting climate change decision making, because they do not consider the future state based on climate change scenarios. Meanwhile, Zölch et al. [24] considered the future state, and determined the effect of green infrastructure (e.g., trees, green roofs, and green facades) in Munich, Germany, providing empirical evidence to assist planers or decision makers in creating adaptation plans. However, their study only compared one time period in the future with the present under only one scenario, which did not adequately address the uncertainty of climate change. To cope with the uncertainty of future climate change, it is necessary to assess the change over a given period of time using multiple scenarios [25].
A recent study compared the current radiant heat load in Vancouver, Canada, with two climate change scenarios until 2100, and found the adaptive effects of tree cover [26]. The results provide powerful evidence for making adaptation measures related to tree cover, because they quantify the extreme heat magnitude, frequency and duration resulting from tree cover. However, this study had the limitation that only one strategy was considered. Studies should consider diverse local adaptation strategies based on field data. Thus, their study should be extended to evaluate other diverse adaptation strategies to plan appropriate site-specific measures.
Adaptation measures for responding to extreme heat include thermal environment improvement on the block or street level and on vulnerable residential areas [27]. Particularly, the street level is important because people engaged in outdoor activities, such as pedestrians, are directly exposed to a high radiant heat loads, which has repercussions on health, and can result in mortality [10]. Applying radiant heat load mitigation strategies in the local scale also improve human thermal comfort [28] and reduces heat stress [29], which leads to diverse benefits: both physical and mental. In particular, reducing extreme heat that exceeds the mortality risk threshold has direct benefit on reducing the mortality risk [29]. For these reasons, the degree to which adaptation strategies can reduce extreme heat represents important data for decision makers. However, except for a few studies [10,26], previous studies had not considered such thresholds, and instead tend to present the degree of heat load reduction.
Therefore, the overall objective of this study was to determine the effects of diverse adaptation strategies in mitigating extreme heat under two climate change mitigation scenarios. To this end, extreme heat was defined using mean radiant temperature (MRT), while adaptation strategies used in local government adaptation plans were used to evaluate the reduction of MRT. Two types of climate change mitigation scenarios are; one with no mitigation efforts and one with an ambitious mitigation effort to limit the increase in global warming to 1.5 °C. The novelty of this study is that we attempted to comprehensively analyze the adaptation effects with various strategies and future scenarios on the local scale. This study provides effective information for local adaptation decision making to reduce the loss of life due to extreme heat.

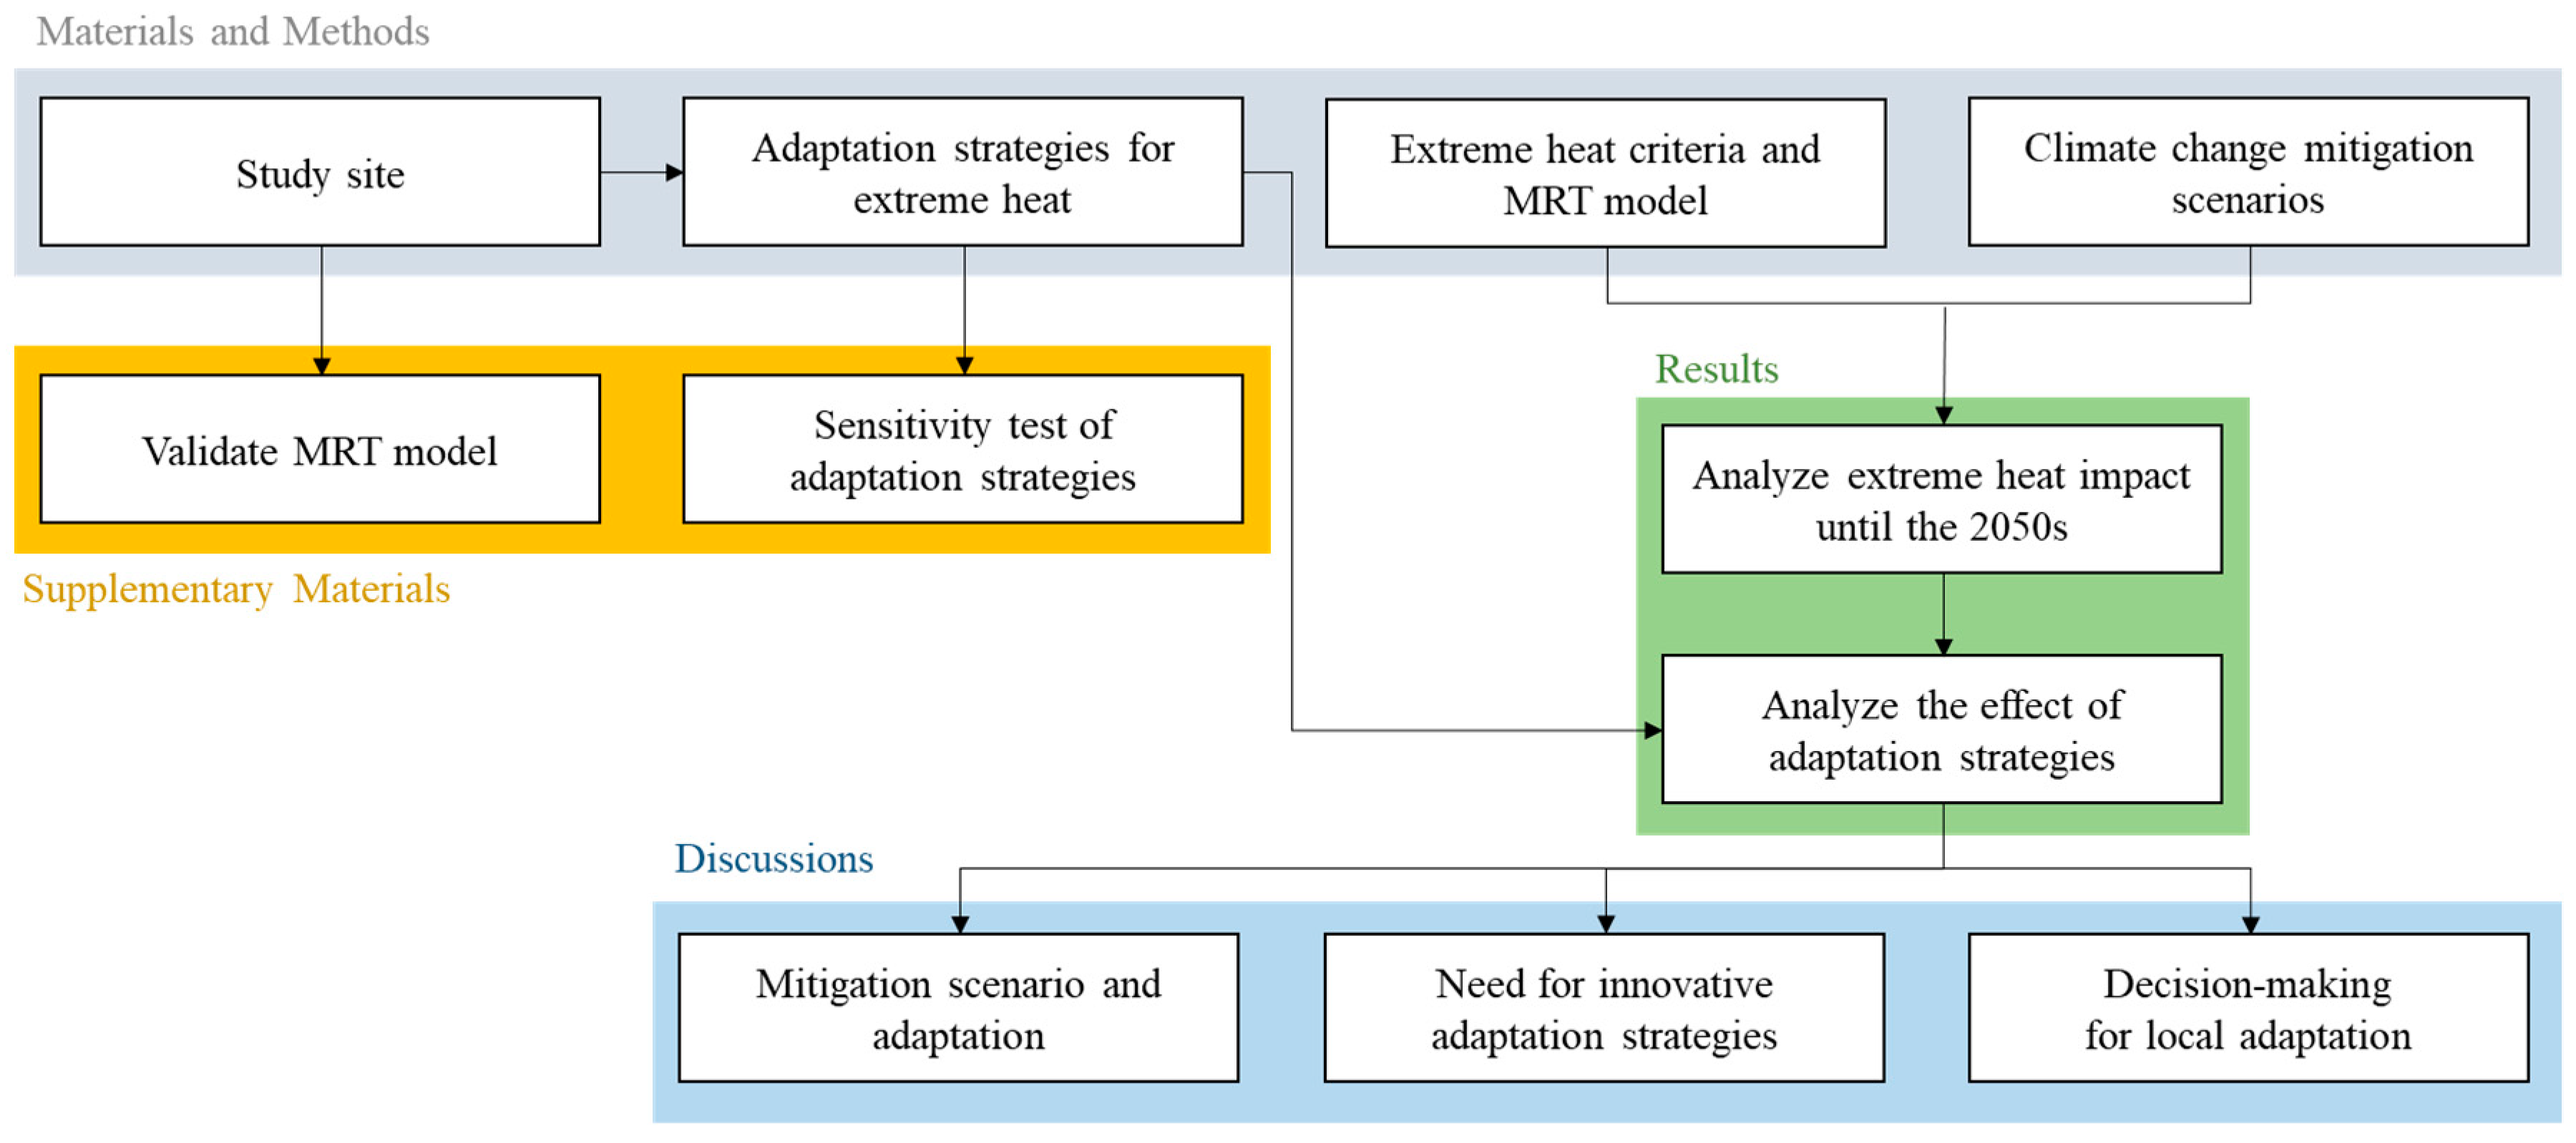
2. Materials and Methods
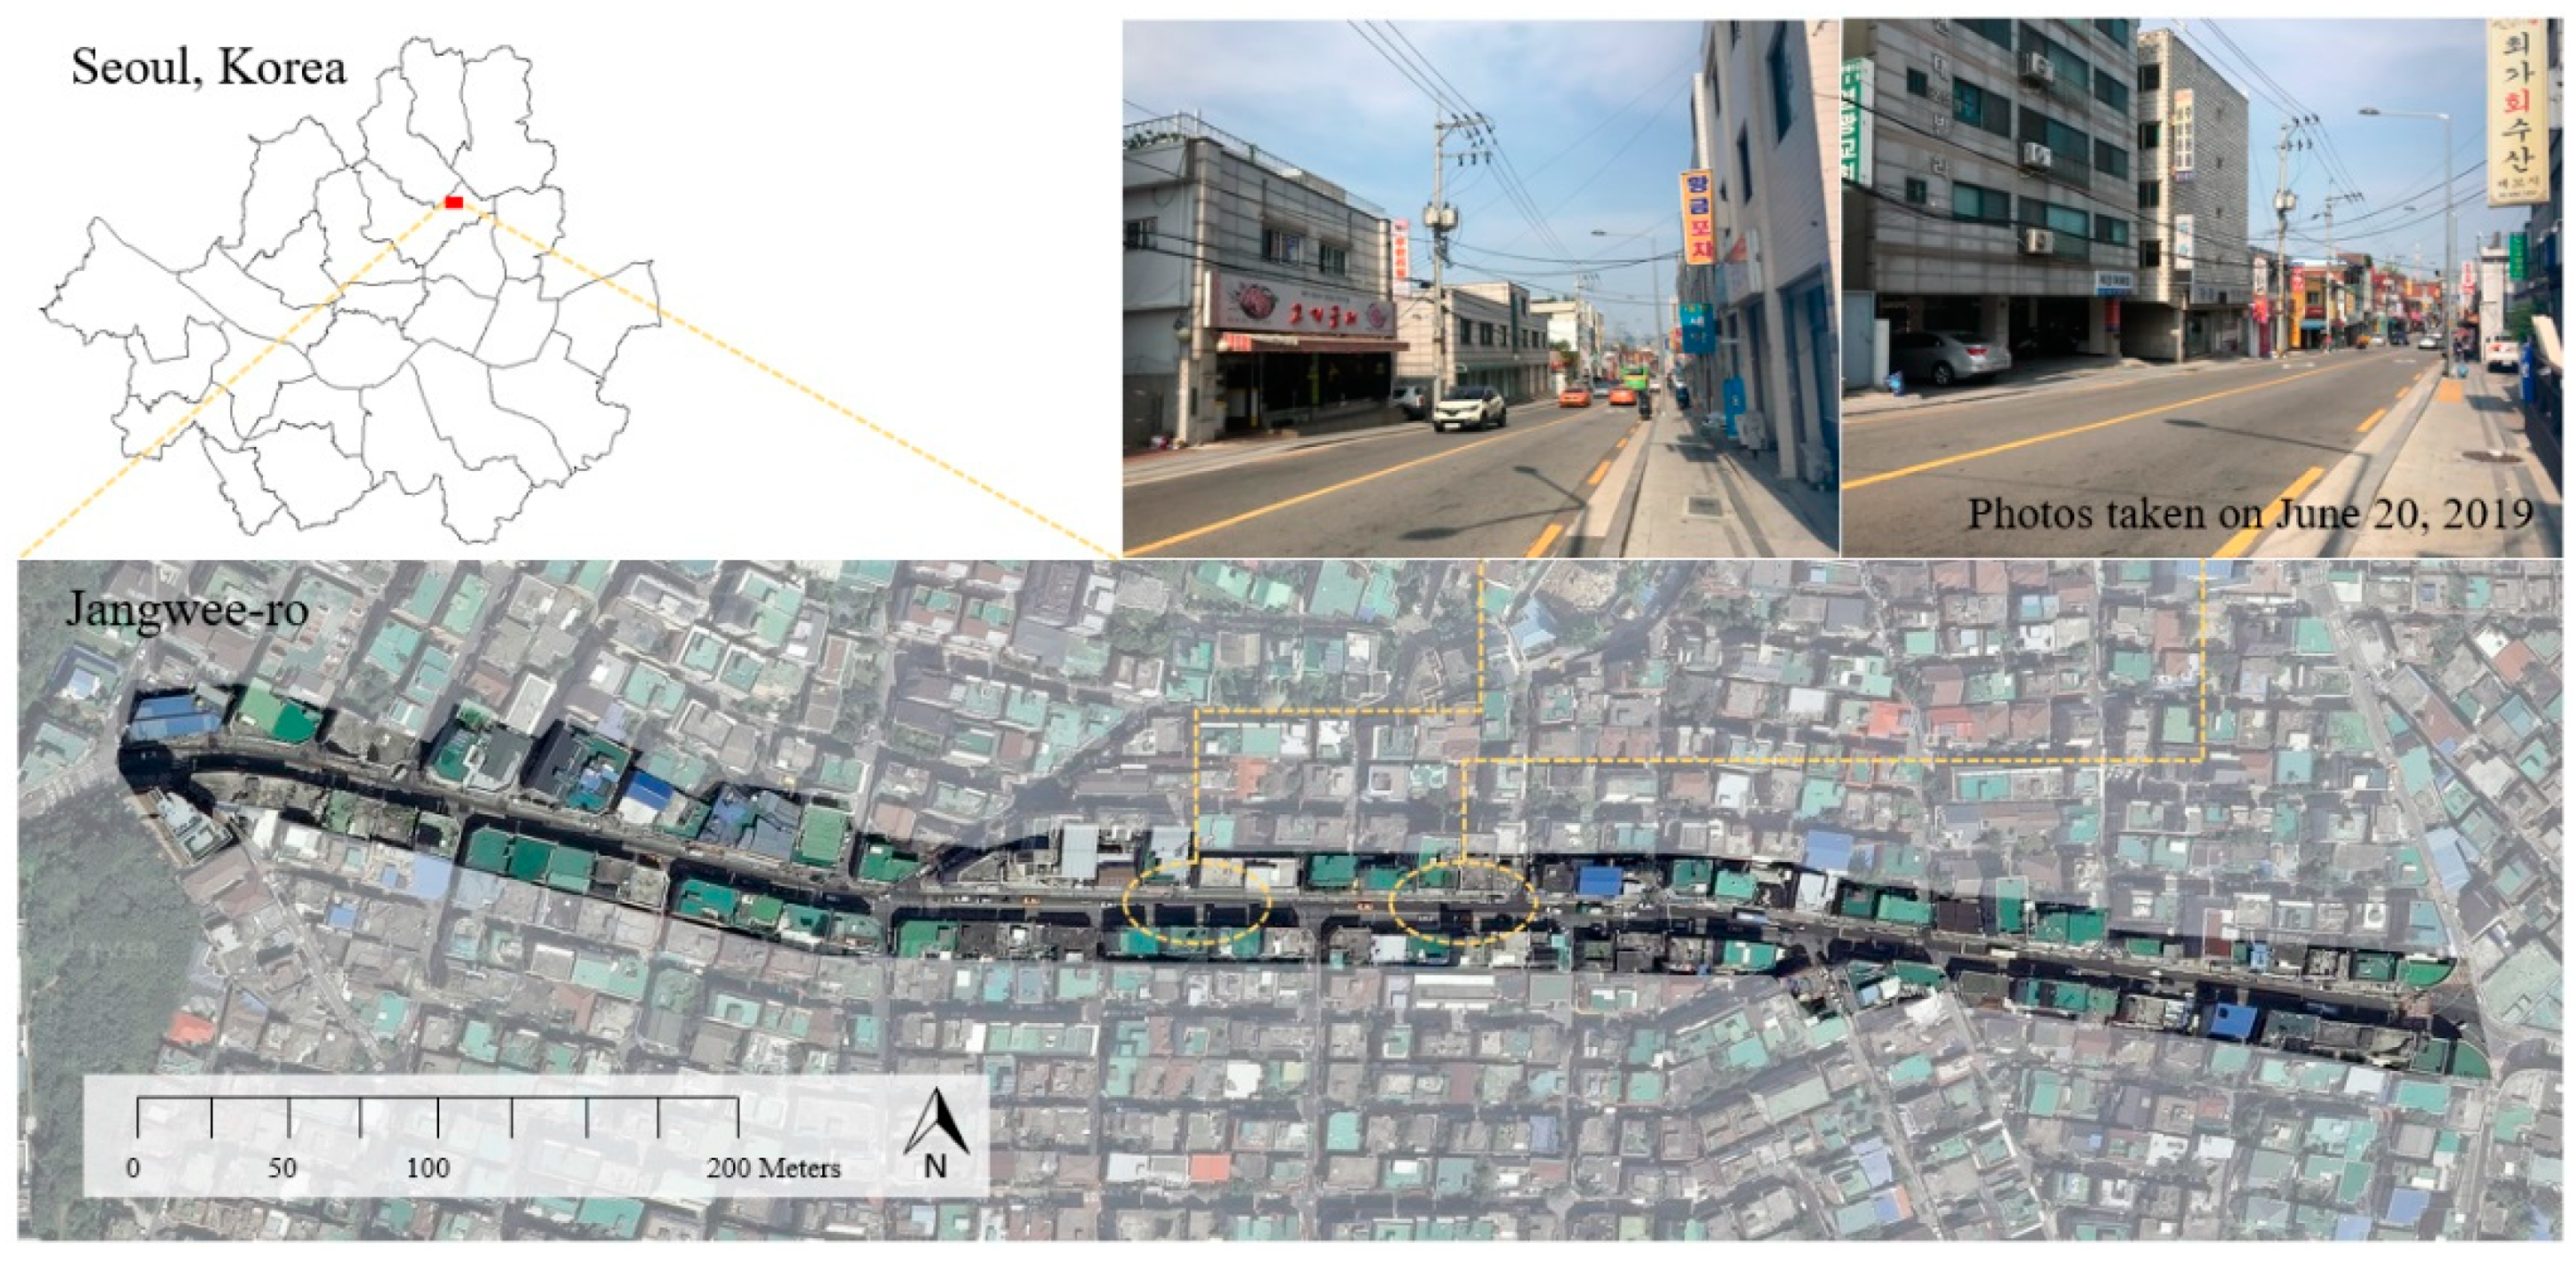
This study considered the impact of extreme heat under two future scenarios and the effects of diverse adaptation strategies in an urban street setting. Figure 1 shows the research flow. First, we reviewed the urban extreme heat strategies of local plans related to the study site and the climate change scenario. Then, we analyzed the future impacts and offset effects of adaptation strategies using parameters related to mortality as the criteria for the extreme heat assessment. Before the main analysis, we compared MRT model results with the measured results from the study site and performed sensitivity tests of the adaptation strategies to validate the MRT model and the selected strategies.

2.1. Study Site

The study site is Jangwee-ro, which is a street (length: 755 m, width: 7 m) running east–west, located in the northern part of Seoul, Korea. The road is bordered by buildings 2.6–18.6 m in height (Figure 2). This study site has two characteristics. First, none of the adaptation strategies evaluated in this study are currently implemented. The street consists of old asphalt and sidewalk pavement, which reflects heat directly onto pedestrians. There is also no tree cover that could lower the incident radiation. Such a street with no adaptation capacity for extreme heat is not common in Seoul. However, this type of street can be directly applied to cities in developing countries that have unplanned urban streets. Second, this street consists of low-rise buildings, which have low thermal comfort [26]. For these characteristics, the study site has low vulnerability to extreme heat events. However, we expect this vulnerability will increase in the future, and will require more adaptation strategies.
The focus of this study was on the impacts of extreme heat upon the health of people who spend time walking through streets. Unlike indoor space, heat-related illnesses in outdoor spaces are driven by environmental conditions; therefore, heat-induced mortality can be reduced by changing the street conditions [10,30].

2.2. Adaptation Strategies for Extreme Heat

In South Korea, all local governments are required to establish ‘climate change adaptation plans’ every five years. The first plans were established in 2017, and were created to respond to climate change from 2017 to 2021. These plans consider seven components: Health, disaster, agriculture, water management, forest, ecology and marine/fishery. In particular, the health component includes detailed adaptation plans to respond to extreme heat events (e.g., heat waves) [31]. Table 1 presents the categorized inventory of local adaptation strategies on extreme heat. We divided the categories into four strategies related to green area, building roof, watering and gray infrastructure. We selected strategies with the capacity for pedestrian heat load reduction. Ultimately, we selected three green area adaptation strategies and a strategy to reduce sidewalk albedo, based on a recent study. High albedo reflects more radiation to pedestrians, which increases the radiant heat load [18,32,33]. The four strategies considered in this study were as follows: Greenway (GS), green wall (GW), street tree (ST), and reduced-albedo sidewalk (SA). Table 2 explains each adaptation strategy and how they were applied in this study. We assumed these strategies had independent adaptation effects and would maintain their effect throughout the study’s timespan up to the 2050s. The detailed variables, such as albedo and emissivity, were referenced from previous studies.

2.3. Extreme Heat Criteria and MRT Model

We used MRT of a south-facing pedestrian as the indicator of the heat load under conditions of a clear sky and high air temperature [10]. MRT is an important variable for assessing thermal comfort [39] and heat stress [10], and has been found to have a more direct correlation with mortality than air temperature [40]. We defined extreme heat as the daily maximum MRT exceeding the threshold of a mortality risk. In research from Stockholm (Sweden) and Porto (Portugal), an MRT of 55 °C represented a threshold of a 5% increase in mortality risk, and was defined as moderate heat stress [40,41]. Thus, this same threshold of 55 °C was used in the present study. In addition, we identified the frequency and magnitude of the extreme heat load experienced by pedestrians during summer (June to August, inclusive, DOY 152–243). For frequency, we used extreme heat days (EHD), representing the total number of days that exceeded the daily maximum MRT of 55 °C during the summer. For the magnitude, we used the average MRT (AMRT) of EHD (daily maximum MRT over 55 °C).
We used the multilayer MRT (MMRT) model to calculate the daily maximum MRT [37]. The MMRT model was developed based on a multilayer urban canopy model [42,43]. The algorithm of this model includes the calculation of view factors, solar radiation, and longwave radiation from each element, and the estimation of received radiation by the pedestrian [39]. Several MRT simulation models have been developed (e.g., ENVI-met, SOLWEIG, RayMan). Compared with other models, an MMRT model can calculate complex radiation transfer in the urban canopy that includes tree without a high computational cost [37]. We developed this model for application to the GS and GW cases. We validated the MMRT model with measured MRT data to verify the use of this model at the study site. Finally, we performed sensitivity tests to confirm that the selected adaptation strategies had an MRT mitigation effect using the MMRT model (Supplementary Materials).
In the MMRT model, MRT is calculated using air temperature, solar radiation, relative humidity, dew point temperature and cloud fraction [37]. We used fixed values of humidity, dew point temperature and cloud fraction to simplify the calculation under the assumption of a clear day (Table 3). These fixed values were obtained from the Korea Automatic Weather Station collected on DOY 169 in 2017. Solar radiation is an important variable that influences MRT, but this is difficult to predict for the future because solar radiation can vary depending on the ozone layer and aerosol or gas distribution [44]. Furthermore, Lau et al. [10] found that changes in solar radiation had little effect on changes in MRT because of the small changes in solar radiation anticipated in the future. Therefore, we calculated solar radiation using date and time information and used the fixed value across the study’s timespan [45]. In addition, we used air temperature as a non-fixed variable to express the climate change, as explained in Section 2.4.

2.4. Climate Change Mitigation Scenarios

Based on predictions of future global warming, researchers have produced the Representative Concentration Pathways (RCPs), which comprise a set of four greenhouse gas concentration trajectories that jointly span a large range of plausible human-caused climate forcing, from 2.6 W/m2 (RCP2.6) to 8.5 W/m2 (RCP8.5) by the end of the 21st century [46]. Based on the Coupled Model Intercomparison Project Phase 5 (CMIP5) ensemble, each RCP provides a warming scenario. RCP2.6 represents the closest pathway to the 1.5 °C climate change mitigation pathway described in the Intergovernmental Panel on Climate Change (IPCC) special report (i.e., a median warming of 1.6 °C by 2100) [47], whereas RCP8.5 represents a business-as-usual scenario with no mitigation efforts, and an increase in temperature over 3 °C [48]. Therefore, we selected RCP2.6 and RCP8.5 for this study to assess the differences in extreme heat impacts and adaptation effects between no (RCP8.5) and ambitious (RCP2.6) mitigation efforts. This study used daily maximum air temperature in the downscaled RCP2.6 and RCP8.5, which are the results from mechanical and statistical downscaling methods. First, the global climate model (HadGEM2-A0) results were downscaled to the national scale. Then, the results were further downscaled to the South Korea scale (1 × 1 km) results using MK-PRISM [49]
We considered mid-term future impacts up to the 2050s as the target for our predictions. After 2050, the urban environment is likely to be rebuilt, and may differ substantially from the current situation; therefore, the adaptation strategies selected for this investigation might not be applicable to longer-term predictions. We predicted future extreme heat and the effects of adaptation measures from the 2020s (2015–2024) to the 2050s (2045–2054) in 10-year increments. Because we restricted the occurrence of the extreme heat season from June to August, only 92 days each year (920 days per decade) were analyzed.

3. Results

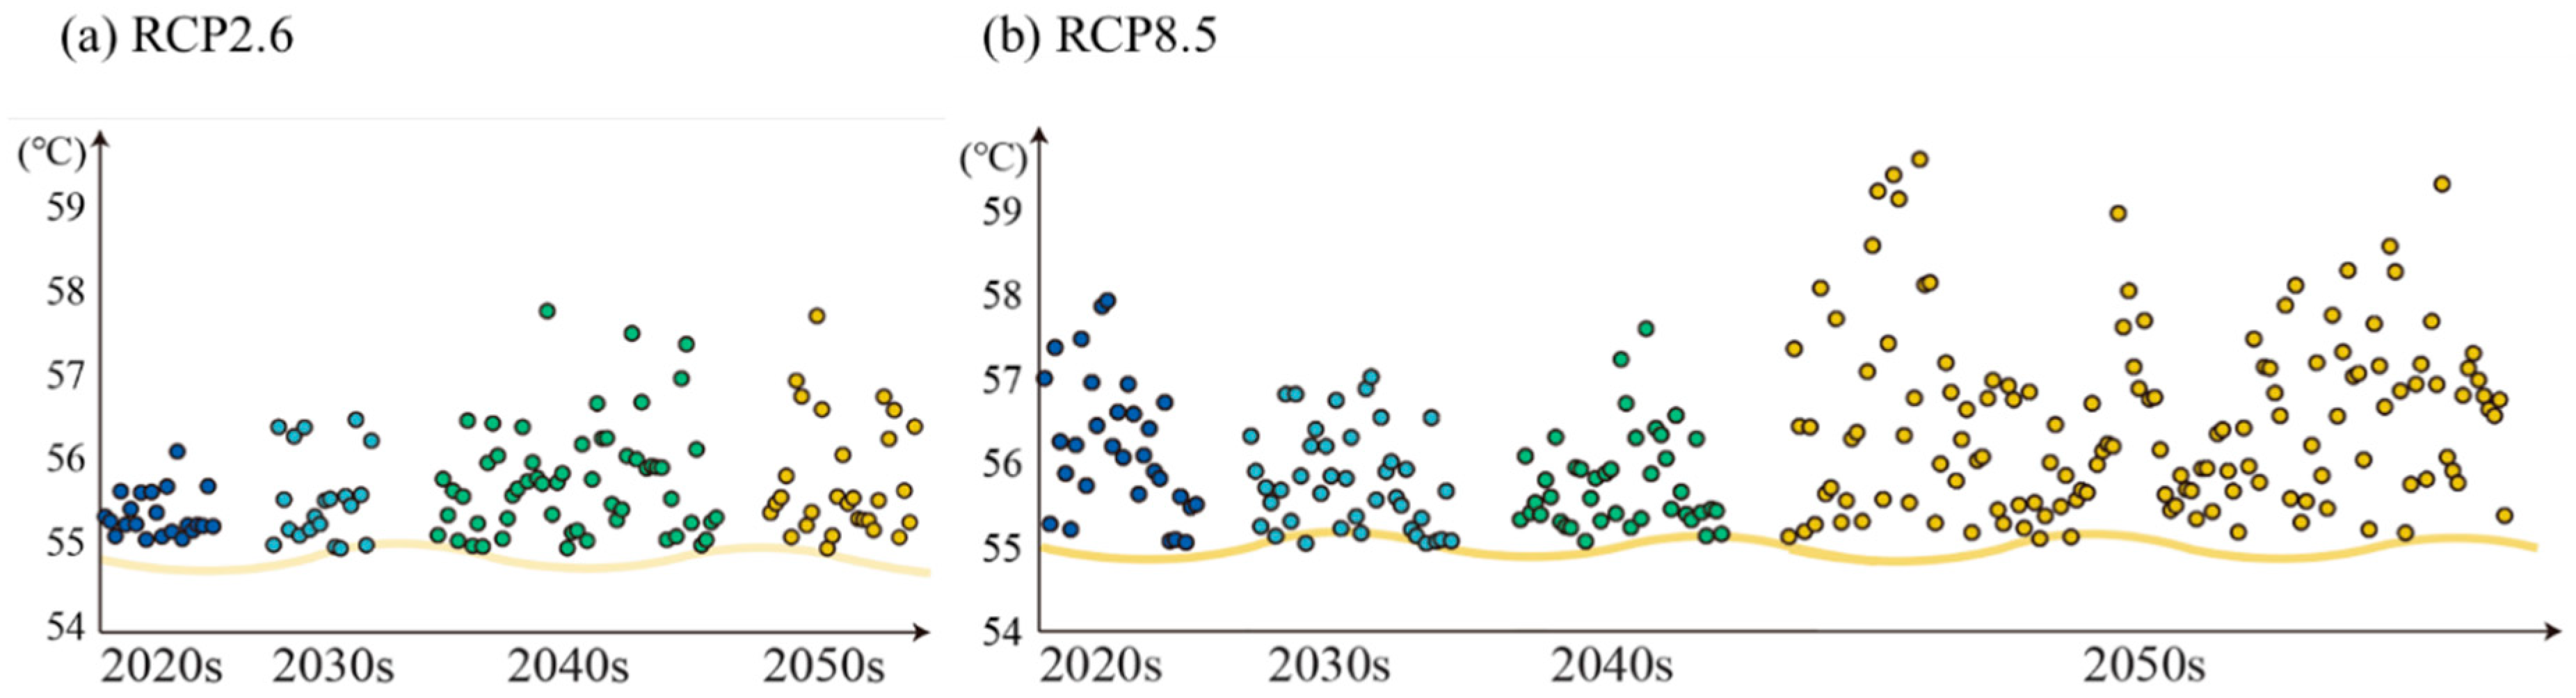
3.1. Extreme Heat Impact under Climate Change

Table 4 shows the extreme heat impacts due to climate change. Under RCP2.6, EHD and AMRT show small increases in the 2040s and 2050s. Therefore, we should be prepared for a few additional days of high heat loads in the 2040s to 2050s compared to the 2020s and 2030s (Figure 3). However, the increase observed under RCP8.5 was much larger than that observed under RCP2.6. In RCP8.5, EHD and AMRT increases drastic in the 2050s. EHD increased by more than 100 days compared with the 2020s. Furthermore, a high MRT, exceeding 59 °C, appeared under RCP8.5, representing an increased risk of mortality [40]. These results show that both the frequency and magnitude of extreme heat will increase by the 2050s if no mitigation efforts are undertaken.

3.2. Effects of Adaptation Strategies

All four street-level adaptation strategies could reduce the impact of extreme heat under both RCP2.6 and RCP8.5. However, even with such strategies, EDH and AMRT tend to increase in the 2050s, and increases are larger under RCP8.5.
GS, GW and SA show similar effects under RCP2.6. All three strategies reduce the EHD to below 10 days; that is, implementing such strategies would reduce the number of extreme heat events to less than 10 days per decade. Furthermore, the AMRT during the remaining extreme heat events would be lower than or similar to that without implementing the adaptation strategies (Table 5). In terms of frequency and magnitude, adaptation strategies could reduce both the frequency and the magnitude of extreme events.
Under RCP8.5, GS, GW and SA could reduce EHD to below 11 days until the 2040s; however, EHD would still rise drastically to 59–87 days in the 2050s (Table 6). On EHDs in the 2050s, pedestrians would experience an AMRT of about 56 °C. Thus, these three strategies would not be sufficient for Jangwee-ro to adapt to RCP8.5 in the 2050s.
Unlike the three aforementioned strategies, ST could allow Jangwee-ro to overcome all extreme heat events. Even though 20 trees on each side of the street is a relatively low number of trees, it could very effectively reduce the MRT. Thus, creating shade in walking spaces could help reduce the risk of mortality. However, the shade provided by these street trees is not continuous along the streets, unlike the other strategies; therefore, MRT could vary along the length of the street. Thus, to create a more continuous shade effect, more trees should be planted.

4. Discussion

4.1. Mitigation Scenarios and Adaptation Strategies

We analyzed the impact of climate change based RCP2.6 and RCP8.5 to compare the differences in the effect of adaptation strategies under these two mitigation scenarios. At the study site, if the ambitious mitigation scenario were realized (RCP2.6), by the 2050s, air temperature would increase to 1.0 °C above the level by the 2020s. However, under a business-as-usual scenario (RCP8.5), temperature would increase by 2.8 °C. These results indicate that climate change impacts can differ drastically as a result of mitigation efforts. Tebaldi and Wehner [48] also highlighted that the lower emission scenario(RCP4.5) could significantly reduce extreme heat compared with the high emission scenario (RCP8.5). This different impact depending on mitigation efforts leads to different economic effects [2].
Therefore, when establishing adaptation plans, it is very important to consider mitigation efforts. Unlike adaptation, mitigation is a global issue, and local areas cannot control mitigation scenarios in isolation; thus, it is difficult to confidently determine target mitigation scenarios. As such, depending on the situation and the ability of a local area, decision-makers might decide to develop ‘aggressive’ adaptation strategies, which could better address more severe impacts of climate change, such as those expected under RCP8.5.

4.2. The Need for Innovative Adaptation Strategies

Local governments have difficulties in introducing new technologies and strategies. Therefore in South Korea and most other countries, most decision-makers select adaptation strategies that have been used previously. However, a lack of strategy options lower the capacity for adaptation [50], and the expansion of new options is recognized as an important step toward transformative adaptation [51]. To introduce new strategies, researchers must determine and validate the effects of new strategies. For instance, the local government adaptation inventory in South Korea did not include SA; however, the present study revealed that it had a similar beneficial effect as GW and GS in terms of pedestrian mortality risk. Meanwhile, GW and GS might offer more advantages than SA because of their additional benefits to the environment (e.g., reducing air pollution) [52]. Regardless, in cases where implementing GW or GS strategies is not feasible, SA could be a viable alternative.
In addition to making greater efforts in analyzing the effects of innovative adaptation strategies, identifying and making new adaptation inventories have been initiated by various actors. Research has identified community-based adaptation strategies as an effective means of development and for improving the capacity of development [53]. This is especially pertinent to developing countries that must take immediate adaptation actions. As an initiative to track, share, and guide climate adaptation best practices, the European Union’s Climate Adapt and the United Nations Framework Convention on Climate Change Climate Technology Centre & Network platforms provide an open-source web-based inventory of adaptation technologies for reference. Such efforts will provide local governments with a wide selection of effective strategies to choose from.

4.3. Decision-Making for Local Adaptation Strategies

It is important to determine the effects of adaptation strategies on local scales to aid decision-making; this can be difficult for policy-makers presented with complex scenario and climate change data that is hard to understand [54]. Most local governments worldwide are unaware of available information on and effectiveness of different adaptation strategies [55]. Therefore, researchers should create tools to evaluate the effectiveness of adaptation strategies and report actual results from on-ground implementation or research-based information [53]. Developed countries provide regional scale impact assessments, but rarely provide regional impact assessments and adaptation effects. This study developed an assessment method of the effect of adaptation strategies at the street-level. Although the present study could not evaluate the effect of all adaptation strategies, instead focusing on four promising methods, and the results are limited to the targeted study site, the research method can be applied elsewhere to assist in developing local-scale climate change adaptation plans based on verified quantitative results. Globally-developed adaptation platforms (e.g., CoastAdapt for Australia, A-PLAT for Japan, etc.) can build on these efforts.
Furthermore, local impact assessments face issues of uncertainty stemming from the use of climate change scenarios. Diverse simulation methods also result in a wide range of uncertainty in climate change scenarios [56]. Climate change scenarios are simulated on a global scale for a very long projection period, which results in a large spatial resolution that must be downscaled for local applications. High resolution is important, but results in major obstacles when performing predictions on large spatial scales [57]. McDermott & Surminski [58] argued that applying a global data model to the local scale can provide a coarse assessment. Thus, the present study has the limitation of a high uncertainty of downscaling data to the local scale associated with extreme heat events. Conversely, despite the importance of uncertainty, too much information could overwhelm and impede decision-making [59]. In this study, for decision-making purposes, the results show how the frequency and magnitude trends changed in response to the adoption of different adaptation strategies under two RCPs using EHD and AMRT as simple, straightforward criteria. Future studies should design further methodologies that can support local-scale decision-making of climate change adaptations while reducing uncertainty.

5. Conclusions

We analyzed the effects of four adaptation strategies on reducing mortality risk due to increased extreme heat events until the 2050s, with a focus on a single street in Seoul, South Korea. The different effects of these adaptation strategies depending on the climate change mitigation scenario at the local scale were then compared. We calculated the frequency and magnitude of extreme heat events associated with a mortality risk using MRT. We found that extreme heat, especially the frequency, slightly increased under RCP2.6, but dramatically increased under RCP8.5 by the 2050s. All four investigated adaptation strategies (GS, GW, SA, and ST) could alleviate the increase in extreme heat under RCP2.6 to reduce the EHD to below 10 days and the AMRT to below 55.88 °C by the 2050s. However, under RCP8.5, GS, GW, and SA could not provide any adequate adaptation effects by the 2050s, and only ST offered sufficient reductions in the impacts for entire investigated timespan. Based on these results, we discussed the meaning of the information to support decision making for local adaptation planning. First, we found that a varying degree of adaptation strategies must be implemented according to the impacts of climate change depending on the mitigation scenario. Aggressive adaptation measures must be taken to meet the future challenges of climate change, given less-ambitious mitigation scenarios. Also, identifying innovative adaptation options based on the quantification of their effects according to various climate change scenarios can be useful for responding to climate change. However, this study focused on a specific site in Seoul, and the projected climate impacts and the calculated adaptation effects may differ according to the target site. Thus, further research on the methodology used in this study is warranted to better translate it into a decision making support tool.

Supplementary Materials

The following are available online at https://www.mdpi.com/2071-1050/11/14/3801/s1, Figure S1: Measurement sites (red dots) at the study site used for the MMRT validation [60]; Figure S2: Results of the sensitivity test of the investigated adaptation strategies; Table S1: Controlled variables and sensitivity test range of adaptation strategies.

Author Contributions

The study was designed by C.Y.P., D.K.L. and C.Y.P. simulated and visualized the results, C.Y.P., J.H.H. wrote the discussion under the supervision of D.K.L., D.K.L. acquired funding.

Funding

This work was supported by the Korea Agency for Infrastructure Technology Advancement (KAIA) [grant number 19AUDP-B102406-05] and by the BK 21 Plus Project in 2019 (Seoul National University Interdisciplinary Program in Landscape Architecture, Global Leadership Program toward innovative green infrastructure).

Acknowledgments

RCPs and AWS data used for the study were from Korea Meteorological Administration.

Conflicts of Interest

The authors declare no conflict of interest.

References

  1. Battisti, A.; Laureti, F.; Zinzi, M.; Volpicelli, G. Climate mitigation and adaptation strategies for roofs and pavements: A case study at Sapienza University Campus. Sustainability 2018, 10, 3788. [Google Scholar] [CrossRef]
  2. Martinich, J.; Crimmins, A. Climate damages and adaptation potential across diverse sectors of the United States. Nat. Clim. Chang. 2019, 9, 397–404. [Google Scholar] [CrossRef]
  3. Pasimeni, M.R.; Valente, D.; Zurlini, G.; Petrosillo, I. The interplay between urban mitigation and adaptation strategies to face climate change in two European countries. Environ. Sci. Policy 2019, 95, 20–27. [Google Scholar] [CrossRef]
  4. Allen, M.R.; Dube, O.P.; Solecki, W.; Aragón-Durand, F.; Cramer, W.; Humphreys, S.; Kainuma, M.; Kala, J.; Mahowald, N.; Mulugetta, Y.; et al. Framing and Context. In Global Warming of 1.5 °C. An IPCC Special Report on the Impacts of Global Warming of 1.5 °C above Pre-Industrial Levels and Related Global Greenhouse Gas Emission Pathways, in the Context of Strengthening the Global Response to the Threat of Climate Change, Sustainable Development, and Efforts to Eradicate Poverty; Masson-Delmotte, V., Zhai, P., Pörtner, H.-O., Roberts, D., Skea, J., Shukla, P.R., Pirani, A., Moufouma-Okia, W., Péan, C., Pidcock, R., et al., Eds.; Intergovernmental Panel on Climate Change: Geneva, Switzerland, 2018. [Google Scholar]
  5. Fazey, I.; Carmen, E.; Chapin, F.S.; Ross, H.; Rao-Williams, J.; Lyon, C.; Connon, I.L.C.; Searle, B.A.; Knox, K. Community resilience for a 1.5 °C world. Curr. Opin. Environ. Sustain. 2018, 31, 30–40. [Google Scholar] [CrossRef]
  6. Baker, I.; Peterson, A.; Brown, G.; McAlpine, C. Local government response to the impacts of climate change: An evaluation of local climate adaptation plans. Landsc. Urban Plan. 2012, 107, 127–136. [Google Scholar] [CrossRef] [Green Version]
  7. Chapman, S.; Watson, J.E.M.; Salazar, A.; Thatcher, M.; McAlpine, C.A. The impact of urbanization and climate change on urban temperatures: A systematic review. Landsc. Ecol. 2017, 32, 1921–1935. [Google Scholar] [CrossRef]
  8. Wu, J.; Zhou, Y.; Gao, Y.; Fu, J.S.; Johnson, B.A.; Huang, C.; Kim, Y.-M.; Liu, Y. Estimation and Uncertainty Analysis of Impacts of Future Heat Waves on Mortality in the Eastern United States. Environ. Health Perspect. 2013, 10, 1–6. [Google Scholar] [CrossRef] [PubMed]
  9. Perkins, S.E.; Alexander, L.V.; Nairn, J.R. Increasing frequency, intensity and duration of observed global heatwaves and warm spells. Geophys. Res. Lett. 2012, 39, 1–5. [Google Scholar] [CrossRef]
  10. Lau, K.K.L.; Lindberg, F.; Rayner, D.; Thorsson, S. The effect of urban geometry on mean radiant temperature under future climate change: A study of three European cities. Int. J. Biometeorol. 2015, 59, 799–814. [Google Scholar] [CrossRef]
  11. Matthews, T.K.R.; Wilby, R.L.; Murphy, C. Communicating the deadly consequences of global warming for human heat stress. Proc. Natl. Acad. Sci. USA 2017, 114, 3861–3866. [Google Scholar] [CrossRef] [Green Version]
  12. Ali, S.; Eum, H., II; Cho, J.; Dan, L.; Khan, F.; Dairaku, K.; Shrestha, M.L.; Hwang, S.; Nasim, W.; Khan, I.A.; et al. Assessment of climate extremes in future projections downscaled by multiple statistical downscaling methods over Pakistan. Atmos. Res. 2019, 222, 114–133. [Google Scholar] [CrossRef]
  13. Chapman, S.; Thatcher, M.; Salazar, A.; Watson, J.E.M.; McAlpine, C.A. The impact of climate change and urban growth on urban climate and heat stress in a subtropical city. Int. J. Climatol. 2019, 39, 3013–3030. [Google Scholar] [CrossRef] [Green Version]
  14. Founda, D.; Varotsos, K.V.; Pierros, F.; Giannakopoulos, C. Observed and projected shifts in hot extremes’ season in the Eastern Mediterranean. Glob. Planet. Chang. 2019, 175, 190–200. [Google Scholar] [CrossRef]
  15. Min, S.K.; Son, S.W.; Seo, K.H.; Kug, J.S.; An, S., II; Choi, Y.S.; Jeong, J.H.; Kim, B.M.; Kim, J.W.; Kim, Y.H.; et al. Changes in weather and climate extremes over Korea and possible causes: A review. Asia-Pac. J. Atmos. Sci. 2015, 51, 103–121. [Google Scholar] [CrossRef]
  16. Kim, D.W.; Deo, R.C.; Chung, J.H.; Lee, J.S. Projection of heat wave mortality related to climate change in Korea. Nat. Hazards 2016, 80, 623–637. [Google Scholar] [CrossRef]
  17. Klemm, W.; Heusinkveld, B.G.; Lenzholzer, S.; van Hove, B. Street greenery and its physical and psychological impact on thermal comfort. Landsc. Urban Plan. 2015, 138, 87–98. [Google Scholar] [CrossRef]
  18. Salata, F.; Golasi, I.; Vollaro, A.D.L.; Vollaro, R.D.L. How high albedo and traditional buildings’ materials and vegetation affect the quality of urban microclimate. A case study. Energy Build. 2015, 99, 32–49. [Google Scholar] [CrossRef]
  19. Ng, E.; Chen, L.; Wang, Y.; Yuan, C. A study on the cooling effects of greening in a high-density city: An experience from Hong Kong. Build. Environ. 2012, 47, 256–271. [Google Scholar] [CrossRef]
  20. Yuan, J.; Emura, K.; Farnham, C. Is urban albedo or urban green covering more effective for urban microclimate improvement? A simulation for Osaka. Sustain. Cities Soc. 2017, 32, 78–86. [Google Scholar] [CrossRef]
  21. Taleghani, M.; Sailor, D.J.; Tenpierik, M.; van den Dobbelsteen, A. Thermal assessment of heat mitigation strategies: The case of Portland State University, Oregon, USA. Build. Environ. 2014, 73, 138–150. [Google Scholar] [CrossRef] [Green Version]
  22. Lai, D.; Liu, W.; Gan, T.; Liu, K.; Chen, Q. A review of mitigating strategies to improve the thermal environment and thermal comfort in urban outdoor spaces. Sci. Total Environ. 2019, 661, 337–353. [Google Scholar] [CrossRef] [PubMed]
  23. Manteghi, G.; bin Lamit, H.; Ossen, D.R. Influence of Street Orientation and Distance to Water Body on Microclimate Temperature Distribution in Tropical Coastal City of Malacca. Int. J. Appl. Environ. Sci. 2015, 10, 749–766. [Google Scholar]
  24. Zölch, T.; Maderspacher, J.; Wamsler, C.; Pauleit, S. Using green infrastructure for urban climate-proofing: An evaluation of heat mitigation measures at the micro-scale. Urban For. Urban Green. 2016, 20, 305–316. [Google Scholar] [CrossRef]
  25. Aryal, A.; Shrestha, S.; Babel, M.S. Quantifying the sources of uncertainty in an ensemble of hydrological climate-impact projections. Theor. Appl. Climatol. 2019, 135, 193–209. [Google Scholar] [CrossRef]
  26. Aminipouri, M.; Rayner, D.; Lindberg, F.; Thorsson, S.; Knudby, A.J.; Zickfeld, K.; Middel, A.; Krayenhoff, E.S. Urban tree planting to maintain outdoor thermal comfort under climate change: The case of Vancouver’s local climate zones. Build. Environ. 2019, 158, 226–236. [Google Scholar] [CrossRef]
  27. Kim, E.; Jeon, S.-W.; Lee, J.-W.; Park, Y.-H.; Lee, D.-K. Local Adaptation Plan to Climate Change Impact in Seoul: Focused on Heat Wave Effects. J. Environ. Impact Assess. 2012, 21, 71–80. [Google Scholar]
  28. Shashua-Bar, L.; Pearlmutter, D.; Erell, E. The influence of trees and grass on outdoor thermal comfort in a hot-arid environment. Int. J. Climatol. 2011, 31, 1498–1506. [Google Scholar] [CrossRef]
  29. Di Napoli, C.; Pappenberger, F.; Cloke, H.L. Verification of heat stress thresholds for a health-based heatwave definition. J. Appl. Meteorol. Climatol. 2019, 58, 1177–1194. [Google Scholar] [CrossRef]
  30. Foudi, S.; Spadaro, J.V.; Chiabai, A.; Polanco-Martínez, J.M.; Neumann, M.B. The climatic dependencies of urban ecosystem services from green roofs: Threshold effects and non-linearity. Ecosyst. Serv. 2017, 24, 223–233. [Google Scholar] [CrossRef]
  31. Lee, J. The Present Status and Issues of Local Government Adaptation Plans for Climate Change: Focusing on the Health Sector. Korean J. Environ. Health Sci. 2017, 43, 111–121. [Google Scholar] [CrossRef] [Green Version]
  32. Lee, H.; Mayer, H. Thermal comfort of pedestrians in an urban street canyon is affected by increasing albedo of building walls. Int. J. Biometeorol. 2018, 62, 1199–1209. [Google Scholar] [CrossRef] [PubMed]
  33. Taleghani, M.; Tenpierik, M.; Van Den Dobbelsteen, A.; Sailor, D.J. Heat in courtyards: A validated and calibrated parametric study of heat mitigation strategies for urban courtyards in the Netherlands. Sol. Energy 2014, 103, 108–124. [Google Scholar] [CrossRef]
  34. Bradley, A.V.; Thornes, J.E.; Chapman, L.; Unwin, D.; Roy, M. Modelling spatial and temporal road thermal climatology in rural and urban areas using a GIS. Clim. Res. 2002, 22, 41–55. [Google Scholar] [CrossRef] [Green Version]
  35. Shahidan, M.F.; Jones, P.J.; Gwilliam, J.; Salleh, E. An evaluation of outdoor and building environment cooling achieved through combination modification of trees with ground materials. Build. Environ. 2012, 58, 245–257. [Google Scholar] [CrossRef]
  36. Hendel, M.; Parison, S.; Grados, A.; Royon, L. Which pavement structures are best suited to limiting the UHI effect? A laboratory-scale study of Parisian pavement structures. Build. Environ. 2018, 144, 216–229. [Google Scholar] [CrossRef] [Green Version]
  37. Park, C.Y.; Lee, D.K.; Krayenhoff, E.S.; Heo, H.K.; Ahn, S.; Asawa, T.; Murakami, A.; Kim, H.G. A multilayer mean radiant temperature model for pedestrians in a street canyon with trees. Build. Environ. 2018, 141, 298–309. [Google Scholar] [CrossRef]
  38. Lee, S. Further Development of the Vegetated Urban Canopy Model Including a Grass-Covered Surface Parametrization and Photosynthesis Effects. Bound.-Layer Meteorol. 2011, 140, 315–342. [Google Scholar] [CrossRef]
  39. Park, C.Y.; Lee, D.K.; Krayenhoff, E.S.; Heo, H.K.; Hyun, J.H.; Oh, K.; Park, T.Y. Variations in pedestrian mean radiant temperature based on the spacing and size of street trees. Sustain. Cities Soc. 2019, 48, 1–9. [Google Scholar] [CrossRef]
  40. Thorsson, S.; Rocklöv, J.; Konarska, J.; Lindberg, F.; Holmer, B.; Dousset, B.; Rayner, D. Mean radiant temperature—A predictor of heat related mortality. Urban Clim. 2014, 10, 332–345. [Google Scholar] [CrossRef]
  41. Monteiro, A.; Carvalho, V.; Oliveira, T.; Sousa, C. Excess mortality and morbidity during the July 2006 heat wave in Porto, Portugal. Int. J. Biometeorol. 2013, 57, 155–167. [Google Scholar] [CrossRef]
  42. Martilli, A.; Clappier, A.; Rotach, M.W. An urban surface exchange parameterisation for mesoscale models. Bound.-Layer Meteorol. 2002, 104, 261–304. [Google Scholar] [CrossRef]
  43. Krayenhoff, E.S.; Christen, A.; Martilli, A.; Oke, T.R. A Multi-Layer Radiation Model for Urban Neighbourhoods with Trees. Bound.-Layer Meteorol. 2014, 151, 139–178. [Google Scholar] [CrossRef]
  44. Williamson, C.E.; Zepp, R.G.; Lucas, R.M.; Madronich, S.; Austin, A.T.; Ballaré, C.L.; Norval, M.; Sulzberger, B.; Bais, A.F.; McKenzie, R.L.; et al. Solar ultraviolet radiation in a changing climate. Nat. Clim. Chang. 2014, 4, 434–441. [Google Scholar] [CrossRef]
  45. Allen, R.G.; Pereira, L.S.; Raes, D.; Smith, M.; Ab, W. Crop Evapotranspiration—Guidelines for Computing Crop Water Requirements—FAO Irrigation and Drainage Paper 56; FAO: Rome, Italy, 1998; ISBN 9251042195. [Google Scholar]
  46. Van Vuuren, D.P.; Edmonds, J.; Kainuma, M.; Riahi, K.; Thomson, A.; Hibbard, K.; Hurtt, G.C.; Kram, T.; Krey, V.; Lamarque, J.F.; et al. The representative concentration pathways: An overview. Clim. Chang. 2011, 109, 5–31. [Google Scholar] [CrossRef]
  47. Collins, M.; Knutti, R.; Arblaster, J.; Dufresne, J.-L.; Fichefet, T.; Friedlingstein, P.; Gao, X.; Gutowski, W.J.; Johns, T.; Krinner, G.; et al. Long-term Climate Change: Projections, Commitments and Irreversibility. In Climate Change 2013: The Physical Science Basis. Contribution of Working Group I to the Fifth Assessment Report of the Intergovernmental Panel on Climate Change; Stocker, T.F., Qin, D., Plattner, G.-K., Tignor, M., Allen, S.K., Boschung, J., Nauels, A., Xia, Y., Bex, V., Midgley, P.M., Eds.; Cambridge University Press: Cambridge, UK; New York, NY, USA, 2013. [Google Scholar]
  48. Tebaldi, C.; Wehner, M.F. Benefits of mitigation for future heat extremes under RCP4.5 compared to RCP8.5. Clim. Chang. 2018, 146, 349–361. [Google Scholar] [CrossRef]
  49. Kim, M.-K.; Lee, D.-H.; Kim, J. Production and Validation of Daily Grid Data with 1km Resolution in South Korea. J. Clim. Res. 2013, 8, 13–25. [Google Scholar]
  50. Dow, K.; Berkhout, F.; Preston, B.L.; Klein, R.J.T.; Midgley, G.; Shaw, M.R. Limits to adaptation. Nat. Clim. Chang. 2013, 3, 305–307. [Google Scholar] [CrossRef]
  51. Colloff, M.J.; Martín-lópez, B.; Lavorel, S.; Locatelli, B.; Gorddard, R.; Longaretti, P.; Walters, G.; Van Kerkhoff, L.; Wyborn, C.; Coreau, A.; et al. Environmental Science & Policy An integrative research framework for enabling transformative adaptation. Environ. Sci. Policy 2017, 68, 87–96. [Google Scholar]
  52. Dover, J.W. Green Infrastructure. Incorporating Plants and Enhancing Biodiversity in Buildings and Urban Environments; Routledge: Abingdon, UK, 2015; ISBN 9780415521239. [Google Scholar]
  53. McNamara, K.E.; Buggy, L. Community-based climate change adaptation: A review of academic literature. Local Environ. 2017, 22, 443–460. [Google Scholar] [CrossRef]
  54. Pilli-Sihvola, K.; van Oort, B.; Hanssen-Bauer, I.; Ollikainen, M.; Rummukainen, M.; Tuomenvirta, H. Communication and use of climate scenarios for climate change adaptation in Finland, Sweden and Norway. Local Environ. 2015, 20, 510–524. [Google Scholar] [CrossRef]
  55. Miller, D.D.; Ota, Y.; Sumaila, U.R.; Cisneros-Montemayor, A.M.; Cheung, W.W.L. Adaptation strategies to climate change in marine systems. Glob. Chang. Biol. 2018, 24, e1–e14. [Google Scholar] [CrossRef] [PubMed]
  56. Rogelj, J.; Meinshausen, M.; Knutti, R. Global warming under old and new scenarios using IPCC climate sensitivity range estimates. Nat. Clim. Chang. 2012, 2, 248–253. [Google Scholar] [CrossRef]
  57. Weaver, C.P.; Lempert, R.J.; Brown, C.; Hall, J.A.; Revell, D.; Sarewitz, D. Improving the contribution of climate model information to decision making: The value and demands of robust decision frameworks. Wiley Interdiscip. Rev. Clim. Chang. 2013, 4, 39–60. [Google Scholar] [CrossRef]
  58. McDermott, T.K.J.; Surminski, S. How normative interpretations of climate risk assessment affect local decision-making: An exploratory study at the city scale in Cork, Ireland. Philos. Trans. R. Soc. A Math. Phys. Eng. Sci. 2018, 376, 20170300. [Google Scholar] [CrossRef] [PubMed]
  59. Pedde, S.; Kok, K.; Hölscher, K.; Frantzeskaki, N.; Holman, I.; Dunford, R.; Smith, A.; Jäger, J. Advancing the use of scenarios to understand society’s capacity to achieve the 1.5 degree target. Glob. Environ. Chang. 2019, 56, 75–85. [Google Scholar] [CrossRef]
  60. Thorsson, S.; Lindberg, F.; Eliasson, I.; Holmer, B. Different methods for estimating the mean radiant temperature in an outdoor under setting. Int. J. Climatol. 2007, 27, 1983–1993. [Google Scholar] [CrossRef]
Figure 1. Schematic diagram describing the research flow.
Sustainability 11 03801 g001
Figure 2. Map and photos of the study site, Jangwee-ro, a 755-m-long street in Seoul, Korea.
Sustainability 11 03801 g002
Figure 3. Daily maximum MRT exceeding 55 °C under (a) RCP2.6 and (b) RCP8.5. Each circle represents a day, and the colors represent each decade (dark blue: 2020s, light blue: 2030s, green: 2040s, yellow: 2050s).
Sustainability 11 03801 g003
Table 1. Inventory of local adaptation strategies to counteract extreme heat.
CategoryExamplesCapacity for Urban Heat ReductionCapacity for Pedestrian Heat Load Reduction
Green areaUrban forest, urban oasis, urban farm, park, street greenery, greenway, street tree, roadside green area, ecological rest area, cool share square, green wall
Building roofCool roof, green roofX
WateringCooling fog, cool road (watering road), waterscape facility (fountain)
Gray infrastructureHeat shelter (buildings), heat shade on the streetX
Table 2. Adaptation strategies investigated in this study.
Name (ID)DescriptionIllustration
Greenway sidewalk (GS)Convert a 1.5-m stretch of sidewalk into grass. Grass height = 0.3 m, albedo = 0.205, emissivity = 0.93 [34]. Sustainability 11 03801 i001
Green wall (GW)Convert a building wall into a green wall. Grass height = 0.3 m, albedo = 0.205, emissivity = 0.93 [34]. Sustainability 11 03801 i002
Reduced-albedo sidewalk (SA)Lower the albedo of sidewalk from 0.65 (gray granite [35]) to 0.3 (dark granite [36]). Sustainability 11 03801 i003
Street tree (ST)Plant 20 street trees on each side of the road to a total leaf area density of the street of 0.13. Tree height = 7 m, canopy width = 4 m, leaf albedo = 0.18 [37], emissivity = 0.96 [38]. Sustainability 11 03801 i004
Table 3. Input variables used to calculate mean radiant temperature (MRT) (RCP = Representative Concentration Pathways).
Variable typeVariableValue/Component
Fixed variableDew point temperature (°C)10.1
Relative humidity (0–1)0.29
Cloud fraction (0–1)0
Time (LST)13:00
Non-fixed variableAir temperatureDaily maximum air temperature of RCP2.6 and RCP 8.5
Date (DOY)152–243
Solar radiationFunction of time and date
Table 4. Changes in extreme heat frequency and magnitude under different climate change scenarios, where EHD = extreme heat days and AMRT = average mean radiant temperature.
Mitigation ScenarioHealth Criterion2020s2030s2040s2050s
RCP2.6EHD (days/10 years)22205729
AMRT (°C)55.4055.6055.8155.83
RCP8.5EHD (days/10 years)304141138
AMRT (°C)56.1855.7655.7456.47
Table 5. Effect of adaptation strategies under RCP2.6.
Adaptation StrategyHealth Criterion2020s2030s2040s2050s
GSEHD (days/10 years)0477
AMRT (°C)-55.1555.5755.54
GWEHD (days/10 years)03410
AMRT (°C)-55.1455.7255.88
SAEHD (days/10 years)051010
AMRT (°C)-55.4055.7055.87
STEHD (days/10 years)0000
AMRT (°C)----
Table 6. Effect of adaptation strategies under RCP8.5.
Adaptation StrategyHealth Criterion2020s2030s2040s2050s
GSEHD (days/10 years)104987
AMRT (°C)55.6855.1955.4356.10
GWEHD (days/10 years)75959
AMRT (°C)55.6755.2755.4455.99
SAEHD (days/10 years)115774
AMRT (°C)55.6555.2455.5056.11
STEHD (days/10 years)0000
AMRT (°C)----

