Article

The Threshold Effect of China’s Financial Development on Green Total Factor Productivity

School of Management, China University of Mining and Technology, Xuzhou 221116, China
*
Author to whom correspondence should be addressed.
Sustainability 2019, 11(14), 3776; https://doi.org/10.3390/su11143776
Submission received: 4 June 2019 / Revised: 4 July 2019 / Accepted: 6 July 2019 / Published: 10 July 2019

Abstract

:
Using the slacks-based measure (SBM) directional distance function and constructing the Luenberger productivity index, we measure the green total factor productivity (GTFP) of China’s provinces under resource and environmental restrictions. At the same time, based on the provincial panel data, the threshold regression method is used to empirically analyze the impact of financial development on green total factor productivity and its threshold effect. The study explores how technological innovation, foreign direct investment (FDI), and environmental governance affect green total factor productivity, as well as how financial development plays a role in the direction and intensity of the impact, with a view to providing policy recommendations for promoting green economic development. The results show that: (1) during the sample period, China’s green total factor productivity had an overall upward trend, and pure technological progress was the main reason for the growth in the green all-factor growth rate; (2) taking financial development as a threshold dependent variable, financial development had a nonlinear, double-threshold effect on green total factor productivity and diminishing marginal efficiency; (3) the increase in financial development will help attract high-quality and low-pollution FDI inflows, and can exert a technology spillover from FDI to green total factor productivity; (4) the impact of technological innovation on green total factor productivity has a nonlinear feature, with significant positive and increasing marginal efficiency; and (5) there is a positive “U” relationship between environmental governance and green total factor productivity.

1. Introduction

Economic growth has always been an issue of concern for scholars at home and abroad. Neoclassical economists believe that the long-term economic growth of a society can be summarized into two factors: production factors that are driven by input (extensive economic growth), and improving the efficiency of production factors (intensive economic growth). Since its reform and opening up in 1978, China has maintained rapid economic growth, with an average annual growth rate in gross domestic product (GDP) of over 8%. However, this has had a toll in terms of environmental damage. For a long time, China’s rapid economic growth has relied mainly on high investment in production factors such as capital, labor, and energy, while the contribution rate of production factors to economic growth is low. It is a typical model of extensive economic growth (Krugman, 1994 [1]; Arayama and Miyoshi, 2004 [2]; Jin Tao, Tracer Peak, 2005 [3]; Lei Hui, 2006 [4]). This pattern of economic growth has brought about a series of problems such as energy shortage, environmental pollution, and a diminishing marginal return of factors. Therefore, Chinese factor expansion drive-driven economic growth model is increasingly difficult to sustain. The Chinese “13th Five-Year Plan” put forward five development concepts of “innovation, coordination, green, openness, and sharing”. Among them, green development was first proposed as a national policy, putting the ecological environment in a very important position. A win–win development of the green economy and the environment is the key to dealing with the relationship between economic development, culture, resource utilization, environmental protection, and social progress, and achieving sustainable economic development in China. Zhang Rongfan (2014) [5] pointed out that promoting technological progress, improving production efficiency, and continuously expanding the contribution of green total factor productivity to economic growth are important ways to realize the transformation from epitaxial development to connotative development and promote the sustainable and healthy development of the Chinese economy. During the “Two sessions (the National People’s Congress and the Chinese People’s Political Consultative Conference)” in 2016, General Secretary Xi Jinping proposed that “promoting the supply-side structural reform is a hard battle. To grasp the relationship between ‘addition’ and ‘subtraction’, it’s necessary to promote the steady growth of the economic aggregate by increasing the input of factors; it’s also necessary to promote structural adjustment, reduce inefficient and low-end supply, expand effective and medium-to-high-end supply, and improve total factor productivity.” Green total factor productivity is the main source of power for green economic growth and an important indicator for measuring the quality of Chinese green development. Promoting the growth of green total factor productivity is inseparable from the support of financial development.
In the modern market economy, financial development has four basic functions: mobilizing savings; allocating resources; diversifying risks; and stimulating, supervising, and restraining. It is also a driving force for green total factor productivity growth. The rapid development of the financial market can support the green industry on a larger scale of funds and give full play to the financial mobilization and savings function, thereby increasing the output of the green industry and contributing to the improvement of green total factor productivity. Capital allocation is the core function of finance. Through financial resource allocation, limited financial resources can be flowed out from low-efficiency and high-pollution enterprises to high-efficiency enterprises. The core of green total factor productivity is green technology innovation, but is often accompanied by high risks and high returns. If the company’s research and development (R&D) activities can be funded from the financial market, then investors can share the huge benefits of successful R&D with the company. At the same time, the risk of R&D failure is shared, which increases the incentives for enterprises to carry out green technology research and development, and ultimately helps improve green total factor productivity. In the process of financial development supporting green total factor productivity growth, the direct financing represented by the securities market and the indirect financing represented by the bank are inclined to the enterprises of the green industry through the formulation of relevant support policies, as well as the disclosure of relevant information regarding the production, operation, and finance of enterprises, and strictly restricting credit support to polluting enterprises that promote, supervise, and restrict the production and operation of enterprises, thereby promoting the improvement of green total factor productivity.
China’s financial industry has developed steadily and healthily in the 40 years since the country’s reform and opening up. From 1998 to 2017, the deposits and loans of financial institutions in China have increased year by year, as shown in Figure 1. However, the increase in deposits has been significantly greater than the increase in loans, which means that financial efficiency, which is expressed as the loan balance, is higher than the deposit balance. As of January 2019, the balance of domestic and foreign currency loans was 145.1 trillion yuan, which was a year-on-year increase of 12.8%, and the balance of domestic and foreign currency deposits was 185.8 trillion yuan, which was a year-on-year increase of 7.2%. The total scale of social financing in China has also increased rapidly, from 2.0112 trillion yuan in 2002 to 20.508 trillion yuan in 2018: over a 100-fold increase. At the end of 2018, China had a total of 4588 banking financial institutions and 228,600 banking outlets. It also has 68 intermediary companies, 69 financial leasing companies, and 41 foreign-funded corporate banks. China today has a multi-level, multi-type financial intermediation system; moreover, the division of labor and cooperation complement the financial system. At the same time, the financial development model has gradually shifted to a green financial model. According to the “Report on the Investment of Financial Institutions in 2018” issued by the People’s Bank of China, green loans (denominated in either local or foreign currencies) in China amounted to about 8.23 trillion yuan in 2018, which was a year-on-year increase of 16%. Expenditures on green transportation projects and both renewable and clean energy were 3.83 trillion yuan and 2.07 trillion yuan, respectively, in that year, making positive contributions to both economic development and environmental protection.
With the ongoing reform of the economic system, the policy environment, institutional environment, and industrial environment for technological innovation in China have been continuously improved, creating a better external environment for an increase in green total factor productivity. However, technological innovation usually has the characteristics of high investment, high risk, high uncertainty, and only long-term returns on investment. Effective financial support for the promotion of green total factor productivity will be the key to solving China’s resource and environmental problems while still allowing further economic development.
Based on the previous research experience, this paper intends to expand the research from the following aspects. (1) First, the slacks-based measure (SBM) directional distance function and construction of the Luenberger productivity index will be used to measure the green total factor productivity (GTFP) of Chinese provinces and cities under the carbon emission constraint, and decompose it into pure efficiency change (GPEC), pure technology progress (GPTC), scale efficiency change (GSEC), and technology scale change (GSTC), in order to provide an in-depth study of the trend of Chinese provincial green total factor productivity GTFP and its decomposition indicators. (2) Based on the Hansen panel threshold model, a nonlinear panel data model with financial development as a threshold variable is constructed to empirically analyze the impact of financial development on green total factor productivity and its threshold effect. (3) Using the financial development level as a threshold variable, this paper will explore how technological innovation, foreign direct investment (FDI), and environmental governance affect green total factor productivity, and what role financial development plays in influencing the direction and intensity of influence.

2. Theoretical Analysis and Research Review

2.1. Measurement of Green Total Factor Productivity

The early method of measuring total factor productivity was the Shephard Output Distance Function (SDF). On the one hand, energy consumption and environmental pollution can be included in the measurement framework; on the other hand, it can solve the problem of underestimating production efficiency and overestimating factor input in the traditional data envelopment analysis (DEA) measurement process. Xu Jingqin, Yang Yongheng (2012) [6], Zhu Shujin, Xu Keruilin (2015) [7], and Zhou Rui (2013) [8] use this method to measure productivity. However, the SDF is a radial function that cannot be applied, whereas an increase in “good” output is accompanied by a decrease in “bad” output. The directional distance function (DDF) does not have this shortcoming. DDF was first used by Chung et al. (1997) [9] to estimate the total factor productivity of Swedish pulp mills. Emissions are incorporated into the efficiency analysis as a negative output, taking into account the forward expansion of desirable output and the reduction of emissions to the minimal frontier. A large number of empirical studies on green total factor productivity in various industries have used the DDF, such as Chen Shiyi (2010) [10], Chen Chaofan (2018) [11], Xu Xiaohong, and Wang Xia (2016) [12].
However, the traditional DDF model underestimates the inefficiency of the object of evaluation when there is non-zero relaxation input or output. To solve this problem, Fare [13] and Fukuyama [14] developed a more general non-radial and non-angle slacks-based measure (SBM). Their efficiency measurement model takes account of the undesirable output and relaxation problems, and is Tone’s [15] non-radial and non-angle efficiency measurement based on relaxation. Wang Bing, Wu Yanrui, Yan Pengfei (2010) [16], Li Ling, Tao Feng (2011) [17], Liu Huajun, Li Chao (2018) [18], Liu Zhuankuo, and Xin Li (2018) [19] as well as others have used the SBM directional distance function to measure China’s green total factor productivity. The summary of research measuring green total factor productivity is shown in Table 1.

2.2. Technological Innovation and Green Total Factor Productivity

A good financial system can not only protect the rights and interests of investors, but also motivate technology producers to strictly implement contract agreements by pre-assessment and post-regulation of technological innovation projects, which stimulates research and development (R&D) and improves green total factor productivity. Technological innovation plays a significant role in promoting the transition to a green economy in the economic growth pattern (Yang Zhijiang, Luo Zhanghua, 2019 [20]). Huang Yongchun and Shi Qiuping (2015) [21] found that traditional total factor productivity and innovative total factor productivity in the eastern region were higher than those in the central and western regions by measuring China’s traditional total factor productivity and innovative total factor productivity with R&D inputs, while using a Tobit model to analyze the influencing factors. The results show that the level of openness can promote the regional environmental total factor productivity, while the energy structure and regional environmental total factor growth rate are negatively correlated. The level of economic development and regional environmental total factor productivity show a “U” relationship. Wan Lunlai and Zhu Qin (2013) [22] empirically tested the impact of three methods of accessing new technology (independent R&D; import of foreign technology; adaptation of domestic high technology) on the green total factor productivity of the Chinese industry by using panel data from 1999 to 2010. The results show that independent R&D and the introduction of foreign technology significantly increase China’s industrial green total factor productivity, but domestic technology transformation has a relatively weak effect on China’s industrial green total factor productivity.

2.3. Foreign Direct Investment and Green Total Factor Productivity

An increase in the overall level of financial development can reduce the financing cost of enterprises, enable enterprises to better absorb the technology and knowledge contained in FDI, realize the transfer and diffusion of technology, and obtain technological spillover effects. It is also conducive to attracting high-quality, low-pollution FDI inflows and improving China’s green total factor productivity. In China’s opening up to the outside world, the role of FDI in enterprises is significant; that is, FDI can improve the global value chain embeddedness of enterprises and improve the total factor productivity of enterprises (Jiang Nengpeng, 2019 [23]). Zhong Juan and Zhang Qingliang (2010) [24] used time series data from 1983–2007 to construct a threshold model to explore the relationship between financial development and FDI technical spillover. They found that FDI has a significant positive effect on China’s technological progress, but FDI’s technical spillover has a significant “threshold effect” in financial development. All the above indicate that the financial system has an important impact on FDI and the technical spillover effect of FDI. Financial development plays an important role in the relationship between FDI and the growth of green total factor productivity.

2.4. Environmental Governance and Green Total Factor Productivity

It has traditionally been held that good environmental governance will increase the costs of production and make it difficult to expand the scale of production, thus reducing the level of productivity. However, a revisionist school holds that investment in technological innovation and pollution control is not only conducive to reducing the waste of raw materials and energy consumption, improving green total factor productivity, but also to meeting the demand for green products in the increasingly environmentally aware consumer market. Porter (1995) [25], Tang [26], and Mohr (2002) [27] found that strict and appropriate environmental governance will make enterprise productivity decline but then rise, and “innovation offset” and “first-mover advantage” can make up for the “compliance cost” of environmental governance. The “Porter hypothesis” has been partially verified in China [28,29,30]. Liu Hewang and Zuo Wenting (2016) [31] believed that there is a stable and significant inverted U-curve relationship between market-based environmental governance and green total factor productivity. However, the role of public participatory environmental governance is not obvious. Zhang Hailing, Zhang Zongbin, and Yan Fumei (2018) [32] selected 9038 samples of enterprises from 2007 to 2015 to build a two-way fixed effect model. The study found that the closer the enterprises’ technology is to the technology frontier, the more obvious the positive effect of environmental governance on TFP becomes.
Financial development plays an important role in the relationship between environmental governance and green total factor productivity. On the one hand, a higher level of financial development will encourage both government and enterprises to explore sources of funds for investment in environmental pollution control, and will provide strong financial support for enterprises to carry out pollution control. On the other hand, the level of financial development also affects the financing situation of local enterprises. When enterprises face financing constraints, they will reduce the scale of production, and will not increase investment in pollution control.
To sum up, financial development can influence green total factor productivity through the channels of technological innovation, FDI, and environmental governance, etc. As for the channel of technological innovation, a good financial system can not only protect investors’ rights and interests, but also urge technological producers to strictly implement contract agreements, stimulate R&D behavior, and improve green total factor productivity by the pre-evaluation and post-supervision of technological innovation projects (Wan Lunlai, Zhu Qin, 2013 [22]). At the same time, a higher level of financial development is also conducive to attracting high-quality, low-pollution FDI inflows and promoting the improvement of China’s green total factor productivity (Zhong Juan, Zhang Qingliang, 2010 [24]). In the channel of environmental governance, the improvement of financial development level can promote the government and enterprises to effectively explore the sources of funds for investment in environmental pollution control, provide strong financial support for enterprises to carry out environmental pollution control, and also effectively predict and evaluate the risk of investment in environmental pollution control (Zhang Hailing, Zhang Zongbin, Yan Fumei, 2018 [32].

2.5. Financial Development and Green Total Factor Productivity

The relationship between financial development, productivity, and economic growth has long been a matter of academic interest. Within the framework of neoclassical economic growth theory, financial development mainly affects economic growth by acting on capital accumulation, and it is considered that factor input is the main driving force of economic growth (Zheng Xiaoyong, 2004 [33]; Chen Jun, 2018 [34]). However, neoclassical economics is based on the assumption that there is complete financial market information, which is obviously not achievable (He Jingtong, Hao Shenyong, 2012 [35]; Liao Jia, 2011 [36]).
To explain the source of economic growth, Romer (1986) [37] pioneered the endogenous economic growth theory, arguing that an economy can achieve sustained growth without relying on external forces; rather, endogenous technological progress is the decisive factor in ensuring sustained economic growth. This provides a good theoretical basis for analyzing the relationship between financial development and growth in total factor productivity. The theory of endogenous economic growth argues that financial development promotes economic growth mainly in two ways: capital accumulation and growth in total factor productivity. Growth in total factor productivity plays an important role in maintaining long-term stable economic growth (Calderón, Liu, 2003 [38]; Rousseau, 2002 [39]; Bassem Kahouli, 2017 [40]; Tu Zhengge, 2007 [41]). However, when the level of financial development in a country or region is low, higher external financing costs hinder corporate technological innovation, which is a drag on both total factor productivity and economic growth (Gorodnichenko, 2013 [42]; Shen Kunrong, Sun Wenjie, 2004 [43]; Chen Gang, Li Shu, 2009 [44]). The impact of finance on productivity has direct negative effects and indirect positive effects mediated by R&D capital (Zhang Xiuyan, 2019 [45]).
In recent years, there has been an increasing number of studies on the relationship between financial development and green total factor productivity. However, there has been little consensus on the effects of financial development on green total factor productivity (Wang Xiaoteng, 2018 [46]). Chunbo Ma and David I. Stern (2008) [47] found that financial support for technological innovation is conducive to increasing both output per unit of energy consumption and the use of clean energy products, thereby promoting green total factor productivity. However, Cole (2005) [48] believed that the profit-seeking nature of capital makes financial resources flow to highly polluting industries, inhibiting green total factor productivity. Chami (2002) [49] believed that financial support for green total factor productivity growth has a certain cost.
In the report of the 19th National Congress, “green development” has risen to the national strategic level. Green total factor productivity is an important indicator to measure China’s green development, and this has led some Chinese scholars to focus on the relationship between financial development and green total factor productivity. The financial system promotes the development of low-pollution enterprises by allocating more financial resources to green development, solves the problem of insufficient long-term capital supply for technological innovation projects, promotes technological progress, and improves technical efficiency, thereby promoting the improvement of green total factor productivity (Wang Wei, 2017 [50]; Wang Wei, Sun Fangcheng, 2017 [51]; Friday 7th, 2018 [52]). Zhang Fan (2017) [53] found that financial development can simultaneously promote total factor productivity and green total factor productivity, but there was diminishing marginal efficiency. Moreover, the effect on total factor productivity is significantly higher than the effect on green total factor productivity, which means that undesirable outputs would likely exceed desirable outputs. However, capital independence and unrestrained profit-seeking lead to a large amount of capital flowing into high-return industries, weakening the financial industry’s function of financing low-pollution enterprises. Furthermore, green technology R&D will face high financing costs, and this will inhibit the growth of green total factor productivity (Ge Pengfei, 2018 [54]).
Based on the above, this paper uses panel data from provinces in China from 1998 to 2017 to study trends in China’s provincial green total factor productivity and its decomposition index, and analyzes the impact of financial development on green total factor productivity and its threshold effect. The paper explores how technological innovation, FDI, and environmental governance affect green total factor productivity, and what role financial development plays in influencing the direction and intensity of these effects, with a view to providing advice on policy to promote the greening of the economy.

3. Green Total Factor Productivity Measurement and Analysis

3.1. Green Total Factor Productivity Measurement Model

The study regards every region of China as a production decision-making unit (DMU), and constructs the optimal production frontier for each period, as shown in Equation (1). Suppose that each DMU uses N inputs to x = ( x 1 , , x n ) R N + produce M desirable outputs y = ( y 1 , , y M ) R M + and J undesirable outputs b = ( b 1 , , b J ) R J + ; then, the production possibility set:
P ( x ) = { ( y , b ) : x c a n p r o d u c e ( y , b ) } , x R N + , y R M + , b R J +
In order to fit the maximization of desirable output growth and the minimization of undesirable output simultaneously, the SBM directional distance function is set as follows:
S V t ( x t , k , y t , k , b t , k , g x , g y , g b ) = max s x , s y , s b 1 N n = 1 N s n x g m y + 1 M + 1 + [ m = 1 M s m y g m y + j = 1 J s i b g i b ] 2 s . t . k = 1 K λ k t x k n t + s n x = x k n t , n ; k = 1 K λ k t y k m t s m y = y k m t , m ; k = 1 K λ k t b k j t + s j b = b k j t , j ; k = 1 K λ k t = 1 , λ k t 0 , k ; s n x 0 , n ; s m y 0 , m ; s j b 0 , b
In Equation (2), S V t refers to the directional distance function of variable returns to scale (VRS). S C t refers to the directional distance function of constant returns to scale (CRS) if the constraint that the sum of the weighting variables is 1 is removed. ( g x , g y , g b ) and ( s n x , s m y , s j b ) refer to the directional vector and relaxation variable.
The study uses the SBM directional distance function to measure static efficiency, and then measures dynamic total factor productivity using the Luenberger index. Based on the analysis of Chambers et al. (1996) [55], the Luenberger productivity index of t-t+1 is as follows:
G T F P t t + 1 = 1 2 { [ s C t ( x t , y t , b t ; g ) s C t ( x t + 1 , y t + 1 , b t + 1 ; g ) ] + [ s C t + 1 ( x t , y t , b t ; g ) s C t + 1 ( x t + 1 , y t + 1 , b t + 1 ; g ) ] }
According to Grosskop’s suggestion, the Luenberger productivity index is decomposed into pure efficiency change (GPEC), pure technology progress (GPTC), scale efficiency change (GSEC), and technology scale change (GSTC).
G T F P = G P E C + G P T C + G S E C + G S T C
G P E C t t + 1 = s v t ( x t , y t , b t ; g ) s v t + 1 ( x t + 1 , y t + 1 , b t + 1 ; g )
G P T C t t + 1 = 1 2 { [ s v t + 1 ( x t , y t , b t ; g ) s v t ( x t , y t , b t ; g ) ] + [ s v t + 1 ( x t + 1 , y t + 1 , b t + 1 ; g ) s v t ( x t + 1 , y t + 1 , b t + 1 ; g ) ] }
G S E C t t + 1 = [ s C t ( x t , y t , b t ; g ) s V t ( x t , y t , b t ; g ) ] [ s C t + 1 ( x t + 1 , y t + 1 , b t + 1 ; g ) s v t + 1 ( x t + 1 , y t + 1 , b t + 1 ; g ) ]
G S T C t t + 1 = 1 2 { [ ( s C t + 1 ( x t , y t , b t ; g ) s v t + 1 ( x t , y t , b t ; g ) ) ( s C t ( x t , y t , b t ; g ) s v t ( x t , y t , b t ; g ) ) ] + [ ( s C t + 1 ( x t + 1 , y t + 1 , b t + 1 ; g ) s v t + 1 ( x t + 1 , y t + 1 , b t + 1 ; g ) ) ( s C t ( x t + 1 , y t + 1 , b t + 1 ; g ) s v t ( x t + 1 , y t + 1 , b t + 1 ; g ) ) ] }
GTFP, GPEC, GPTC, GSEC, and GSTC greater than (less than) 0 respectively indicate productivity growth (decline), technological efficiency improvement (decline), technology progress (regression), scale efficiency improvement (decrease), technology deviation from CRS (moving to CRS). The calculation of the Luenberger productivity index needs eight SBM directional distance functions to solve the linear programming under two different assumptions of CRS and VRS.

3.2. Green Total Factor Productivity Measurement Index and Data Sources

This study uses different methods to measure green total factor productivity, and then compares the results with empirical data on economic development drawn from across China over the period 1998 to 2017. In this paper, green total factor productivity is defined as follows. On the basis of traditional total factor productivity, energy consumption is regarded as one of the input factors (as well as the capital and labor), pollution emission as an unexpected output is included in the production function when calculating output, and the expected output increases and the unexpected output decreases are considered to measure and evaluate the growth quality of the economy. The input and output data of 30 provinces and municipalities directly under the Central Government (excluding Tibet, Hong Kong, Macao, and Taiwan, and the data of Chongqing merged in Sichuan Province) from 1997 to 2017 are selected to calculate the green total factor productivity of different regions. The data are from the China Statistical Yearbook (1999–2018), China Energy Statistical Yearbook (1999–2018), China Environmental Statistical Yearbook (1999–2018), and the Wind database. The relevant index and data processing of inputs, desirable outputs, and undesirable outputs are as follows:
(1) Input index. Labor time, labor efficiency, and the number of workers (the labor force) are all important factors in the labor input factor, L, but, because of the restricted availability of data, just the number of employees in each province is taken as the labor input index. The energy input, E, an intermediate input index, is taken as total energy consumption. The capital input factor K, following a suggestion from Zhang Jun (2004) [56], is derived using the perpetual inventory method to measure the current capital stock. The basic equation is as follows:
K i , t = I i , t + ( 1 δ i , t ) K i , t 1
In Equation (7), K i , t denotes the capital stock of region i in period t, K i , t 1 denotes the capital stock of region i in period t-1, I i , t denotes the investment in fixed assets, and δ i , t denotes the total depreciation rate of fixed capital. Based on the research results of Zhang Jun et al. (2004) [56], this paper assumes that the average life expectancy of buildings, equipment, and other types of investment is 45 years, 20 years, and 25 years, and the depreciation rates of the three are 6.9%, 14.9%, and 12.1% respectively. The proportion of these three types of capital goods in the total fixed assets are 63%, 29%, and 8%, respectively. On this basis, the economic depreciation rate of the total fixed capital formation of each province and city is calculated to be 9.6%.
(2) Output index. For desirable output, Y, the regional gross domestic product (GDP) of each province from 1997 to 2017 is selected. Carbon dioxide emissions are used to represent the undesirable output, B. Annual carbon dioxide emissions are estimated using the third reference method based on the energy performance consumption given by the Guidelines for National Greenhouse Gas Emissions Inventories (Intergovernmental Panel on Climate Change, 2006). Eight main energy sources (raw coal, coke, crude oil, fuel oil, gasoline, kerosene, diesel oil, and natural gas) were selected to estimate carbon emissions.

3.3. Measurement Results and Analysis of Green Total Factor Productivity

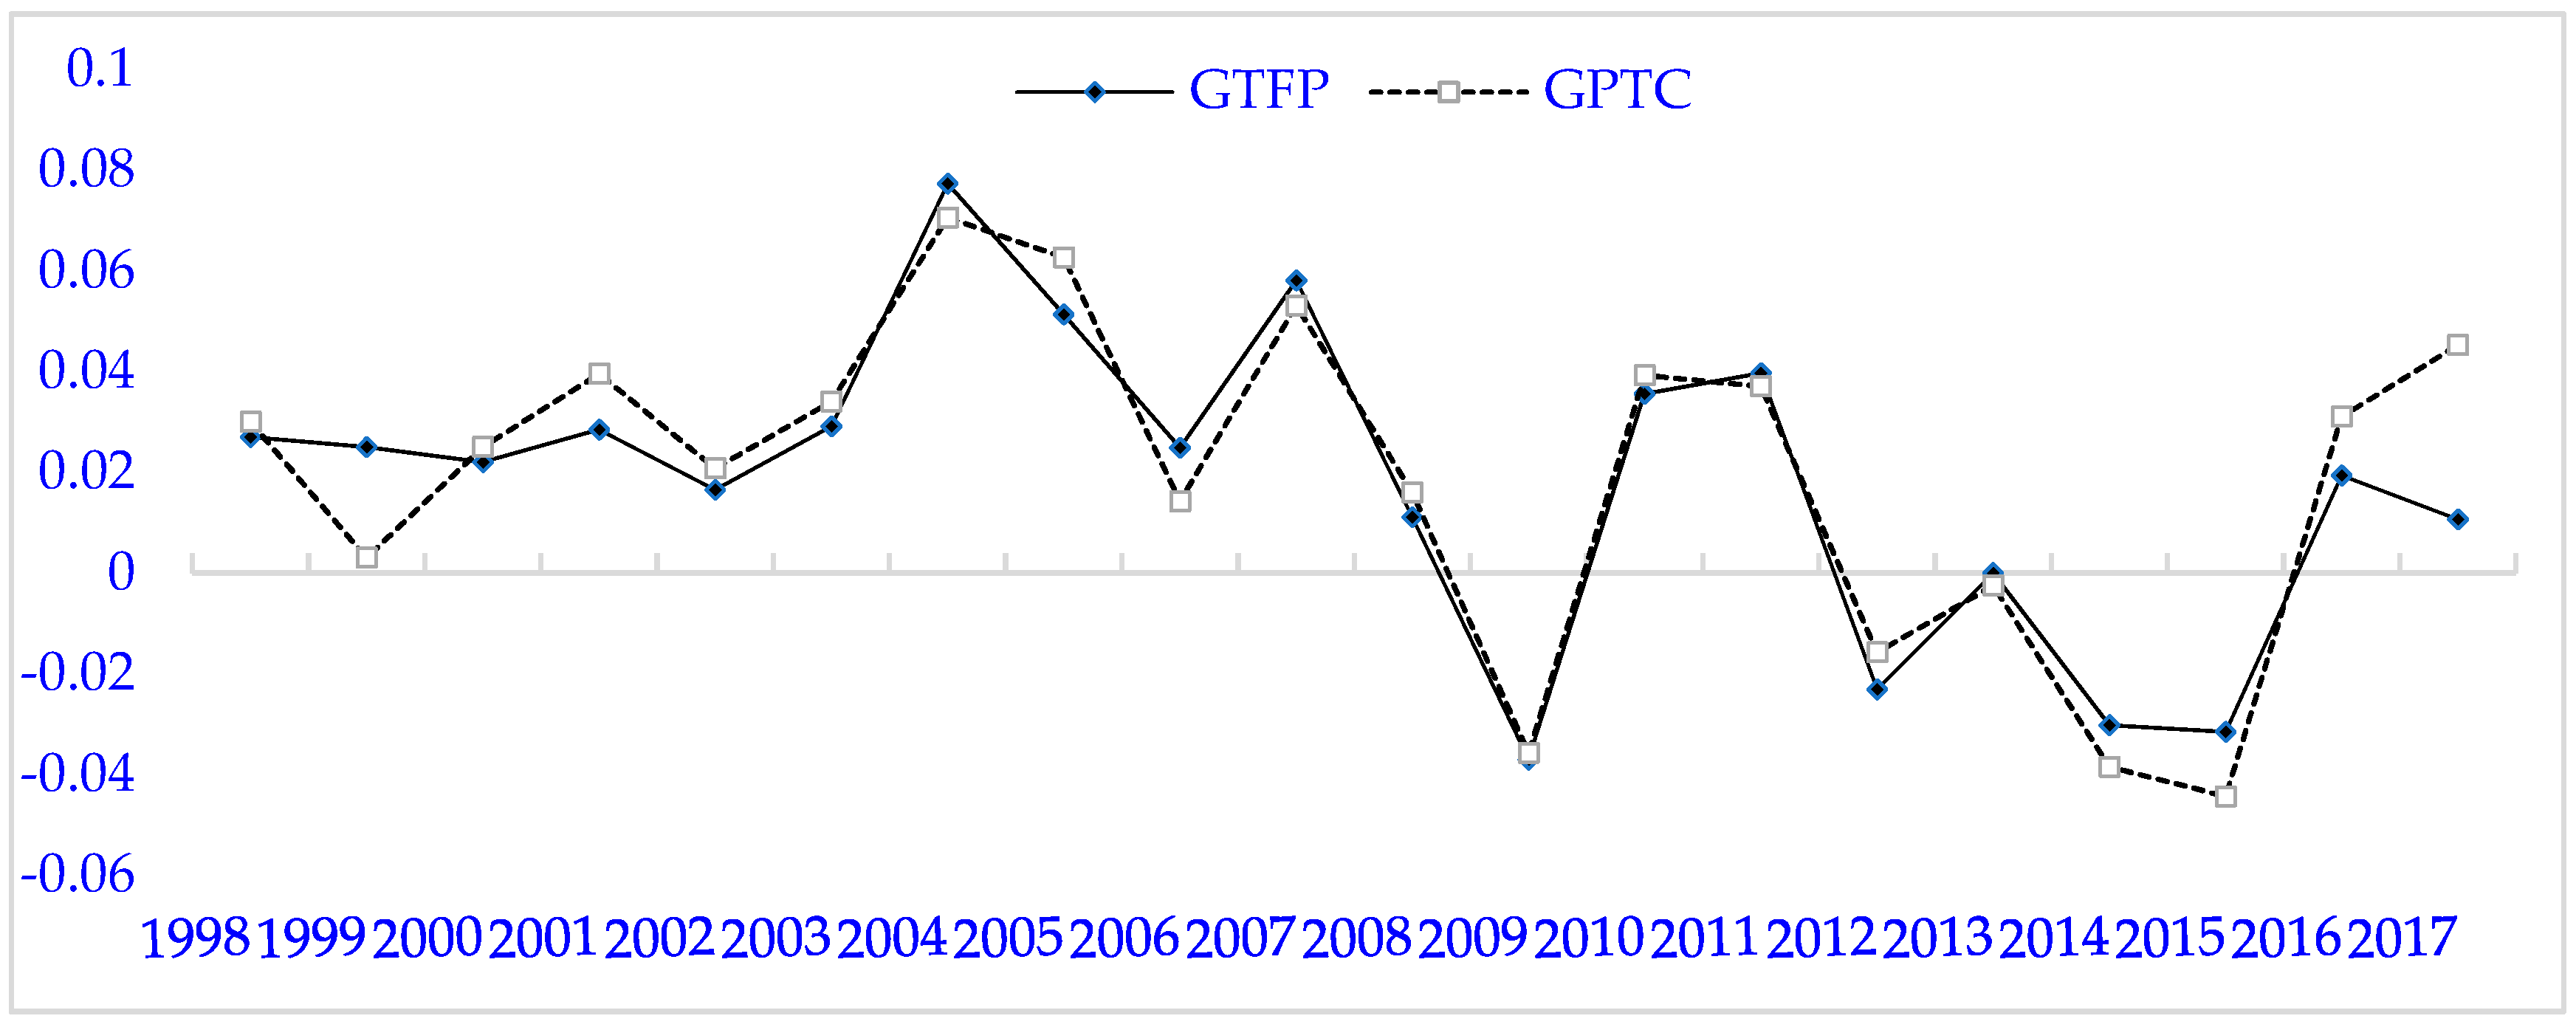
Max Data Envelopment Analysis (MaxDEA) software is used to find the green production inefficiency value using the SBM directional distance function model under the assumptions of CRS and VRS. On this basis, dynamic values for green total factor productivity are obtained that reflect change over time. The following empirical analysis is mainly based on the green total factor productivity. Figure 2 shows the trend in GTFP and its decomposition index from 1997 to 2017. The specific analysis is as follows:
Overall, China’s green total factor productivity growth rate for 1998–2017 was 1.77%, which is similar to Wang Bing’s (2010) [16] environmental total factor productivity of 1.8%. At the same time, the accounting results of this paper show that although there are short-term fluctuations in the growth rate of green total factor productivity in various regions of China during the sample period, the overall situation is flat. This reflects the Chinese economy’s achievements in optimizing the economic structure, transforming the economic development mode from extension to connotation, and sustainable development. However, it is still in the initial stage of the transition from the extensive economic growth model—which is driven by factor input—to the intensive model, which is driven by green total factor productivity. This is different from the model of Wang Feng and Xie Jin (2015) [57], which used the surpassing logarithmic production function to replace elasticity and concluded that China’s overall green total factor productivity growth is strong. The difference in results is not only because of differences in data processing and the sample review period, but also because the translogarithmic production function model needs to construct a concrete form of the production function. Based on this form, the least square method or the maximum likelihood method is used to measure the parameters in the function. The autonomous change elasticity of output over time is overestimated, and the output elasticity of labor is underestimated. The capital-to-labor, capital-to-energy, and labor-to-energy alternative elasticity values are all different from the ideal state (Wang Canxiong and Xie Zhizhong, 2014 [58]). At the same time, according to the decomposition results of green total factor productivity, the trend of pure technological progress and green total factor productivity is basically the same. This shows that pure technological progress is the main reason for the growth of green total factor productivity. This result is the same as that obtained by Liu Huajun et al. (2018) [59] and Gai Mei et al. (2016) [60] based on provincial panel data.
From the results of the decomposition of green total factor productivity, the trends for pure technological progress and green total factor productivity are basically the same, indicating that pure technological progress is the main reason for the growth in green total factor productivity. On the one hand, pure technological progress leads to an improvement of production technology, which in turn improves labor productivity; on the other hand, technological progress can improve resource allocation efficiency through R&D innovation and talent investment, and this will indirectly reduce carbon dioxide emissions and energy consumption per unit of GDP, and ultimately affect green total factor productivity.
Green total factor productivity was higher in 1997–2007, and the rate of change in pure efficiency slowed down. This was probably because there was no mature management system in the early stage of environmental regulation, which led to low management efficiency. However, the marginal abatement cost was low, which limited the effect on growth of green total factor productivity. China’s green total factor productivity has shown a significant downward trend since 2008, falling to a minimum of –3.7% in 2009, and has since been fluctuating around the frontier. The main reason for the decline in green total factor productivity is the significant decline in the pure technology progress, which may be because the 2008 financial crisis caused many factories in China to close down, and the technological progress of enterprises slowed down, eventually leading to a negative value of green total factor productivity.
From 2010 to 2017, the scale efficiency always fluctuated around the frontier, with no obvious upward or downward trend. The slow rise of technological scale means that the technological boundary is moving toward the technology of variable return to scale.

4. Empirical Analysis

4.1. Variable Selection and Description

The panel data of 30 provinces and municipalities directly under the central government (excluding Tibet, Hong Kong, Macao and Taiwan, and the data of Chongqing merged in Sichuan Province) from 1998 to 2017 are used. The variables studied are green total factor productivity (GTFP), financial development (FD), foreign direct investment (FDI), R&D, and environmental governance (EG) (Table 2).

4.2. Model

The model is based on Hansen’s (1999) panel threshold model, which is basically set as follows:
y i , t = μ i + β 1 x i , t I ( q i , t γ ) + β 2 x i , t I ( q i , t > γ ) + ε i , t
where i and t represent region and time, respectively; y i , t and x i , t are variables being explained and explained variables, respectively; μ i is individual effects; ε i , t I s a stochastic disturbance term, ε i , t ~ i i d N ( 0 , σ 2 ) ; β 1 and β 2 are regression coefficients, q i , t represent threshold variables, γ represents the threshold value, and I ( · ) is an indicative function, if q i , t γ , I = 1, otherwise I = 0.
Different levels of financial development have different effects on TFP. To study the relationship between FD and GTFP, as well as the threshold characteristics of the effect of FD on GTFP, a nonlinear panel data model based on a Hansen panel threshold model is constructed as model 1, which takes financial development as a threshold variable, as set out in Equation (9).
G T F P i , t = μ i + β 1 F D i , t 1 × I ( F D γ 1 ) + β 2 F D i , t 1 × I ( γ 1 < F D γ 2 ) + + β n + 1 F D i , t 1 × I ( F D > γ n ) + ε i , t
Financial intermediaries promote capital flow to high-income and high-risk technological innovation projects and promote technological progress by decentralizing risks, providing information, and reducing transaction costs. The healthy development of the financial sector helps reduce the cost of borrowing, promote the free flow of capital, and increase the inflow of FDI. Due to differences in the level of financial development among regions, FD is used as a threshold variable to explore the impact of technological innovation and foreign investment on green total factor productivity. Model 2 and model 3 are constructed as shown in Equations (10) and (11), respectively.
G T F P i , t = μ i + β 1 F D I i , t 1 × I ( F D γ 1 ) + β 2 F D I i , t 1 × I ( γ 1 < F D γ 2 ) + + β n + 1 F D I i , t 1 × I ( F D > γ n ) + ε i , t
G T F P i , t = μ i + β 1 ln R D i , t 1 × I ( F D γ 1 ) + β 2 ln R D i , t 1 × I ( γ 1 < F D γ 2 ) + + β n + 1 ln R D i , t 1 × I ( F D > γ n ) + ε i , t
A higher level of financial development can encourage government and enterprises to explore the funding of investment in environmental pollution control, help increase investment, and enhance the efficiency of investment, so as to obtain long-term economic benefits as compensation for investment in environmental pollution control. Model 4 is constructed to evaluate the impact of environmental governance on green total factor productivity under different levels of financial development (as a threshold variable), as shown in Equation (12).
G T F P i , t = μ i + β 1 E P I i , t 1 × I ( F D γ 1 ) + β 2 E P I i , t 1 × I ( γ 1 < F D γ 2 ) + + β n + 1 E P I i , t 1 × I ( F D > γ n ) + ε i , t

4.3. Empirical Tests

4.3.1. Data Stationarity Test and Co-Integration Test

Before the threshold effect analysis, Fisher-ADF, Fisher-PP, and IPS were first used to test the stationarity of variables in the sample interval. The test results are shown in Table 3. The results show that there are unit roots in the variables under the three tests, and after the first-order difference, each variable rejects the null hypothesis of unit roots at the 1% level of significance, which means the test is also significant at the 5% and 10% significance levels, so the series I (1) is integrated of order one.
On this basis, the Kao co-integration test for the long-term equilibrium relationship of each variable is carried out, again at the 1% significance level. At the same time, it means the test is also significant at the 5% and 10% significance levels. There is a long-term stable equilibrium relationship for each variable, as shown in Table 4.

4.3.2. Threshold Test Results

As set out above (Section 4.2), four threshold effect models are constructed. Firstly, using Stata14 software, the F-value and p-value are obtained by empirical testing for the existence of a single threshold, a double threshold, and a triple threshold, as shown in Table 5. On this basis, the threshold values of the four models need to be estimated and tested, and the results are shown in Table 6. The results show that model 1, with financial development as a threshold-dependent variable, has two thresholds, 1.731 and 3.803; model 2, with FDI as a threshold-dependent variable, has two thresholds, 2.346 and 3.193; model 3, with technological innovation as a threshold dependent variable, has two thresholds, 1.731 and 3.812; lastly, model 4, with environmental governance as a threshold dependent variable, has a single threshold, 1.731.

4.3.3. Threshold Regression

Table 7 presents the parameter estimates using model 1 and the panel threshold regression results. In model 1, which was constructed with financial development (FD) as the threshold dependent variable, financial development has a double threshold effect on green total factor productivity and a nonlinear, diminishing marginal efficiency. When the level of financial development is lower than the first threshold value of 1.731, the level of financial development has a significant (at the 10% level) and negative impact on green total factor productivity. Perhaps due to the low level of financial development, enterprises find it hard to finance green R&D, which reduces green total factor productivity. However, when the level of financial development is between 1.731–3.803, the coefficient is 0.0387, which indicates an increase in green total factor productivity (at the 1% significance level). When the level of financial development is higher than 3.803, the coefficient decreases to 0.0028, which indicates that FD still promotes the growth of green total factor productivity, but less so, and the level of significance drops again to 10%. This shows that the level of financial development shows the characteristics of diminishing marginal efficiency, which is similar to Zhang Fan’s (2017) [53] conclusion that the level of financial development has heterogeneous and nonlinear effects on green total factor productivity. Thus, the level of financial development shows the characteristics of diminishing marginal efficiency. This might be because people pay more attention to the economic benefits brought by financial development, which leads to an imbalance between finance and the real economy. That is, a large amount of capital is idle in the financial system, and does not enter the real economy. It reduces the ability of the financial industry to finance the real economy, and leads to high financing costs for green R&D. Nonetheless, the level of financial development should not be too high. The impact of the level of financial development on green total factor productivity has not only threshold characteristics, but also the effect of diminishing marginal efficiency.
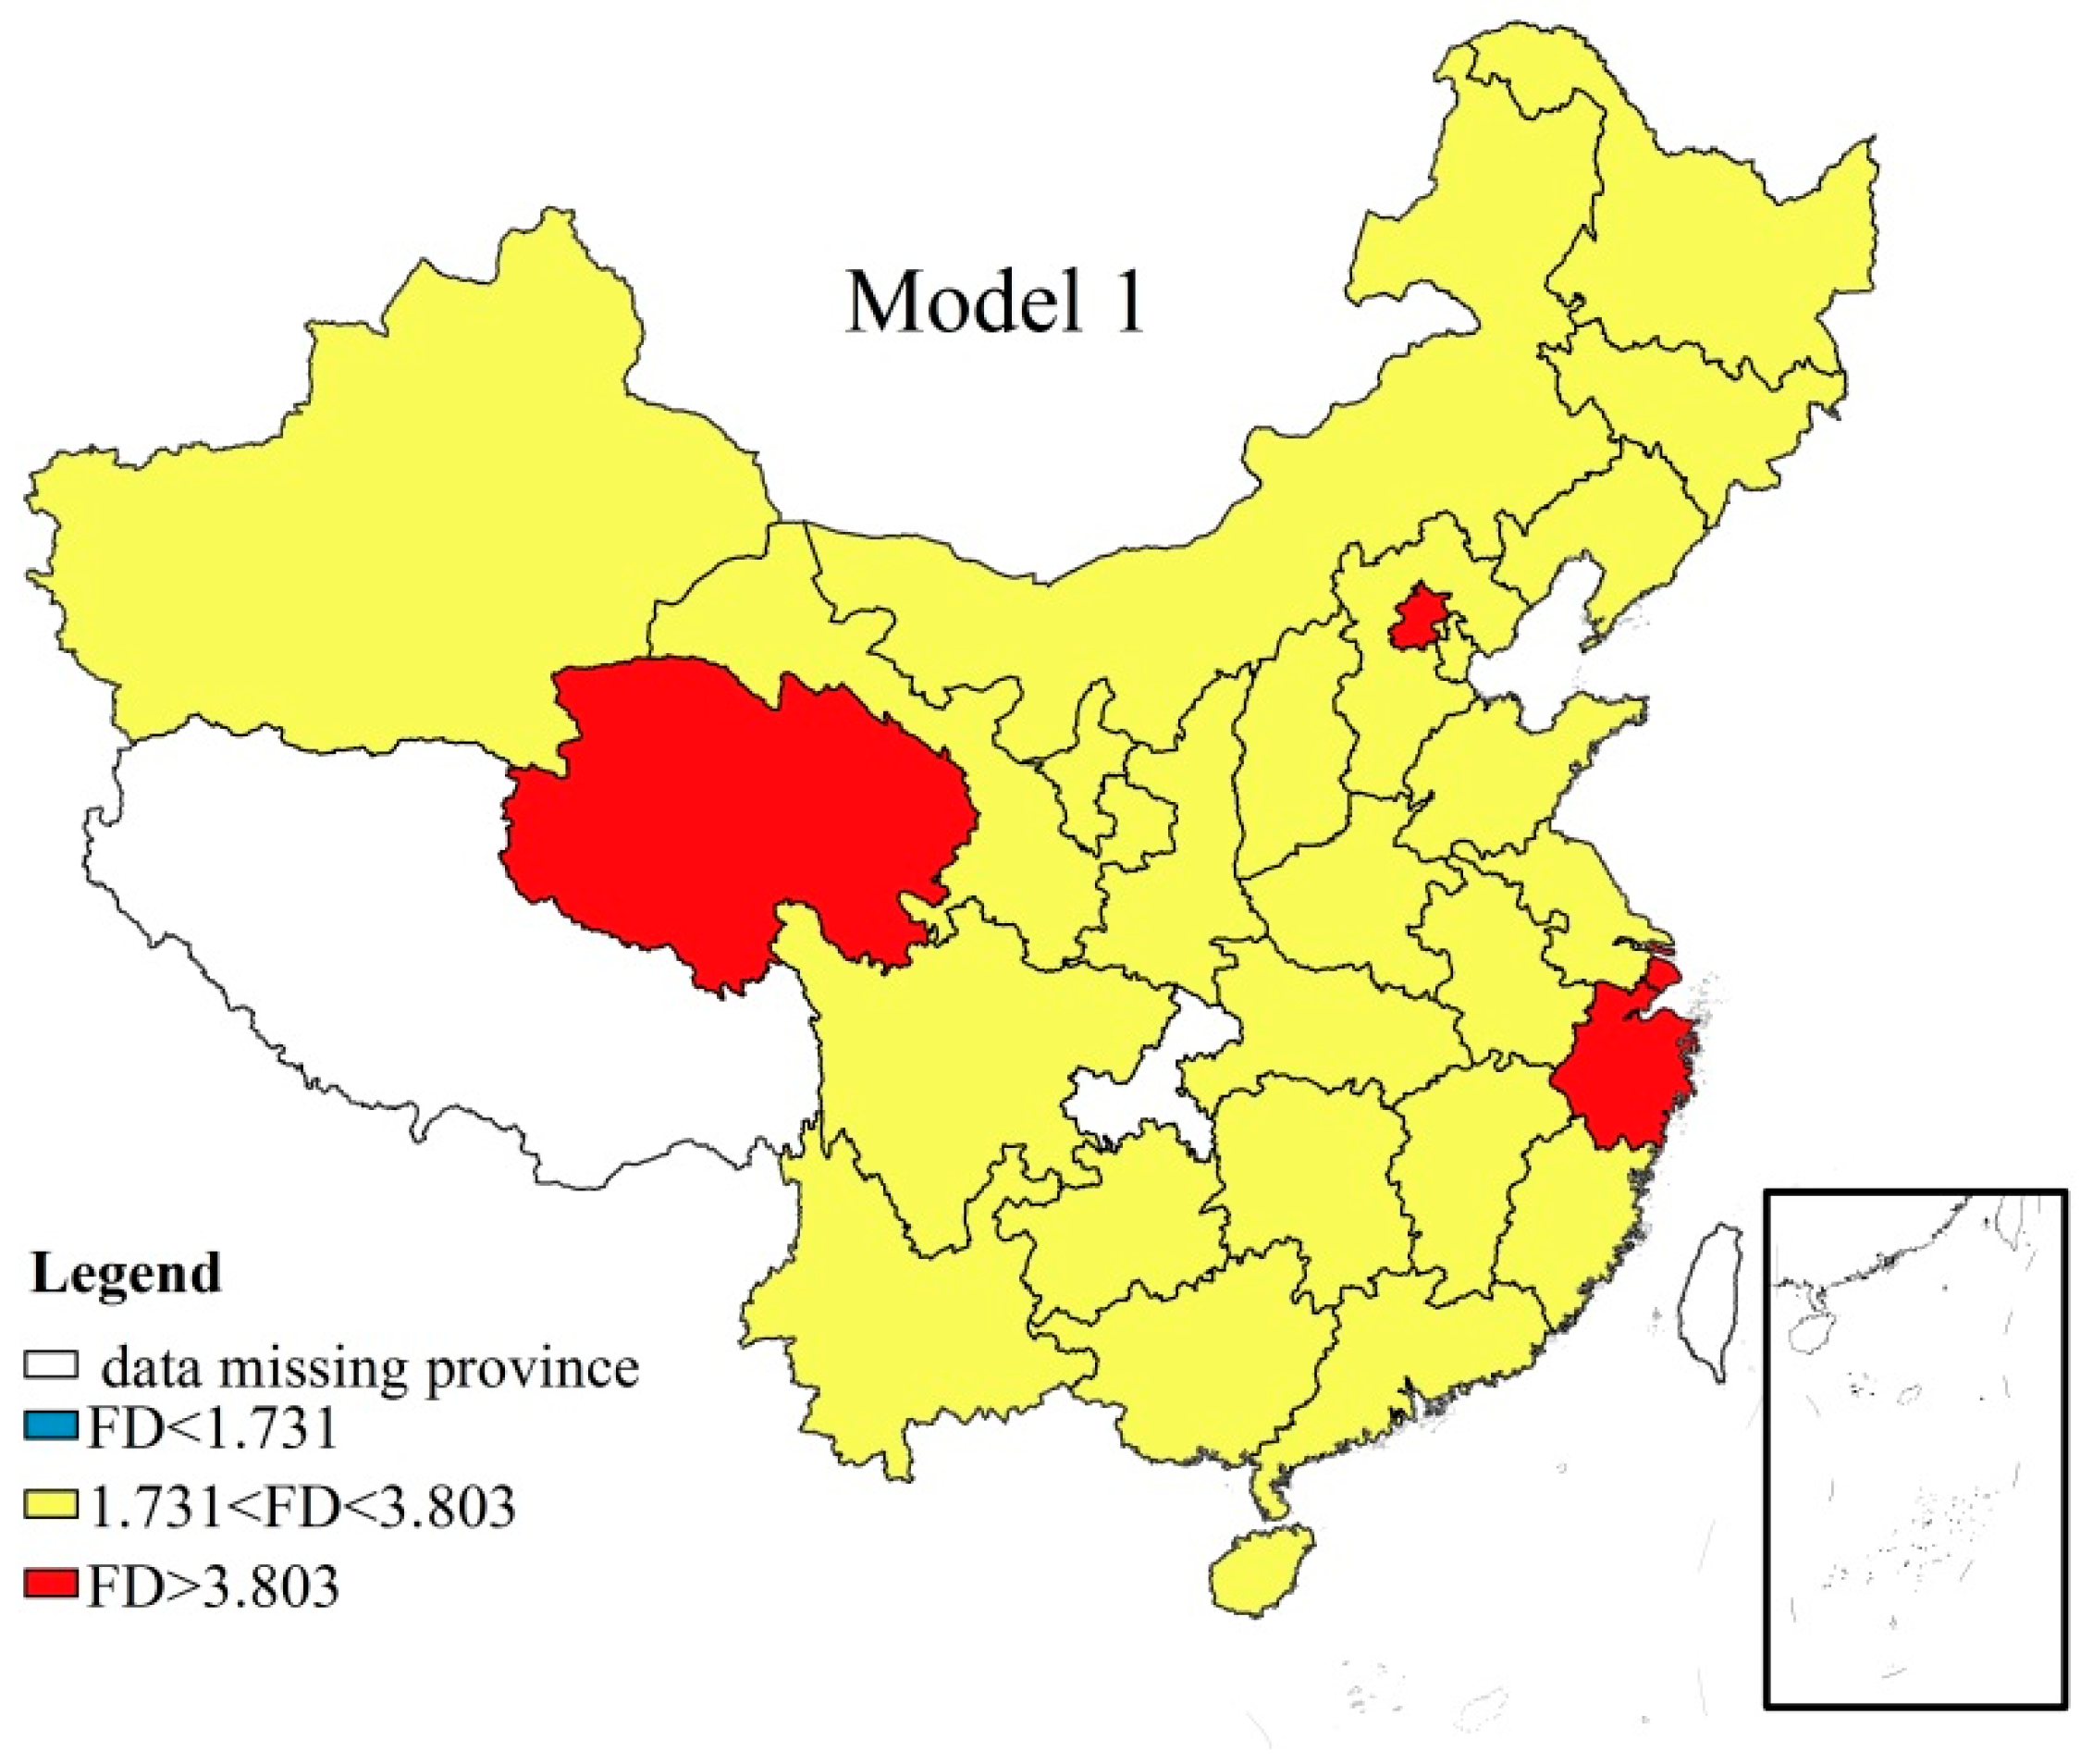
As can be seen from Table 7, 57 samples were at a low level of financial development, 477 samples were at a middle level, and 46 samples were at a high level during 1998–2017. In 2017, the financial development level of 30 provinces and municipalities in China had a positive impact on green total factor productivity. Among them, Beijing, Shanghai, Zhejiang, and Qinghai had a higher level of financial development. Using Arcgis 10.2 based on the threshold regression results of Table 7, the regional difference map is drawn to show the situation in which China’s provinces fall into different financial development thresholds in 2017, as shown in Figure 3.
Table 8 presents the parameter estimates using model 2, and shows that the impact of FDI on China’s green total factor productivity is significantly different at different levels of financial development. When the level of financial development is lower than the first threshold value of 2.346, the elasticity coefficient of FDI is significantly negative, which indicates that when the level of financial development is low, the green innovative technology introduced through the FDI channel is less, and is not enough to support the improvement of China’s green productivity level. When the financial development level is between 2.346–3.193, FDI’s coefficient of elasticity changes from negative to positive, but is not significant. That is, the positive effect of FDI on local green total factor productivity is not significant. When the level of financial development crosses the second threshold of 3.193, the coefficient on FDI increases to 1.4132, and is significant at the 1% level. This indicates that with the rising level of financial development, the utilization efficiency of FDI is improved, and it also shows that FDI channels play an important role in improving China’s green productivity and technological progress. FDI entry has a positive effect in promoting China’s green total factor productivity (Zhang Fan, 2017 [53]). The above results demonstrate that the impact of FDI on green total factor productivity has threshold characteristics based on financial development. Moreover, the level of financial development will directly affect a province’s ability to attract FDI, with the benefits of technology spillover. A region with a high level of financial development is likely to have a more or less fully functioning financial system. This will not only reduce the information cost of external financing by giving full play to the information collection and processing functions of the financial system, but will also provide convenient enterprise financing through financial institutions and the spreading of the risk of green technology innovation. A higher level of financial development will attract high-quality, low-pollution FDI inflows, and thereby promote green total factor productivity. Higher levels of financial development make it easier for a province to gain the positive green productivity spillover effect of FDI, and in turn, the greater FDI will tend to increase green total factor productivity.
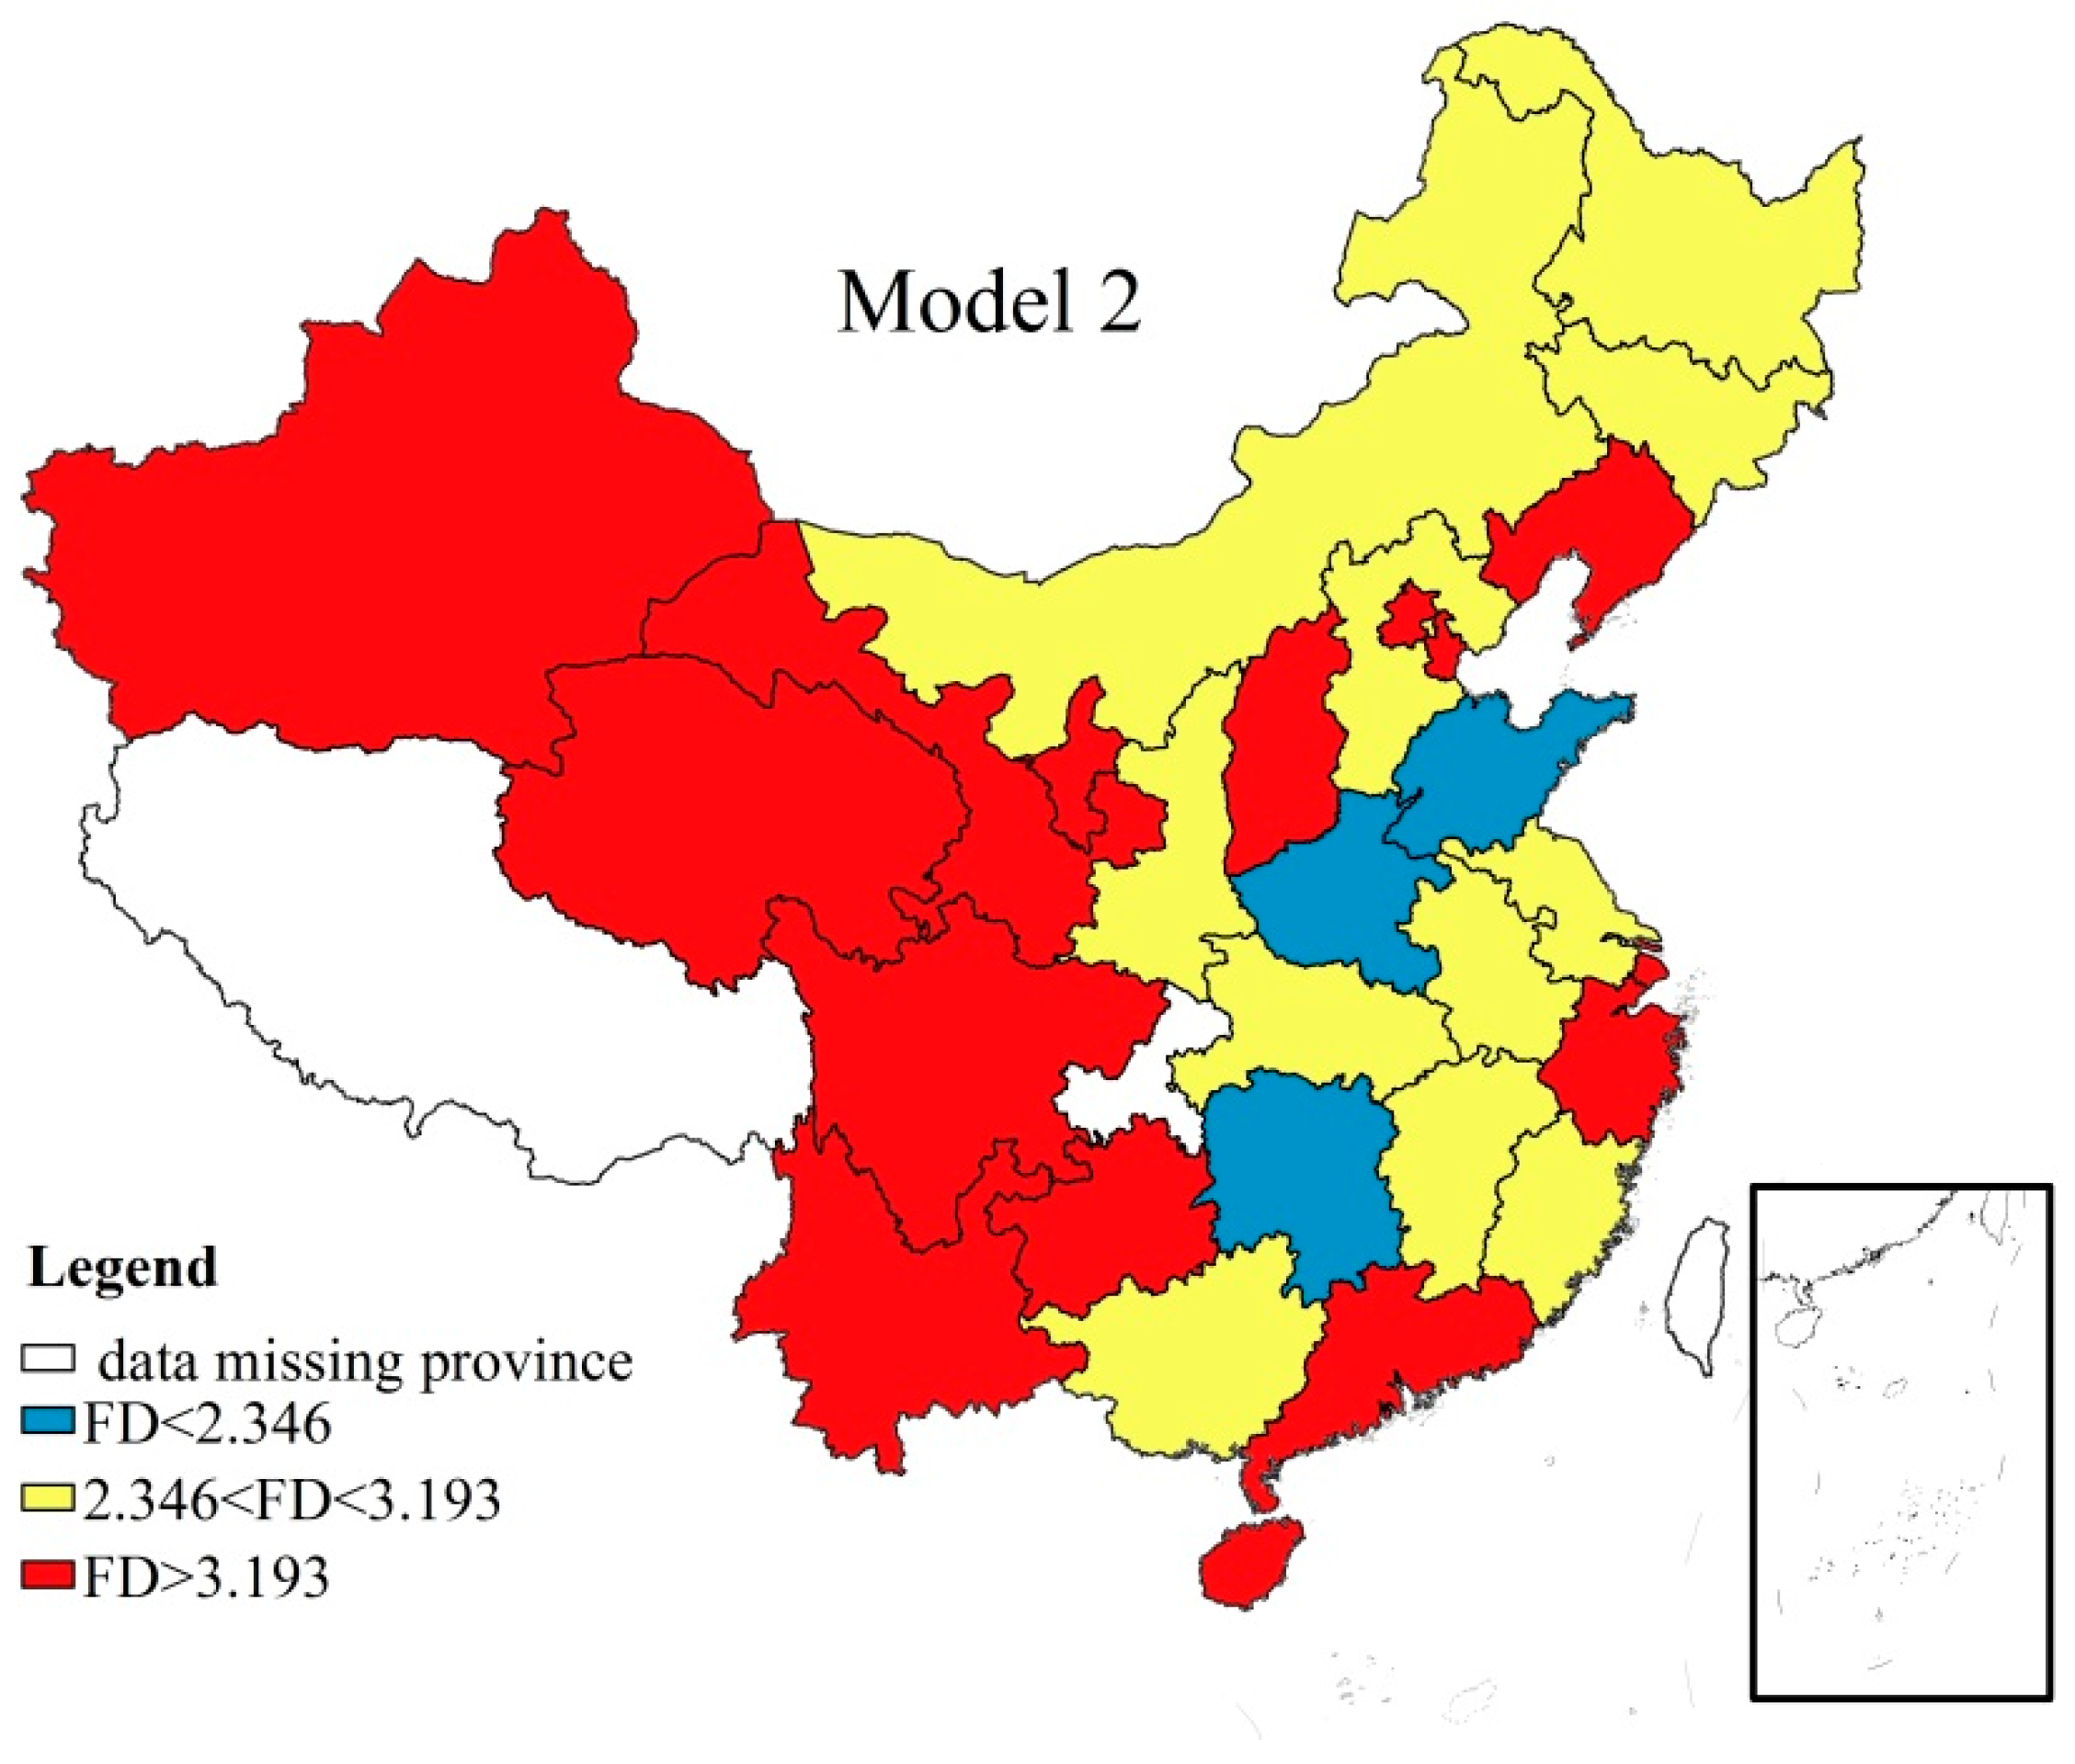
It can be seen from Table 8 that during the period 1998–2017, 259 samples of FDI were at a low level of FD, and here, there was a negative impact of FDI on green total factor productivity. In 2017, the financial development level of Henan, Hunan, and Shandong is still under the first threshold interval, and the green productivity spillover effect of FDI was weak. Using Arcgis 10.2 based on the threshold regression results of Table 8, the regional difference map is drawn to show the situation in which China’s provinces fall into different financial development thresholds in 2017, as shown in Figure 4.
The results of model 3 show that technological innovation with financial development as the threshold variable has a positive and nonlinear impact on green total factor productivity. The threshold values are 1.731 and 3.182, as shown in Table 9. When the level of financial development is lower than the threshold value of 1.731, the impact of technological innovation on green total factor productivity is small, with the coefficient being only 0.0069391, although it is still significant at the 10% level. However, when the level of financial development is between 1.731–3.182, the coefficient rises to 0.049547 (still at the 10% significance level). This indicates that in the second threshold interval, technological innovation has a somewhat greater and significant positive effect on green total factor productivity. After the level of financial development crosses the threshold of 3.182, the impact of technological innovation on the growth of green total factor productivity is further enhanced, and the coefficient rises to 0.0647392. It shows that technological innovation improvement and technology scale efficiency are important driving forces for green total factor productivity (Wu Xinzhong and Deng Mingliang, 2018 [61]). It can be seen that, with the improvement of financial development level, the impact of technological innovation level on green total factor productivity has a significant positive and nonlinear characteristic of increasing marginal efficiency. The increase of R&D intensity can enable the economy to use green production processes and more sophisticated pollution control technologies to promote factor productivity. This is consistent with the conclusions of Yang Zhijiang and Luo Zhanghua (2019) [20]. They used the ratio of green total factor productivity to green GDP to measure the green transformation of economic growth patterns. It was found that technological innovation had a significant role in promoting the green transformation of economic growth pattern.
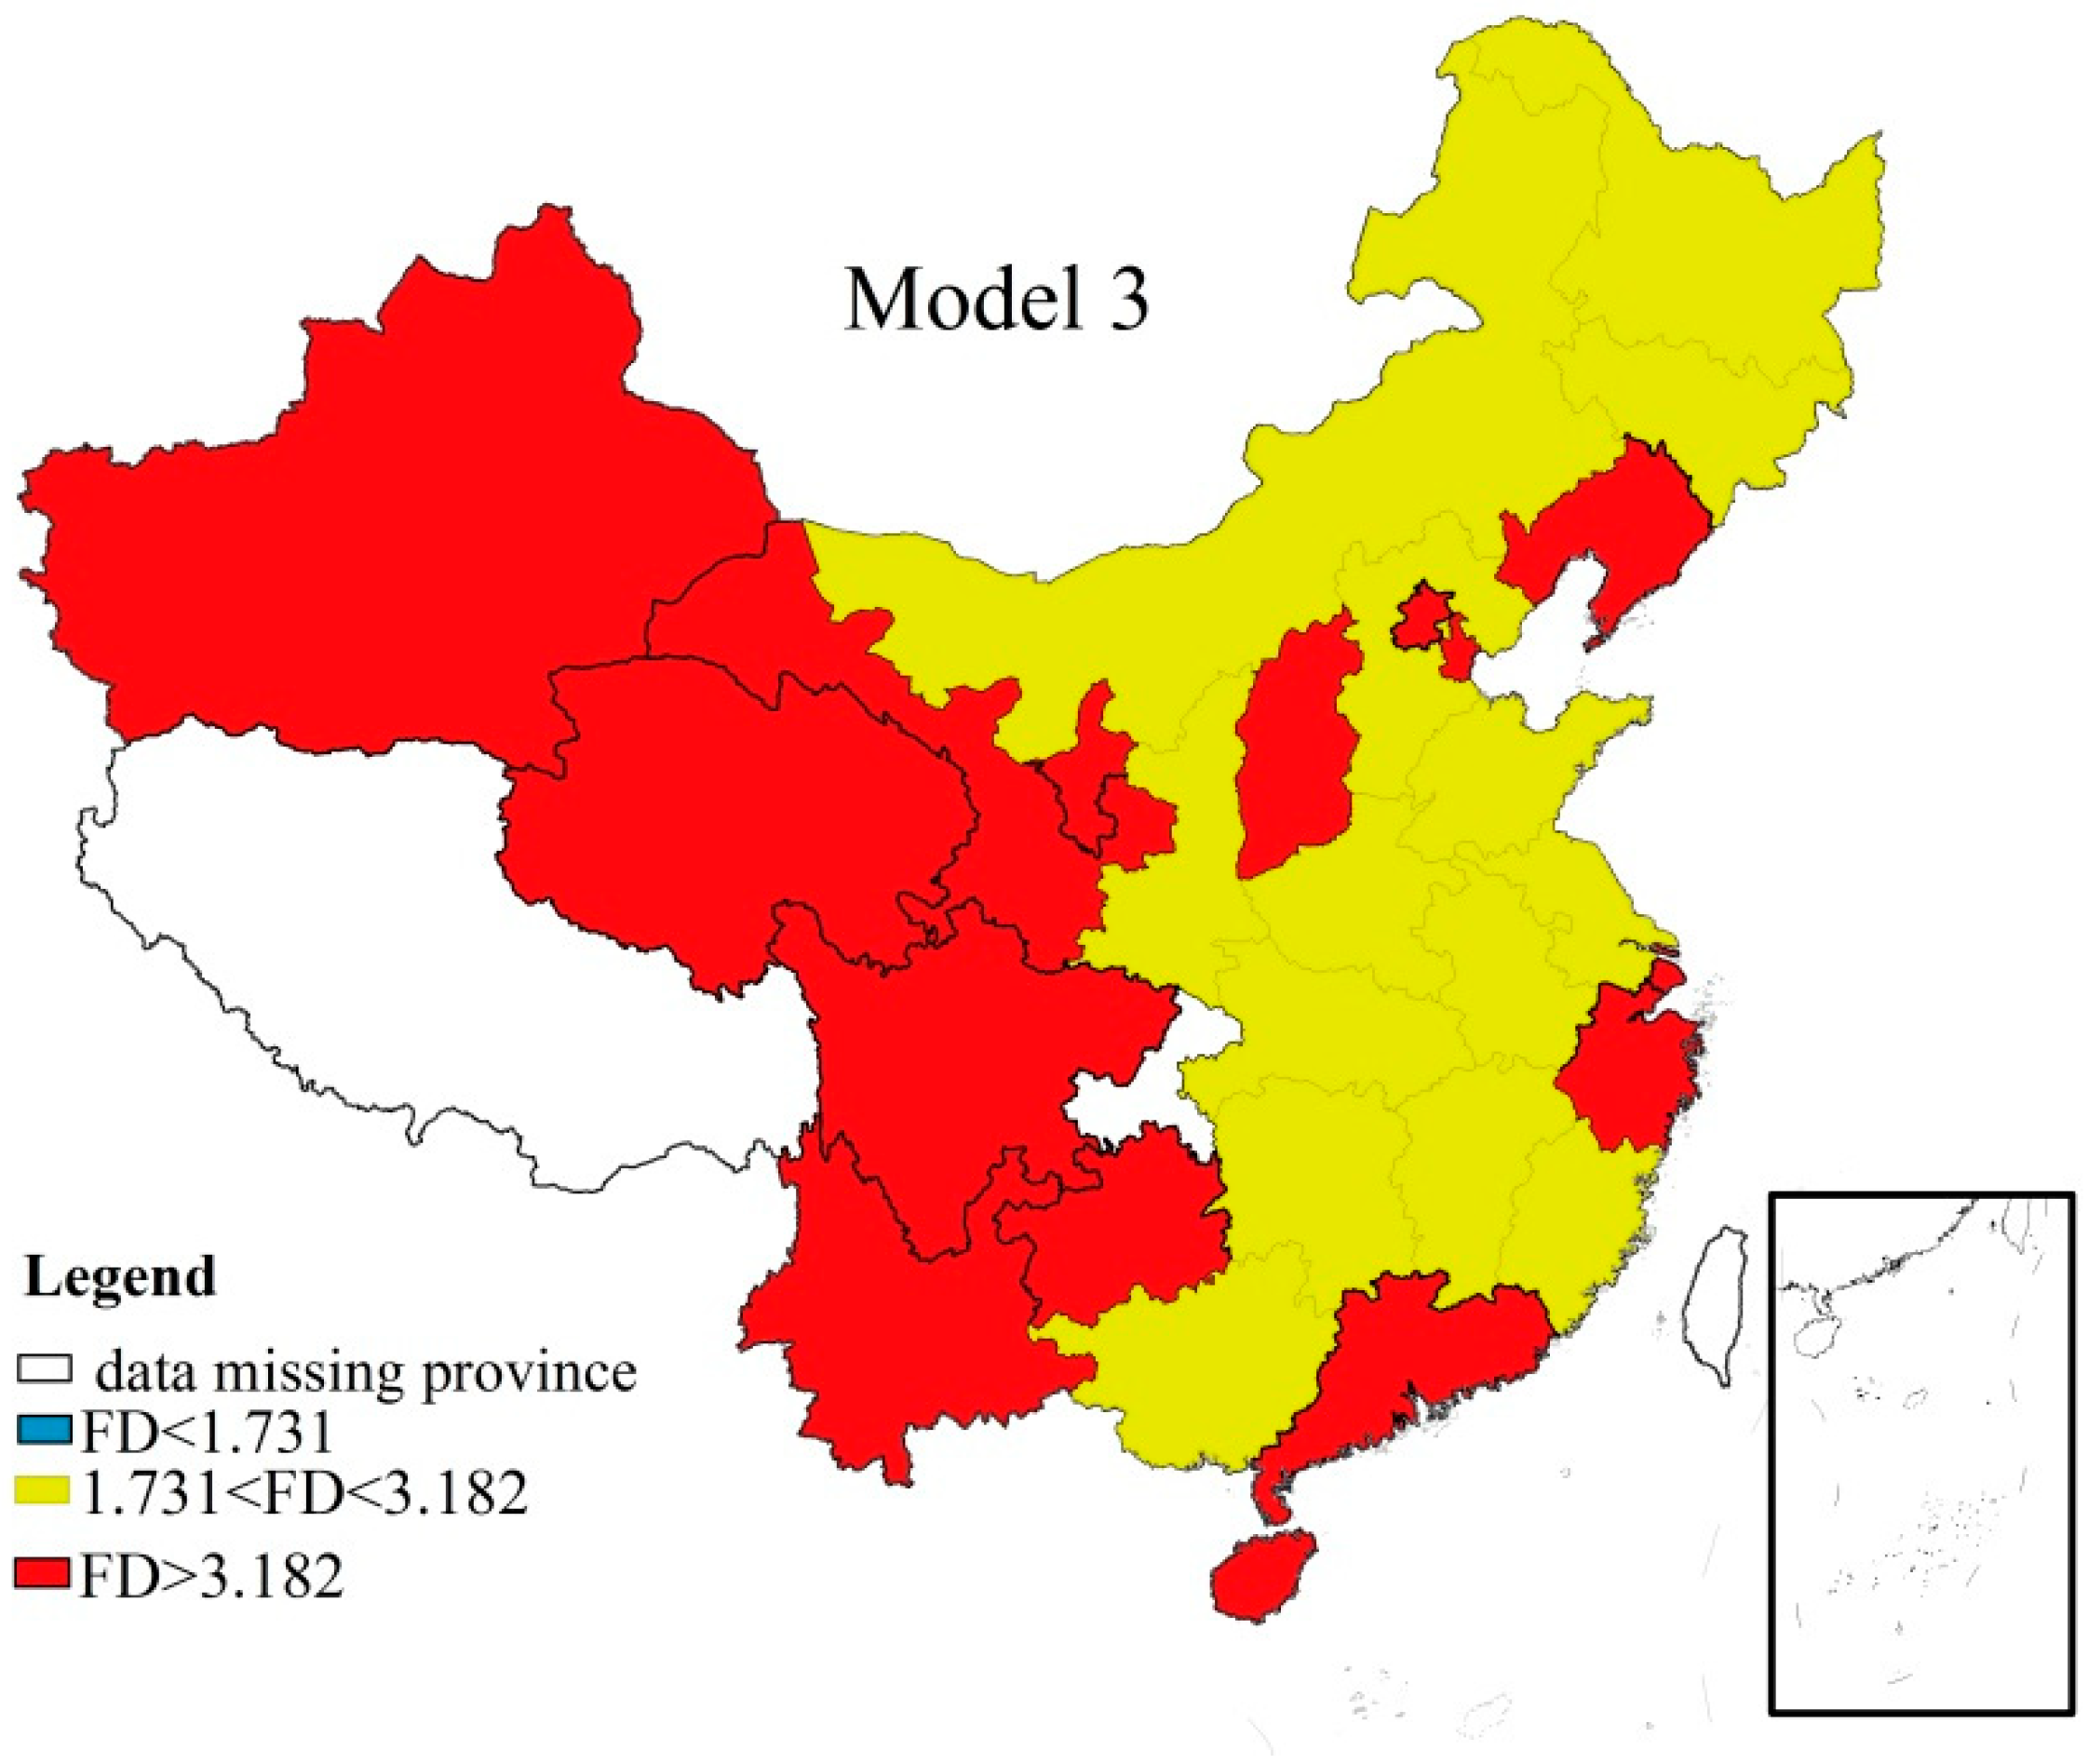
It can be seen from Table 9 that there are 92 samples in the third threshold interval (a high level of financial development) in the period from 1998 to 2017. The level of technological innovation has a significant positive impact on green total factor productivity, and the impact intensity is relatively high. In 2017, the regions in the third threshold interval included Beijing, Shanghai, Gansu, Qinghai, Liaoning, Hainan, Zhejiang, Shanxi, Ningxia, Xinjiang, Guizhou, Guangdong, Yunnan, Sichuan, and Tianjin. Using Arcgis 10.2 based on the threshold regression results of Table 9, the regional difference map is drawn to show the situation in which China’s provinces fall into different financial development thresholds in 2017, as shown in Figure 5.
Finally, model 4 shows that environmental governance, with financial development as threshold variable, has a positive U-shaped relationship with green total factor productivity. A single threshold divides the level of financial development into two threshold intervals, low (FD < 1.731) and high (FD > 1.731), as shown in Table 10. When the level of financial development is lower than the threshold value of 1.731, the impact of environmental governance on green total factor productivity is negative, at the 5% level of significance. It may be that the direct economic benefit of environmental governance is not obvious, and the low level of financial development restricts the financing of local enterprises. Compared with productive investment, investment in environmental pollution control is often given little priority, resulting in an increase in undesirable output and a decrease in green total factor productivity. When the level of financial development crosses the threshold, environmental governance has a positive impact on green total factor productivity; the coefficient reaches 0.0904, which is significant at the 1% level. It can be seen that as the level of financial development increases, the impact of environmental governance on green total factor productivity initially declines, but then increases. This is consistent with the conclusions of Liu Hewang and Zuo Wenting (2016) [31]. Based on the data of 29 provinces from 2003 to 2001, they found that appropriate environmental governance could achieve a ‘win–win’ situation between environmental quality and total factor productivity; however, if the intensity of environmental governance exceeded that level, it would inhibit the growth of green total factor productivity.
As can be seen from Table 10, 523 samples were in the higher interval of financial development during the period 1998–2017, which helped to increase the positive effect of environmental governance on green total factor productivity. In 2017, all 30 provinces and municipalities in China were in this higher threshold interval, which shows that the current level of financial development in China should strengthen the role of environmental governance in promoting green total factor productivity. Thus, the Porter hypothesis has been verified in China.

5. Conclusions

Considering energy and environmental factors, the study uses SBM directional distance function and the Luenberger productivity index to measure the green total factor productivity of China’s 30 provinces from 1997 to 2017. On this basis, it focuses on the impact of financial development on green total factor productivity and its threshold effects, as well as the impact of technological innovation, FDI, and environmental governance on green total factor productivity. The study has five key findings. (1) From 1997 to 2017, the average annual growth rate of China’s green total factor productivity (considering undesirable output) was 1.77%, indicating that China’s green total factor productivity showed an overall upward trend during the sample period, and pure technology progress is the main reason for the growth of green total factor productivity. (2) Financial development has a double threshold effect on green total factor productivity and a nonlinear characteristic of diminishing marginal efficiency. After crossing that first threshold of 1.731, the effect of financial development on the green development of green total factor productivity lessens, indicating that higher levels of financial development are not necessarily better. It shows that an optimal range exists for the promotion of green total factor productivity by financial development. Excessive financial development reduces its promoting effect, while too low financial development has a negative impact on green total factor productivity. Only a suitable level of financial development can most effectively coordinate the common development of the environment and the economy. (3) The impact of FDI on green total factor productivity has a threshold characteristic based on financial development. When the level of financial development crosses a threshold 3.193, FDI will have a significant positive spillover effect on green productivity. Moreover, the higher the level of financial development, the more a province can attract high-quality, low-pollution FDI inflows and make full use of technological spillover, thus increasing green total factor productivity. (4) At higher levels of financial development, the impact of technological innovation on green total factor productivity has significant positive and nonlinear characteristics, with increasing marginal efficiency. A mature financial system can diversify risks, increase liquidity supply, reduce financing costs, and increase the financing success rate of technological innovation projects, which contributes to the improvement of green total factor productivity. To achieve the quality and efficiency of financial services in the real economy (especially industrial enterprises), financial markets, enterprises, and governments need to work together to optimize the efficiency of financial resource allocation. Technological innovation should be encouraged, and policy support and institutional guarantee should be given (Zhang Xiuyan, Zhou Yi, Bai Wen, 2019 [45]). (5) There is a positive U-shaped relationship between environmental governance with level of financial development as the threshold variable and green total factor productivity. After financial development reaches a certain level, environmental governance will have a positive effect on green total factor productivity growth. It reflects the importance of financial development to environmental governance and economic development.
Conclusions (3), (4), and (5) indicate the importance of financial development to China’s green development. FDI and environmental governance can promote green productivity only when financial development reaches a certain level. The positive impact of technological innovation on green total factor productivity is also characterized by increasing the marginal efficiency based on financial development. All of the above results show that the realization of China’s green and sustainable goals requires the improvement of the level of financial development.
There is still a need for further research in this paper: in empirical analysis, the selection of different indicators may cause differences in research conclusions. The empirical research in this paper is based on the analysis of macro data. Since the data of various industries and micro-enterprises based on the province are difficult to collect, this paper does not introduce the microdata of various industries and enterprises in China. This paper only attempts to analyze the impact of financial development on green total factor productivity through technological innovation, FDI, and environmental governance, while the study of other paths will be the direction of further research.

Author Contributions

Conceptualization, Y.Z. and C.Z.; methodology, Y.X.; Y.Z. and M.H.; software, Y.X. and X.F.; validation, Y.Z.; C.Z., and Z.F.; formal analysis, Y.Z.; Y.X. and Z.F.; resources, Y.Z. and C.Z.; data curation, Y.X.; writing—original draft preparation, Y.Z.; Y.X. and C.Z.; writing—review and editing, Y.Z.; Y.X.; C.Z.; Z.F.; X.F. and M.H.

Funding

This research was funded by the Fundamental Research Funds for the Central Universities, grant number 2017WB17.

Conflicts of Interest

The funders had no role in the design of the study; in the collection, analyses, or interpretation of data; in the writing of the manuscript, or in the decision to publish the results.

References

  1. Krugman, P. The Myth of Asia’s Miracle. Foreign Aff. 1994, 73, 62–78. [Google Scholar] [CrossRef]
  2. Arayama, Y.; Miyoshi, K. Regional Diversity and Sources of Economic Growth in China. World Econ. 2004, 27, 1583–1607. [Google Scholar] [CrossRef]
  3. Jin, T.; Xu, J. Discussion on the Mode of Extensive Economic Growth in China’s Transition Period. Reform 2005, 8, 18–22. (In Chinese) [Google Scholar]
  4. Lei, H. The Effect of Investment on Economic Growth and Investment Efficiency since the Reform in China. Ph.D. Thesis, Huazhong University of Science and Technology, Wuhan, China, 2006. [Google Scholar]
  5. Zhang, R. How China’s Economic Growth Turns to TFP-driven. Mod. Econ. Inf. 2014, 22, 7. (In Chinese) [Google Scholar]
  6. Jing, X.U.; Yang, Y.H. Study on Evaluation Method of Regional Energy Efficiency Base on SFA. Coal Econ. Res. 2012, 32, 37–44. (In Chinese) [Google Scholar]
  7. Zhu, S.; Xu, K. The Measurement of Total Factor Energy Efficiency in China’s Industrial Sector and Its Influencing Factors—Based on the Research of Common Frontier Law. Ind. Technol. Econ. 2015, 12, 102–113. (In Chinese) [Google Scholar]
  8. Zhou, R. Evaluation of Carbon Emission Efficiency in Five Northwest Provinces Based on Stochastic Frontier Model. China Bus. Rev. 2013, 32, 110–111. (In Chinese) [Google Scholar]
  9. Chung, Y.; Färe, R. Productivity and undesirable outputs: A directional distance Function approach. Microeconomics 1997, 51, 229–240. (In Chinese) [Google Scholar] [CrossRef]
  10. Chen, S. China’s Green Industrial Revolution: An Explanation from the Perspective of Environmental Total Factor Productivity (1980–2008). Econ. Res. J. 2010, 11, 21–34. (In Chinese) [Google Scholar]
  11. Chen, C.F. Simulated Forecast of Energy Conservation and Emission Reduction and Green Growth of China’s Industry. China Popul. Resour. Environ. 2018, 28, 148–157. (In Chinese) [Google Scholar]
  12. Xu, X.; Wang, X. Green Total Factor Productivity and Its Regional Differences in China: An Empirical Analysis Based on Panel Data of 30 Provinces. J. Guizhou Univ. Financ. Econ. 2016, 6, 91–98. (In Chinese) [Google Scholar]
  13. Färe, R.; Grosskopf, S. Theory and Calculation of Productivity Index. In Models & Measurement of Welfare & Inequality; Eichhorn, W., Ed.; Springer: Berlin, Germany, 1994; pp. 921–940. [Google Scholar]
  14. Fukuyama, H.; Weber, W. A directional slacks-based measure of technical efficiency. Socio Econ. Plan. Sci. 2009, 43, 274–287. [Google Scholar] [CrossRef]
  15. Tone, K. Dealing with Undesirable Outputs in DEA: A Slacks-Based Measure (SBM) Approach; The Operations Research Society of Japan: Birmingham, UK, 2004. [Google Scholar]
  16. Wang, B.; Wu, Y.; Yan, P. Regional Environmental Efficiency and Environmental Total Factor Productivity Growth in China. Econ. Res. J. 2010, 5, 95–109. (In Chinese) [Google Scholar]
  17. Li, L.; Tao, F. Green Total Factor Productivity and Its Influencing Factors in Pollution-intensive Industries: An Empirical Analysis Based on the Directional Distance Function of SBM. Economist 2011, 12, 32–39. (In Chinese) [Google Scholar]
  18. Liu, H.; Li, C. Regional Gap and Structural Decomposition of Green Total Factor Productivity in China. Shanghai J. Econ. 2018, 6, 30–41. (In Chinese) [Google Scholar]
  19. Liu, Z.; Xin, L. The influence of “The Belt and Road” construction on the green total factor productivity of key provinces in China along the line. China Popul. Resour. Environ. 2018, 28, 87–97. (In Chinese) [Google Scholar]
  20. Yang, Z.; Luo, Z. An Empirical Study on Green Transformation Driving Factor of Economic Growth Pattern in China. Sci. Manag. Res. 2019, 37, 11–14. (In Chinese) [Google Scholar]
  21. Huang, Y.; Shi, Q. Research on Regional Environmental Efficiency and Total Elements of Environment in China: Based on the Analysis of SBM Model Including R&D Input. China Popul. Resour. Environ. 2015, 25, 12. (In Chinese) [Google Scholar]
  22. Wan, L.; Zhu, Q. The Impact of R&D Input on Industrial Green Total Factor Productivity Growth: Empirical Data from China’s Industries from 1999 to 2010. Econ. Perspect. 2013, 9, 20–26. (In Chinese) [Google Scholar]
  23. Jiang, N. FDI, Global Value Chain Embedding and Total Factor Productivity. J. Hebei Univ. Econ. Bus. 2019, 1, 50–59. (In Chinese) [Google Scholar]
  24. Zhong, J.; Zhang, Q. The Impact of Financial Market Development on Technology Spillover Effect of FDI in China and Its Threshold Effect Test. Financ. Trade Res. 2010, 21, 98–104. (In Chinese) [Google Scholar]
  25. Porter, M.E.; Linde, C.V.D. Toward a New Conception of the Environment-Competitiveness Relationship. J. Econ. Perspect. 1995, 9, 97–118. [Google Scholar] [CrossRef]
  26. Tang, G.; Ni, J.; He, R. Regional Economic Development, Enterprise Environmental Protection Investment and Enterprise Value: A Case Study of Listed Companies in Hubei Province; Hubei Social Science: Wuhan, China, 2018. (In Chinese) [Google Scholar]
  27. Mohr, R.D. Technical Change, External Economies, and the Porter Hypothesis. J. Environ. Econ. Manag. 2002, 43, 158–168. [Google Scholar] [CrossRef]
  28. Zhu, J.; Wang, Y. Innovation Compensation or Following Cost? Pollution Halo or Pollution Paradise? Testing the Threshold Effect and Spatial Spillover Effect of the Double Hypothesis from the Perspective of Green Total Factor Productivity. Sci. Technol. Prog. Policy 2018, 35, 46–54. (In Chinese) [Google Scholar]
  29. Chen, Y.; Sun, H. Environmental Regulation and Competitive Advantage of Enterprises: Revision of Porter’s Hypothesis. Sci. Technol. Prog. Policy 2009, 26, 59–61. (In Chinese) [Google Scholar]
  30. Tao, Q.; Hu, H. Analysis of the Relation between Environmental Regulation and Agricultural Science and Technology Progress: A Study Based on Porter’s Hypothesis. China Popul. Resour. Environ. 2011, 21, 52–57. (In Chinese) [Google Scholar]
  31. Liu, H.; Zuo, W. The Influence of Environmental Regulation on China’s Provincial Green Total Factor Productivity. Stat. Decis. 2016, 9, 141–145. (In Chinese) [Google Scholar]
  32. Zhang, H.; Zhang, Z.; Yan, F.M. The Impact of Environmental Governance Based on Technological Distance on Enterprise Total Factor Productivity. China Popul. Resour. Environ. 2018, 28, 121–130. (In Chinese) [Google Scholar]
  33. Zheng, X. Empirical Analysis of the Contribution Rate of Economic Growth Factors in Zhejiang Province. Econ. Manag. 2004, 18, 66–68. (In Chinese) [Google Scholar]
  34. Chen, J. Technological Progress Bias, Factor Accumulation and China’s Economic Growth Dynamics—An Empirical Study Based on a New Nonparametric Decomposition Method. J. Huazhong Univ. Sci. Technol. Soc. Sci. Ed. 2018, 2. Available online: http://www.cnki.com.cn/Article/CJFDTotal-HZLS201802012.htm (accessed on 4 July 2019). (In Chinese).
  35. He, J.; Hao, S. Limitation and Reconstruction of the Triple Characteristics of Neoclassical Economic Man. Acad. J. 2012, 4, 73–80. (In Chinese) [Google Scholar]
  36. Liao, J. Research on Non-Independent Strategy Investor Behavior and Stock Market Vision. Ph.D. Thesis, Fudan University, Shanghai, China, 2011. (In Chinese). [Google Scholar]
  37. Romer, M. Increasing Returns and Long-Run Growth. J. Political Econ. 1986, 94, 1002–1037. [Google Scholar] [CrossRef] [Green Version]
  38. César, C.; Liu, L. The Direction of Causality Between Financial Development and Economic Growth. J. Dev. Econ. 2003, 72, 321–334. [Google Scholar]
  39. Rousseau, P.L.; Wachtel, P. Inflation Thresholds and the Finance-Growth Nexus. J. Int. Money Financ. 2002, 21, 777–793. [Google Scholar] [CrossRef]
  40. Bassem, K. The short and long run causality relationship among economic growth, energy consumption and financial development: Evidence from South Mediterranean Countries (SMCs). Energy Econ. 2017, 68, 19–30. [Google Scholar]
  41. Tu, Z.G. Total Factor Productivity and the Motive Force of Regional Economic Growth: Based on the Non-parametric Production Frontier Analysis of 28 Provinces and Cities’ Large-scale Industries from 1995 to 2004. Nankai Econ. Stud. 2007, 4, 14–36. (In Chinese) [Google Scholar]
  42. Gorodnichenko, Y.; Schnitzer, M. Financial Constraints and Innovation: Why Poor Countries Don’t Catch up. J. Eur. Econ. Assoc. 2013, 11, 1115–1152. [Google Scholar] [CrossRef]
  43. Shen, K.; Sun, W. Investment Efficiency, Capital Formation and Macroeconomic Fluctuation——An Empirical Study Based on the Perspective of Financial Development. China Soc. Sci. 2004, 6, 52–63. (In Chinese) [Google Scholar]
  44. Chen, G.; Li, S. Sources of Financial Development and Growth: Factor Accumulation, Technological Progress and Efficiency Improvement. South. Econ. 2009, 5, 24–35. (In Chinese) [Google Scholar]
  45. Zhang, X.Y.; Zhou, Y.; Bai, W. Financial Agglomeration and Industrial Productivity Improvement—Based on the Research of Intermediary Transmission Effectiveness of R&D Capital. Jilin Univ. J. Soc. Sci. Ed. 2019, 59, 32–42. (In Chinese) [Google Scholar]
  46. Wang, X.; Xu, Y.; Liu, T. Does financial development promote the growth of green total factor productivity in the “Belt and Road” countries. Econ. Latit. 2018, 35, 17–22. (In Chinese) [Google Scholar]
  47. Ma, C.; Stern, D.I. China’s changing energy intensity trend: A decomposition analysis. Energy Econ. 2008, 30, 1037–1053. [Google Scholar] [CrossRef]
  48. Cole, M.A.; Elliott, R.J.R.; Shimamoto, K. Industrial characteristics, environmental regulations and air pollution: An analysis of the UK manufacturing sector. J. Environ. Econ. Manag. 2005, 50, 121–143. [Google Scholar] [CrossRef]
  49. Chami, R.; Cosimano, T.F.; Fullenkamp, C. Managing Ethical Risk: How investing in ethics adds value. J. Bank. Financ. 2002, 26, 1697–1718. [Google Scholar] [CrossRef]
  50. Wang, W. County Finance and Green Total Factor Productivity Growth—Evidence from the Upper Stream of the Yangtze River Economic Belt. J. Stat. Inf. 2017, 9, 69–77. (In Chinese) [Google Scholar]
  51. Wang, W.; Sun, F. Financial Development and Green Total Factor Productivity Growth in Ethnic Areas—Taking Wujiang River Basin as an Example. J. Yunnan Univ. Natl. 2017, 3, 106–118. (In Chinese) [Google Scholar]
  52. Friday, J.; Zhu, Y. Research on the Impact of Financial Development on Green Total Factor Productivity Growth—Taking the 11 Provinces (Cities) of the Yangtze River Economic Belt as an Example. Macro Qual. Res. 2018, 6, 74–89. [Google Scholar]
  53. Zhang, F. Theoretical and Empirical Research on the Impact of Financial Development on Green Total Factor Productivity. China Soft Sci. 2017, 9, 154–168. (In Chinese) [Google Scholar]
  54. Ge, P.; Huang, X.; Xu, Y. Financial Development, Innovation Heterogeneity and Green Total Factor Productivity Enhancement: Empirical Evidence from “Belt and Road”. Financ. Econ. 2018. Available online: http://xueshu.baidu.com/usercenter/paper/show?paperid=08e1d4eecd82e220e4c9f56a001f8c1d&site=xueshu_se (accessed on 4 July 2019). (In Chinese).
  55. Chambers, R.G.; Faure, R.; Grosskopf, S. Productivity growth in APEC countries. Pac. Econ. Rev. 1996, 1, 181–190. [Google Scholar] [CrossRef]
  56. Zhang, J.; Wu, G.; Zhang, J. Estimation of Interprovincial Material Capital Stock in China:1952–2000. Econ. Res. J. 2004, 10, 35–44. (In Chinese) [Google Scholar]
  57. Wang, F.; Xie, J. Research on the Growth Rate of Green Total Factor Productivity in China by Province. Chin. J. Popul. Sci. 2015, 2, 53–62. (In Chinese) [Google Scholar]
  58. Wang, C.; Xie, Z. An Empirical Comparison of China’s Transcendental Logarithmic Production Function Model Based on Substitutional Elasticity. J. Hebei Geo Univ. 2014, 37, 14–19. (In Chinese) [Google Scholar]
  59. Liu, H.; Li, C.; Peng, Y. Spatial imbalance of green total factor productivity growth in China and its causes. Theory Pract. Financ. Econ. 2018, 39, 118–123. (In Chinese) [Google Scholar]
  60. Gai, M.; Kong, X.; Qu, B. Evolution Analysis of Traditional Economic Efficiency and Green Space-time Efficiency Between China’s Inter-provincial. Resour. Dev. Mark. 2016, 7, 780–787. (In Chinese) [Google Scholar]
  61. Wu, X.; Deng, M. Technological Innovation, Spatial Spillover and Industrial Green Total Factor Productivity of the Yangtze River Economic Belt. Sci. Technol. Prog. Policy 2018, 1, 50–58. (In Chinese) [Google Scholar]
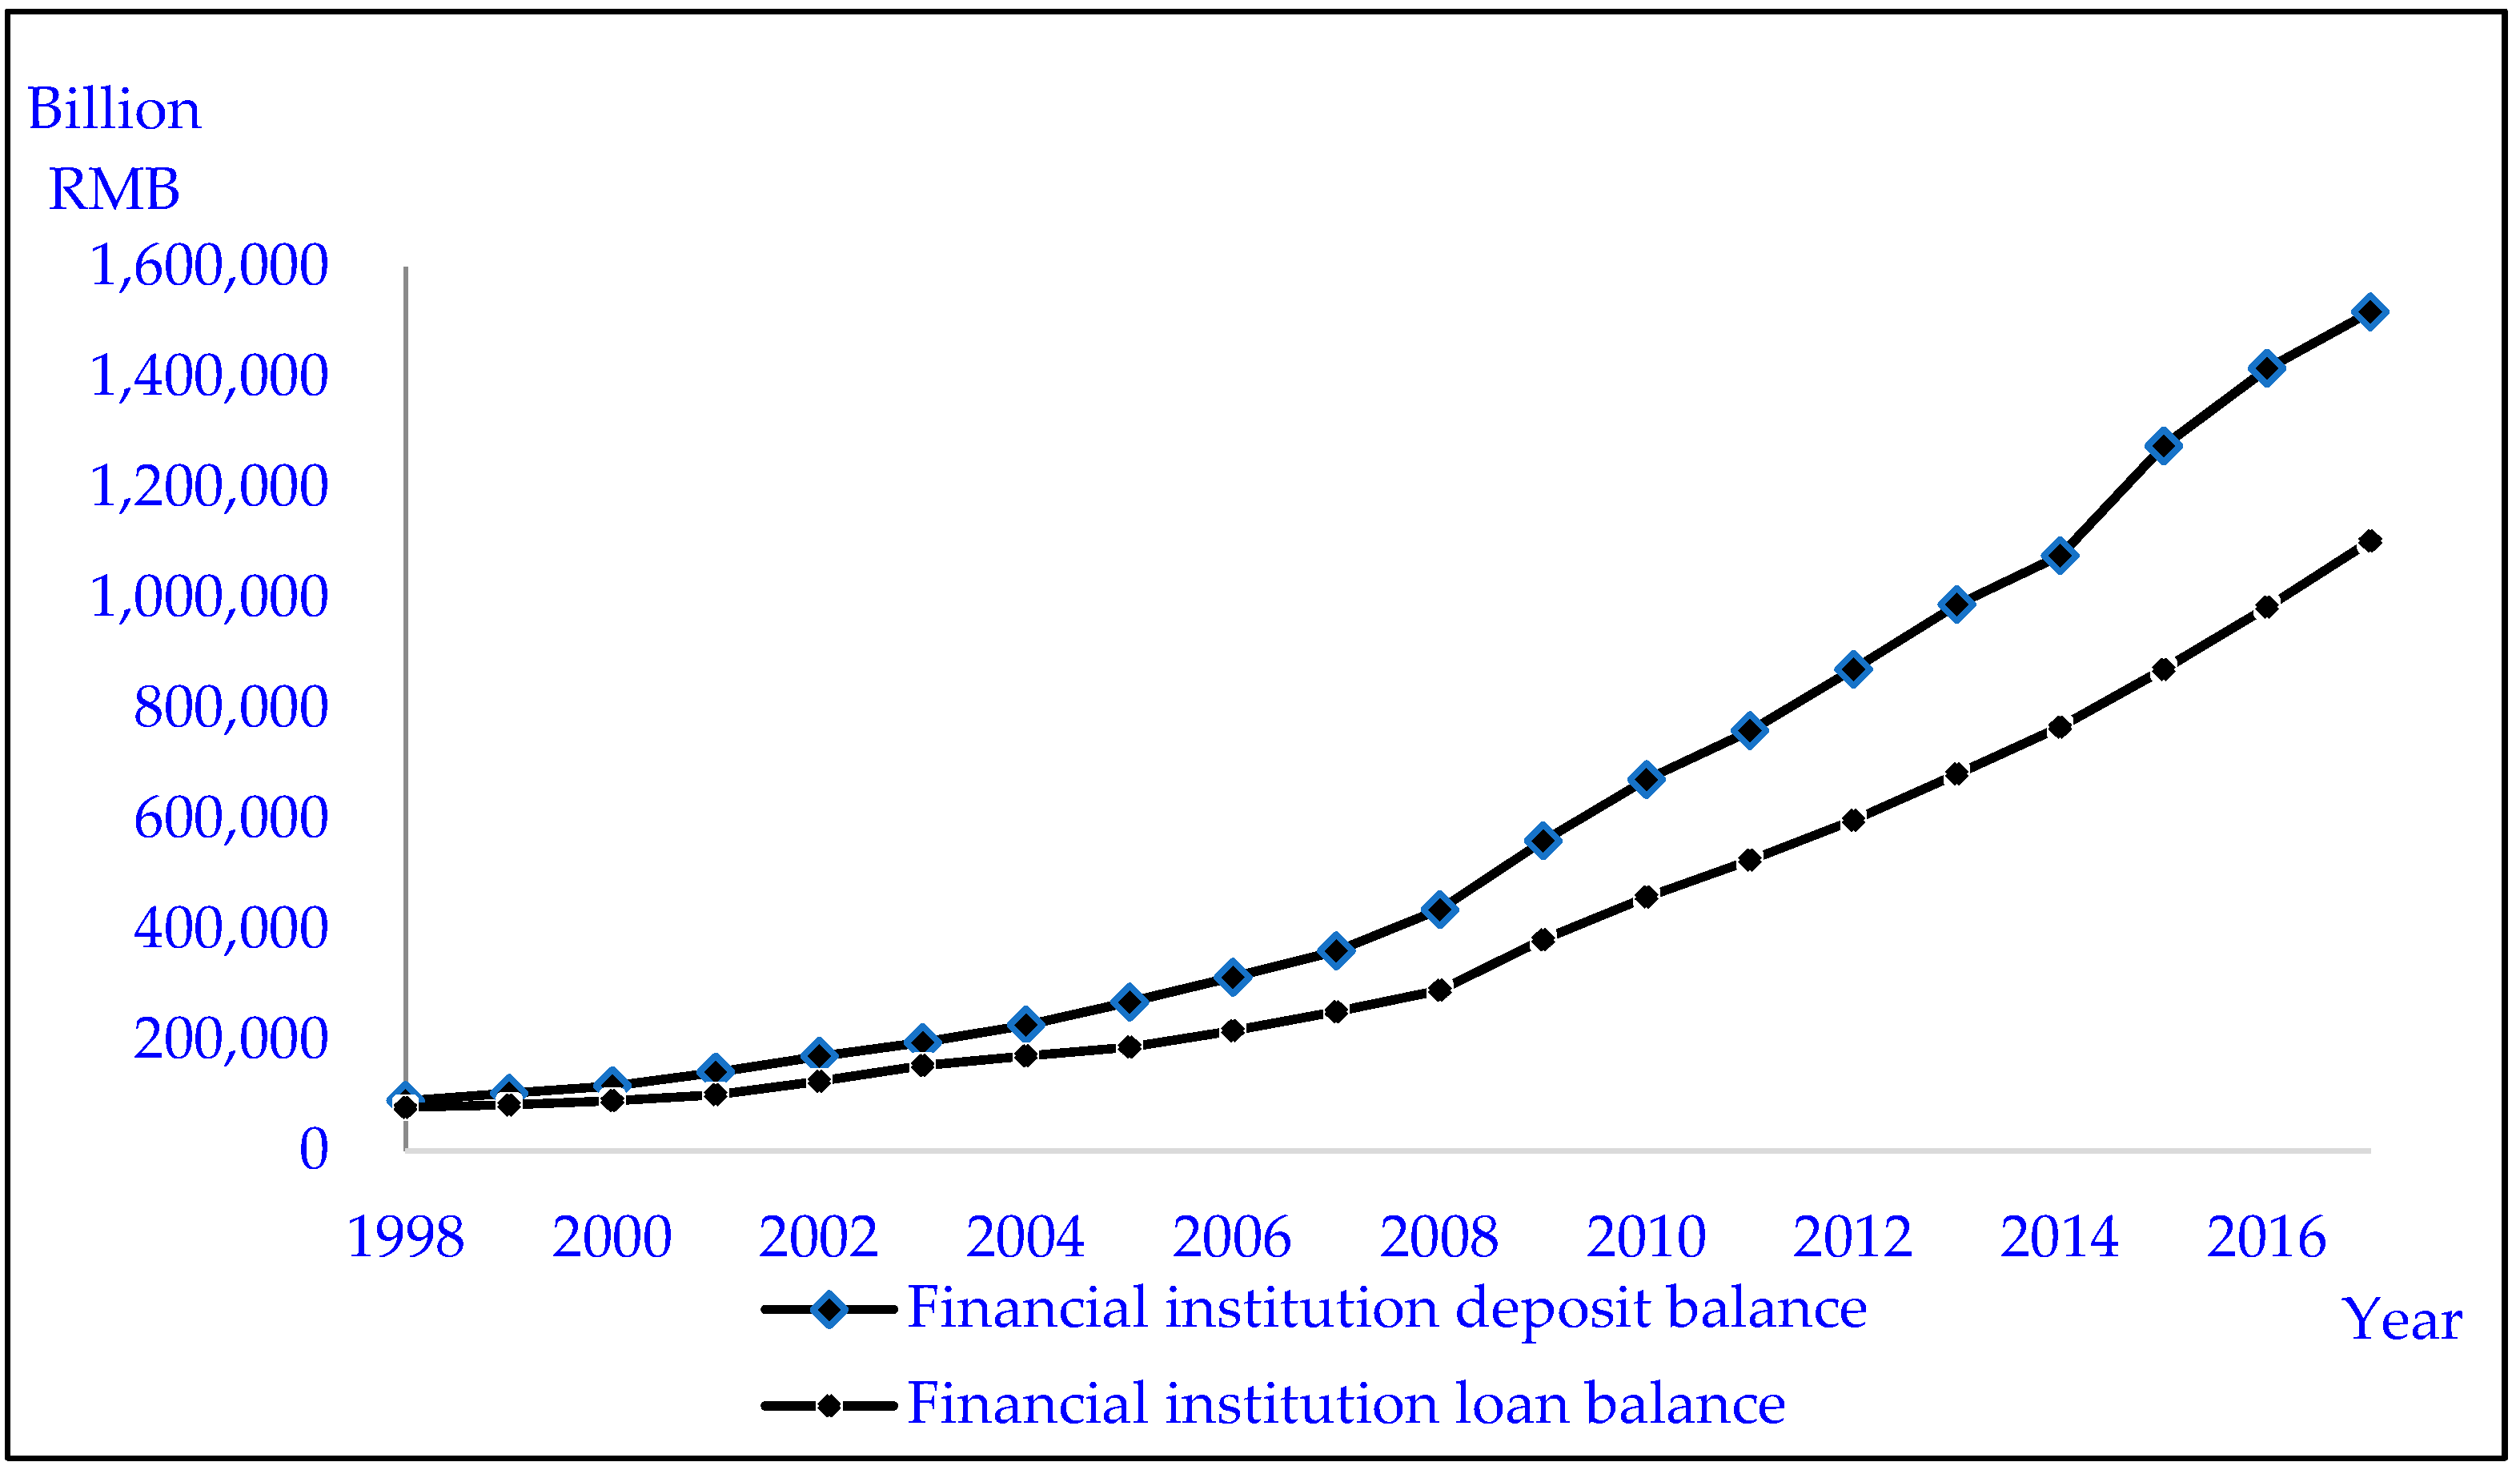
Figure 1. Changes in deposits and loans of financial institutions from 1998 to 2017. Note: The data comes from the China Statistical Yearbook over the period 1999 to 2018.
Sustainability 11 03776 g001
Figure 2. The trend of GTFP and its decomposition index.
Sustainability 11 03776 g002
Figure 3. The situation of the thresholds of different financial development levels in China’s provinces in 2017.
Sustainability 11 03776 g003
Figure 4. The situation of the thresholds of different financial development levels in China’s provinces in 2017.
Sustainability 11 03776 g004
Figure 5. The situation of the thresholds of different financial development levels in China’s provinces in 2017.
Sustainability 11 03776 g005
Table 1. Summary of research measuring green total factor productivity (GTFP). DDF: directional distance function, SBM: slacks-based measure.
Measurement MethodReferenceResearch ObjectEstimated Result
DDFChen Shiyi (2010) [10]38 double-digit industries in China from 1980 to 2008Estimates without considering environmental constraints overestimate total factor
productivity (TFP)
Chen Chaofan (2018) [11]36 industrial sub-sectors (2000–2014)During 2015–2050, the green productivity of 29 sub-sectors remained increasing or not decreasing
Xu Xiaohong and Wang Xia (2016) [12]Panel data of 30 provinces in China from 2000 to 2014The green total factor productivity (GTFP) in the eastern developed provinces is higher than that of the central and western underdeveloped provinces
SBMWang Bing et al. (2010) [16]Panel data of 30 provinces and municipalities in China from 1998 to 2007The average rate of environmental inefficiency and the average growth rate of environmental total factor productivity are both higher than the market inefficiency average and the average growth rate of market total factor productivity
Li Ling and Tao Feng (2011) [17]Pollution-intensive industries (2004–2008)The GTFP considering undesirable output is lower than GTFP without considering undesirable output
Liu Huajun and Li Chao (2018) [18]Panel data of 30 provinces in ChinaGTFP of China is at a low level
Liu Zhuankuo and Xin Li (2018) [19]2003–2016 17 key provinces along the “The Belt and Road Initiative” area in ChinaThe development of GTFP in key provinces along the “The Belt and Road Initiative” area is generally preferable
Table 2. Source and description of variables.
VariablesData Source and Description
Green total factor productivity (GTFP)The static efficiency value is calculated based on the slacks-based measure (SBM) directional distance function, simultaneously fitting the maximization of desirable output growth and minimization of the undesirable output growth. The Luenberger index is calculated to obtain the GTFP.
Financial development (FD)According to the availability of data, the sum of deposits and loans of financial institutions in different regions is selected to represent the total amount of financial activity, and the GDP of each region is selected to represent the total amount of economic activity. The level of financial development is measured as the ratio of the sum of deposits and loans of financial institutions to the gross domestic product of each region. The data on financial institutions comes from the Wind database, and the gross domestic product (GDP) of each region comes from the China Statistical Yearbook over the years.
Foreign direct investment (FDI)The actual utilization of FDI expressed in U.S. dollars is converted into Renminbi according to the average exchange rate of each year, and the level of FDI is measured by the ratio of the actual utilization of FDI to GDP. The actual amount of FDI comes from the Statistical Yearbook of each province.
R&D (lnRD)The logarithm of R&D expenditure ($100 million) comes from the China Science and Technology Statistics Yearbook.
Environmental Governance (EG)The ratio of total investment in environmental pollution control (RMB 100 million) to GDP is selected to measure the level of environmental governance. Investment in environmental pollution control includes three parts: old industrial pollution source control, “three simultaneous” construction projects (facilities for pollution prevention and control in construction projects must be designed, constructed, and put into operation simultaneously with the main project) and urban environmental infrastructure construction. The total investment in environmental pollution control comes from the China Environmental Statistics Yearbook and China Environmental Bulletin.
Table 3. Results of unit root testing.
VariableType of TestFisher-ADF Test
Chi-Square Statistic
Prob.Fisher-PP Test
Chi-Square Statistic
Prob.IPS Test
Chi-Square Statistic
Prob.Result
GTFP(C, T, 0)209.0180.39249.4540.36−8.698670.37Unit root exists
FD(C, T, 0)19.19511.0021.96261.00−6.189701.00Unit root exists
FDI(C, T, 0)313.8860.58152.6860.61−7.918120.42Unit root exists
lnRD(C, T, 0)110.1840.99242.9990.99−3.356590.89Unit root exists
EG(C, T, 0)94.46860.5283.75520.81−2.562850.51Unit root exists
DGTFP(C, T, 0)447.8920.002157.360.00−21.66240.00No unit root
DFD(C, T, 0)262.2800.00342.0430.00−12.70750.00No unit root
DFDI(C, T, 0)389.8040.00650.4320.00−15.63790.00No unit root
DlnRD(C, T, 0)199.4240.00528.9360.00−8.201360.00No unit root
DEG(C, T, 0)395.7480.001048.880.00−19.36470.00No unit root
Table 4. Kao co-integration test results.
t-Valuep-Value
ADF5.30530.0000
Table 5. Threshold effect tests.
ModelF-Valuep-ValueSize of SampleCritical Value
1%5%10%
Model 1Single threshold test12.519 ***0.0023008.8226.314.578
Double threshold test7.888 **0.04730011.1806.0923.387
Triple threshold test11.9930.2130010.0016.2013.982
Model 2Single threshold test27.825 *0.07230019.32112.88610.06
Double threshold test25.047 ***0.00930019.98416.06913.12
Triple threshold test30.5620.5730019.65214.47711.59
Model 3Single threshold test17.124 **0.02630019.32112.88610.06
Double threshold test17.354 **0.01830019.98416.06913.12
Triple threshold test10.1270.2930019.652514.477511.59
Model 4Single threshold test12.550 **0.06330018.49012.85110.600
Double threshold test7.6920.25330025.61916.92313.108
Triple threshold test4.4690.34730017.72211.5829.068
Note: Adding * indicates that the test results are significant at the 10% confidence level, ** indicates that the test results are significant at te 5% confidence level, and *** indicates that the test results are significant at the 1% confidence level.
Table 6. Threshold values and confidence intervals.
ModelThreshold Dependent VariableTypeThreshold Estimates95% Confidence Interval
Model 1FDSingle1.731(1.602, 3.408)
Double3.803(2.507, 4.803)
Model 2FDISingle2.346(2.342, 3.216)
Double3.193(3.171, 3.216)
Model 3lnRDSingle1.731(1.653, 1.784)
Double3.182(3.142, 3.209)
Model 4EGSingle1.731(1.602, 3.216)
Table 7. Threshold regression results of model 1.
GTFPCoefficient
FD ≤ 1.731FD ≤ 3.803FD > 3.803
FD−0.0218 *
(−1.95)
0.0387 ***
(−2.15)
0.0028 *
(−1.89)
R20.7230.6810.874
Sample size5747746
Provinces and municipalities within different levels of financial development in 2017nilTianjin, Hebei, Shanxi, Inner Mongolia, Jilin, Heilongjiang, Jiangsu, Anhui, Fujian, Jiangxi, Shandong, Henan, Hubei, Hunan, Guangdong, Guangxi, Sichuan, Guizhou, Yunnan, Shaanxi, Gansu, Liaoning, Hainan, Ningxia, and XinjiangBeijing, Shanghai, Zhejiang, and Qinghai
Note: adding * indicates that the test results are significant at the 10% confidence level, ** indicates that the test results are significant at the 5% confidence level, and *** indicates that the test results are significant at the 1% confidence level.
Table 8. Threshold regression results of model 2.
GTFPCoefficient
FD ≤ 2.3462.346 < FD ≤ 3.193FD > 3.193
FDI−0.5459 *
(−1.75)
0.2126
(−0.025)
1.4132 ***
(−4.69)
R20.6270.4010.865
Sample size25922992
Provinces and municipalities within different levels of financial development in 2017Henan, Hunan, and ShandongHebei, Shaanxi, Anhui, Jiangxi, Inner Mongolia, Guangxi, Jiangsu, Heilongjiang, Jilin, Fujian, and HubeiBeijing, Shanghai, Gansu, Qinghai, Liaoning, Hainan, Zhejiang, Shanxi, Ningxia, Xinjiang, Guizhou, Guangdong, Yunnan, Sichuan, and Tianjin
Note: adding * indicates that the test results are significant at the 10% confidence level, ** indicates that the test results are significant at the 5% confidence level, and *** indicates that the test results are significant at the 1% confidence level.
Table 9. Threshold regression results of model 3.
GTFPCoefficient
FD ≤ 1.731FD ≤ 3.182FD > 3.182
lnRD0.0069391 * (−1.95)0.049547 * (−1.98)0.0647392 ***
(−5.22)
R20.7500.7410.805
Sample size5743192
Provinces and municipalities within different levels of financial development in 2017nilHebei, Shaanxi, Anhui, Jiangxi, Inner Mongolia, Guangxi, Jiangsu, Heilongjiang, Jilin, Fujian, Hubei, Henan, Hunan, and ShandongBeijing, Shanghai, Gansu, Qinghai, Liaoning, Hainan, Zhejiang, Shanxi, Ningxia, Xinjiang, Guizhou, Guangdong, Yunnan, Sichuan, and Tianjin
Note: adding * indicates that the test results are significant at the 10% confidence level, ** indicates that the test results are significant at the 5% confidence level, and *** indicates that the test results are significant at the 1% confidence level.
Table 10. Threshold regression results of model 4.
GTFPCoefficient
FD ≤ 1.731FD > 1.731
EG−0.0612 **
(−2.89)
0.0904 ***
(5.36)
R20.5770.719
Sample size57523
Provinces and municipalities within different levels of financial development in 2017nilBeijing, Shanghai, Gansu, Qinghai, Liaoning, Hainan, Zhejiang, Shanxi, Ningxia, Xinjiang, Guizhou, Guangdong, Yunnan, Sichuan, Tianjin, Hebei, Shaanxi, Anhui, Jiangxi, Inner Mongolia, Guangxi, Jiangsu, Heilongjiang, Jilin, Fujian, Hubei, Henan, Hunan, and Shandong
Note: adding * indicates that the test results are significant at the 10% confidence level, ** indicates that the test results are significant at the 5% confidence level, and *** indicates that the test results are significant at the 1% confidence level.