Article

Effects of Indoor Plants on the Physical Environment with Respect to Distance and Green Coverage Ratio

Department of Landscape Architecture, National Chin-Yi University of Technology, No.57, Sec. 2, Zhongshan Rd., Taiping Dist., Taichung 41170, Taiwan
Sustainability 2019, 11(13), 3679; https://doi.org/10.3390/su11133679
Submission received: 28 May 2019 / Revised: 1 July 2019 / Accepted: 1 July 2019 / Published: 4 July 2019
(This article belongs to the Section Environmental Sustainability and Applications)

Abstract

:
Few studies have conducted experiments in daily living environments to examine the effects of indoor plants on objective aspects of the physical environment. This study examined the effects of plant distance and green coverage ratio on the objective physical environment and subjective psychological perceptions, along with the correlation between the objective physical environment and subjective psychological perceptions regarding indoor plants. A randomized control trial of plant distance and green coverage ratio was conducted in a room located in the basement of a university building in Taiwan. Aspects of the objective physical environment were measured using air quality detectors. Subjective psychological perceptions were evaluated based on the questionnaire responses of 60 undergraduates. The results revealed that (1) regardless of number of plants, the closer the plant, the higher the CO2 level; (2) more indoor plants resulted in higher CO2 and humidity and lower PM2.5, PM10, and temperature; and (3) the lower the levels of fine and suspended particles in the air were, the stronger were the feelings of preference, naturalness of the environment, and pleasure in participants. Indoor plants that can regulate indoor air quality and microclimates without consuming energy warrant greater attention and wider application.

1. Introduction

People in contemporary society spend 80% to 90% of their time indoors every day [1]. Thus, having a comfortable indoor environment with favorable indoor air quality is imperative, as indicated by the increasing prevalence of sick building syndrome [2]. In the United States alone, roughly 27 million office workers are at risk of sick building syndrome, and 30% of new buildings worldwide are associated with indoor air pollution problems [3]. Moreover, indoor air pollution is generally 2 to 5 times worse (sometimes up to 100 times worse) than outdoor air pollution [4]. This may be one of the reasons that people in contemporary society are experiencing increasingly severe physical and mental health problems, along with declining general wellbeing [5].
By contrast, exposure to nature is considered beneficial to physical and mental health [6]. This is why people often grow plants indoors to improve the quality of their living environment and workspace [7], because plants represent nature [8,9]. Empirical studies have also demonstrated that indoor plants have positive effects on physical and mental health as well as general wellbeing [10,11]. Therefore, the beneficial effect of indoor plants on public health is a topic requiring exploration.
Research has shown that having even a few indoor plants is beneficial to the general wellbeing and physical and mental health of humans. For example, covering 6% of an indoor floor area with indoor plants can elicit significantly stronger feelings of preference, comfort, and friendliness in students and reduce their misbehavior and number of sick leave days [12]. A study conducted in real offices showed that the presence of plants has a significant effect on reducing short-term sickness absence, compared to the absence of plants [13]. Similarly, having a green space comprising 2% of a classroom floor area can promote feelings of wellbeing in students [14]. Considering the extremely low number of indoor plants used, the differences in participant responses were attributed to the possible effects of novelty (adding “something new” to the classroom perceived visually, olfactorily, auditorily and/or tactually) and not necessarily to the positive effects of the indoor plant itself. Furthermore, the distance from indoor plants appears to have distinct effects on the subjective feelings of humans [14,15,16]. Another possibility is that people’s responses were affected by the visibility of the plant rather than its distance from them because greater proximity to a plant corresponds to greater plant visibility. Studies have reported a positive correlation between the visible density of urban tree coverage with stress recovery [17] and landscape preference [18].
Plants are the most common element of nature and are also often regarded as the most representative of nature [8,9]. This is true even within manmade structures. However, a room with plants differs from the natural outdoor environment in that the plants have been separated from their natural habitat. Therefore, the role of indoor plants is ambiguous: they can be perceived as a symbol of nature or as a result of human intervention, interference, and even control over nature [8]. Research has yet to explore the effects of indoor plants with respect to novelty and perceived naturalness. This study is the first to examine the psychological effects (i.e., novelty and perceived naturalness) of bringing plants, which symbolize nature, from outdoor (natural environment) to indoor settings (artificial environment).
Furthermore, the objective effects of indoor plants on the physical environment (e.g., air quality, temperature, and humidity) should also be examined. Because mechanical ventilation and air-conditioning generally consume energy, research should focus on energy-free methods of regulating indoor air quality and microclimate [19]. Studies conducted since 1989 have reported that indoor plants can significantly reduce urban air pollution [20,21,22,23,24,25,26]. Nevertheless, little research has conducted experiments in a daily living environment to examine the effects of indoor plants on air quality, temperature, and humidity. The majority of existing experiments of indoor plants have involved highly concentrated pollutants in small closed fumigation chambers, and these experiments have not investigated the effects of distance from indoor plants. Greater proximity to the plant should yield more favorable effects, considering that air purification and microclimate regulation rely on plant photosynthesis, adsorption, respiration, transpiration [27], and soil microbes [22,25]. Additionally, objective conditions of the physical environment (i.e., air quality, temperature, and humidity) should also influence subjective psychological perceptions (e.g., preference, emotions, and comfort).
The primary objective of this study was, therefore, to investigate the effects of the distance from indoor plants on the objective aspects of the physical environment (i.e., air quality, temperature, and humidity) and subjective psychological perceptions (i.e., novelty, perceived naturalness, preference, emotions, and environmental comfort). Plant effects were further manipulated with the distance and green coverage ratio using the experimental method. The green coverage ratio refers to the ratio of floor area covered by the vertical projection of plants to the total surface area. This ratio is an objective measure of the number of plants in a two-dimensional plane. Stapleton and Ruiz-Rudolph [28] revealed a linear correlation between the number of plants and the percentage of ultrafine particle reduction. The secondary objective was to examine the correlation between the objective physical environment and the subjective psychological perceptions regarding indoor plants.
The hypotheses proposed in this study are as follows:
Hypothesis 1 (H1).
Plants at different distances and with the same green coverage ratio have different effects on the objective physical environment in terms of air quality, temperature, and humidity.
Hypothesis 2 (H2).
Plants at the same distance but with different green coverage ratios have different effects on the objective physical environment in terms of air quality, temperature, and humidity.
Hypothesis 3 (H3).
Plants at the same distance but with different green coverage ratios have different effects on the subjective psychological perceptions of participants, including novelty, perceived naturalness, preference, emotions, and environmental comfort.
Hypothesis 4 (H4).
Air quality, temperature, and humidity correlate to novelty, perceived naturalness, preference, emotions, and environmental comfort.

2. Materials and Methods

2.1. Research Design

This study, which was part of a series of experiments for a research project, conducted a randomized controlled trial. To examine the effects of indoor plants on the physical environment, we constructed control conditions and experimental treatments. The order of the experimental treatments was randomly decided. To examine the effects of indoor plants on the perceptions of participants, participants were randomly assigned to different experimental treatments. All participants gave informed consent for inclusion before they underwent the experiment. The study was conducted in accordance with the Declaration of Helsinki of 1975, and was approved by the Ministry of Science and Technology in Taiwan, which did not require this study to be submitted to the Ethics Committee.

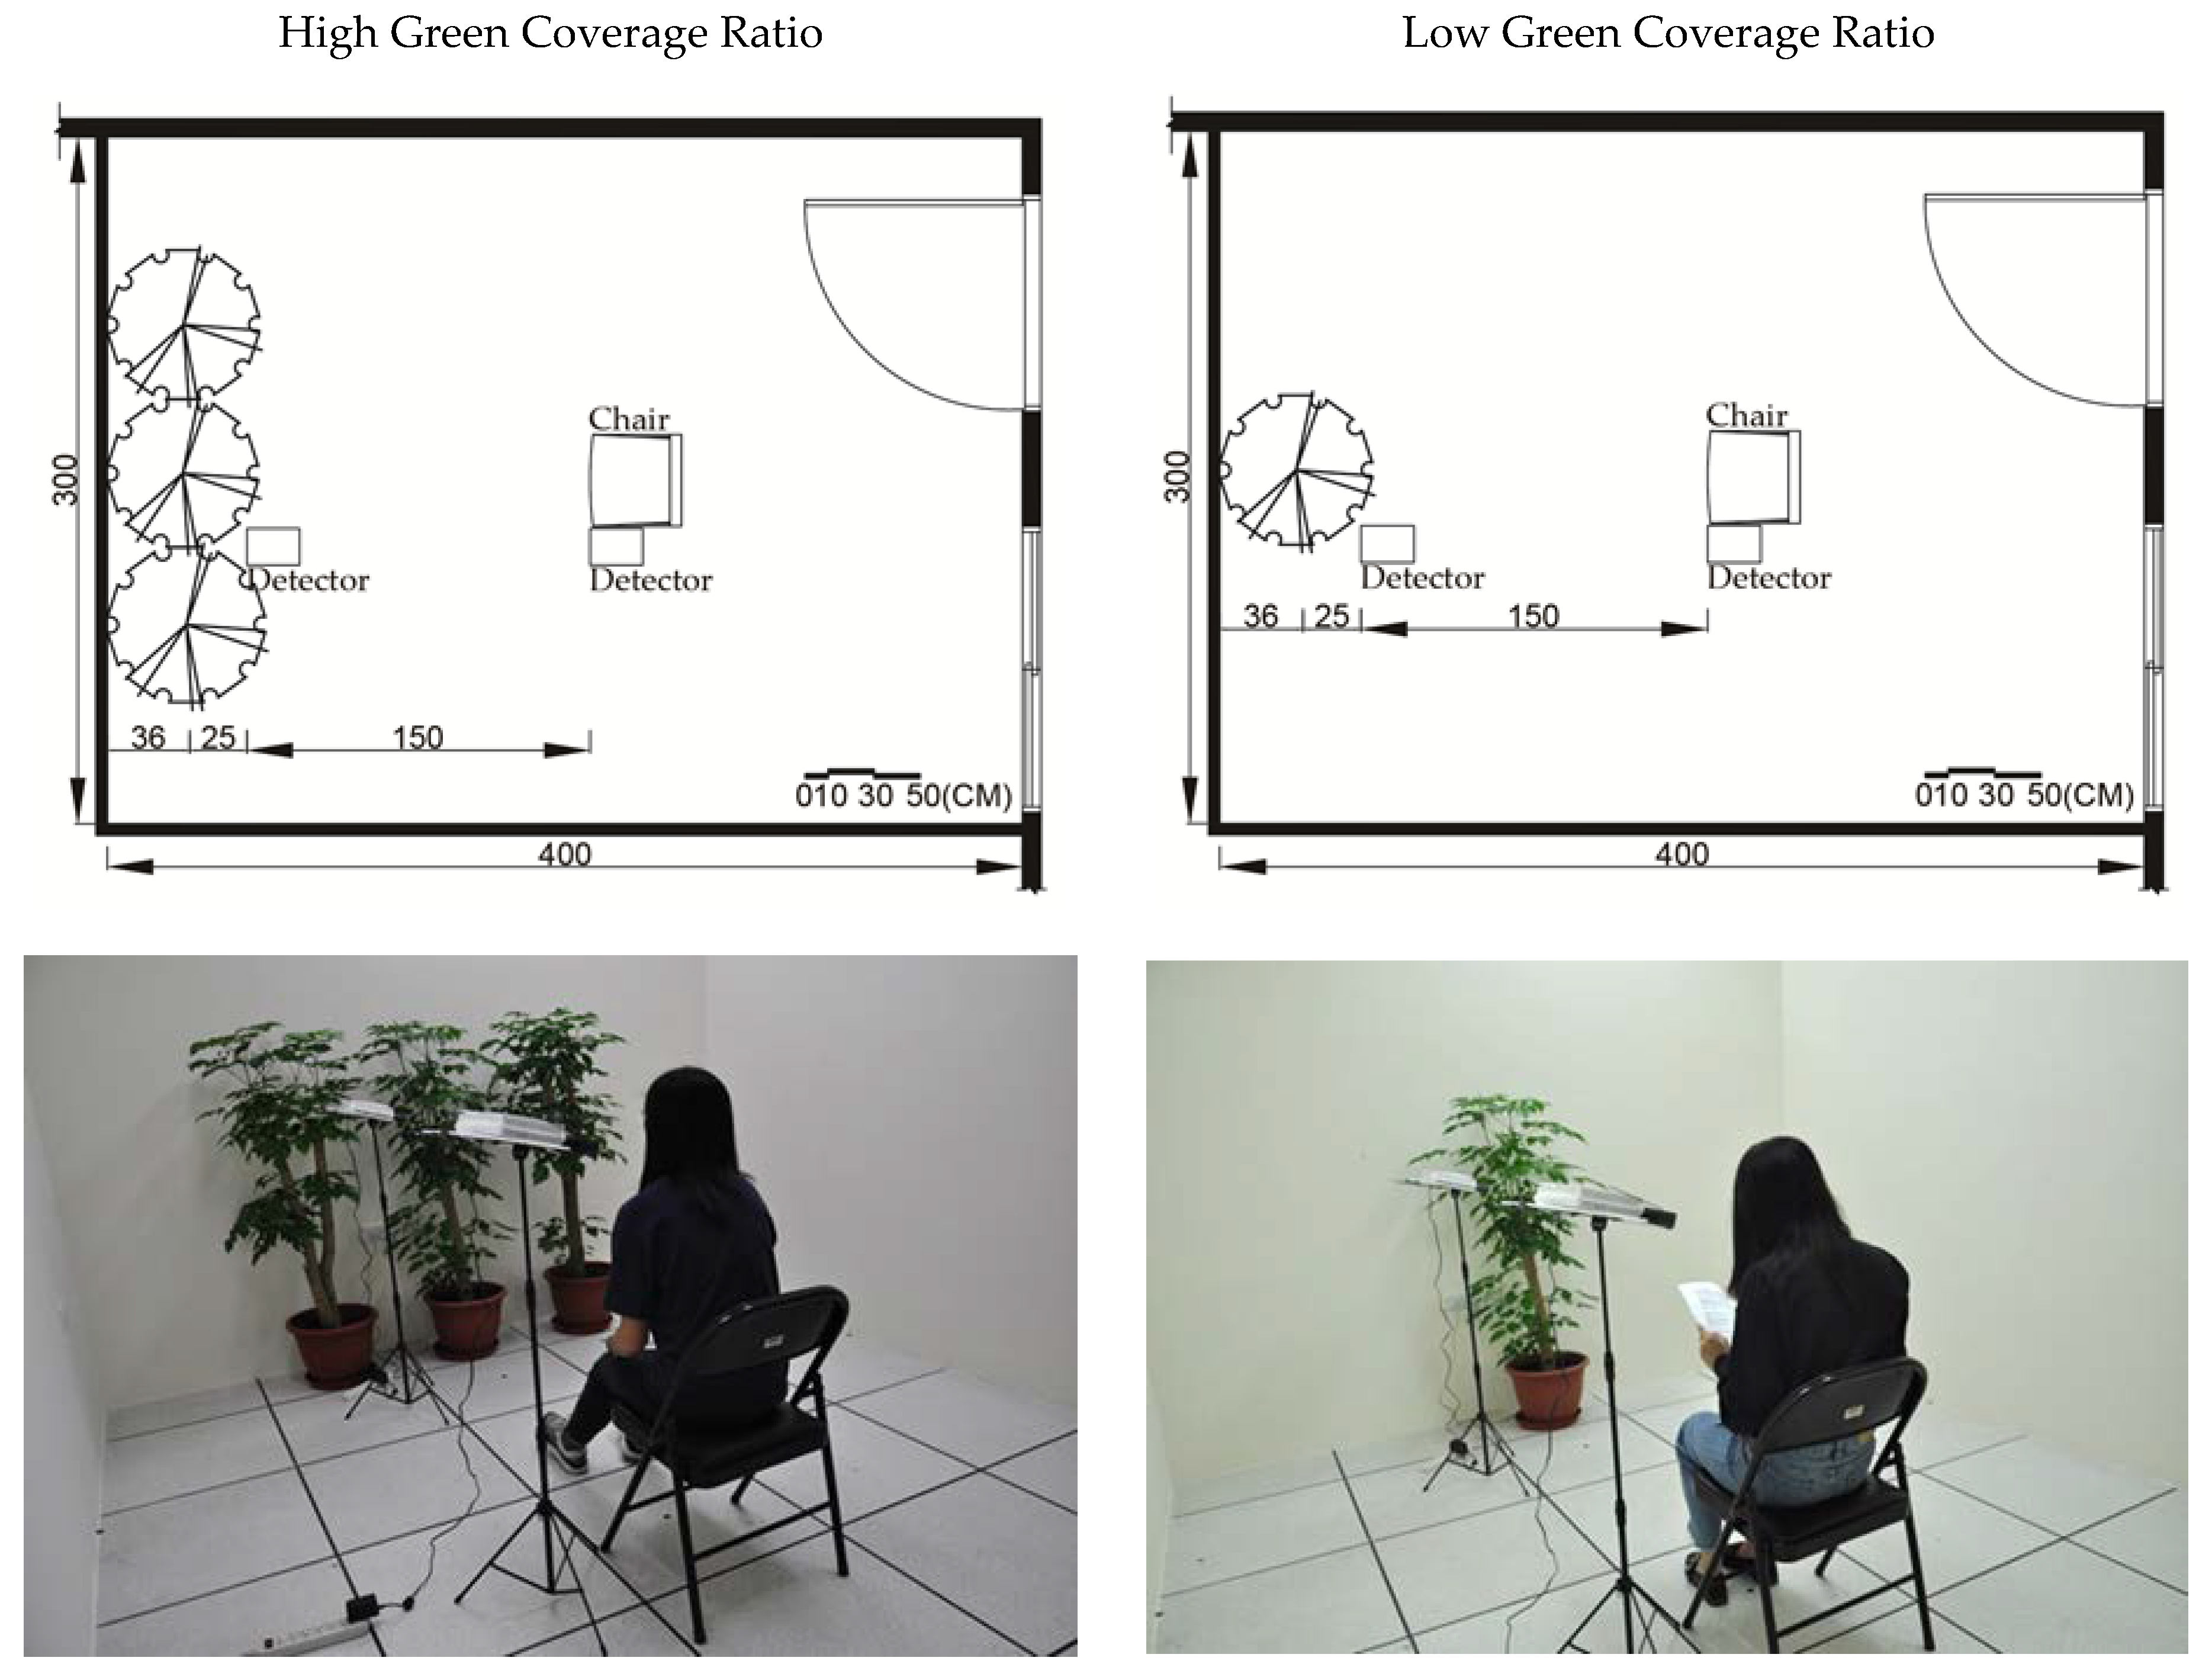
2.2. Experimental Setup

The experiment for this study was conducted in a room located in the basement of a technology university in central Taiwan. The room (length 4.0 m × width 3.0 m × height 3.85 m) was newly constructed in October 2018. During the experiment, the windows in the room were kept shut, the air-conditioner was switched off but the air conditioning vents were not blocked, and the curtains were drawn to avoid distractions from the view of the landscape outside. The experimental environment tended to be more like an actual living or working space rather than a completely isolated laboratory unit. Except for participants, no one entered or exited the room during the experiment. However, when the participants opened the door and entered and exited the room, the physical environment of the room changed.
The Rural Development Administration of South Korea recommends installing one large potted plant and one small potted plant per 6 m2 floor area in a room [29]. US studies have also recommended placing at least one 6-in (15.24 cm) potted plant per 9 m2 floor area in a room [30] to purify indoor air. Since the room in which our experiment was conducted had a floor area of 12 m2 at least two large potted plants (diameter of 24 or 30 cm) and two small potted plants (diameter of 18 cm) should be installed to improve the indoor air quality. For simplicity, this study selected only large potted plants (pot diameter 37 cm and plant height of around 1.3 m) because the eye of a sitting person is at a height of approximately 1.1 m from the ground [31]. The indoor plant used was the evergreen Radermachera hainanensis Merr. a shade-bearing tree whose brightly colored leaves give the plant its ornamental value [32]. Though this tree has become popular for indoor use in Taiwan in recent years, its ability to improve air quality and its influence on people’s responses has never been examined. Plants tested in experiments for their effects should be used as plants are normally used in daily living. The plant pots were made of plastic. The growing medium was potting soil. Since we viewed the plants, pots, and potting soil as a whole unit, we did not distinguish the possibly different influences of the plants, pots, and potting soil.
The experimental manipulation to achieve a low green coverage ratio (3.00 %) involved placing one large potted plant against the wall farthest from the door at the midpoint between two corners of the room. The experimental manipulation to achieve a high green coverage ratio (8.83 %) involved placing three large potted plants against the wall so that the tree canopies of all three plants were touching. The low and high green coverage ratios were intentionally limited because previous research has found that even a few indoor plants are beneficial to human health [12,14]. Further, we followed the recommendations for the minimum number of indoor plants for improving air quality [29,30]. Table 1 details the plant distance and green coverage ratio of the experimental treatments. Before each of the experimental treatments, a control condition was conducted with no plants in the room.
The participants of this experiment were 60 students studying in daytime programs at a technology university in central Taiwan. For all experiments, participants sat on a chair placed in the center of the room at a distance of 1.5 m from the potted plant(s) (Figure 1). In the experiment, participants were asked to sit down, observe the surrounding environment for 1 min, and ignore the two measuring instruments as much as possible. After observing the room, participants began to fill out the questionnaire, and were given as much time as they required, provided that they spent at least 5 min on it.

2.3. Objective Measurement of the Physical Environment

The physical environment was objectively measured using two indoor air quality detectors, which were both placed slightly to the left of the chair. The two detectors were placed 1.1 m above the ground and 0.25 and 1.5 m away from the bottom of the potted plant(s), respectively. The indoor air quality detectors used in this study (iAeris 14, Kaoten Scientific Co., Ltd., Kaohsiung, Taiwan) can measure changes across eight aspects of the physical environment: temperature, humidity, carbon monoxide (CO), carbon dioxide (CO2), coarse particulate matter (PM10), fine particulate matter (PM2.5), formaldehyde (HCHO), and total volatile organic compound (TVOCs) levels (Table 2 for specifications). The air quality detectors had quality control and quality assurance, which were calibrated again before the experiment. The air quality detectors were switched on throughout the experiment and uploaded the data measurements to the cloud every 6 min. Therefore, there was no repetition in the measurements of the physical environment.

2.4. Subjective Measurement of Psychological Perceptions

This study employed a questionnaire to measure the subjective perceptions of the participants. The questionnaire contained six sections: (1) preference, (2) environmental comfort, (3) perceived naturalness, (4) novelty, (5) the pleasure–arousal–dominance (PAD) emotional state scale, and (6) participant demographic information. The participants selected their answer on a 9-point Likert scale on which a higher score indicates a greater level of agreement with the questionnaire item. Participant demographics consisted of sex, year of birth, college, department, and year of study.

2.4.1. Preference

Preference reflects an immediate and direct response to or assessment of the environment in general [33,34] and can be either task-dependent, which is related to a specific activity, or task-independent, which is unrelated to any particular activity [35]. The survey of preference for indoor plants in this study comprised two items: “mere liking,” which is task-independent, and “whether (the participants) liked to study in the space,” which is task-dependent [36,37]. The total average score for these two items constituted the index score for the preference.

2.4.2. Environmental Comfort

Few studies have investigated the effects of indoor plants on comfort level. Nevertheless, one literature review derived four dimensions of indoor environmental quality: thermal comfort, visual comfort, acoustic comfort, and indoor air quality [38]. Therefore, the environmental comfort examined in this study also covered these four items: How do you evaluate the indoor thermal environment? How do you evaluate the indoor visual comfort? How do you evaluate the indoor acoustic comfort? How do you evaluate the indoor air quality [39]? The index score for the environmental comfort was obtained by calculating the average of the total scores for these four items. A higher score indicates greater comfort.

2.4.3. Perceived Naturalness

Perceived naturalness refers to the subjective perception of the closeness of a physical environment to a natural state [40,41]. Higher levels of perceived naturalness of a landscape or environment indicate that a landscape or environment is perceived as closer to its natural state [42]. Ho and Chang [43] developed a 16-item perceived naturalness scale consisting of two constructs: richness of natural elements and environmental wildness. The items used in this study for perceived naturalness were also adapted from other studies to comprise a total of three dimensions (naturalness, richness of natural elements, and environmental wildness), each of which consisted of two items (e.g., Do you think this environment is natural? Is this environment full of vitality? Is this environment without a trace of human destruction?). A higher score indicates a greater level of naturalness. The index score for the perceived naturalness was calculated by first determining the composite scores of the three dimensions (i.e., the total score of all items in each dimension divided by the number of items) and then averaging the composite scores.

2.4.4. Novelty

A novelty scale suitable for this study has not yet been developed. Therefore, this study adopted two related scales that have been used in Taiwan and overseas. The first scale was obtained from Lee and Crompton [44], who argued that novelty has four dimensions: change from routine, thrill, surprise, and boredom alleviation. The second is the familiarity scale developed by Cheng, Shen, and Chon [45], given that familiarity is the opposite of novelty [46]. Cheng et al. [45]. classified familiarity of a place into four categories based on Baloglu [47]: overall familiarity, having seen it, having the ability to recognize it, and having visited it. The novelty items in this study were adapted from the two aforementioned scales and adjusted to include two items from each of the four dimensions specified by Lee and Crompton [44] and the three types of familiarity (not including overall familiarity) proposed in Cheng et al. [45], which were reverse-worded. Therefore, the novelty items proposed in this study comprised a total of five dimensions and eleven questions (e.g., There are new things in this environment that I can explore. This environment feels a bit dangerous to me. This environment makes me feel a little surprised. This environment can reduce my boredom. I have never seen this environment or a similar environment.). A higher score denotes greater novelty. The index score of the novelty was calculated by first determining the composite scores of the five dimensions (i.e., the total score of all items in each dimension divided by the number of items) and then averaging the composite scores.

2.4.5. Emotions

Emotion is considered to be an innate human quality, as evidenced by the emotional expressions of newborn infants [48,49]. Emotions are widely believed to be the fundamental factor influencing environmental perception [50,51,52]. This study adopted the PAD emotional state scale [53], which consists of three dimensions: pleasure–displeasure, arousal–nonarousal, and dominance–submissiveness. Each dimension has six adjectives (e.g., “happy-unhappy; excited-calm; in control-cared for”), and the scores on the scale ranges from 4 to −4. The scores of the PAD scale were calculated by determining the composite scores of the three dimensions, which represent the average score for each adjective. A higher score denotes a higher level of perception toward the dimension.

2.5. Statistical Analyses

The statistical analyses were conducted using IBM SPSS Statistics 22.0 (IBM, Armonk, NY, USA). The data on the physical environment and the psychological perception were first analyzed for their normality and homogeneity of variance, which are the premise of parametric statistical tests such as analysis of variance [54]. The data on the physical environment failed to pass the tests of normality and homogeneity of variance and were, thus, analyzed using nonparametric statistical tests for detecting difference between conditions. The data on the psychological perceptions passed the tests of normality and homogeneity of variance and were analyzed using parametric statistical tests for detecting difference between conditions. In addition, when the focus of interest was the difference within the same condition (controls or treatments), tests with related samples were conducted (e.g., the Wilcoxon tests). When the focus of interest was the difference between different conditions, tests with independent samples were conducted (e.g., the Mann-Whitney U test) [54]. Since the indicators of the difference in the physical environment and the psychological perceptions were the means of the measurement data, the means were below the detection resolution of the air quality detector and the digits of the scale, respectively.

3. Results

3.1. Objective Physical Environment

3.1.1. Control Conditions

The control conditions were that the room did not have any plants inside. To match the total number of the data points of the control conditions to that of the experimental treatments, 30 data points from the physical environments were randomly selected for the control condition before each of the experimental treatments. The results showed that although the room had been recently constructed, the air pollution levels of the control conditions were still much lower than the standards mandated under the Indoor Air Quality Act (Table 3). Newly constructed rooms and/or buildings usually have high air pollution levels because of the Volatile Organic Compounds (VOCs) emitted from the building materials such as paint, flooring, caulking, sealants, and engineered wood [55].
Furthermore, there were some significant differences in the physical environment between 0.25 m and 1.5 m, as indicated by the results of the Wilcoxon tests with two dependent samples using the physical environmental factors as dependent variables and the distance as the independent variable. For the control condition of the high green coverage ratio treatment, PM2.5 and PM10 at 1.5 m distance were significantly greater than at 0.25 m, while CO2, HCHO, TVOC, temperature, and humidity at the 0.25 m distance were significantly greater than at the 1.5 m distance (Table 4). However, for the control condition of the low green coverage ratio treatment, only the temperature at 0.25 m was significantly greater than at 1.5 m (Table 5).

3.1.2. Difference between High Green Coverage Ratio Treatment and Its Control

The results of the Mann-Whitney U tests with two independent samples using the physical environmental factors as dependent variables and the condition as the independent variable showed that PM2.5, PM10, TVOC, and temperature were significantly greater for the control than for the high green coverage ratio treatment at 0.25 m, while CO2, HCHO, and humidity were significantly greater for the high green coverage ratio treatment than for the control at 0.25 m (Table 6). Further, the results of the Mann-Whitney U tests with two independent samples using the physical environmental factors as dependent variables and the condition as the independent variable showed that TVOC and temperature were significantly greater for the control than for the high green coverage ratio treatment at 1.5 m, while CO2 and humidity were significantly greater for the high green coverage ratio treatment than for the control at 1.5 m (Table 7).

3.1.3. Difference between Low Green Coverage Ratio Treatment and Its Control

The results of the Mann-Whitney U tests with two independent samples using the physical environmental factors as dependent variables and the condition as the independent variable showed that PM2.5 and PM10 were significantly greater for the control than for the low green coverage ratio treatment at 0.25 m, while CO2, HCHO, temperature, and humidity were significantly greater for the low green coverage ratio treatment than for the control at 0.25 m (Table 8). Further, the results of the Mann-Whitney U tests with two independent samples using the physical environmental factors as dependent variables and the condition as the independent variable showed that PM2.5 and PM10 were significantly greater for the control than for the low green coverage ratio treatment at 1.5 m, while CO2, temperature, and humidity were significantly greater for the low green coverage ration treatment than for the control at 1.5 m (Table 9).

3.1.4. Difference between High and Low Green Coverage Ratio Treatments

The results of the Mann-Whitney U tests with two independent samples using the physical environmental factors as dependent variables and the experimental treatment as the independent variable showed that humidity was significantly greater for the low green coverage ratio treatment than for the high green coverage ratio treatment at 0.25 m (Table 10). Further, the results of the Mann-Whitney U tests with two independent samples using the physical environmental factors as dependent variables and the experimental treatment as the independent variable showed that CO2 and humidity were significantly greater for the low green coverage ratio treatment than for the high green coverage ratio treatment at 1.5 m (Table 11).

3.1.5. Difference between Different Distances

The results of the Wilcoxon tests with two dependent samples using the physical environmental factors as dependent variables and the distance as the independent variable showed that HCHO and temperature were significantly greater at 0.25 m than at 1.5 m for the high green coverage ratio treatment, while PM2.5 and PM10 were significantly greater at 1.5 m than at 0.25 m for the high green coverage ratio treatment (Table 12). Further, the results of the Wilcoxon tests with two independent samples using the physical environmental factors as dependent variables and the distance as the independent variable showed that CO2, HCHO, and temperature were significantly greater at 0.25 m than at 1.5m for the low green coverage ratio treatment, while PM2.5 and PM10 were significantly greater at 1.5 m than at 0.25 m for the low green coverage ratio treatment (Table 13).

3.2. Subjective Psychological Perceptions

3.2.1. Participants’ Demographic Information

This study had a total of 60 participants (12 men; 48 women), who had an average age of 20.92 years (SD = 1.44). A total of 30 participants (8 men; 22 women) were randomly assigned to receive the high green coverage ratio treatment, and 30 participants (4 men; 26 women) were randomly assigned to receive the low green coverage ratio treatment. Next, a chi-square test was performed with sex, college, department, and year of study as the dependent variables and experimental treatment as the independent variable. The results revealed no significant differences in sex, college, department, and year of study (p > 0.05). Additionally, the results of the independent sample t test revealed a nonsignificant difference between the experimental groups (p > 0.05) in terms of age.

3.2.2. Scale Reliability

This study adopted questionnaires for measuring preference, environmental comfort, perceived naturalness, novelty, and PAD emotional state to investigate the effects of different experimental treatments on the subjective psychological perceptions of participants to examine hypothesis 3. Table 14 provides the reliability of each scale. The Cronbach’s α of the environmental comfort scale was 0.67, which is slightly less than ideal. The Cronbach’s α of all other scales was greater than 0.728, indicating favorable internal consistency reliability [56].

3.2.3. Difference in the Participant Perceptions between Different Experimental Treatments

The results of the independent sample t test revealed a nonsignificant difference regarding preference (index score) and environmental comfort (index score) between the experimental treatments (p > 0.05), and the difference contained a zero in the 95% confidence interval for the difference (Table 15). One-way multivariate analyses of variance (MANOVA) using the perceived naturalness, novelty, PAD emotions as dependent variables and the experimental treatment as the independent variable revealed that the four variables of perceived naturalness (3 composite scores and index score), six variables of novelty (5 composite scores and index score), and three variables of the PAD scale (3 composite scores) were not significant (p > 0.05), indicating no significant difference between the experimental treatments (Table 16).
Because more than one dependent variable was examined, MANOVA was used since it can simultaneously consider the relationship of several dependent variables, particularly between the composite scores and the index scores in this case, to test whether a significant difference exists in the experimental treatment and analyze whether the experimental treatment exhibits significant differences across the individual dependent variables. However, analysis of variance (ANOVA) hypothesizes that no relationship exists between the dependent variables, and analyzes each individual dependent variable. By contrast, MANOVA is a statistical test of all dependent variables based on their optimal linear combination [57].

3.3. Correlations between Objective Factors of the Physical Environment and Subjective Psychological Perceptions

Because the participants sat at a distance of 1.5 m from the plants, their subjective psychological perceptions were subject to a correlation analysis with the objective factors of the physical environment measured at a distance of 1.5 m from the plants. Given that the focus of interest was the relationships between the participants’ subjective perceptions and the physical environment with respect to the plants, the correlation analysis used the data on both the low and high green coverage ratio treatments. The results are as follows. (1) Preference exhibited a significantly weak negative correlation with PM2.5 and PM10. (2) Environmental comfort exhibited no significant correlation with air quality, temperature, and humidity. (3) Perceived naturalness exhibited a significantly weak negative correlation with PM2.5 and PM10. (4) The novelty index score exhibited a significantly weak negative correlation with TVOC level. (5) Change in routine in novelty exhibited a significantly weak negative correlation with TVOC level. (6) Pleasure in the PAD scale exhibited a significantly moderate negative correlation with PM2.5 and a significantly weak negative correlation with PM10 (Table 17).

4. Discussion

The first hypothesis (H1) of this study postulates that different plant distances correspond to different effects on the objective physical environment in terms of air quality, temperature, and humidity level. The results showed that H1 could not be rejected. When the high green coverage ratio treatment was compared to its control, the significantly greater CO2, TVOC, and humidity at 0.25 m than 1.5 m were no longer significant. This may because the participants siting at 1.5 m exhaled CO2 and TVOC that was purified by the 3 plants via their respiration. However, the change in humidity was difficult to explain. It was expected that the humidity would be greater when closer to the plants than when farther away due to the evapotranspiration of the plants. Nevertheless, some plants can reduce the humidity in the air [58]. When the low green coverage ratio treatment was compared to its control, PM2.5 and PM10 were significantly greater at 1.5 m than at 0.25 m, while CO2 and HCHO were significantly greater at 0.25 m than at 1.5 m. This may because (1) PM2.5 and PM10 were reduced by the single plant via its respiration [59], (2) the plant itself exhaled CO2, though photosynthesis also reduced CO2, and (3) HCHO was released by the newly painted wall. Although the control conditions of the two treatments, which were different from each other, made the examinations of the effects of the plants at different distances difficult, it was clear that regardless of number of plants, the closer the plant, the higher CO2 level. It is also suggested that closer to indoor plants there was less particulate matter.
The second hypothesis (H2) of this study postulates that the effects on the objective physical environment in terms of air quality, temperature, and humidity level would differ when the distance from the plant remains the same but the green coverage ratio varies. The results partially supported H2. Regardless of the distance from the plant (1.5 m and 0.25 m), CO2 and humidity were significantly greater for the high green coverage ratio treatment than for its control, while TVOC and temperature were significantly greater for the control than for the high green coverage ratio treatment. Further, regardless of the distance from the plant, CO2, temperature, and humidity were significantly greater for the low green coverage ratio treatment than for the control, while PM2.5 and PM10 were significantly greater for the control than for the low green coverage ratio treatment. Therefore, regardless of the distance from the plant, CO2 and humidity were significantly greater for the presence of indoor plants (3 and 1 plants) than for the absence of indoor plants. This may because the plant exhaled CO2 and transpirated water. In addition, it suggested that three indoor plants could reduce temperature at both 1.5 m and 0.25 m because of transpiration, while one indoor plant could not reduce the temperature at both 1.5 m and 0.25 m. However, humidity was greater for the low green coverage ratio treatment than for the high green coverage ratio treatment at both 1.5 m and 0.25 m, which was difficult to explain. It was expected that more plants produce greater humidity unless the plants can reduce humidity [58].
The third hypothesis (H3) of this study postulates that the effects on subjective psychological perceptions in terms of novelty, preference, perceived naturalness, emotions, and environmental comfort would differ when the distance from the plant remains the same but the green coverage ratio varies. The results did not support H3. Therefore, the green coverage ratio (8.83% or 3.00%) did not influence the subjective psychological perceptions of participants. This result differs from Han [12], who reported that a 6% green coverage ratio could elicit significantly stronger feelings of preference and comfort in students. However, this study adopted an experimental method to investigate the preferences (task-dependent and task-independent) and environmental comfort (four items) of university students following brief exposure to R. hainanensis Merr., whereas Han [12] conducted a field quasi-experiment to examine the preference (one item) and comfort (one item) of students from junior high schools after prolonged exposure to Cinnamomum kotoense Kanehira et Sasaki. Therefore, a direct comparison of our study with that of Han [12] may not appropriate. In addition, this study discovered that the participants’ feelings of novelty were unaffected, irrespective of the number of potted plants. Hence, the finding reported in other studies that only a few indoor plants benefit peoples’ physical and mental health as well as overall wellbeing [12,14,16,60] is unlikely attributable to the effect of novelty. In future investigations of the effects of indoor plants on participants’ subjective psychological perceptions, researchers may need to further increase the green coverage ratio to identify possible effects.
The fourth hypothesis (H4) of this study postulates that air quality, temperature, and humidity correlate with novelty, perceived naturalness, preference, emotions, and environmental comfort. The results partially supported H4. Preference, perceived naturalness, and pleasure exhibited a significant negative correlation with PM2.5 and PM10 levels. Therefore, the lower levels of fine and suspended particles in the air, the stronger the feelings of preference, naturalness of the environment, and pleasure in participants. Furthermore, both change in routine in the novelty and the index score for novelty exhibited a significant negative correlation with TVOC level, suggesting that the lower levels of TVOC in the air, the stronger the feelings of novelty and change from routine in participants. This may because participants spend much time in TVOC-polluted rooms [61] and likely have become accustomed to such environments. Finally, environmental comfort and objective physical environmental factors were not significantly correlated, possibly because the air quality, temperature, and humidity level of the experimental room did not vary considerably and were within standard ranges defined by the Indoor Air Quality Act (Table 3).
This study examined the effects of indoor plants on both the physical environment and the psychological perceptions, manipulating their distances and green coverage ratios. This made the research design relatively complicated. A limitation of this study was that the participants were situated only at 1.5 m but not at 0.25 m from the plant, which resulted in an unbalanced design. The air quality detector at 1.5 m would be more affected by its proximity to the participant than the plant. Although any person in the room would emit heat, VOCs, CO2, and would likely re-suspend particulate matter, this was not the case in this study, except for CO2. Future studies may adopt more straight forward approaches than this one. Moreover, the analyses of the data on the physical environment relying on the nonparametric statistical tests could not take into account the effects of both the plant distances and amount simultaneously. Therefore, the effects of the plant distances and green coverage ratios on the physical environment were analyzed separately. When combining the pieces of information together, the results showed a clearer picture: (1) regardless of number of plants, the closer the plant, the higher the CO2 level; (2) the major effects of more indoor plants were greater CO2 and humidity; and (3) the secondary effects of more indoor plants were less PM2.5 and PM10 as well as lower temperature. Furthermore, given that the experiments of this study were conducted in an actual environment, some variables such as weather could not be fully controlled. It rained for two days and one day during the high and the low green coverage ratio treatment, respectively, which may influence the physical environment (e.g., humidity) and the psychological perceptions (e.g., emotions) [62]. More replication studies are needed.
More studies on the physiology of R. hainanensis Merr are necessary. How much water the plant needs for photosynthesis, how much it transpirates, how much CO2 its exhales during its breathing, and how much it absorbs during its photosynthesis remain unknown. Laboratory studies and field studies are both needed.

5. Conclusions

This study was the first to verify that the distance from indoor plants and their green coverage ratio in a real setting can significantly influence the physical environment. Simply placing one or three large pots of R. hainanensis Merr. in a room with a floor area of 12 m2 can increase the humidity levels and reduce PM2.5 and PM10. Further, three large pots of R. hainanensis Merr. can reduce temperature more significantly than one large pot. These findings bridge the gap in research regarding experiments that mostly involve highly concentrated pollutants in small and enclosed fumigation chambers, which differ from people’s daily living environments. Furthermore, the literature still lacks investigations of the distance and green coverage ratio of indoor plants. This study also demonstrated findings that only a few indoor plants benefit people’s physical and mental health and wellbeing are probably not attributable to the effect of novelty, and further revealed that even a few pots of indoor plants in a minimally polluted room, which meets the Indoor Air Quality Act, can still effectively improve the air quality and environmental comfort. Therefore, indoor plants that can regulate indoor air quality and microclimates without consuming energy warrant greater attention and wider application.

Funding

Ministry of Science and Technology MOST 107-2410-H-167-008-MY2.

Acknowledgments

This study represents the partial results of a research project sponsored by the Ministry of Science and Technology in Taiwan (MOST 107-2410-H-167-008-MY2). The sponsors had no role in the design, execution, interpretation, or writing of the study. The author thanks L.-W. Ruan for data collection, organization, and analyses.

Conflicts of Interest

The author declares no conflict of interest.

References

  1. American Lung Association. When You can’t Breathe, Nothing Else Matters. Air Quality. 2001. Available online: www.lungusa.org/air/ (accessed on 27 September 2017).
  2. Lu, C.; Deng, Q.; Li, Y.; Sundell, J.; Norbäck, D. Outdoor air pollution, meteorological conditions and indoor factors in dwellings in relation to sick building syndrome (SBS) among adults in China. Sci. Total Environ. 2016, 560–561, 186–196. [Google Scholar] [CrossRef] [PubMed]
  3. Kuo, P.-W. A research on the carbon dioxide distribution in the indoor environment and uses plants to improve the indoor air quality. J. Ecol. Environ. Sci. 2009, 2, 53–64. [Google Scholar]
  4. Environment Australia. BTEX Personal Exposure Monitoring in Four Australian Cities; Technical Paper No. 6; Environment Australia: Canberra, Australia, 2003.
  5. World Health Organization. World Health Report; World Health Organization: Geneva, Switzerland, 2001. [Google Scholar]
  6. Han, K.-T. Restorative Nature: An Overview of the Positive Influences of Natural Landscapes on Humans; Lambert Academic Publishing: Saarbrücken, Germany, 2011. [Google Scholar]
  7. Dravigne, A.; Waliczek, T.M.; Lineberger, R.D.; Zajicek, J.M. The effect of live plants and window views of green spaces on employee perceptions of job satisfaction. HortScience 2008, 43, 183–187. [Google Scholar] [CrossRef]
  8. Bringslimark, T.; Hartig, T.; Patil, G. The psychological benefits of indoor plants: A critical review of the experimental literature. J. Environ. Psychol. 2009, 29, 422–433. [Google Scholar] [CrossRef]
  9. Smardon, R.C. Perception and aesthetics of the urban environments: Review of the role of vegetation. Landsc. Urban Plan. 1988, 15, 85–106. [Google Scholar] [CrossRef]
  10. Doxey, J.S.; Waliczek, T.M.; Zajicek, J.M. The impact of interior plants in university classrooms on student course performance and on student perceptions of the course and instructor. HortScience 2009, 44, 384–391. [Google Scholar] [CrossRef]
  11. Han, K.-T. Influence of passive versus active interaction with indoor plants on the restoration, behavior, and knowledge of students at a junior high school in Taiwan. Indoor Built Environ. 2018, 27, 818–830. [Google Scholar] [CrossRef]
  12. Han, K.-T. Influence of limitedly visible leafy indoor plants on the psychology, behavior, and health of students at a junior high school in Taiwan. Environ. Behav. 2009, 41, 658–692. [Google Scholar] [CrossRef]
  13. Smith, A.; Tucker, M.; Pitt, M. Healthy, productive workplaces: Towards a case for interior plantscaping. Facilities 2011, 29, 209–223. [Google Scholar] [CrossRef]
  14. Han, K.-T.; Hung, C.-Y. Influences of plants and their visibility, distance, and surrogate in a classroom on students’ psycho-physiology. J. Archit. Plan. 2011, 12, 1–22. [Google Scholar]
  15. Han, K.-T.; Hung, C.-Y. Influences of physical interactions and visual contacts with plants on students’ psycho-physiology, behaviors, academic performance, and health. Sci. Agric. 2012, 59, 195–210. [Google Scholar]
  16. Hung, C.-Y.; Han, K.-T. Effect of classroom greenness on students’ psycho-physiology, performance, and health at the Shin-Kuang Junior High School, Taichung County. Sci. Agric. 2010, 58, 89–106. [Google Scholar]
  17. Jiang, B.; Li, D.; Larsen, L.; Sullivan, W.C. A dose-response curve describing the relationship between urban tree cover density and self-reported stress recovery. Environ. Behav. 2016, 48, 607–629. [Google Scholar] [CrossRef]
  18. Jiang, B.; Larsen, L.; Deal, B.; Sullivan, W.C. A dose-response curve describing the relationship between tree cover density and landscape preference. Landsc. Urban Plan. 2015, 139, 16–25. [Google Scholar] [CrossRef]
  19. Torpy, F.R.; Irga, P.J.; Burchett, M.D. Profiling indoor plants for the amelioration of high CO2 concentrations. Urban For. Urban Green. 2014, 13, 227–233. [Google Scholar] [CrossRef]
  20. Wolverton, B.C.; Johnson, A.; Bounds, K. Interior Landscape Plants for Indoor Air Pollution Abatement; National Aeronautics and Space Administration: Davidsonville, MD, USA, 1989.
  21. Coward, M.; Ross, D.; Coward, S.; Cayless, S.; Raw, G. Pilot Study to Assess the Impact of Green Plants on NO2 Levels in Homes; Building Research Establishment Note N154/96; Building Research Establishment: Watford, UK, 1996. [Google Scholar]
  22. Orwell, R.L.; Wood, R.A.; Tarran, J.; Torpy, F.; Burchett, M.D. Removal of benzene by the indoorplant/substrate microcosm and implications for air quality. Water Soil Air Pollut. 2004, 157, 193–207. [Google Scholar] [CrossRef]
  23. Wood, R.A.; Burchett, M.D.; Alquezar, R.; Orwell, R.L.; Tarran, J.; Torpy, F. The potted-plant microcosm substantially reduces indoor air VOC pollution. I. Office field-study. Water Soil Air Pollut. 2006, 175, 163–180. [Google Scholar] [CrossRef]
  24. Yoo, M.H.; Kwon, Y.J.; Son, K.-C.; Kays, S.J. Efficacy of indoor plants for the removal of single and mixed volatile organic pollutants and the physiological effects of the volatiles on the plants. J. Am. Soc. Hortic. Sci. 2006, 131, 452–458. [Google Scholar] [CrossRef]
  25. Kim, K.J.; Kil, M.J.; Song, J.S.; Yoo, E.H.; Son, K.C.; Kays, S.J. Efficiency of volatile formaldehyde removal by indoor plants: Contribution of aerial plant parts versus the root-zone. J. Am. Soc. Hortic. Sci. 2008, 133, 521–526. [Google Scholar] [CrossRef]
  26. Irga, P.J.; Torpy, F.R.; Burchett, M.D. Can hydroculture be used to enhance the performance of indoor plants for the removal of air pollutants? Atmos. Environ. 2013, 77, 267–271. [Google Scholar] [CrossRef]
  27. Han, K.-T. Urban Forestry: Theories and Applications; Lamper: Taipei, Taiwan, 1998. [Google Scholar]
  28. Stapleton, E.; Ruiz-Rudolph, P. The potential for indoor ultrafine particle reduction using vegetation under laboratory conditions. Indoor Built Environ. 2018, 27, 70–83. [Google Scholar] [CrossRef]
  29. Kim, H.-H.; Lee, J.-Y.; Kim, H.-J.; Lee, Y.-W.; Kim, K.-J.; Park, J.-H.; Shin, D.-C.; Lim, Y.-W. Impact of foliage plant interventions in classrooms on actual air quality and subjective health complaints. J. Am. Soc. Hortic. Sci. 2013, 82, 255–262. [Google Scholar] [CrossRef]
  30. Wolverton, B.C. How to Grow Fresh Air: 50 Houseplants that Purify Your Home or Office; Penguin Books: New York, NY, USA, 1996. [Google Scholar]
  31. Gong, J. Human Scale and Indoor Space; Bo-Yuan Publishing: Taipei, Taiwan, 2000. [Google Scholar]
  32. Lin, F.-X.; Li, Z.-T. Breeding, cultivation and application of Hainan bean tree in landscape. Anhui Agric. Sci. Bull. 2014, 20, 109–110. [Google Scholar]
  33. Hartig, T. Testing Restorative Environments Theory. Ph.D. Thesis, University of California, Irvine, CA, USA, 1993, unpublished. [Google Scholar]
  34. Kaplan, R.; Kaplan, S. The Experience of Nature: A Psychological Perspective; Cambridge University Press: New York, NY, USA, 1989. [Google Scholar]
  35. Yi, Y.-K. Affect and Cognition Interface in Aesthetic Experiences of Landscapes. Ph.D. Thesis, Texas A&M University, College Station, TX, USA, 1992, unpublished. [Google Scholar]
  36. Han, K.-T. An empirical approach to Feng Shui in terms of psychological well-being. J. Ther. Hortic. 2006, 17, 8–19. [Google Scholar]
  37. White, E.V.; Gatersleben, B. Greenery on residential buildings: Does it affect preferences and perceptions of beauty? J. Environ. Psychol. 2011, 31, 89–98. [Google Scholar] [CrossRef] [Green Version]
  38. Frontczak, M.; Wargocki, P. Literature survey on how different factors influence human comfort in indoor environments. Build. Environ. 2011, 46, 922–937. [Google Scholar] [CrossRef]
  39. Frontczak, M.; Andersen, R.V.; Wargocki, P. Questionnaire survey on factors influencing comfort with indoor environmental quality in Danish housing. Build. Environ. 2012, 50, 56–64. [Google Scholar] [CrossRef] [Green Version]
  40. Fry, G.; Tveit, M.S.; Ode, A.; Velarde, M.D. The ecology of visual landscapes: Exploring the conceptual common ground of visual and ecological landscape indicators. Ecol. Indic. 2009, 9, 933–947. [Google Scholar] [CrossRef]
  41. Simonič, T. Preference and perceived naturalness in visual perception of naturalistic landscapes. J. Biotechnol. 2003, 82, 369–387. [Google Scholar]
  42. Tveit, M.; Ode, Å.; Fry, G. Key concepts in a framework for analyzing visual landscape character. Landsc. Res. 2006, 31, 229–255. [Google Scholar] [CrossRef]
  43. Ho, L.-C.; Chang, C.-Y. Establishing indicators of perceived naturalness. J. Art Des. Huafan Univ. 2016, 11, 63–73. [Google Scholar]
  44. Lee, T.-H.; Crompton, J. Measuring novelty seeking in tourism. Ann. Tour. Res. 1992, 19, 732–751. [Google Scholar] [CrossRef]
  45. Cheng, C.-K.; Shen, L.; Chon, J.-H. Examining the effects of familiarity on landscape perception within different contexts. J. Outdoor Recreat. Study 2009, 22, 1–21. [Google Scholar]
  46. Pearson, P.H. Relationships between global and specified measures of novelty seeking. J. Consult. Clin. Psychol. 1970, 34, 199–204. [Google Scholar] [CrossRef]
  47. Baloglu, S. Image variations of Turkey by familiarity index: Informational and experiential dimensions. Tour. Manag. 2001, 22, 127–133. [Google Scholar] [CrossRef]
  48. Izard, C.E. The Fact of Emotion; Appleton-Century-Crofts: New York, NY, USA, 1971. [Google Scholar]
  49. Izard, C.E.; Buechler, S. Aspects of consciousness and personality in terms of differential emotional theory. In Emotion: Theory, Research, and Experience; Plutchik, R., Kellerman, H., Eds.; Academic Press: New York, NY, USA, 1980; pp. 165–187. [Google Scholar]
  50. Bishop, I.D.; Hull, R.B. Integrating techniques for visual resource management. J. Environ. Manag. 1991, 32, 295–312. [Google Scholar] [CrossRef]
  51. Ittelson, W.H.; Proshansky, H.M.; Rivlin, L.G.; Winkel, G.H. An Introduction to Environmental Psychology; Holt, Rinehart and Winston: New York, NY, USA, 1974. [Google Scholar]
  52. Mandler, G. Mind and Body Psychology of Emotion and Stress; W. W. Norton: New York, NY, USA, 1984. [Google Scholar]
  53. Mehrabian, A.; Russell, J.A. An Approach to Environmental Psychology; The MIT Press: Cambridge, MA, USA, 1974. [Google Scholar]
  54. Wu, M.-L. SPSS Operation and Application—Practice & Analysis of Variance; Wunan Press: Taipei, Taiwan, 2010. [Google Scholar]
  55. Five Common Indoor Air Pollutants in a New Home. Available online: https://molekule.com/blog/five-common-indoor-air-pollutants-new-home/ (accessed on 24 June 2019).
  56. DeVellis, R.F. Scale Development Theory and Applications; Sage: London, UK, 1991. [Google Scholar]
  57. Wu, M.-L.; Chang, Y.-R. SPSS [PASW] and Statistical Application Analysis I; Wunan Press: Taipei, Taiwan, 2011. [Google Scholar]
  58. Best Plants That Reduce Humidity Indoors. Available online: https://balconygardenweb.com/best-plants-that-reduce-humidity-indoors/ (accessed on 24 June 2019).
  59. Dwyer, J.F.; McPherson, E.G.; Schroeder, H.W.; Rowntree, R.A. Assessing the benefits and costs of the urban forest. J. Arboric. 1992, 18, 227–234. [Google Scholar]
  60. Shibata, S.; Suzuki, N. Effects of the foliage plant on task performance and mood. J. Environ. Psychol. 2002, 22, 265–272. [Google Scholar] [CrossRef]
  61. Zhang, J.J.; Smith, K.R. Indoor air pollution: A global health concern. Br. Med. Bull. 2003, 68, 209–225. [Google Scholar] [CrossRef]
  62. Can Rainy Days Really Get You Down? Available online: https://www.webmd.com/balance/features/can-rainy-days-really-get-you-down#1 (accessed on 25 June 2019).
Figure 1. Experimental treatment.
Sustainability 11 03679 g001
Table 1. Experimental treatment.
Experimental TreatmentGreen Coverage RatioCodePlant-Measuring Instrument DistancePlant–Participant DistanceExperimental Period
High Green Coverage Ratio8.83 %HC0.25 m, 1.5 m1.5 mEnd of November 2018
Low Green Coverage Ratio3.00 %LC0.25 m, 1.5 m1.5 mBeginning of December 2018
Note: The distances of the plant(s) to the measuring instrument was from the bottom of the potted plant(s) to the side of the two air quality detectors.
Table 2. Specifications of the indoor air quality detector.
Measurement FactorsCOCO2PM10PM2.5
Detection range0–1000 ppm400–20,000 ppm0–500 μg/m30–500 μg/m3
Resolution1 ppm1 ppm1 μg/m31 μg/m3
Method of DetectionElectrochemicalNondispersive infraredOpticalOptical
Reaction Time<30 s<120 s<10 s<10 s
Sampling Real timeReal timeReal timeReal time
Measurement FactorsHCHOTVOCTemperatureHumidity
Detection range0–5 ppm0.13–2.5 ppm−40–125 °C0%–100% RH
Resolution0.01 ppm0.01 ppm0.1 °C1% RH
Method of DetectionElectrochemicalMicroelectromechanical systems chipMicroelectromechanical systems chipMicroelectromechanical systems chip
Reaction Time90 s<10 s<30 s<30 s
Sampling Real timeReal timeReal timeReal time
Table 3. Means and standards for the air quality during the control.
Environmental FactorControlMeanIndoor Standards a
0.25 m1.5 m
PM2.5
(μg/m3)
HC8.67319.96335
LC23.86327.977
CO2
(ppm)
HC396.833391.4001000
LC473.733479.767
PM10
(μg/m3)
HC13.18722.71375
LC33.68032.207
HCHO
(ppm)
HC0.0160.0100.08
LC0.0100.010
CO
(ppm)
HC0.0000.0009
LC0.0000.000
TVOC
(ppm)
HC0.2250.1960.56
LC0.2060.205
Note: HC denotes high green coverage ratio and LC denotes low green coverage ratio; a refers to the Indoor Air Quality Act.
Table 4. Results of the Wilcoxon tests of different distances for the control condition of the high green coverage ratio treatment.
Environmental FactorDistanceMeanS.D.Z-valuep-Value
PM2.5
(μg/m3)
0.258.6733.709−4.7820.0000
1.519.9632.197
CO2
(ppm)
0.25396.8338.429−2.7800.0054
1.5391.4004.917
PM10
(μg/m3)
0.2513.1876.080−4.4330.0000
1.522.7132.139
HCHO
(ppm)
0.250.0160.005−4.2430.0000
1.50.0100.000
CO
(ppm)
0.250.0000.0000.0001.0000
1.50.0000.000
TVOC
(ppm)
0.250.2250.017−4.6380.0000
1.50.1960.015
Temperature
(°C)
0.2526.0630.110−4.8100.0000
1.525.5300.106
Humidity
(%)
0.2556.4670.507−2.8400.0045
1.556.1000.305
Table 5. Results of the Wilcoxon tests of different distances for the control condition of the low green coverage ratio treatment.
Environmental FactorDistanceMeanS.D.Z-valuep-Value
PM2.5
(μg/m3)
0.2523.86317.045−1.2140.2249
1.527.9779.662
CO2
(ppm)
0.25473.73325.874−0.9950.3198
1.5479.76724.555
PM10
(μg/m3)
0.2533.68020.606−0.1340.8936
1.532.20712.116
HCHO
(ppm)
0.250.0100.0000.0001.0000
1.50.0100.000
CO
(ppm)
0.250.0000.0000.0001.0000
1.50.0000.000
TVOC
(ppm)
0.250.2060.0530.0001.0000
1.50.2050.057
Temperature
(°C)
0.2525.2830.226−4.4900.0000
1.524.8400.230
Humidity
(%)
0.2561.2003.547−0.9270.3538
1.560.3003.476
Table 6. Results of the Mann-Whitney U tests of the high green coverage and control at 0.25 m.
Environmental FactorConditionMeanS.D.Mann-Whitney UZ-Valuep-Value
PM2.5
(μg/m3)
Control8.6733.709290.500−2.3590.0183
HC6.8074.517
CO2
(ppm)
Control396.8338.4290.000−6.6560.0000
HC555.70051.848
PM10
(μg/m3)
Control13.1876.080311.000−2.0550.0399
HC10.9776.569
HCHO
(ppm)
Control0.0160.005159.000−4.5810.0000
HC0.0310.012
CO
(ppm)
Control0.0000.000450.0000.0001.0000
HC0.0000.000
TVOC
(ppm)
Control0.2250.01745.000−6.0190.0000
HC0.1660.029
Temperature
(°C)
Control26.0630.1100.000−6.7100.0000
HC25.6030.217
Humidity
(%)
Control56.4670.5070.000−6.7870.0000
HC65.3331.539
Note: HC denotes high green coverage ratio.
Table 7. Results of the Mann-Whitney U tests of the high green coverage and control at 1.5 m.
Environmental FactorConditionMeanS.D.Mann-Whitney UZ-Valuep-Value
PM2.5
(μg/m3)
Control19.9632.197430.500−0.2880.7731
HC19.6774.709
CO2
(ppm)
Control391.4004.9170.000−6.6580.0000
HC558.90051.575
PM10
(μg/m3)
Control22.7132.139423.000−0.3990.6897
HC22.4804.633
HCHO
(ppm)
Control0.0100.000450.0000.0001.0000
HC0.0100.000
CO
(ppm)
Control0.0000.000450.0000.0001.0000
HC0.0000.000
TVOC
(ppm)
Control0.1960.015221.500−3.4090.0007
HC0.1710.029
Temperature
(°C)
Control25.5300.10674.500−5.6470.0000
HC25.2270.230
Humidity
(%)
Control56.1000.3050.000−7.0200.0000
HC65.1331.737
Note: HC denotes high green coverage ratio.
Table 8. Results of the Mann-Whitney U tests of the low green coverage ratio treatment and control at 0.25 m.
Environmental FactorConditionMeanS.D.Mann-Whitney UZ-Valuep-Value
PM2.5
(μg/m3)
Control23.86317.045130.000−4.7320.0000
LC7.2505.414
CO2
(ppm)
Control473.73325.874111.500−5.0060.0000
LC544.53349.515
PM10
(μg/m3)
Control33.68020.606150.00−4.4360.0000
LC12.2278.675
HCHO
(ppm)
Control0.0100.0000.000−7.1450.0000
LC0.0360.011
CO
(ppm)
Control0.0000.000450.0000.0001.0000
LC0.0000.000
TVOC
(ppm)
Control0.2060.053393.500−0.8390.4013
LC0.1940.051
Temperature
(°C)
Control25.2830.226186.000−3.9240.0001
LC25.8500.522
Humidity
(%)
Control61.2003.547288.500−2.4180.0156
LC63.6671.470
Note: LC denotes low green coverage ratio.
Table 9. Results of the Mann-Whitney U tests of the low green coverage ratio treatment and control at 1.5 m.
Environmental FactorConditionMeanS.D.Mann-Whitney UZ-Valuep-Value
PM2.5
(μg/m3)
Control27.9779.662196.000−3.7560.0002
LC19.9736.005
CO2
(ppm)
Control479.76724.555179.000−4.0080.0001
LC521.03342.808
PM10
(μg/m3)
Control32.20712.116198.500−3.7180.0002
LC23.0406.591
HCHO
(ppm)
Control0.0100.000450.0000.0001.0000
LC0.0100.000
CO
(ppm)
Control0.0000.000450.0000.0001.0000
LC0.0000.000
TVOC
(ppm)
Control0.2050.057386.500−0.9420.3462
LC0.1910.053
Temperature
(°C)
Control24.8400.230143.000−4.5610.0000
LC25.4930.509
Humidity
(%)
Control60.3003.476193.500−3.8300.0001
LC63.9001.583
Note: LC denotes low green coverage ratio.
Table 10. Results of the Mann-Whitney U tests for the high and low green coverage ratio treatments at 0.25 m.
Environmental FactorConditionMeanS.D.Mann-Whitney UZ-Valuep-Value
PM2.5
(μg/m3)
LC6.8074.517439.500−0.1550.8766
HC7.2505.414
CO2
(ppm)
LC555.70051.848420.500−0.4360.6627
HC544.53349.515
PM10
(μg/m3)
LC10.9776.569417.500−0.4810.6308
HC12.2278.675
HCHO
(ppm)
LC0.0310.012364.500−1.3250.1852
HC0.0360.011
CO
(ppm)
LC0.0000.000450.0000.0001.0000
HC0.0000.000
TVOC
(ppm)
LC0.1660.029323.000−1.8920.0585
HC0.1940.051
Temperature
(°C)
LC25.6030.217334.000−1.7250.0845
HC25.8500.522
Humidity
(%)
LC65.3331.539201.500−3.7720.0002
HC63.6671.470
Note: HC denotes high green coverage ratio and LC denotes low green coverage ratio.
Table 11. Results of the Mann-Whitney U tests for the high and low green coverage ratio treatments at 1.5 m.
Environmental FactorConditionMeanS.D.Mann-Whitney UZ-Valuep-Value
PM2.5
(μg/m3)
LC19.6774.709448.500−0.0220.9823
HC19.9736.005
CO2
(ppm)
LC558.90051.575258.000−2.8390.0045
HC521.03342.808
PM10
(μg/m3)
LC22.4804.633438.500−0.1700.8650
HC23.0406.591
HCHO
(ppm)
LC0.0100.000450.0000.0001.0000
HC0.0100.000
CO
(ppm)
LC0.0000.000450.0000.0001.0000
HC0.0000.000
TVOC
(ppm)
LC0.1710.029367.000−1.2350.2169
HC0.1910.053
Temperature
(°C)
LC25.2270.230322.500−1.8950.0581
HC25.4930.509
Humidity
(%)
LC65.1331.737266.500−2.7840.0054
HC63.9001.583
Note: HC denotes high green coverage ratio and LC denotes low green coverage ratio.
Table 12. Results of the Wilcoxon tests of different distances for the high green coverage ratio treatment.
Environmental FactorDistanceMeanS.D.Mann-Whitney UZ-Value
PM2.5
(μg/m3)
0.256.8074.517−4.7830.0000
1.519.6774.709
CO2
(ppm)
0.25555.70051.848−0.6380.5235
1.5558.90051.575
PM10
(μg/m3)
0.2510.9776.569−4.7830.0000
1.522.4804.633
HCHO
(ppm)
0.250.0310.012−4.6540.0000
1.50.0100.000
CO
(ppm)
0.250.0000.0000.0001.0000
1.50.0000.000
TVOC
(ppm)
0.250.1660.029−2.8120.0049
1.50.1710.029
Temperature
(°C)
0.2525.6030.217−5.0020.0000
1.525.2270.230
Humidity
(%)
0.2565.3331.539−1.6040.1088
1.565.1331.737
Table 13. Results of the Wilcoxon tests of different distances for the low green coverage ratio treatment.
Environmental FactorDistanceMeanS.D.Mann-Whitney UZ-Value
PM2.5
(μg/m3)
0.257.2505.414−4.7830.0000
1.519.9736.005
CO2
(ppm)
0.25544.53349.515−2.8920.0038
1.5521.03342.808
PM10
(μg/m3)
0.2512.2278.675−4.7820.0000
1.523.0406.591
HCHO
(ppm)
0.250.0360.011−4.8200.0000
1.50.0100.000
CO
(ppm)
0.250.0000.0000.0001.0000
1.50.0000.000
TVOC
(ppm)
0.250.1940.051−1.2450.2131
1.50.1910.053
Temperature
(°C)
0.2525.8500.522−4.9160.0000
1.525.4930.509
Humidity
(%)
0.2563.6671.470−1.9410.0522
1.563.9001.583
Table 14. Reliability analysis of the subjective psychological perception scales.
Subjective Psychological PerceptionNo. of ItemsOverall Cronbach’s α
Preference20.859
Environmental Comfort40.670
Perceived Naturalness60.866
Novelty110.728
Emotions180.839
Table 15. Difference between different experimental treatment groups in preference and environmental comfort.
Index ScoreExperimental TreatmentMeanSDT-ValueP ValueEffect Size η2Observed Power95% Confidence Interval for the Difference
Lower BoundUpper Bound
PreferenceHC6.2671.982−0.4580.6490.0040.074−1.1650.731
LC6.4831.674
Environmental ComfortHC6.4831.345−0.2530.8010.0010.057−0.7420.575
LC6.5671.198
Note: HC denotes high green coverage ratio and LC denotes low green coverage ratio.
Table 16. Difference between different experimental treatment groups in perceived naturalness, novelty, and PAD emotions.
Subjective Psychological PerceptionIndependent VariableDependent VariableFP ValueEffect Size η2Observed Power
Perceived naturalnessExperimental TreatmentComposite Score (3)
Index Score (1)
0.5750.6340.0300.161
NoveltyExperimental TreatmentComposite Score (5)
Index Score (1)
0.4170.8350.0370.150
EmotionsExperimental TreatmentComposite Score (3)1.4330.2430.0710.359
Note: ( ) denotes the number of dependent variables.
Table 17. Correlations between objective factors of physical environment and subjective psychological perceptions (N = 60).
Subjective PerceptionScorePM2.5CO2PM10HCHOCOTVOCTemperatureHumidity
PreferenceIndex Scorer = −0.294 *r = −0.033r = −0.281 *ccr = −0.253r = 0.161r = −0.146
(p = 0.023)(p = 0.800)(p = 0.029) (p = 0.051)(p = 0.220)(p = 0.266)
Environmental ComfortIndex Scorer = −0.227r = 0.099r = −0.204ccr = −0.115r = 0.074r = −0.164
(p = 0.081)(p = 0.451)(p = 0.118) (p = 0.381)(p = 0.574)(p = 0.211)
Perceived NaturalnessNaturalnessr = −0.280 *r = 0.017r = −0.257 *ccr = −0.197r = 0.121r = −0.100
(p = 0.030)(p = 0.895)(p = 0.047) (p = 0.131)(p = 0.356)(p = 0.445)
Richness of natural elements r = −0.089r = 0.131r = −0.072ccr = −0.168r = 0.110r = −0.022
(p = 0.499)(p = 0.317)(p = 0.584) (p = 0.200)(p = 0.403)(p = 0.868)
Environmental Wildnessr = −0.157r = 0.015r = −0.148ccr = −0.197r = −0.019r = −0.102
(p = 0.230)(p = 0.910)(p = 0.258) (p = 0.131)(p = 0.885)(p = 0.438)
Index Scorer = −0.204r = 0.065r = −0.185ccr = −0.222r = 0.080r = −0.088
(p = 0.118)(p = 0.621)(p = 0.157) (p = 0.089)(p = 0.543)(p = 0.503)
NoveltyChange in Routiner = −0.185r = −0.052r = −0.160ccr = −0.361 **r = 0.094r = −0.111
(p = 0.157)(p = 0.692)(p = 0.222) (p = 0.005)(p = 0.473)(p = 0.397)
Thrillr = 0.064r = 0.099r = 0.062ccr = −0.014r = 0.059r = 0.064
(p = 0.629)(p = 0.452)(p = 0.639) (p = 0.915)(p = 0.655)(p = 0.625)
Surpriser = −0.157r = 0.015r = −0.148ccr = −0.197r = −0.019r = −0.102
(p = 0.230)(p = 0.910)(p = 0.258) (p = 0.131)(p = 0.885)(p = 0.438)
Boredom Alleviationr = −0.074r = −0.018r = −0.032ccr = −0.077r = −0.052r = −0.248
(p = 0.572)(p = 0.890)(p = 0.808) (p = 0.558)(p = 0.695)(p = 0.056)
Unfamiliarityr = −0.006r = −0.084r = −0.005ccr = −0.077r = −0.034r = −0.027
(p = 0.966)(p = 0.524)(p = 0.968) (p = 0.561)(p = 0.795)(p = 0.838)
Index Scorer = −0.133r = −0.023r = −0.106ccr = −0.259 *r = 0.010r = −0.159
(p = 0.311)(p = 0.863)(p = 0.420) (p = 0.046)(p = 0.942)(p = 0.226)
EmotionsPleasurer = −0.423 **r = 0.028r = −0.394 **ccr = −0.234r = 0.146r = −0.158
(p = 0.001)(p = 0.829)(p = 0.002) (p = 0.071)(p = 0.267)(p = 0.228)
Arousalr = −0.119r = −0.070r = −0.103ccr = −0.241r = 0.183r = 0.031
(p = 0.367)(p = 0.596)(p = 0.435) (p = 0.064)(p = 0.161)(p = 0.816)
Dominancer = −0.154r = 0.001r = −0.134ccr = −0.099r = 0.146r = −0.163
(p = 0.241)(p = 0.994)(p = 0.309) (p = 0.451)(p = 0.266)(p = 0.214)
Note: **(p < 0.01) indicates significance (two-tailed); *(p < 0.05) indicates significance (two-tailed); c denotes that the factor was not calculable because at least one of the variables was a constant. N denotes sample size.

