Abstract
Land cover and population is key in considering sustainable management of the environment. An assessment focusing on the two may aid planning for sustainable management of the ecosystems. This is particularly vital for the water tower ecosystems which are extremely vulnerable. This paper provides a scientific assessment on the extent of land cover change in Mau Water Tower Ecosystem from 1986 to 2015 using satellite images. It analyzes the implications of observed population dynamics and forecasts the extent of land cover change in this resource. The results indicate a sharp increase in the area covered by grassland with a drastic decline in forest cover. Cropland showed marked fluctuations during the entire period. The change in forest cover had a very strong significant negative relationship with the rapid population increase. Forecast on land cover change, based on a “Business as Usual” (BAU) scenario, indicated further decline in forest cover and an increase in the area covered by grassland. The results of the study suggest that land cover change and population growth within the water towers are closely interlinked and cause significant effects on these ecosystems. These findings lay the foundation for a review of conservation and agricultural policies in order to enhance sustainable management of Mau Water Tower.
1. Introduction
Land cover is the physical attribute on the Earth’s surface while land use describes the function of these attributes for human purposes [1]. These components are significant to global environment as they exert direct significant effects on regional environments and ecosystems [2,3]. Land cover change in particular, is a subject that has in the contemporary time gained interest because of its effects on the environment [4,5]. Anthropogenic activities have been the central potency influencing land cover with their impacts varying temporally and spatially [6]. This consequently leads to changes in ecosystem functioning [7]. There are five key driving causes of land cover change; institutions, demographic change, technology, economics and culture [8]. In recent years, global land cover change has been characterized by agricultural expansion and urbanization [9]. Rapid population growth has an indirect effect on land uses and consequently land cover change [10]. This has been linked with change of forest cover, forest fires, logging [11], alteration of wetlands, soil degradation in agricultural areas [12] and significant biodiversity decline [13,14]. Population growth has been attributed to reduced environment quality and low economic development in developing countries [15,16]. As population grows, people require more land for cultivation [17], they need more fuelwood, and more land to graze as well as land for settlement [18].
In Africa, growing population has been linked to rapid expansion of subsistence farming [19]. This has affected livelihoods and conservation efforts as most land once under natural vegetation has been converted to agricultural lands [20]. Water towers, the receptacle for rain water which stores water in the aquifers and also replenishes the springs and rivers emanating from it [21], have not been spared by these human alterations. Water towers are very closely linked to forest cover and any on impact on forest vegetation will have a positive or negative effect on the water resources [22]. These resources are not only key for human survival [23], but also for wildlife habitation and are essential in the conservation of biological diversity [24,25].
Kenya’s Mau Water Tower also known as Mau Forest or Mau Forest Complex, is one of the five largest water towers in Kenya. It plays an important role in the agricultural, tourism and energy sector [26]. This water tower is estimated to have a total economic value of 110.512 billion United States dollars [22], and is a source of 12 rivers some which are transboundary within East Africa [27,28]. Despite all this, it is facing rapid degradation [22]. This is reflected through reduced water quality in the rivers, shrinking forest cover, diminishing riparian vegetation and reduced soil level [29]. There are a number of previous studies [30,31,32,33,34,35,36,37], carried out to address different aspects on Mau Water Tower in different time periods but assessment under the influence of land cover change and population growth has not been addressed adequately in these studies. In these previous studies, Kinyanjui [30] focused on human encroachment on the composition and structure of the forest cover and not change in terms of the size of forest cover. Boitt [31] looked into how destruction on Mau Forest was affecting water volumes on the Great Rift Valley Lakes in Kenya. Bewernick [32], on the other hand, developed a method for timely detection of forest degradation in Mau Forest Complex by applying the Normalized Difference Fraction Index (NDFI). The focus of this study was to enhance forest monitoring. Nkako et al. [33] presented in their report a detailed account on the extent, type and location of destructive activities in Maasai Mau. This report did not focus on the entire Mau Water Tower but part of the southern section. Olang and Kundu [34] reviewed the management of Mau Forest Complex with a focus on the restoration efforts. They highlighted the need to integrate restoration and rehabilitation with socio-economic activities that would support the communities living around the water tower. Mutangah et al. [35] surveyed the Mau Forest Complex with the aim of providing data on species composition, diversity and structure and they also attempted to interpret how the vegetation parameters are related to human disturbances. Were et al. [36] examined how land cover was changing in Eastern Mau Forest and Lake Nakuru basin by applying partitioning, hybrid classification and spatial reclassification of Landsat data. Finally, Baldyga et al. [37], in their work, quantified the rate of land cover change in the River Njoro watershed using remote sensing. This watershed forms part of the Eastern Mau Escarpment. Their key finding was that land cover transition primarily occurred after 1995 and included massive forest loss coupled with mixed small scale agriculture. It is therefore necessary to systematically and scientifically assess this water tower under the influence of land cover change and population growth in order to provide substantial information for future decision-making [38], as this enhances establishment of effective conservation and management strategies [5,39], for human welfare [40].
Hence, the objective of this paper is to; (1) provide the extent of land cover change in Mau Water Tower ecosystem from 1986 to 2015, (2) analyze the implications of observed population dynamics on the land cover change, and (3) forecast the extent of land cover change in Mau Water Tower.
2. Materials and Methods
2.1. Study Area
Mau Water Tower is the largest water tower in East Africa [41]. It is located in Kenya, positioned between 37.900 to 38.040 East and 2.210 to 2.330 North, it lies between 2000 m and 3000 m above the sea level and covers an area of approximately 419,367 ha. The water tower is a source of twelve major rivers: Ewaso Nyiro, Nzoia, Yala, Makalia, Njoro, Naishi, Molo, Nderit, Kerio, Sondu-Miriu, Mara and Nyando (Figure 1), draining into Lake Nakuru, Lake Baringo, Lake Turkana, Lake Victoria and Lake Natron which is located in Tanzania [27,28]. The Mau Water Tower is divided into 22 forest blocks [26]. The water tower receives an average annual rainfall of about 1300 mm [34]. This makes it suitable for agriculture. The climatic condition causes a habitat zonation of dense forest, 2100–2600 meters above sea level (m.a.s.l.); open bushy forest, up to 2100 m.a.s.l.; thick mature forest with large trees, 2300–2600 m.a.s.l.; an upper bamboo forest, higher than 2600 m.a.s.l. and open grasslands in the highest areas, 2800–3000 m.a.s.l [42]. Mau Water Tower is approximately 142 km from the Capital, Nairobi.
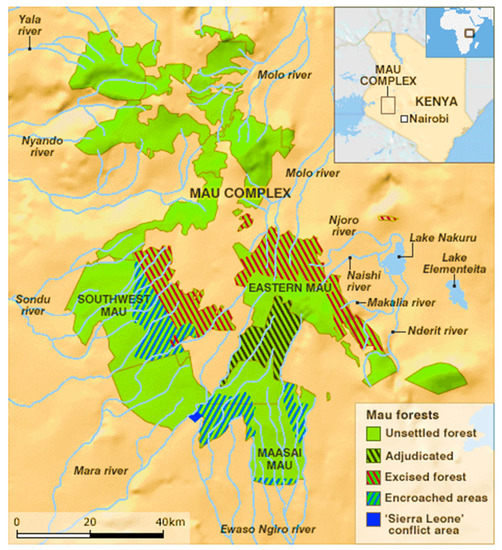
Figure 1.
Location and extent of Mau Water Tower, Kenya [43]
2.2. Satellite Data Acquisiton
There are several studies where assessing changes in land cover using satellite images has been applied [44,45,46,47,48,49,50]. This study used satellite images from Landsat-5 Thematic Mapper (TM) and Landsat-8 Operational Land Imager (OLI) to assess land cover change in Mau Water Tower. The images were sourced from the United States Geological Survey (USGS) website (http//:earthexplorer.usgs.gov). Landsat images were considered not only because of their wide availability but also due to their 16 day temporal resolution, 30 M spatial resolution (i.e., a single pixel in the image represents 30 × 30 m on the ground) which is high and most notably their long period of coverage beginning in 1972 to date [51]. Images were sourced for path/row 169/60 and 169/61 both of which cover the Mau Water Tower fully. The periods when the images were taken including the years was carefully considered to allow good classification and to serve the study’s objectives. The images used in the study area were from the years 1986, 1995 and 2015 (Table 1). The acquisition dates of the satellite images differ slightly and are spread between January and July. The study considered cloud-free and dry season images as they are key in conducting informed analyses. Land cover classification, analysis and accuracy assessments done using ENVI 5.4 and map production done using Arc GIS 10.5.1 software.

Table 1.
Overview of images acquired. TM: Thematic Mapper, OLI: Operational Land Imager.
The land cover change analyses followed the procedure illustrated in Figure 2 below.
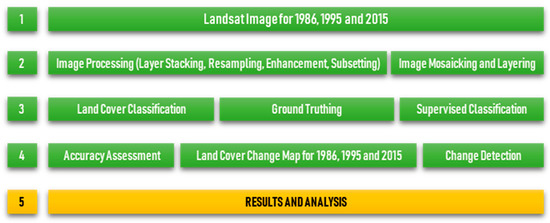
Figure 2.
Land cover change analysis procedure.
2.3. Land Cover Classification and Analysis
Maximum likelihood supervised classification was used in this study. This classification assumes that the statistics for each class in each band are normally distributed and calculates the probability that a given pixel belongs to a specific class [52]. The USGS images are usually geometrically rectified and thus no further orthorectification was needed. The images were however layer stacked to allow use of several bands in the analysis for greater detail. The Landsat-5 images i.e., those for 1986 and 1995 were layer stacked for spectral bands 2, 3 and 4 while the Landsat-8 images i.e., for 2015 were layer stacked for spectral bands 3, 4 and 5. Table 2 shows the features of the spectral bands used.
Table 2.
Landsat-5 and -8 spectral band features.
The layer stacked images were then mosaicked. This was in order to form one continuous image for each year by merging the path/row 169/60 and 169/61 images. Unsupervised classification was then done using Isodata classification. The results of the unsupervised classification were used to guide a field based ground truthing exercise to facilitate training data for the eventual supervised classification. A total of 180 sample points were gathered for training and testing. This was done along a transect running from Bomet County through Narok County and ending in the Nakuru County With the aid of a handheld Global Positioning System (GPS). This study designated 20 training samples of 40 pixels for each of the three land cover types (forest, cropland and grassland) as recommended by Lillesand et al. [53]. These were sampled in areas that did not experience change over the study period. The data collected during the ground truthing were entered in Excel format and converted to shape files using Arc GIS 10.5.1 software and used land cover image classification, analysis and accuracy assessments in ENVI 5.4 version software. Reflectance values corresponding to the land cover classes were used to create their respective spectral signatures which were then used to carry out the classification. Change detection was then done to identify the differences between the classified images. In doing this, a change matrix was also developed showing differences in land cover between periods i.e., 1986 to 1995, 1995 to 2015 and 1986 to 2015. This differentiation enabled the detection of the change in specific land cover types between the periods.
Although there are several classes widely used for assessments i.e., barren lands rangelands, deserts, grassland, forest, croplands, wetlands, water bodies and built-up lands, three land cover types were purposively considered in this study, i.e., forest, cropland and grassland. These types are most significant and widely distributed in the study area. A consideration was also made upon extensive field observation. This is a gazetted water tower hence built-up areas are minimal. These areas were therefore not included as they would not significantly affect the outcome of this study. The three cover types are described in Table 3.
Table 3.
Land cover description.
2.4. Results Validation
Validation through quality check is key in handling analysis of satellite-data products. This quality check is necessary because of the errors and inherent uncertainties associated with the remote sensed data and because image classification is also based on sampling of the classes [54]. In this study, historical aerial photographs of the area in 1985/95 retrieved from Survey of Kenya were used to evaluate the accuracy of the 1986/95 Landsat images while SPOT-6 images (Panchromatic, 1.5 m resolution) were used to evaluate the accuracy of the 2015 Landsat image. Testing data were used to assess the accuracy of the final classification since it measures similarity of an estimate to the true value [55]. The overall accuracies were calculated for each class per year. A comparison was applied by generating an error matrix as recommended by Janssen et al. [54].
2.5. Assessing Population Dynamics
The decadal population census data for 1979, 1999 and 2009 were baselines used in this study. The 22 districts considered were: Buret, Sotik, Bomet, Kericho, Kipkelion, Narok South, Narok North, Transmara, Nakuru, Nakuru North, Naivasha, Molo, Nandi North, Nandi Central, Nandi East, Nandi South, Tinderet, East Pokot, Koibatek, Eldoret West, Eldoret East and Wareng (Table 4). These districts fall within the five counties bounding the Mau Water Tower: Uasin Gishu, Narok, Nakuru, Nandi and Kericho Counties. The districts with close proximity were purposively sampled as population closer to natural resources tend to have considerable impacts on these resources [56]. Calculations were based on annual statistical abstracts and decadal census data from Kenya National Bureau of Statistics [57,58,59,60].
Table 4.
Distribution of the districts.
The nearest preceding and succeeding decadal census data to the year of land cover analysis were used. Emphasis was on the closest decadal census data preceding the year of land cover analysis. Projection of 1979 population was made to 1986. From 1986, annual population growth was calculated to 2015, a total of 29 observations. This was to align with the analysis of the land cover change of 1986–2015. After which, further projection was carried out based on exponential growth as expressed in Equation 1 using inter-censual population growth rate of 2.9% as per the Kenya Population Analysis Report [61]. The 1979 data was the officially available census data before 1986.
where is the initial population, is the population t years later, r is the annual growth rate and e is the base of the natural logarithm.
2.6. Population Dynamics and Land Cover Change
In this study, we sought to establish if there existed an association between forest cover and human population within Mau Water Tower. Pearson’s correlation coefficient was used to ascertain this association over the study period, testing for significance at p < 0.05. Pearson’s correlation coefficient measures the statistical relationship, or association, between two continuous variables i.e., the strength and direction of linear relationships between pairs of continuous variables. It is known as the best method of measuring the association between variables of interest because it is based on the method of covariance [62]. It gives information about the magnitude of the association, or correlation, as well as the direction of the relationship. This exercise was carried out using SPSS statistical software package. Forest cover was chosen because of its multitude of benefits to humans and contribution to this water tower’s ecosystem functions.
2.7. Forecasting Land Cover Change
In forecasting future land use changes, scenario analysis is essential [63]. The forecast of land cover change in Mau Water Tower was done based on the past assessment of land cover change i.e., 1986 and 2015. This forecast was carried out based on a “Business as Usual” (BAU) scenario. This scenario assumes that the controls and policies remain unchanged throughout the projection period [64], and distributions follow past trends determined by proximity variables (distances), climate variables, geophysical variables and socio-economic variables (gross domestic product, population density) [65]. In this study, annual change of forest cover and grassland for the past 29 years was calculated using Equation 2 as recommended by Puyravaud [66]. In forecasting the future land cover, the result from the annual change was used to determine the area covered by forest and grassland by the years 2024 and 2044. This was a period of 29 years with 2015 as the baseline. The forecast of the area covered by cropland was dependent on the future trend of the other two cover types as it did not depict a linear trend like forest and grassland.
where, is the annual rate of change of forest cover; and are the end and beginning of the analysis period, respectively and and are forest cover at time and , respectively.
3. Results
3.1. Land Cover Change in Mau Water Tower, 1986–2015
Results displayed in Table 5, illustrate the land cover of Mau Water Tower for the years 1986, 1995 and 2015. It can be seen that the water tower has been dominated by forest and grassland during this period. Forest covered an area of 307,629 ha (73.36%) in 1986, but there was a sharp decline to 174,341 ha (41.57%) as of 2015. Grassland, which occupied a total of 48,959 ha (11.67%) in 1986, increased sharply to 192,310 ha (45.86%) as of 2015. During the same period, cropland did not depict any significant change as it declined slightly from 62,779 ha (14.97%) to 52,716 ha (12.57%).
Table 5.
Land cover for Mau Water Tower for the years 1986, 1995 and 2015.
Figure 3 shows the extent of land cover change in Mau Water Tower in 1986, 1995 and 2015. From the maps, in 1986 forest evenly covered the water tower while cropland was concentrated on the Northern and Central parts. In the same year, there were few spots of grassland spread across the water tower. In contrast, the 1995 map shows that grassland dominated the South Western part of the water tower replacing the forest area and the cropland. This replacement also occurred in the Northern parts. By 2015, grassland in the South Western part had reduced slightly, being replaced by forest, but it increased in the North. The maps also show that cropland had increased slightly in the South Eastern parts of the water tower. There was significant net loss and gain of forest and grassland, respectively, between 1986 and 2015. The results show that forest cover net loss was 133,288 ha. This is a substantial loss given the importance of this resource and the amount of effort it might take for its restoration [67,68]. Massive loss of forest cover in the water tower was between 1986 and 1995, from 73.36% to 46.7%. This can be attributed to rampant deforestation in the late 1980s and early 1990s. Grassland, on the other hand, depicts a net gain of 143,351 ha by 2015, a significant transition from 11.67% to 45.86%. Cropland had a slight loss of 10,063 ha from 14.97% to 12.57%.
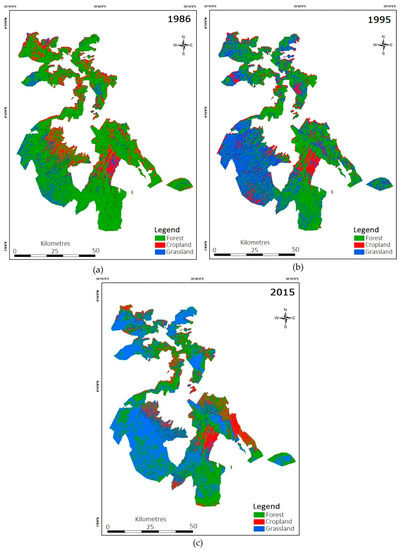
Figure 3.
Mau Water Tower land cover map for the year; (a) 1986, (b) 1995 and (c) 2015.
The land cover change matrix for the period 1986–2015 (Table 6), shows that in this period, 138,626.29 ha of forest was converted to grassland and 27,332.22 ha to cropland. Conversely, a paltry 18,790.65 ha of cropland and 6981.36 ha of grassland was converted to forest. An area of 20,610.03 ha of cropland was converted to grassland compared to 7477.51 ha of grassland to cropland. A total area of 204,585.09 ha remained unchanged over the entire period. Remarkable conversion of forest was found between 1986 and 1995, where 123,275.81 ha of forest was converted to grassland.
Table 6.
Mau Water Tower land cover change matrix (1986–2015).
The land cover change analysis was extended to the 5 kilometer buffer zone around the water tower. This study deliberately focused on this region in order to gather knowledge on the extent of land cover change as this also directly or indirectly influences changes in the entire water tower’s ecosystem over time. This region is considered to have intense and dynamic human activities [69]. The 5 km buffer zone covers an area of 415,802 ha. Table 7 shows the land cover of the 5 km buffer zone around Mau Water Tower for the years 1986, 1995 and 2015. It can be seen that during the entire period, this zone was dominated by the three cover types. Between 1986 and 2015, forest cover reduced from 110,088 ha (26.48%) to 85,860 ha (20.64%) while grassland increased from 124,309 ha (29.9%) to 159,074 ha (38.26%). Cropland exhibited significant fluctuation as it increased from 181,405 ha (43.62%) to 201,124 ha (48.37%) in 1995, and then down to 170,868 ha (41.10%) in 2015. Despite this fluctuation, it occupied the largest quota during the entire period.
Table 7.
Land cover within the 5 km buffer zone (1986, 1995 and 2015).
The land cover change matrix for the 5 km buffer zone around Mau Water Tower (Table 8) shows that in the period 1986–2015, a total of 21,006.21 ha of forest was converted to cropland. In addition, 31,814.04 ha of forest was converted to grassland. Over the entire period, 51,237.95 ha of cropland was converted to forest and 38,733.47 ha to grassland. This was almost equal to total area of forest converted to cropland and grassland. Subsequently, 18,336.71 ha of grassland was converted to forest and 45,252.26 ha to cropland. An average area of 207,604.4 ha did not experience change between 1986 and 2015.
Table 8.
Land cover change matrix of the 5 km buffer zone (1986–2015).
3.2. Implications of Observed Population Dynamics on the Land Cover Change
Figure 4 below shows the trend of population growth from 1979 to 2009 [57,58,59,60]. This is the population of the districts (Table 4) bounding Mau Water Tower aggregated from each administrative region of the five counties (Uasin Gishu, Narok, Nakuru, Nandi and Kericho). During this period, the population increased sharply in all the counties bounding this water tower. It is also important to note that from the year 1999, the Kenyan Government created more districts from those that were already existing. This, however, did not affect the study objective. This meant further subdivision of districts that existed in the baseline (1979).
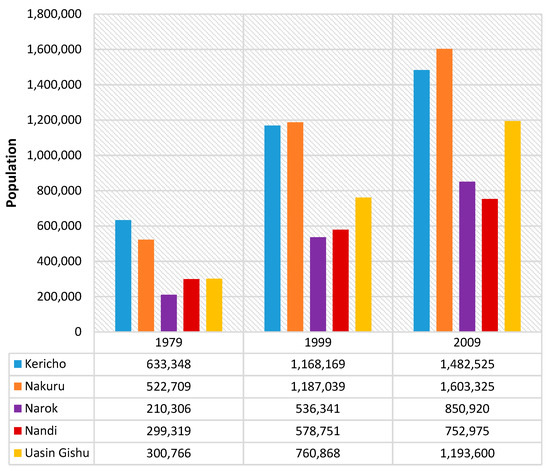
Figure 4.
Trend of population in counties bounding Mau Water Tower between 1979 and 2009.
Analysis carried out on the land cover change (Table 5) revealed that forest cover has been on a substantial decline. Pearson’s correlation analysis was conducted between forest cover and population to measure their statistical relationship or association. Subsequently, the correlation coefficient indicated a very strong negative relationship (r = −0.998), p < 0.05). The interpretation of this result is that, as the population of the counties bounding Mau Water Tower was on the rise, there was a consistent decline in forest cover. The counties bounding Mau Water Tower are considered to be among those practicing agriculture in a high scale in Kenya [70], and this might have played a key role in this association. This is evident from the dominance of cropland in the analysis in Table 7. Population increase in these areas is consistent throughout the study period and matches the agriculture dominance in the study area. To some degree, this confirms that population increase created pressure on this ecosystem through forest clearing for agricultural expansion, logging and charcoal burning as observed by Olang and Kundu [34].
3.3. Forecast of Land Cover Change in Mau Water Tower to 2044
Based on the past trend between 1986 and 1995, there was a decline in forest cover while the area covered by grassland increased (Figure 5). The estimated average loss of forest between 1986 and 2015 was 4596 ha per year while area covered by grassland was increasing at an average of 4943 ha per year. Forecast of the extent of land cover change by 2044 was established based on a “Business as Usual” (BAU) scenario. Considering the changes that occurred in the past, this scenario assumed that forest cover will continue declining by 4596 ha each year, while the area covered by grassland will be gaining 4943 ha each year. On the other hand, cropland was dependent on the other two land covers since it depicted fluctuations from the past trend. The forecast of forest cover shows that it will decline to 132,977 ha by the year 2024 and further down to 41,057 ha in 2044. While the area covered by grassland will increase to 236,797 ha by the year 2024 and further to 335,657 ha in 2044. Cropland will reduce slightly from 52,716 ha in 2015 to 49,593 ha in 2024 and by 2044, this will have reduced further to 42,653 ha. If this situation remains the same, the forecast indicates that the forest will be depleted by the year 2053, while grassland will cover 380,144 ha and a few sections will be covered by an estimated 38,856 ha of cropland.
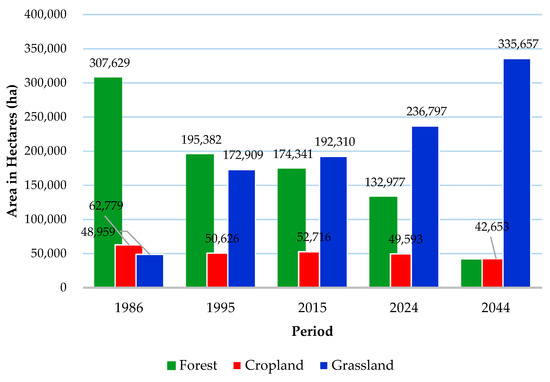
Figure 5.
Pattern of land cover change in Mau Water Tower, 1986–2044.
4. Discussion
4.1. Land Cover Change in Mau Water Tower
Land cover in Mau Water Tower has undergone massive change between 1986 and 2015. The findings of this study indicate that the forest alone has been declining immensely (Table 5). This can be attributed to both logging (legal and illegal), encroachment and forest excision that occurred in the water tower during this period [71]. Excision involves de-gazettement of public forest blocks for other land uses and this affected many forest blocks in Mau Water Tower including the Maasai Mau, South Western Mau, Eastern Mau and Western Mau blocks. In 2001, 61,587 ha of forest area in this water tower was excised. In addition, an estimated 29,000 ha was encroached and over 17,000 ha illegally allocated in the Maasai Mau area alone [43]. These excisions were among the many unreported cases carried out in the pretext of creating settlement for the landless, especially those displaced during the socio-political clashes of 1992 and 1997 [72]. This affected some of the key micro-catchments including South West Mau [73], which is a source of River Sondu known to produce up to 80 MW of hydro-power. The decline of forest through excision has been supplemented by illegal logging. Kenya is considered to be a country free of large-scale illegal logging [74]. Despite this, a Report of the Government Task Force on the conservation of the Mau Forest Complex indicated the existence of illegal logging targeting mostly cedar trees in the Mau Water Tower in addition to other unsanctioned activities such charcoal production and livestock grazing [71].
Agriculture also contributed to the decline of forest within the water tower. The findings of this study indicated conversion of sections of forest to cropland (Table 6). In Africa, local communities living adjacent to forests are known to typically practice subsistence agriculture and are highly dependent on forest products [75]. In Kenya, the areas around the Mau Water Tower are generally considered as agricultural zones [70] and this might have contributed to the change in land cover. This is likely to exacerbate with time as farmers seek more land for agricultural expansion as observed by Nkako et al. [33].
Despite the forest decline in Mau Water Tower between 1986 and 2015, there were some gains made (Table 6). This could be attributed to natural regeneration as well as reforestation efforts by the government agencies together with stakeholders who have been steering forest recovery. There have been rehabilitation efforts in various blocks of Mau Water Tower with a key focus on the Eastern Mau block that had faced massive forest decline [22]. In July 2008, in order to enhance conservation efforts, Kenya established a multi-stakeholder Task Force to look into conservation of the Mau Forests Complex. This contributed and brought a raft of measures which have since been implemented. Some of the recommendations from the task force included delineating extremely critical water catchments and biodiversity hotspots and restoration of critical sub-catchments. These tasks were carried out by Kenya Water Towers Agency (KWTA), an agency formed in 2012 to coordinate activities within all the water towers in Kenya. According to the KWTA [22], biodiversity hotspots were identified in Mariashoni, Teret, Nessuit, Kapkembu, Oloropil, Njoro, Mau Narok, Kiambogo, Entiyani, Kihingo, Kitiro, Turi, Mauche, Nkololani and Topoti, with Enoosupukia under massive reforestation in collaboration with Ministry of Energy and Narok County Government.
4.2. Population Growth and Mau Water Tower Land Cover Change
Land cover change is dynamic and varies as a reaction to the interface amid proximate causes and underlying drivers [76]. According to the results in this this study, population has been growing rapidly in the counties bounding Mau Water Tower (Figure 4). This has consequently played a key role in land cover change in this area. In Kenya, approximately 20% of the land is arable land and the water towers fall within these lands. Close to 75% of the country’s population is concentrated in these arable lands [77]. This makes the area vulnerable to anthropogenic activities including logging, charcoal burning and agriculture [78]. The population of the counties bounding the water tower is on an increasing trend and is projected to continue without significant variation. This will create a considerable threat to the land cover of the Mau Water Tower as has been evident in the previous years. The findings of this study are supported by Mather and Needle [79] who observed that in the regions which experienced fast population growth, the general trend of forest cover declined. It is evident that rapid population growth is causing the growing need for natural resources, more forest products well as more land for farming. The population–land cover change correlations revealed in this study, have also been established in research work conducted in Central America, in which rapid population growth was associated with the massive deforestation in Costa Rica and Guatemala [80,81].
This study also found that cropland dominated the 5 km buffer zone around the water tower (Table 7). Indeed, the majority of the people around Mau Water Tower live in a rural setup where people directly engage in farming as the main source of income generation. Henry et al. [82] pointed out that agriculture is the main source of livelihood in the Sub-Saharan countries. This consequently forces the majority of people to rely heavily on it, thus contributing to land cover change in the water tower ecosystem. Nkako et al. [33] observed that the local community is likely to expand their agricultural land towards the deforested areas and sooner or later cut down the trees around their farms for further expansion. Deforestation and expansion of agriculture are likely to cause adverse effects in the water tower ecosystems. Such anthropogenic land use, for example, reduces the capacity for rain water absorption, thus increasing surface runoff [83,84], which in turn affects wetland water quality and quantity.
5. Conclusions
This study provides an assessment of the Mau Water Tower ecosystem under the influence of land cover change and population growth from 1986 to 2015. It also forecasted the extent of land cover change based on a BAU scenario. The key findings were as follows;
- (1)
- There was drastic change in land cover between 1986–2015 with forest declining rapidly and grassland taking over in most parts of Mau Water Tower. In this period, forest cover declined from 307,629 ha (73.36%) to 174,341 ha (41.57%) (net loss of 133,288 ha), while grassland increased from 48,959 ha (11.67%) to 192,310 ha (45.86%) (net loss of 143,351 ha). The change in cropland was less than 10,063 ha.
- (2)
- Massive forest cover loss occurred between 1986 and 1995.
- (3)
- There was rapid population increase in the counties bounding Mau Water Tower.
- (4)
- Decline in forest cover had a very strong, significant, negative relationship with rapid population increase between 1986 and 2015.
- (5)
- Based on a BAU scenario, the land cover is likely to change adversely. By 2044, forest cover will decline further to 41,057 ha (10%) and grassland will increase sharply to 335,657 ha (80%), while an estimated area of 38,856 ha (10%) will be covered by cropland. Further forecasts showed that the forest will be depleted by 2053.
From these findings, it is evident that population growth has led to massive land cover change in this water tower. This situation is likely to degenerate when the farmers living around this resource will seek to expand their agricultural lands. This also manifests from the dynamic and extensive agricultural activities within the 5 km buffer zone. It is therefore important for relevant stakeholders to take keen interest and reshape the strategies used towards sustainable management of water tower ecosystems in order to revert these ecosystems to their pristine condition. Focus should be placed on reviewing and harmonizing the relevant conservation and agricultural policies.
On the other hand, it is not easy to control population growth in developing countries [85]. Therefore, in order to curb the ever increasing population from encroaching on these water towers and avert further land cover change, to start with, this paper recommends putting up a physical barrier in the form of a fence. Fencing has aided in limiting the local people’s mobility into protected areas [86,87,88]. Public–private partnership (PPP) engagement can be adopted for this exercise as it will help bridge the financial gap. PPP not only allows for collaboration between public agencies and the private sector but also aims at delivering and sustaining public works and services with private sector resources and practical knowledge [89]. PPP has also led to improved sustainability when linked to social outcomes [90,91,92,93]. The respective subnational governments bounding these water towers should play a critical role in this exercise and help in fencing the sections within their jurisdiction.
Author Contributions
S.O. conceptualized the research, carried out data curation and writing of the original draft; Y.S. supervised the research, reviewed the manuscript and provided input in writing and finalizing the paper.
Funding
This work was supported by the 2018 Yeungnam University Research Grant.
Acknowledgments
The authors sincerely thank Park Chung Hee School of Policy and Saemaul-Yeungnam University, Korea and the Kenya Water Towers Agency for the administrative and technical support.
Conflicts of Interest
The authors declare no conflict of interest.
References
- Duhamel, C. Land Use, Land Cover, Including Their Classification. Encylopedia of Life Support System 2012. Available online: https://pdfs.semanticscholar.org/b6d7/1aa8fa32db298ffcbb8556d14d35f9bbcc49.pdf (accessed on 16 April 2019).
- Bestelmeyer, B.T.; Okin, G.S.; Duniway, M.C.; Archer, S.R.; Sayre, N.F.; Williamson, J.C.; Herrick, J.E. Desertification, land use, and the transformation of global drylands. Front. Ecol. Environ. 2015, 13, 28–36. [Google Scholar] [CrossRef]
- Miheretu, B.A.; Yimer, A.A. Land use/land cover changes and their environmental implications in the Gelana sub-watershed of northern highlands of Ethiopia. Environ. Syst. Res. 2018, 6, 7. [Google Scholar] [CrossRef]
- Foley, J.A.; DeFries, R.; Asner, G.P.; Barford, C.; Bonan, G.; Carpenter, S.R.; Chapin, F.S.; Coe, M.T.; Daily, G.C.; Gibbs, H.K. Global consequences of land use. Science 2005, 309, 570–574. [Google Scholar] [CrossRef] [PubMed]
- Al-doski, J.; Mansor, S.B.; Shafri, H.Z.M. Change detection process and techniques. Civ. Environ. Res. 2013, 3, 2365–2401. [Google Scholar]
- Paudel, B.; Zhang, Y.; Li, S.; Liu, L.; Wu, X.; Khanal, N.R. Review of studies on land use and land cover change in Nepal. J. Mt. Sci. 2016, 13, 643–660. [Google Scholar] [CrossRef]
- Song, W.; Deng, X. Land-use/land-cover change and ecosystem service provision in China. Sci. Total Environ. 2017, 576, 705–719. [Google Scholar] [CrossRef] [PubMed]
- de Sherbinin, A. Land-Use and Land-Cover Change, A CIESIN Thematic Guide; Center for International Earth Science Information Network, Columbia University: Palisades, NJ, USA, 2002. [Google Scholar]
- Bringezu, S.; Schütz, H.; Pengue, W.; O’Brien, M.; Garcia, F.; Sims, R.; Howarth, R.W.; Kauppi, L.; Swilling, M.; Herrick, J. Assessing Global Land Use: Balancing Consumption with Sustainable Supply; United Nations Environment Programme: Nairobi, Kenya, 2014. [Google Scholar]
- Marchant, R.; Richer, S.; Boles, O.; Capitani, C.; Courtney-Mustaphi, C.J.; Lane, P.; Prendergast, M.E.; Stump, D.; De Cort, G.; Kaplan, J.O. Drivers and trajectories of land cover change in East Africa: Human and environmental interactions from 6000 years ago to present. Earth-Sci. Rev. 2018, 178, 322–378. [Google Scholar] [CrossRef]
- Tsujino, R.; Yumoto, T.; Kitamura, S.; Djamaluddin, I.; Darnaedi, D. History of forest loss and degradation in Indonesia. Land Use Policy 2016, 57, 335–347. [Google Scholar] [CrossRef]
- Hunke, P.; Mueller, E.N.; Schröder, B.; Zeilhofer, P. The Brazilian Cerrado: Assessment of water and soil degradation in catchments under intensive agricultural use. Ecohydrology 2015, 8, 1154–1180. [Google Scholar] [CrossRef]
- Lanz, B.; Dietz, S.; Swanson, T.M. The Expansion of Modern Agriculture and Global Biodiversity Decline. Ecol. Econ. 2018, 144, 260–277. [Google Scholar] [CrossRef]
- Jewitt, D.; Goodman, P.S.; Erasmus, B.F.; O’Connor, T.G.; Witkowski, E.T. Systematic land-cover change in KwaZulu-Natal, South Africa: Implications for biodiversity. S. Afr. J. Sci. 2015, 111, 1–9. [Google Scholar]
- Cobbinah, P.B.; Erdiaw-Kwasie, M.O.; Amoateng, P. Rethinking sustainable development within the framework of poverty and urbanisation in developing countries. Environ. Dev. 2015, 13, 18–32. [Google Scholar] [CrossRef]
- Adams, S.; Opoku, E.E.O. Population Growth and Urbanization in Africa: Implications for the Environment. In Population Growth and Rapid Urbanization in the Developing World; IGI Global: Hershey, PA, USA, 2016; pp. 282–297. [Google Scholar]
- d’Amour, C.B.; Reitsma, F.; Baiocchi, G.; Barthel, S.; Güneralp, B.; Erb, K.-H.; Haberl, H.; Creutzig, F.; Seto, K.C. Future urban land expansion and implications for global croplands. Proc. Natl. Acad. Sci. USA 2017, 114, 8939–8944. [Google Scholar] [CrossRef] [PubMed]
- Urgesa, A.A.; Abegaz, A.; Bahir, A.L.; Antille, D.L. Population growth and other factors affecting land-use and land-cover changes in north-eastern Wollega, Ethiopia. Trop. Agric. 2016, 93, 298–311. [Google Scholar]
- Vandercasteelen, J.; Beyene, S.T.; Minten, B.; Swinnen, J. Cities and agricultural transformation in Africa: Evidence from Ethiopia. World Dev. 2018, 105, 383–399. [Google Scholar] [CrossRef]
- Meiyappan, P.; Jain, A.K. Three distinct global estimates of historical land-cover change and land-use conversions for over 200 years. Front. Earth Sci. 2012, 6, 122–139. [Google Scholar] [CrossRef]
- Government of Kenya (GoK). Kenya Gazette Supplement Number 27. Legal Notice No. 27; Government Printer: Nairobi, Kenya, 2012.
- Kenya Water Towers Agency (KWTA). Kenya Water Towers Status Report; Kenya Water Towers Agency: Nairobi, Kenya, 2015.
- Wood, S.L.; Jones, S.K.; Johnson, J.A.; Brauman, K.A.; Chaplin-Kramer, R.; Fremier, A.; Girvetz, E.; Gordon, L.J.; Kappel, C.V.; Mandle, L. Distilling the role of ecosystem services in the Sustainable Development Goals. Ecosyst. Serv. 2018, 29, 70–82. [Google Scholar] [CrossRef]
- Barlow, J.; Lennox, G.D.; Ferreira, J.; Berenguer, E.; Lees, A.C.; Mac Nally, R.; Thomson, J.R.; de Barros Ferraz, S.F.; Louzada, J.; Oliveira, V.H.F. Anthropogenic disturbance in tropical forests can double biodiversity loss from deforestation. Nature 2016, 535, 144. [Google Scholar] [CrossRef]
- Xu, W.; Xiao, Y.; Zhang, J.; Yang, W.; Zhang, L.; Hull, V.; Wang, Z.; Zheng, H.; Liu, J.; Polasky, S. Strengthening protected areas for biodiversity and ecosystem services in China. Proc. Natl. Acad. Sci. USA 2017, 114, 1601–1606. [Google Scholar] [CrossRef]
- Albertazzi, S.; Bini, V.; Lindon, A.; Trivellini, G. Relations of power driving tropical deforestation: A case study from the Mau Forest (Kenya). Belgeo. Revue belge de géographie 2018, 2. [Google Scholar] [CrossRef]
- Kundu, P.M.; Olang, L.O. Automated extraction of morphologic and hydrologic properties for River Njoro catchment in Eastern Mau, Kenya. AGSE 2011, 2008, 147. [Google Scholar]
- Olang, L.O.; Fürst, J. Effects of land cover change on flood peak discharges and runoff volumes: Model estimates for the Nyando River Basin, Kenya. Hydrol. Process. 2011, 25, 80–89. [Google Scholar] [CrossRef]
- Matano, A.-S.; Kanangire, C.K.; Anyona, D.N.; Abuom, P.O.; Gelder, F.B.; Dida, G.O.; Owuor, P.O.; Ofulla, A.V. Effects of land use change on land degradation reflected by soil properties along Mara River, Kenya and Tanzania. Open J. Soil Sci. 2015, 5, 20. [Google Scholar] [CrossRef]
- Kinyanjui, M.J. The Effect of Human Encroachment on Forest Cover, Composition and Structure in the Western Blocks of the Mau Forest Complex. Ph.D. Thesis, Egerton University, Nakuru, Kenya, 2009. Unpublished work. [Google Scholar]
- Boitt, M.K. Impacts of Mau Forest Catchment on the Great Rift Valley Lakes in Kenya. J. Geosci. Environ. Prot. 2016, 4, 137. [Google Scholar] [CrossRef][Green Version]
- Bewernick, T. Mapping Forest Degradation in the Mau Forest Complex Using NDFI Time Series. Master’s Thesis, Wageningen University, Wageningen, The Netherlands, 2016. [Google Scholar]
- Nkako, F.; Lambrechts, C.; Gachanja, M.; Woodley, B. Maasai Mau Forest Status Report 2005; Ewaso Ngiro South Development Authority: Narok, Kenya, 2005.
- Olang, L.O.; Kundu, P.M. Land degradation of the Mau forest complex in Eastern Africa: A review for management and restoration planning. In Environmental Monitoring; IntechOpen: London, UK, 2011. [Google Scholar]
- Mutangah, J.G.; Mwangangi, O.M.; Mwaura, P.K. Mau Forest Complex Vegetation Survey; Centre for Biodiversity, National Museums of Kenya: Nairobi, Kenya, 1993. [Google Scholar]
- Were, K.O.; Dick, Ø.; Singh, B.R. Remotely sensing the spatial and temporal land cover changes in Eastern Mau forest reserve and Lake Nakuru drainage basin, Kenya. Appl. Geogr. 2013, 41, 75–86. [Google Scholar] [CrossRef]
- Baldyga, T.J.; Miller, S.N.; Driese, K.L.; Gichaba, C.M. Assessing land cover change in Kenya’s Mau Forest region using remotely sensed data. Afr. J. Ecol. 2008, 46, 46–54. [Google Scholar] [CrossRef]
- Miao, L.; Zhu, F.; Sun, Z.; Moore, J.; Cui, X. China’s land-use changes during the past 300 years: A historical perspective. Int. J. Environ. Res. Public Health 2016, 13, 847. [Google Scholar] [CrossRef]
- Alo, C.A.; Pontius Jr, R.G. Identifying systematic land-cover transitions using remote sensing and GIS: The fate of forests inside and outside protected areas of Southwestern Ghana. Environ. Plan. B Plan. Des. 2008, 35, 280–295. [Google Scholar] [CrossRef]
- Lepers, E.; Lambin, E.F.; Janetos, A.C.; DeFries, R.; Achard, F.; Ramankutty, N.; Scholes, R.J. A synthesis of information on rapid land-cover change for the period 1981–2000. BioScience 2005, 55, 115–124. [Google Scholar] [CrossRef]
- Chrisphine, O.M.; Odhiambo, A.M.; Boitt, K.M. Assessment of hydrological impacts of Mau Forest, Kenya. Hydrol. Curr. Res. 2016, 7. [Google Scholar] [CrossRef]
- Kratz, C.A. Affecting Performance: Meaning, Movement, and Experience in Okiek Women’s Initiation; Wheatmark: Tucson, AZ, USA, 2010. [Google Scholar]
- Government of Kenya (GoK). Rehabilitation of the Mau Forest Ecosystem; A Project Concept prepared by the Interim Coordinating Secretariat, Office of the Prime Minister, on Behalf of the Government of Kenya; Government Printer: Nairobi, Kenya, 2009.
- Mati, B.M.; Mutie, S.; Gadain, H.; Home, P.; Mtalo, F. Impacts of land-use/cover changes on the hydrology of the transboundary Mara River, Kenya/Tanzania. Lakes Reserv. Res. Manag. 2008, 13, 169–177. [Google Scholar] [CrossRef]
- Fu, P.; Weng, Q. A time series analysis of urbanization induced land use and land cover change and its impact on land surface temperature with Landsat imagery. Remote Sens. Environ. 2016, 175, 205–214. [Google Scholar] [CrossRef]
- Li, X.; Gong, P.; Liang, L. A 30-year (1984–2013) record of annual urban dynamics of Beijing City derived from Landsat data. Remote Sens. Environ. 2015, 166, 78–90. [Google Scholar] [CrossRef]
- Yin, H.; Pflugmacher, D.; Li, A.; Li, Z.; Hostert, P. Land use and land cover change in Inner Mongolia-understanding the effects of China’s re-vegetation programs. Remote Sens. Environ. 2018, 204, 918–930. [Google Scholar] [CrossRef]
- Fang, X.; Zhu, Q.; Ren, L.; Chen, H.; Wang, K.; Peng, C. Large-scale detection of vegetation dynamics and their potential drivers using MODIS images and BFAST: A case study in Quebec, Canada. Remote Sens. Environ. 2018, 206, 391–402. [Google Scholar] [CrossRef]
- Hansen, M.C.; Loveland, T.R. A review of large area monitoring of land cover change using Landsat data. Remote Sens. Environ. 2012, 122, 66–74. [Google Scholar] [CrossRef]
- Fetene, A.; Hilker, T.; Yeshitela, K.; Prasse, R.; Cohen, W.; Yang, Z. Detecting trends in landuse and landcover change of Nech Sar National Park, Ethiopia. Environ. Manag. 2016, 57, 137–147. [Google Scholar] [CrossRef]
- Khorram, S.; Van Der Wiele, C.F.; Koch, F.H.; Nelson, S.A.; Potts, M.D. Principles of Applied Remote Sensing; Springer: Berlin/Heidelberg, Germany, 2016. [Google Scholar]
- Richards, J.A. Remote Sensing Digital Image Analysis; Springer: Berlin/Heidelberg, Germany, 1999; Volume 3. [Google Scholar]
- Lillesand, T.; Kiefer, R.W.; Chipman, J. Remote Sensing and Image Interpretation; John Wiley & Sons: Hoboken, NJ, USA, 2014. [Google Scholar]
- Janssen, L.L.F.; Bakker, W.H.; Weir, M.J.C.; Gorte, B.G.H.; Pohl, C.; Woldai, T.; Horn, J.A.; Reeves, C.V. Principles of Remote Sensing: An Introductory Textbook; ITC Educational Textbook Series; ITC: Enschede, The Netherlands, 2000. [Google Scholar]
- Thomas, I.L.; Benning, V.M.; Ching, N.P. Classification of remotely sensed images. Geocarto Int. 1987, 2, 77. [Google Scholar] [CrossRef]
- Mackenzie, C.A.; Hartter, J. Demand and proximity: Drivers of illegal forest resource extraction. Oryx 2013, 47, 288–297. [Google Scholar] [CrossRef]
- Kenya National Bureau of Statistics (KNBS). 1979 Population Census-Analytical Report, 2nd ed.; Government Printer: Nairobi, Kenya, 1979.
- Kenya National Bureau of Statistics (KNBS). 1999 Population and Housing Census-Population Distribution by Administrative Units, 1st ed.; Government Printer: Nairobi, Kenya, 2001.
- Kenya National Bureau of Statistics (KNBS). 2009 Kenya Population and Housing Census-Population Distribution by Administrative Units; Government Printer: Nairobi, Kenya, 2010.
- Kenya National Bureau of Statistics (KNBS). 2009 Kenya Population and Housing Census-Population Distribution by Political Units; Government Printer: Nairobi, Kenya, 2010.
- Government of Kenya (GoK). Kenya Population Situation Analysis; Government Printer: Nairobi, Kenya, 2013.
- Asuero, A.G.; Sayago, A.; González, A.G. The Correlation Coefficient: An Overview. Crit. Rev. Anal. Chem. 2006, 36, 41–59. [Google Scholar] [CrossRef]
- Deng, X.; Jiang, Q.; Zhan, J.; He, S.; Lin, Y. Simulation on the dynamics of forest area changes in Northeast China. J. Geogr. Sci. 2010, 20, 495–509. [Google Scholar] [CrossRef]
- EIA US. Energy Information Administration “International Energy Outlook”; Report DOE/EIA-0484; U.S. Energy Information Administration (EIA): Washington, DC, USA, 2010.
- Samie, A.; Deng, X.; Jia, S.; Chen, D. Scenario-based simulation on dynamics of land-use-land-cover change in Punjab Province, Pakistan. Sustainability 2017, 9, 1285. [Google Scholar] [CrossRef]
- Puyravaud, J.-P. Standardizing the calculation of the annual rate of deforestation. For. Ecol. Manag. 2003, 177, 593–596. [Google Scholar] [CrossRef]
- Murcia, C.; Guariguata, M.R.; Andrade, Á.; Andrade, G.I.; Aronson, J.; Escobar, E.M.; Etter, A.; Moreno, F.H.; Ramírez, W.; Montes, E. Challenges and prospects for scaling-up ecological restoration to meet international commitments: Colombia as a case study. Conserv. Lett. 2016, 9, 213–220. [Google Scholar] [CrossRef]
- Evans, K.; Guariguata, M.R.; Brancalion, P.H. Participatory monitoring to connect local and global priorities for forest restoration. Conserv. Biol. 2018, 32, 525–534. [Google Scholar] [CrossRef]
- Popradit, A.; Srisatit, T.; Kiratiprayoon, S.; Yoshimura, J.; Ishida, A.; Shiyomi, M.; Murayama, T.; Chantaranothai, P.; Outtaranakorn, S.; Phromma, I. Anthropogenic effects on a tropical forest according to the distance from human settlements. Sci. Rep. 2015, 5, 14689. [Google Scholar] [CrossRef]
- Recha, C.W. Local and Regional Variations in Conditions for Agriculture and Food Security in Kenya; AgriFoSe2030 Report 7; Lund University, Sweden Egerton University: Njoro, Kenya, 2018. [Google Scholar]
- Government of Kenya (GoK). Report of the Prime Minister’s Task Force on the Conservation of the Mau Forest Complex; Government Printer: Nairobi, Kenya, 2009.
- Kimaiyo, J.T. Ogiek Land Cases and Historical Injustices; Ogiek Welfare Council: Nakuru, Kenya, 2004. [Google Scholar]
- Otuoma, J.; Langat, D.; Maina, J.; Maina, G.; Maina, J.; Mwanje, P. Effects of Watershed Degradation on Hydrological Functions in the Sondu River Catchment 2012. Available online: https://www.academia.edu/37661780/Effect_of_Watershed_Degradation_on_Hydrological_Functions_in_the_Sondu_River_Catchment (accessed on 22 April 2019).
- Standing, A.; Gachanja, M. The Political Economy of REDD+ in Kenya: Identifying and Responding to Corruption Challenges; U4 Issue; Chr. Michelsen Institute: Bergen, Norway, 2014. [Google Scholar]
- Naughton, L.; Alix-Garcia, J.; Chapman, C.A. A decade of forest loss and economic growth around Kibale National Park, Uganda: Lessons for poverty reduction and biodiversity conservation. Proc. Natl. Acad. Sci. USA 2011, 108, 13919–13924. [Google Scholar] [CrossRef]
- Lambin, E.F.; Geist, H.J.; Lepers, E. Dynamics of land-use and land-cover change in tropical regions. Annu. Rev. Environ. Resour. 2003, 28, 205–241. [Google Scholar] [CrossRef]
- Government of Kenya (GoK). Sessional Paper No 3 of 2009 on National Land Policy 2009; Government Printer: Nairobi, Kenya, 2009.
- Mwangi, H.; Lariu, P.; Julich, S.; Patil, S.; McDonald, M.; Feger, K.-H. Characterizing the intensity and dynamics of land-use change in the Mara River Basin, East Africa. Forests 2017, 9, 8. [Google Scholar] [CrossRef]
- Mather, A.S.; Needle, C.L. The relationships of population and forest trends. Geogr. J. 2000, 166, 2–13. [Google Scholar] [CrossRef]
- Rosero-Bixby, L.; Palloni, A. Population and deforestation in Costa Rica. Popul. Environ. 1998, 20, 149–185. [Google Scholar] [CrossRef]
- Carr, D.L. Population Soil Use and Deforestation in the Sierra de Lacandón National Park Petén Guatemala; University of Costa Rica: San José, Costa Rica, 2001. [Google Scholar]
- Henry, M.; Picard, N.; Trotta, C.; Manlay, R.; Valentini, R.; Bernoux, M.; Saint André, L. Estimating tree biomass of sub-Saharan African forests: A review of available allometric equations. Silva Fenn. 2011, 45, 477–569. [Google Scholar] [CrossRef]
- Recha, J.W.; Lehmann, J.; Walter, M.T.; Pell, A.; Verchot, L.; Johnson, M. Stream discharge in tropical headwater catchments as a result of forest clearing and soil degradation. Earth Interact. 2012, 16, 1–18. [Google Scholar] [CrossRef]
- Sajikumar, N.; Remya, R.S. Impact of land cover and land use change on runoff characteristics. J. Environ. Manag. 2015, 161, 460–468. [Google Scholar] [CrossRef] [PubMed]
- Komu, M.D.; Edward, A.; Ethelberg, S.N. Family planning and population control in developing countries: Ethical and sociocultural dilemmas. Online J. Health Ethics 2015, 11, 6. [Google Scholar] [CrossRef][Green Version]
- Büscher, B. Anti-politics as political strategy: Neoliberalism and transfrontier conservation in southern Africa. Dev. Chang. 2010, 41, 29–51. [Google Scholar] [CrossRef]
- Lindsey, P.A.; Masterson, C.L.; Beck, A.L.; Romañach, S. Ecological, social and financial issues related to fencing as a conservation tool in Africa. In Fencing for Conservation; Springer: Berlin/Heidelberg, Germany, 2012; pp. 215–234. [Google Scholar]
- Kesch, M.K.; Bauer, D.T.; Loveridge, A.J. Break on through to the other side: The effectiveness of game fencing to mitigate human—Wildlife conflict. Afr. J. Wildl. Res. 2015, 45, 76–88. [Google Scholar] [CrossRef]
- Gunnigan, L.; Rajput, R. Comparison of Indian PPP construction industry and European PPP construction industry: Process, thresholds and implementation. In Proceedings of the CIB World Congress 2010, Salford, UK, 1 January 2010. [Google Scholar]
- Liyanage, C.; Villalba-Romero, F. Measuring success of PPP transport projects: A cross-case analysis of toll roads. Transp. Rev. 2015, 35, 140–161. [Google Scholar] [CrossRef]
- Villalba-Romero, F.; Liyanage, C.; Roumboutsos, A. Sustainable PPPs: A comparative approach for road infrastructure. Case Stud. Transp. Policy 2015, 3, 243–250. [Google Scholar] [CrossRef]
- Bjärstig, T. Does Collaboration Lead to Sustainability? A Study of Public–Private Partnerships in the Swedish Mountains. Sustainability 2017, 9, 1685. [Google Scholar] [CrossRef]
- Wojewnik-Filipkowska, A.; Węgrzyn, J. Understanding of Public–Private Partnership Stakeholders as a Condition of Sustainable Development. Sustainability 2019, 11, 1194. [Google Scholar] [CrossRef]
© 2019 by the authors. Licensee MDPI, Basel, Switzerland. This article is an open access article distributed under the terms and conditions of the Creative Commons Attribution (CC BY) license (http://creativecommons.org/licenses/by/4.0/).