Article

The Effects of Pressure and Temperature on the Process of Auto-Ignition and Combustion of Rape Oil and Its Mixtures

1
Department of Organization and Production Engineering, Warsaw University of Life Sciences, Nowoursynowska Street 164, 02-787 Warsaw, Poland
2
Deptartment of Production Management, Bialystok University of Technology, Wiejska Street 45A, 15-351 Bialystok, Poland
3
Faculty of Mechanical Engineering, Institute of Technological Information Systems, Lublin University of Technology, Nadbystrzycka 38 D, 20-618 Lublin, Poland
*
Authors to whom correspondence should be addressed.
Sustainability 2019, 11(12), 3451; https://doi.org/10.3390/su11123451
Submission received: 18 May 2019 / Revised: 15 June 2019 / Accepted: 19 June 2019 / Published: 23 June 2019
(This article belongs to the Special Issue Environment-Friendly Chemical Processes)

Abstract

:
The effects of initial pressure and temperature in a constant volume test chamber with a common rail injection system on the processes of self-ignition and combustion of rapeseed oil and various blends of rapeseed oil with diesel oil are explored. Based on the obtained pressure waveforms the amount of emitted heat was determined, and the tested fuels were compared. The variations of a number of physicochemical characteristics that occur during the combustion processes were evaluated for several mixtures of fuel components. It was found that in the case of blends of rapeseed oil with diesel oil, the best results were obtained for a mixture containing 70 weight percent of diesel oil and 30% of rapeseed oil.

1. Introduction

The economies of countries around the world depend on the energy sector [1,2]. The continuous decrease of global reserves of conventional energetic raw materials, e.g., hard coal, petroleum and natural gas, cause an increase in the prices of fossil fuels and concern for sustainable development, energy security and global climate change. Those facts have lead to seeking alternative renewable energy sources [3,4].
CO2 reduction issues are also important in this process [5,6]. Priority in the climate and energy policy of the European Union (EU) is given to actions aimed at protecting air purity and reducing greenhouse gas emissions [7,8]. The EU’s long-term objective is to achieve levels of air quality that do not give rise to unacceptable impacts on and risks to human health and the environment [9,10]. One of the main sources of air pollution in the EU is the road transport sector [11,12].
Transport is one of the key sectors of the European economy and a major energy consumer [13,14]. The majority of the energy used in transport comes from conventional fuels [15,16]. This situation is gradually beginning to change through the introduction of alternative fuels and the promotion of electromobility [17,18]. Within the meaning of the Directive [19], alternative fuels are fuels or energy sources which serve, at least in part, as a substitute for energy sources in the transport from crude oil and which have the potential to contribute to reducing the dependence of EU member states on oil imports and to decarbonize transport and improve the environmental performance of this sector.
An important role in these issues is played by the biofuels [20,21]. They belong to renewable energy sources, the use of which has accompanied humanity from the earliest times [22,23]. In general, the biofuels can be divided into alcohols and esters [24,25]. The former (most often produced from cereals, maize, potatoes and sugar beet) are alternative fuels for gasoline (low-pressure) engines [26,27]. Methyl or ethyl esters, obtained in the process of rape processing, are added to diesel oil [28]. Both types can be used as neat fuel or can be an addition to traditional fuels [29]. The former is still used on a small scale [30]. Biocomponents serving as an additive to motor gasolines and/or diesel oil are of greater importance [31].
As part of the European Low Carbon Mobility Strategy, the European Commission has announced that food-based biofuels will have a limited role in the decarbonization of transport after 2020. Second and third generation biofuels will be promoted [32,33].
Due to their physicochemical properties, vegetable oils are a valuable product, having a wide range of applications in many different areas of life. In addition to the manifold ways they can be used as a substrate, supplement or food product, vegetable oils can be used as an independent fuel for self-ignition engines or properly adapted heating devices [34,35].
Investigations of combustion processes conducted in research centers are mostly carried out on engines, which limits the possibility of assessing the direct impact of various factors on the combustion process [36,37]. Despite such labor-intensive and expensive activities, the research results refer only to specific technical and thermodynamic parameters [38,39]. There is also no possibility to control the parameters affecting the combustion process. While the driving unit (an engine) is used in research, with the interdependence of parameters usually observed, the change of one factor causes at the same time changes in other factors that affect the process. Hence, the results obtained are in most cases ambiguous and do not permit the determination of general relationships. In addition, the technical condition of the tested engine is not determined at the start of the tests. These issues are completely omitted in the research reports.
For the basic research of complex processes, such as combustion of fuels in diesel engines, special test chambers are used, enabling independent variation of parameters and the use of special experimental techniques for registration of process variables. In current biofuel market development, it is reasonable to determine the suitability of selected vegetable oils to be used as a fuel, and to check the possibility of their mutual replacement, in an economically or technically justified situations. Currently, vegetable oils are an irreplaceable raw material for the production of biocomponents (2nd generation biofuels, erucic rape) which are added to diesel oil in accordance with the requirements of the European law or constituting an independent fuel [40]. It results from the natural origin and renewable nature of this raw material, as well as full biodegradability in case of their emission into the environment [41].
Apparently, in order to use vegetable oil as engine fuel, it would be enough to perform only basic filtration to remove the suspended particles and possible small remains of the cake. In practice, the use of plant fuels requires some adaptation of the engine as some properties of these fuels differ from the properties of diesel fuels. Because vegetable oil has a kinematic viscosity several times higher than diesel fuel, the flux of vegetable fuel injected into the combustion chamber is sprayed to a much lesser extent than the stream of mineral fuel. Drops of sprayed vegetable oil are larger than that of diesel, and the fuel jet itself is more compact, which increases its range. As a result of inferior fuel spraying, the process of creating a fuel–air mixture proceeds worse and significantly slower. The air temperature in the chamber, a critical when burning vegetable oils, should be taken into account. The higher the temperature in the chamber, the easier and faster the process of evaporation occurs of the injected fuel and the formation of the fuel–air mixture. Therefore, it seems necessary to gain knowledge concerning the biofuel’s behavior in various thermodynamic conditions that affect the combustion process of these fuels. Therefore, the construction and use of computer simulation programs and models for determining and comparing analyzed parameters is not without significance, which in the context of support in research and development works is becoming increasingly popular among representatives of scientific sciences [42,43,44,45].
The aim of the work was to determine the impact of parameters such as initial pressure and initial temperature in the test chamber and pressure in the common rail injection system on the process of self-ignition and combustion of neat rapeseed oil and various mixtures of rapeseed oil with diesel oil.

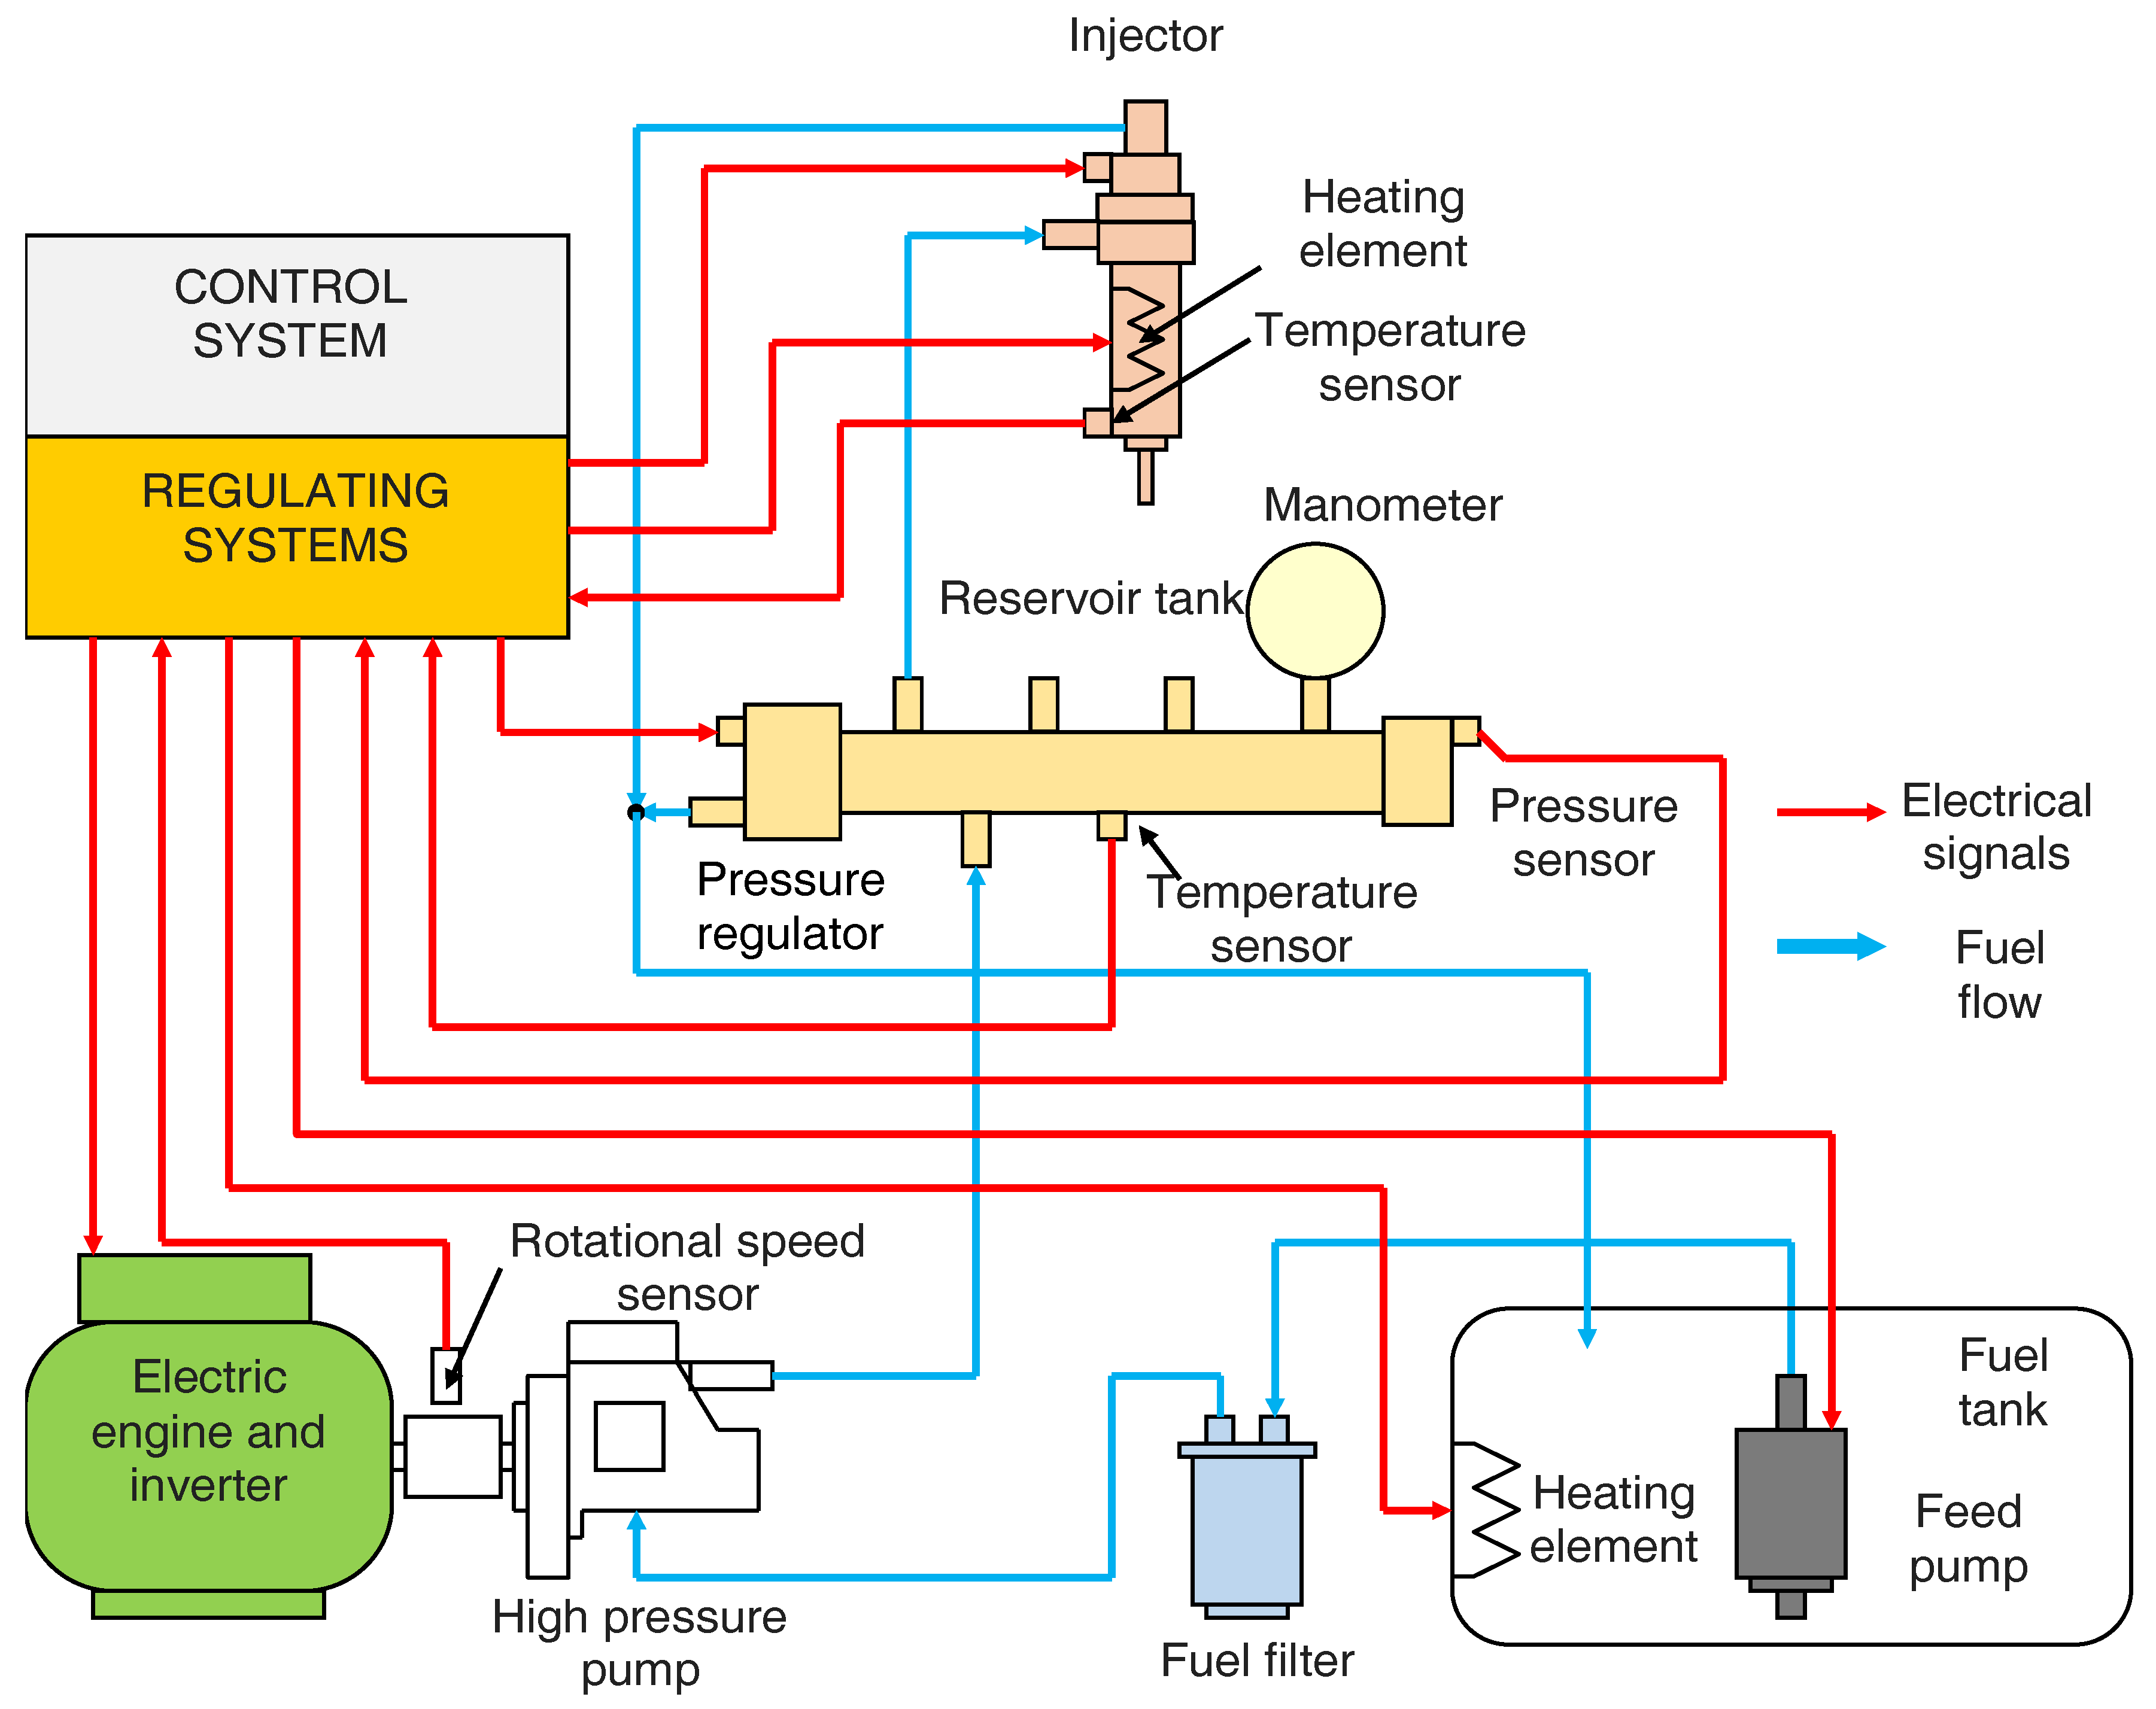
2. Materials and Methods

The tests were carried out on a fixed volume chamber equipped with a common rail injection system. On the basis of the pressure waveforms obtained, the heat was determined and the tested fuels were compared. The layout of the test bench is shown in Figure 1.
The tests were carried out for various air excess λ coefficients. The increase in the λ coefficient caused combustion deterioration. Thus, the paper presents only the results of the tests at a coefficient of λ = 1.25, at which the combustion process proceeded correctly.
The basic parameters of the process were: t0—self-ignition delay, ∆p—pressure increase and ts—combustion time.

Description of the Program

In order to analyze the thermal parameters of the combustion process of various fuels in the test chamber, a computer program was created enabling calculation of the heat generated in the process. The developed algorithm allows for a quick analysis of the pressure course in the test chamber. The input data for the developed computer tool were obtained from the project implemented at the Faculty of Production Engineering of the Warsaw University of Life Sciences [46].
The basic input is the pressure course during the injection process and during fuel combustion in the test chamber with a volume of 0.8 dm3. In addition, initial parameters such as temperature and initial pressure are needed. Basing on these parameters, the mass of air in the test chamber is calculated using the ideal gas equation.
p · V = m · R · T
Due to the fact that the pressure course contains oscillations probably resulting from disturbances, the first stage of the calculation is based on smoothing the pressure course. Smoothing is carried out according to the following relationship:
p n ( t i ) = 0.5 · ( p ( t i ) + p ( t i + 1 ) + p ( t i 1 ) 2 )
In the program it is assumed that initially the gas mixture contains nitrogen and oxygen. As a result of fuel combustion, the oxygen contained in the mixture is consumed and carbon dioxide and water vapor appear. Due to the relatively low concentrations of other exhaust components, their impact on the thermal parameters of the mixture, and thus on the result of the calculations, is small.
The calculation program takes into account changes in the specific heat and gas constant caused by the change in the composition of the mixture resulting from the combustion of fuel. In the case of specific heat, the influence of gas temperature was also taken into account. Due to the short process time (0.2 s), the heat exchange with the walls of the test chamber was omitted in the calculation model.
The value of the gas constant R is determined from the following equation:
R = 8.3143 · 10 3 · ( [ O 2 ] 32 + [ N 2 ] 28 + [ C O 2 ] 44 + [ H 2 O ] 18 )   [ J k g · K ]
The specific heat of the gas mixture in the chamber was determined according to the formula:
C p = [ O 2 ] · C p O 2 + [ N 2 ] · C p N 2 + [ C O 2 ] · C p C O 2 + [ H 2 O ] · C p H 2 O
C v = C p R
The specific heat at constant pressure for each component of the gas mixture was calculated from the dependence:
C p R 1 = a 1 + a 2 · T + a 3 · T 2 + a 4 · T 3 + a 5 · T 4
The heat separated is calculated from the formula:
d Q ( t i ) = m · C v · ( T i T i 1 )
Q i = Q i 1 + d Q i
T i = p i · V m · R i 1
T i 1 = p i 1 · V m · R i 1
If dQ is positive, then the fuel mass is calculated, which is burned to produce heat equal to dQ.
m p = d Q C s
Basing on the fuel composition, the program calculates the amount of carbon dioxide and water vapor that will be emitted from the burn mass of fuel. On this basis, the new composition of the gas mixture is calculated, as well as parameters such as specific heat and the gas constant. The new composition of the gas mixture is calculated as follows:
C + O 2 C O 2
12 g + 32 g 44 g
H 2 + 1 2 O 2 H 2 O
2 g + 16 g 18 g
[ O 2 ] i = ( m i 1 · [ O 2 ] i 1 ( x C · ( 32 / 12 ) + x H · 8 ) · m p + x O · m p ) / ( m i 1 + m p )
[ C O 2 ] i = ( m i 1 · [ C O 2 ] i 1 ( x C · ( 44 / 12 ) ) · m p ) / ( m i 1 + m p )
[ H 2 O ] i = ( m i 1 · [ H 2 O ] i 1 ( x H · 9 · m p ) / ( m i 1 + m p )
[ N 2 ] i = ( m i 1 · [ N 2 ] ) / ( m i 1 + m p )
The Table 1 contains a collection of the most important symbols used in the formulas used in calculations.

3. Calculation Results

According to the procedure described above, the amount of heat released in the combustion process for the following fuels and their mixtures was calculated (Table 2).
The characteristics of these three fuels are presented in Table 3.
As a result of the calculations, the following parameters are obtained as a function of time: smoothed pressure course in the test chamber p = f ( t ,   T C R ,   p C R ,   m r ,   m d ) [MPa]; heat release rates d p / d t = f ( t ,   T C R ,   p C R ,   m r ,   m d ) [MPa/s]; average temperature in the test chamber T = f ( t ,   T C R ,   p C R ,   m r ,   m d ) [K]; heat release rates d Q / d t = f ( t ,   T C R ,   p C R ,   m r ,   m d ) [J/s]; and values of heat released Q = f ( t ,   T C R ,   p C R ,   m r ,   m d ) [J].
Based on these calculations, the effect of various parameters on the combustion process in the test chamber can be determined. The following values were varied during the tests: initial pressure in the chamber p k = { 0.5 } [MPa], initial temperature in the chamber T = { 350 ,   425 ,   500 ,   575 } [°C], excess air factor λ = { 1.25 } , injection pressure p C R = { 65 ,   100 } [MPa], fuel composition m r = { 15 ,   30 ,   50 ,   70 ,   100 } [%m/m], m d = { 15 ,   30 ,   50 ,   70 ,   100 } [%m/m].
The sample parameters are stored in the file name with the pressure waveform in the chamber.

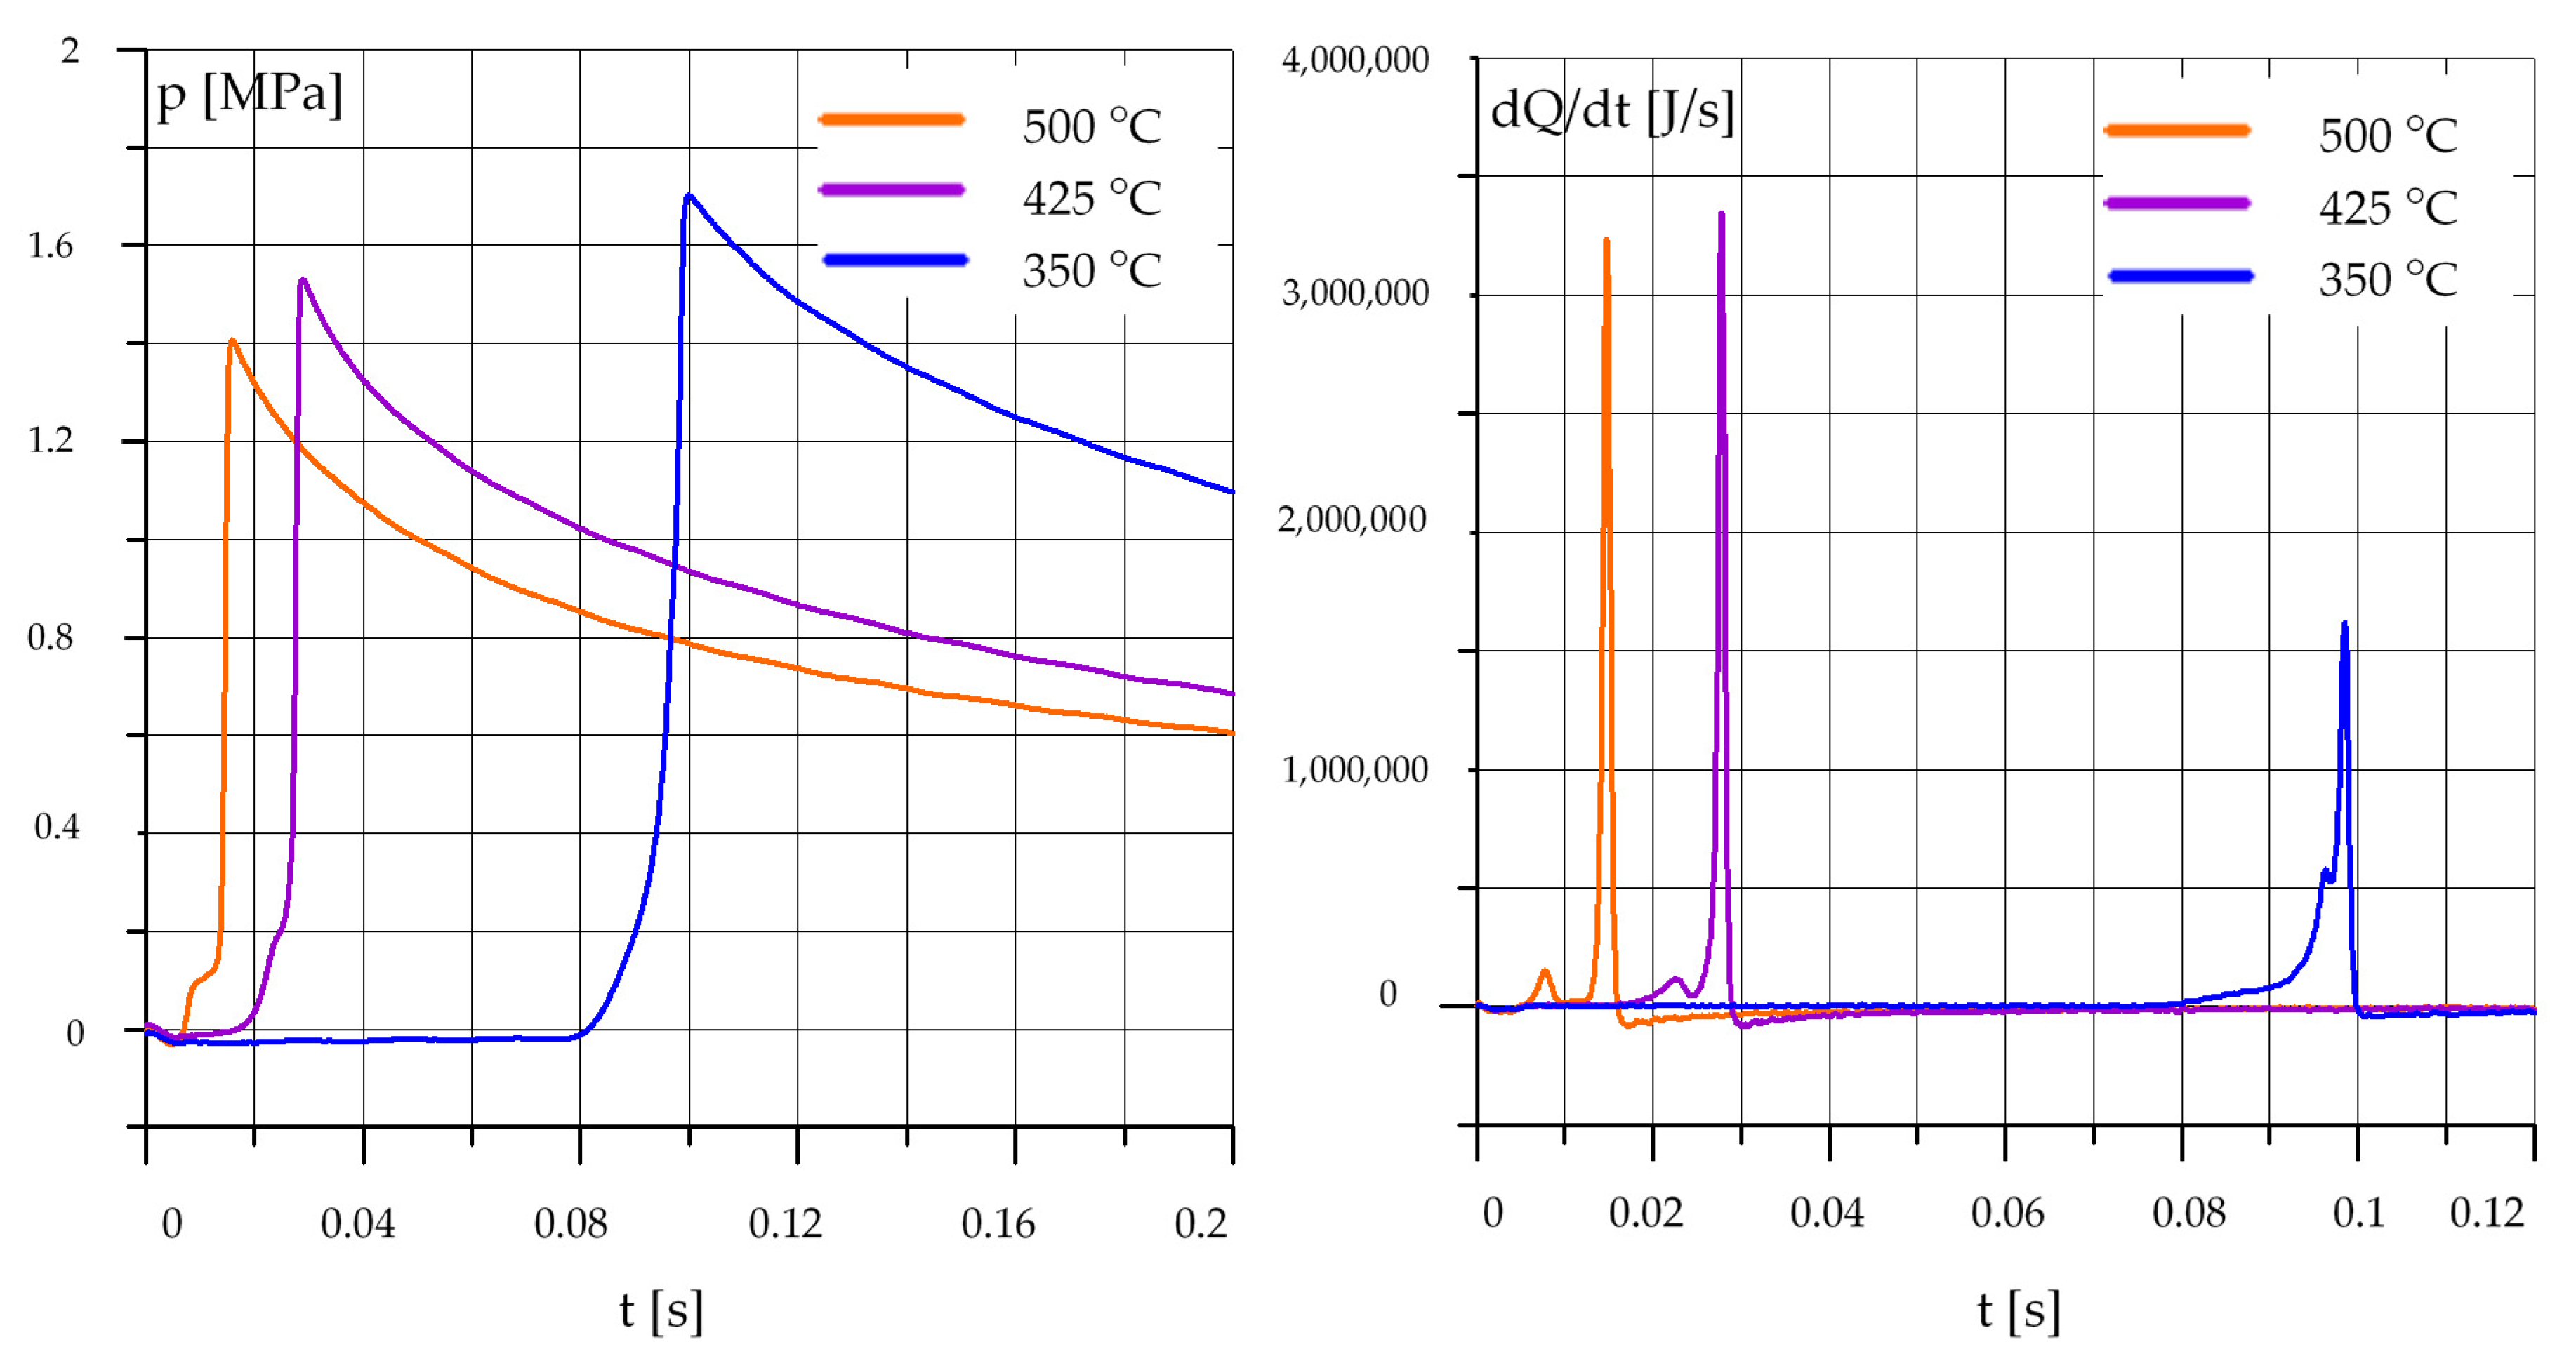
3.1. The Effect of Temperature

3.1.1. Diesel Oil (O)

At the initial stage of investigations, a number of tests were carried out using pure diesel oil and pure rapeseed oil. The obtained results are a reference to the analysis of the effects of the composition of mixtures diesel oil–rapeseed oil on the characteristics of the combustion process.
The diagrams presented in Figure 2 show the courses of pressure increases and heat release rates dQ/dt for pure diesel fuel at different values of the initial temperature in the test chamber. Other parameters such as initial pressure pk, fuel injection pressure pCR, air excess coefficient λ have the same values in the cases of both fuels. Based on the pressure rise patterns, it can be concluded that an increase in the initial temperature causes a significant reduction in the self-ignition delay time, and at the same time a reduction in the maximum pressure increase. This is related to the faster evaporation of the injected fuel, which causes faster fuel ignition. The time of the self-ignition delay is shortened, on the other hand the combustion has a rapid, violent character, which is visible on the heat release rates. This causes the rejection of not evaporated fuel from the reaction zone, and thus the reduction of the maximum pressure increase, and in the case of the engine, it would manifest itself through noisy engine operation. At initial temperatures above 350 °C, it is beside reducing the time of self-ignition delay, and does not improve the process parameters (pressure increases and heat release rates).

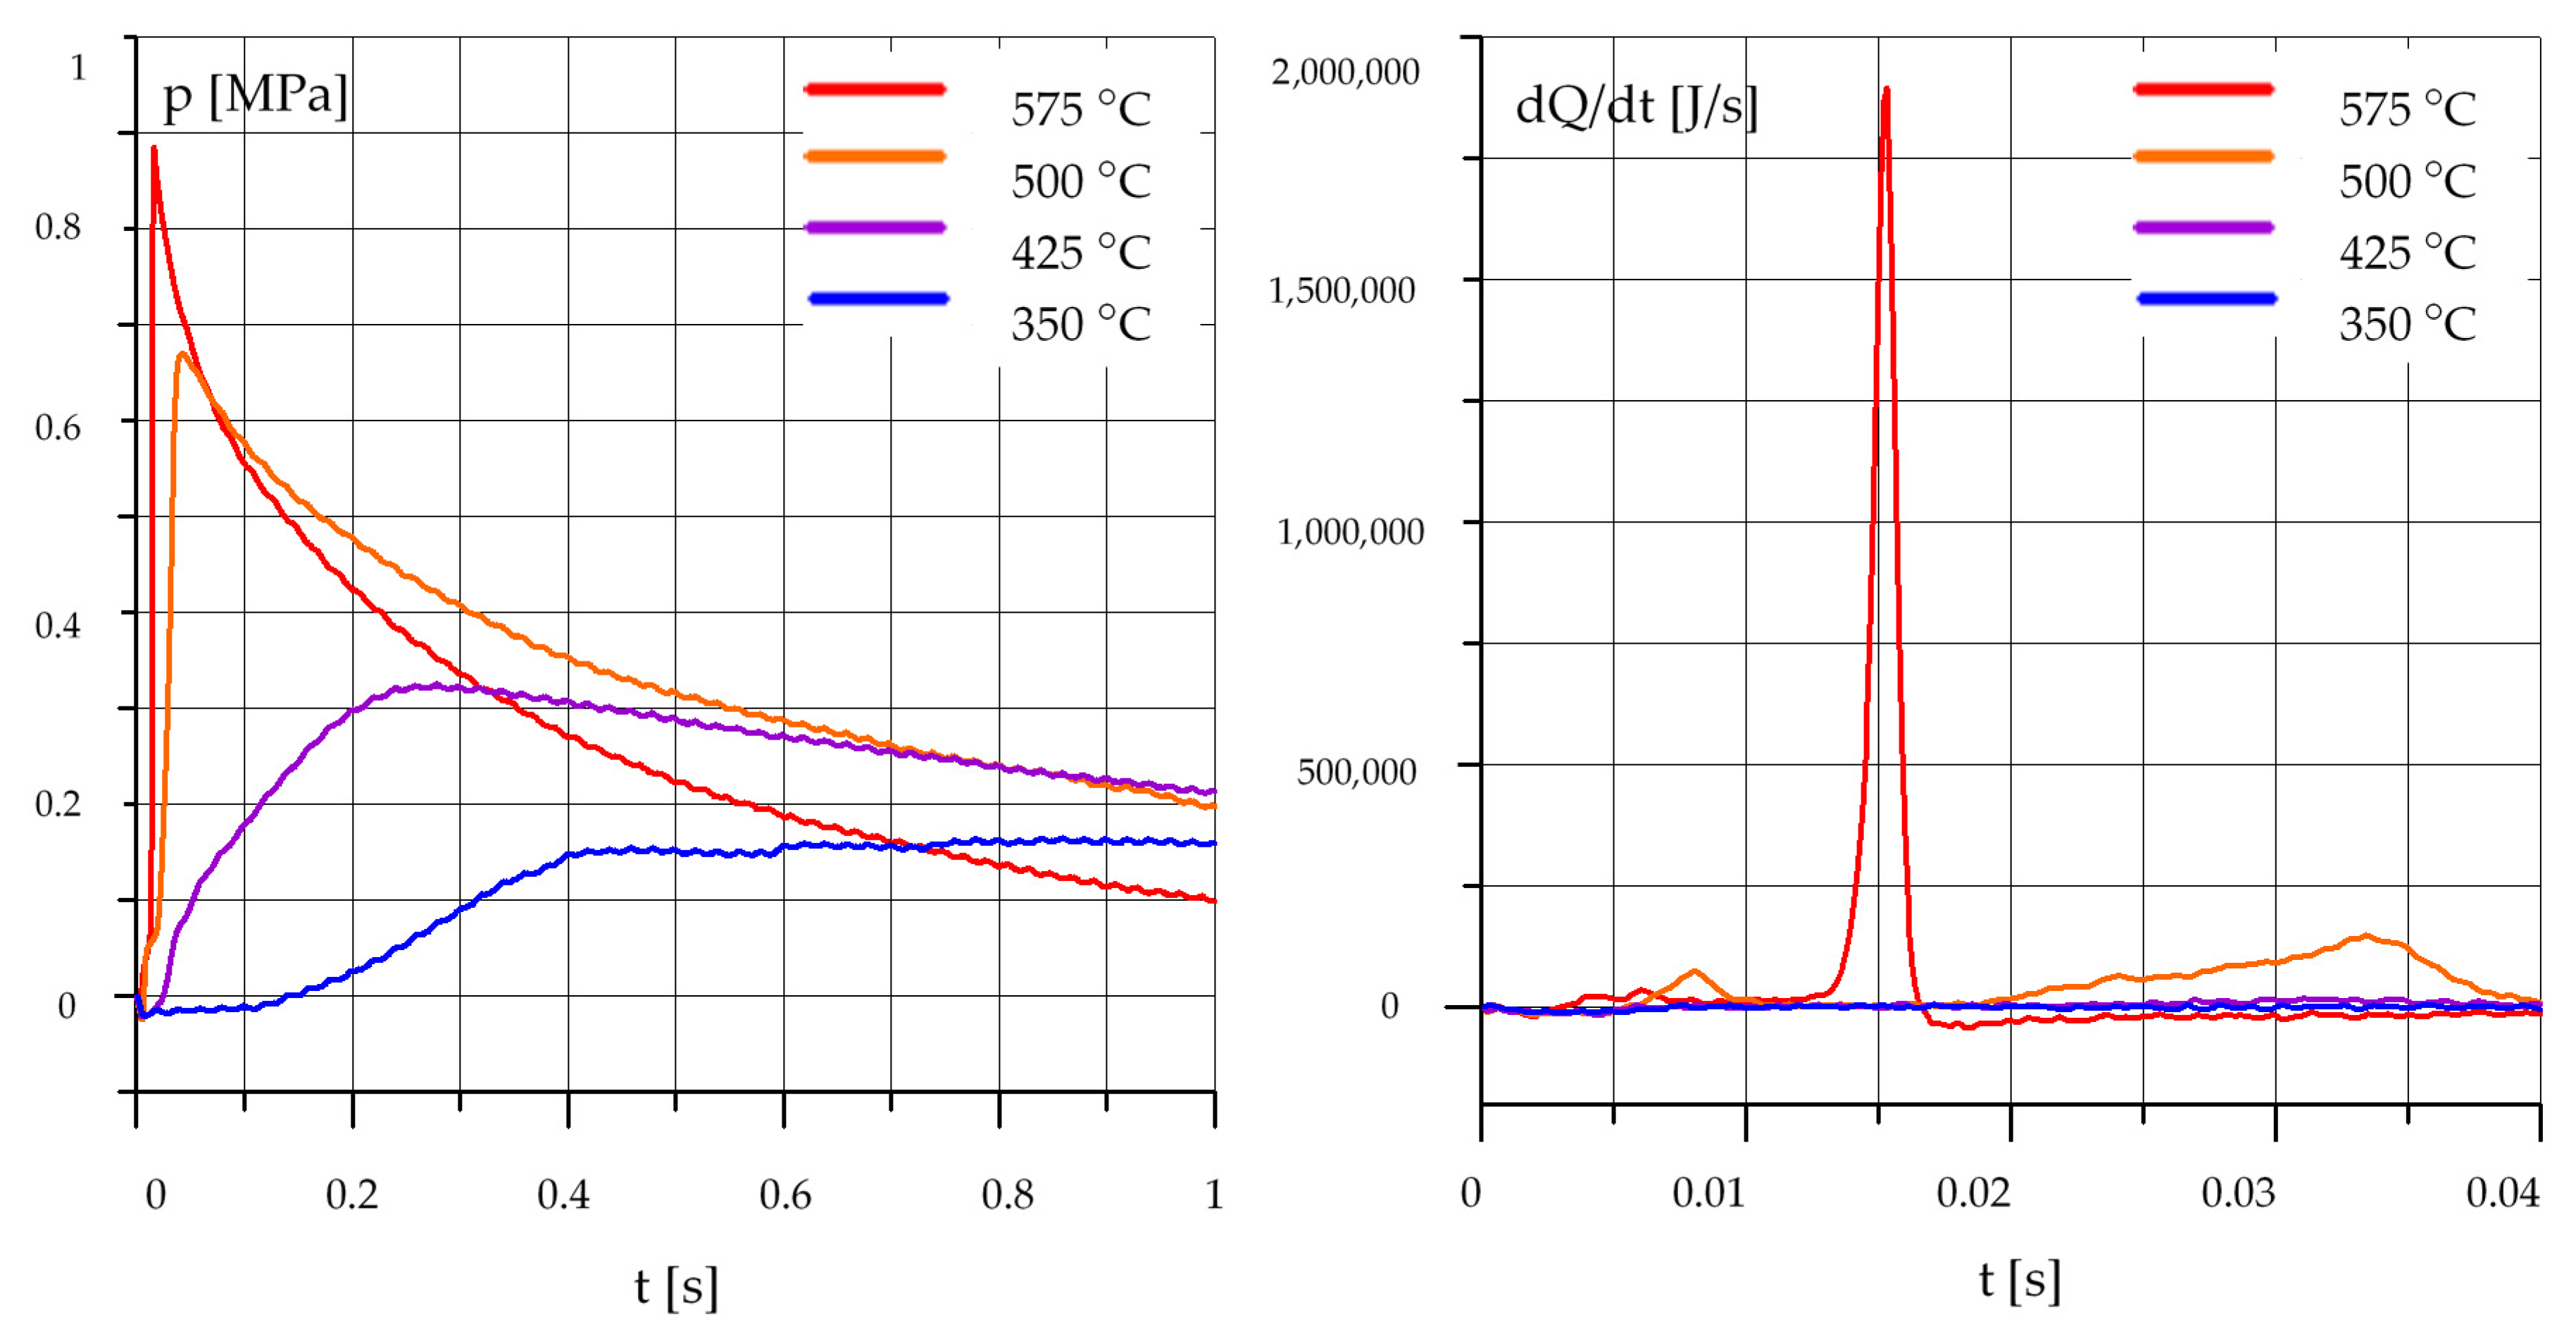
3.1.2. Rapeseed Oil (R)

Figure 3 shows the courses of the pressure increase and heat release rates dQ/dt for pure rapeseed oil.
Based on the waveforms, it can be concluded that the increase of temperature not only reduces the time of the self-ignition delay, but also causes a clear increase in the maximum pressure. At temperatures below 500 °C, the combustion process is very slow, and the maximum pressure is much lower than at higher initial temperatures. The influence of temperature on the process of spraying, auto-ignition and combustion of pure rapeseed oil is therefore more pronounced than for diesel oil. This may be associated with the higher density of rapeseed oil, and thus a lower content of light fractions that evaporate quickly and become self-igniting, which would cause an increase in temperature and an acceleration of the combustion of the heavier fractions. The addition of diesel oil to rapeseed oil reduces density and increases the content of the light fractions, and thus should improve spraying and accelerate auto-ignition.
The waveforms presented for rapeseed oil can be considered as the reference levels for mixtures of rapeseed oil with diesel oil.

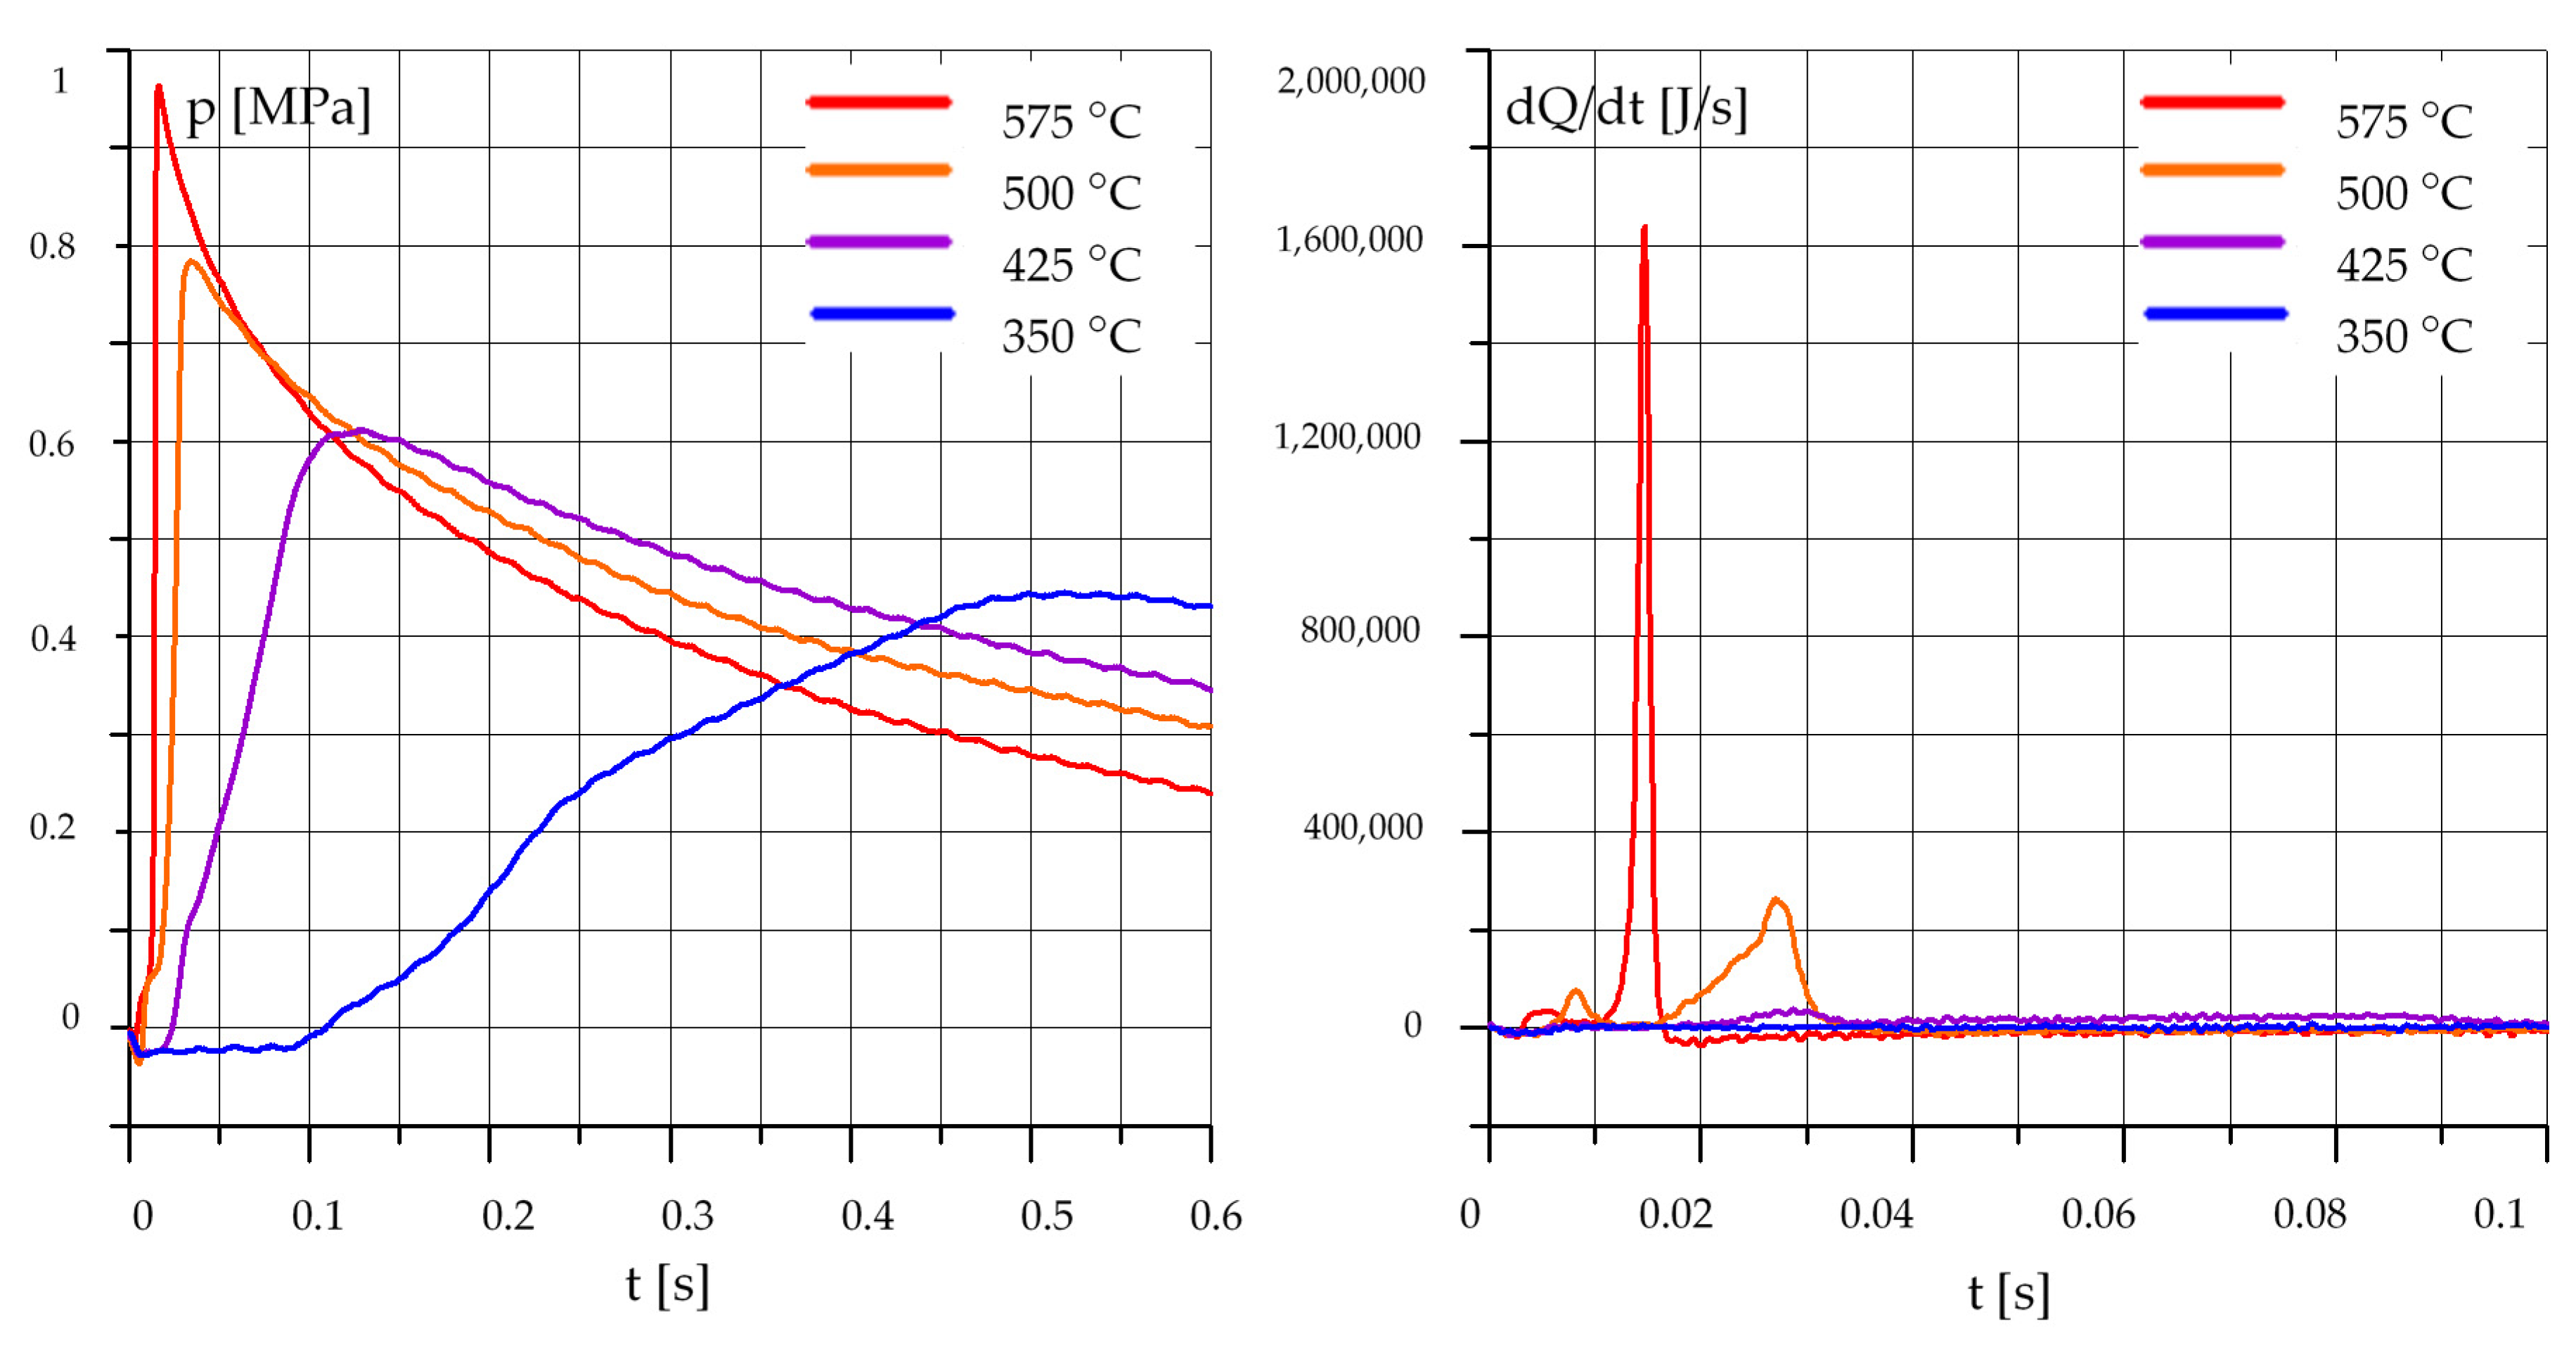
3.1.3. Mixtures of Rapeseed Oil (R) and Diesel Oil (O)

The runs shown in the following Figure 4, Figure 5, Figure 6 and Figure 7 show the influence of temperature on the combustion process of the analyzing mixtures of rape oil and diesel oil.
In the case of a small addition of diesel oil equal to 15% and 30% (Figure 4 and Figure 5), the ignition delay time is clearly shorter at 500 °C and 575 °C. The maximum value of the heat release rate, especially for the higher of the above temperatures is very high. For an initial temperature of 425 °C, the delay time is longer, and the maximum pressure is lower, as well as the maximum rate of heat release is clearly lower. For the initial temperature of 350 °C, the maximum values of pressure increase and the heat release rates are much lower, and the combustion process is very slow.
Similar conclusions can also be drawn from the analysis of the course of the pressure increases and heat release rates for higher diesel oil contents in the mixtures of 50% and 70% (Figure 6 and Figure 7). In the case of high initial temperatures in the chamber, i.e., above 500 °C, the combustion process is very fast and violent. For a temperature of 425 °C, an increase of the maximum pressure is slightly lower, the self-ignition delay time is longer, but the combustion process is less violent, the maximum heat release rate is lower. In the case of combustion in the engine, it would result in quieter operation and lower loads on the engine’s mechanical components. For the lowest temperature, equal to 350 °C, the combustion process is very slow, the delay time is much longer and the maximum pressure is much lower. It can therefore be concluded that the initial temperature range of 400–500 °C is optimal.

3.2. The Effect of the Composition of the Mixture

Figure 8, Figure 9, Figure 10 and Figure 11 shows the courses of pressure increases and the rates of process separation for various contents of diesel oil additions mixed with rapeseed oil. The process parameters are defined under each of the drawings.
In Figure 8, it can be seen that in the case of pure diesel oil and a mixture of 70% diesel oil and 30% rapeseed oil, the maximum pressure increases and heat release rates are clearly higher than for other fuels. For fuel mixtures with a diesel content of 15% to 50%, the maximum values of pressure increases and heat release rates are similar. The ignition delay times are also similar and clearly longer than for pure diesel and mixtures with 70% diesel oil content. For pure rapeseed oil the process parameters are clearly worse, the time of self-ignition delay is the longest, the maximum values of pressure increase and heat release rates are the lowest.
Figure 9 shows a comparison for a lower initial temperature than in the previous case. The effect of the composition of the mixture is similar to the previously described case, but the differences between pure diesel and other mixtures are even more pronounced.
An interesting result can be seen in the following graphs, shown in Figure 10. In this case, the fuel injection pressure was increased as compared to Figure 8. The conclusions are very similar to those drawn from the previously described runs, but the result of the test with a 50% diesel oil mixture with 50% rapeseed oil is especially interesting. Self-ignition is very delayed, and the maximum pressure and heat release rate is lower than for mixtures with 15% and 30% diesel oil content and only slightly higher than for pure rapeseed oil.
A very similar result can be seen in the graphs shown in Figure 11. As compared to Figure 10, the initial temperature in the chamber is lower and amounts to 425 °C. The parameters of the auto-ignition process and the combustion of a mixture of 50% diesel and 50% rapeseed oil are clearly worse than mixtures of rapeseed oil with 15% and 30% addition of diesel oil.
The fuel mixtures tested differ in parameters such as calorific value, stoichiometric ratio of fuel to air, oxygen content etc. In order to compare the combustion process of different mixtures, dimensionless normalization was based on the maximum pressure increase in the combustion chamber to the energy contained in the injected fuel dose. This normalization was done according to the following relationship:
η = p k m a x · V k m p · W u
Physically, this quantity corresponds to the combustion efficiency, because it represents the ratio of the pressure increase to the total energy introduced in the dose of fuel injected.
Figure 12 shows the dependence of normalized pressure increase as a function of the diesel oil content in the mixture. A similar tendency can be observed for each of the presented sets of test parameters. The increase in diesel oil content generally results in an increase in the normalized value of pressure increase, however, in the range of 15%–70%, this is minimal, and between 15% to 30% of diesel oil content, the differences are small. This result is not obvious and requires further testing and more detailed analysis.

4. Conclusions

Individual fuel features affect the basic processes occurring in a diesel engine in various ways. The mechanisms of these processes depend to a large extent on the thermodynamic conditions in the engine, and all processes, both chemical and physical, interact with each other and are interdependent.
It is highly complicated to determine even general relationships for the fast-changing and heterogeneous processes that occur during fuel combustion, especially since analytical and empirical relationships describing the processes of these basic processes have a limited scope of application in this case.
The air’s temperature in the chamber has the highest influence on the course of burning the vegetable oils. Along with its increase up to the maximum value tested, a shortening of the self-ignition delay time was obtained, with faster increases of combustion pressures and higher maximum values. At the highest temperature tested, while maintaining the optimal values of the remaining parameters, the combustion process of vegetable oils was similar to the course of the combustion processes of diesel oil. The air temperature in the chamber affects to a much greater extent the course of burning vegetable oils than diesel oil, which is the result of differences in the physical properties between the tested fuels increasing with increasing temperature. The second factor, which has a much greater impact on the course of burning of vegetable oils than diesel oil, is the air pressure in the combustion chamber. This parameter is clearly correlated with the temperature in the chamber. The strength of its impact on the course of the combustion process increases in proportion to the temperature increase in the air in the chamber. At lower temperatures, the impact is practically imperceptible. As the temperature rises, the chamber pressure reduces the time of self-ignition delay, increases the rate of pressure build-up and increases the maximum combustion pressure.
The injection pressure at temperatures up to 425 °C has the greatest impact on the combustion of rapeseed oil, and after exceeding 500 °C, it has the greatest impact on the burning of palm oil. The coefficient of excess air affects all fuels equally, extending the time of fuel burning with increasing its value, and at the maximum value—limiting the ability of fuel to self-ignition.
The process of burning vegetable oils can be significantly improved by increasing the temperature and air pressure in the combustion chamber. In the case of the engine, this may mean the need to change the injection advance angle and the need to increase the compression ratio. Increasing the temperature can also be achieved by increasing the operating temperature of the engine coolant.
On the basis of the analysis of heat preservation in the combustion of mixtures of rapeseed oil with diesel in a constant volume chamber and the tests made, the following conclusions can be drawn:
  • an increase in the rapeseed oil content in the mixture causes an increase in the self-ignition delay and a decrease in the maximum pressure, especially at lower initial temperature values in the test chamber;
  • in the case of mixtures of rapeseed oil and diesel oil, the best results were obtained for a mixture containing 70% by mass of diesel oil and 30% of rapeseed oil;
  • results obtained for a mixture containing 50% diesel oil and 50% rapeseed oil require further testing and confirmation.
It can be concluded, therefore, that neither the neat rapeseed oil nor its mixtures with other fuels are suitable for burning in non-modified diesel engine. Consequently, potential studies on mixtures with substances other than those actually tested or a search for the modification of the engine seems necessary. Such tasks will be undertaken in future research.

Author Contributions

Conceptualization, K.T. and O.O.; Methodology, O.O. and R.M.; Validation, K.T. and A.G.; Investigation, R.M. and A.G.; Writing—Original Draft Preparation, K.T. and O.O.; R.M.; A.G.; Funding Acquisition, A.G.

Funding

The authors wish to express gratitude to Lublin University of Technology for financial support given to the present publication (Arkadiusz Gola). The research was carried out under financial support obtained from the research subsidy of the Faculty of Engineering Management (WIZ) of Bialystok University of Technology (Olga Orynycz).

Conflicts of Interest

The authors declare no conflict of interest. The funders had no role in the design of the study; in the collection, analyses, or interpretation of data; in the writing of the manuscript, or in the decision to publish the results.

References

  1. Forin, S.; Radebach, A.; Steckel, J.C.; Ward, H. The effect of industry delocalization on global energy use: A global sectoral perspective. Energy Econ. 2018, 70, 233–243. [Google Scholar] [CrossRef] [Green Version]
  2. Energy and Economy. Electric Power Research Institute and Galvin Electricity Initiative. Available online: http://www.iiasa.ac.at/ (accessed on 28 April 2019).
  3. Samuelsson, K.; Giusti, M.; Peterson, G.D.; Legeby, A.; Brandt, S.A.; Barthel, S. Impact of environment on people’s everyday experiences in Stockholm. Landsc. Urban Plan. 2018, 171, 7–17. [Google Scholar] [CrossRef]
  4. Liu, D.; Guo, X.; Xiao, B. What causes growth of global greenhouse gas emissions? Evidence from 40 countries. Sci. Total Environ. 2019, 661, 750–766. [Google Scholar] [CrossRef] [PubMed]
  5. Tucki, K.; Orynycz, O.; Wasiak, A.; Świć, A.; Wichłacz, J. The Impact of Fuel Type on the Output Parameters of a New Biofuel Burner. Energies 2019, 12, 1383. [Google Scholar] [CrossRef]
  6. Tucki, K.; Mruk, M.; Orynycz, O.; Botwińska, K.; Gola, A. Toxicity of Exhaust Fumes (CO, NOx) of the Compression-Ignition (Diesel) Engine with the Use of Simulation. Sustainability 2019, 11, 2188. [Google Scholar] [CrossRef]
  7. Air Pollution: Our Health Still Insufficiently Protected. Available online: http://publications.europa.eu (accessed on 20 March 2019).
  8. Kuklinska, K.; Wolska, L.; Namiesnik, J. Air quality policy in the US and the EU—A review. Atmos. Pollut. Res. 2015, 6, 129–137. [Google Scholar] [CrossRef]
  9. Directive (EU) 2016/2284 of the European Parliament and of the Council of 14 December 2016 on the Reduction of National Emissions of Certain Atmospheric Pollutants, Amending Directive 2003/35/EC and Repealing Directive 2001/81/EC. Available online: https://eur-lex.europa.eu (accessed on 28 April 2019).
  10. National Environmental Protection Program until 2020 (with a prospect until 2030). Available online: https://www.gov.pl/web/srodowisko (accessed on 28 April 2019).
  11. Pisoni, E.; Christidis, P.; Thunis, P.; Trombetti, M. Evaluating the impact of “Sustainable Urban Mobility Plans” on urban background air quality. J. Environ. Manag. 2019, 231, 249–255. [Google Scholar] [CrossRef]
  12. Santos, F.M.; Gómez-Losada, A.; Pires, J.C.M. Impact of the implementation of Lisbon low emission zone on air quality. J. Hazard. Mater. 2019, 365, 632–641. [Google Scholar] [CrossRef]
  13. Kupczyk, A.; Mączyńska, J.; Redlarski, G.; Tucki, K.; Bączyk, A.; Rutkowski, D. Selected Aspects of Biofuels Market and the Electromobility Development in Poland: Current Trends and Forecasting Changes. Appl. Sci. 2019, 9, 254. [Google Scholar] [CrossRef]
  14. Mączyńska, J.; Krzywonos, M.; Kupczyk, A.; Tucki, K.; Sikora, M.; Pińkowska, H.; Bączyk, A.; Wielewska, I. Production and use of biofuels for transport in Poland and Brazil—The case of bioethanol. Fuel 2019, 241, 989–996. [Google Scholar] [CrossRef]
  15. Wang, T.; Lin, B. Fuel consumption in road transport: A comparative study of China and OECD countries. J. Clean. Prod. 2019, 206, 156–170. [Google Scholar] [CrossRef]
  16. Mattioli, G.; Lucas, K.; Marsden, G. Reprint of Transport poverty and fuel poverty in the UK: From analogy to comparison. Transp. Policy 2018, 65, 114–125. [Google Scholar] [CrossRef]
  17. Rietmann, N.; Lieven, T. How policy measures succeeded to promote electric mobility—Worldwide review and outlook. J. Clean. Prod. 2019, 206, 66–75. [Google Scholar] [CrossRef]
  18. Fernández-Dacosta, C.; Shen, L.; Schakel, W.; Ramirez, A.; Kramer, G.J. Potential and challenges of low-carbon energy options: Comparative assessment of alternative fuels for the transport sector. Appl. Energy 2019, 236, 590–606. [Google Scholar] [CrossRef]
  19. Clean Transport, Urban Transport. Alternative Fuels for Sustainable Mobility in Europe. Available online: https://ec.europa.eu/transport/themes/urban/cpt_en (accessed on 28 April 2019).
  20. Hosseinzadeh-Bandbafha, H.; Tabatabaei, M.; Aghbashlo, M.; Khanali, M.; Demirbas, A. A comprehensive review on the environmental impacts of diesel/biodiesel additives. Energy Convers. Manag. 2018, 174, 579–614. [Google Scholar] [CrossRef]
  21. Samson, I.; Sikora, M.; Bączyk, A.; Mączyńska, J.; Tucki, K. Technologies used to enhance the biogas and biomethane yield: A review. Przemysł Chem. 2017, 96, 1605–1611. [Google Scholar]
  22. Arnold, M.; Tainter, J.A.; Strumsky, D. Productivity of innovation in biofuel technologies. Energy Policy 2019, 124, 54–62. [Google Scholar] [CrossRef]
  23. Mustapha, W.F.; Kirkerud, J.G.; Bolkesjø, T.F.; Trømborg, E. Large-scale forest-based biofuels production: Impacts on the Nordic energy sector. Energy Convers. Manag. 2019, 187, 93–102. [Google Scholar] [CrossRef]
  24. Leong, W.H.; Lim, J.W.; Lam, M.K.; Uemura, Y.; Ho, Y.C. Third generation biofuels: A nutritional perspective in enhancing microbial lipid production. Renew. Sustain. Energy Rev. 2018, 91, 950–961. [Google Scholar] [CrossRef]
  25. Krzywonos, M.; Tucki, K.; Wojdalski, J.; Kupczyk, A.; Sikora, M. Analysis of Properties of Synthetic Hydrocarbons Produced Using the ETG Method and Selected Conventional Biofuels Made in Poland in the Context of Environmental Effects Achieved. Rocz. Ochr. Śr. 2017, 19, 394–410. [Google Scholar]
  26. Sharma, N.; Patel, C.; Tiwari, N.; Agarwal, A.K. Experimental investigations of noise and vibration characteristics of gasoline-methanol blend fuelled gasoline direct injection engine and their relationship with combustion characteristics. Appl. Therm. Eng. 2019, 158, 113754. [Google Scholar] [CrossRef]
  27. Küüt, A.; Ilves, R.; Küüt, K.; Raide, V.; Ritslaid, K.; Olt, J. Influence of European Union Directives on the Use of Liquid Biofuel in the Transport Sector. Procedia Eng. 2017, 187, 30–39. [Google Scholar] [CrossRef]
  28. Ballesteros, M.; Manzanares, P. Chapter Three—Liquid Biofuels. In The Role of Bioenergy in the Bioeconomy, 1st ed.; Lago, C., Caldés, N., Lechón, Y., Eds.; Academic Press: Waltham, MA, USA, 2019; pp. 113–144. [Google Scholar]
  29. Alptekin, E.; Sanli, H.; Canakci, M. Combustion and performance evaluation of a common rail DI diesel engine fueled with ethyl and methyl esters. Appl. Therm. Eng. 2019, 149, 180–191. [Google Scholar] [CrossRef]
  30. Alalwan, H.A.; Alminshid, A.H.; Aljaafari, H.A.S. Promising evolution of biofuel generations. Subject review. Renew. Energy Focus 2019, 28, 127–139. [Google Scholar] [CrossRef]
  31. Krzywonos, M.; Skudlarski, J.; Kupczyk, A.; Wojdalski, J.; Tucki, K. Forecast for transport biofuels in Poland in 2020–2030. Przemysł Chem. 2015, 94, 2218–2222. [Google Scholar]
  32. Saladini, F.; Patrizi, N.; Pulselli, F.M.; Marchettini, N.; Bastianoni, S. Guidelines for emergy evaluation of first, second and third generation biofuels. Renew. Sustain. Energy Rev. 2016, 66, 221–227. [Google Scholar] [CrossRef]
  33. Abdullah, B.; Muhammad, S.A.F.S.; Shokravi, Z.; Ismail, S.; Kassim, K.A.; Mahmood, A.N.; Aziz, M.A.M. Fourth generation biofuel: A review on risks and mitigation strategies. Renew. Sustain. Energy Rev. 2019, 107, 37–50. [Google Scholar] [CrossRef]
  34. Viccaro, M.; Cozzi, M.; Rocchi, B.; Romano, S. Conservation agriculture to promote inland biofuel production in Italy: An economic assessment of rapeseed straight vegetable oil as a self-supply agricultural biofuel. J. Clean. Prod. 2019, 217, 153–161. [Google Scholar] [CrossRef]
  35. Merkisz, J.; Kozak, M. Influence of the blend composition of the biofuel and the conventional fuel on exhaust emissions. Eksploat. I Niezawodn. Maint. Reliab. 2003, 3, 12–18. [Google Scholar]
  36. Bukrejewski, P.; Skolniak, M.; Kowalski, Ł. Comparison of the environmental effect of M1 category vehicles fed with traditional and alternative fuels. Arch. Automot. Eng. 2017, 75, 5–21. [Google Scholar]
  37. Czapliński, E.; Idzior, M. The research into the influence of the technical condition of motor vehicles in operation on exhaust pollutant emissions. Combust. Engines 2015, 54, 578–581. [Google Scholar]
  38. Zhu, G.; Liu, J.; Fu, J.; Xu, Z.; Guo, Q.; Zhao, H. Experimental study on combustion and emission characteristics of turbocharged gasoline direct injection (GDI) engine under cold start new European driving cycle (NEDC). Fuel 2018, 215, 272–284. [Google Scholar] [CrossRef]
  39. Flekiewicz, M.; Kubica, G. The use of gaseous fuels mixtures for SI engines propulsion. IOP Conf. Ser. Mater. Sci. Eng. 2016, 148, 1–11. [Google Scholar] [CrossRef]
  40. Jęczmionek, Ł.; Porzycka-Semczuk, K. Triglyceride zeoforming—A method for improving the low-temperature properties of second generation bio-components obtained from natural oils. Fuel 2013, 113, 17–23. [Google Scholar]
  41. Azadi, P.; Malina, R.; Barrett, S.R.H.; Kraft, M. The evolution of the biofuel science. Renew. Sustain. Energy Rev. 2017, 76, 1479–1484. [Google Scholar] [CrossRef]
  42. Tucki, K.; Mruk, R.; Orynycz, O.; Wasiak, A.; Botwińska, K.; Gola, A. Simulation of the Operation of a Spark Ignition Engine Fueled with Various Biofuels and Its Contribution to Technology Management. Sustainability 2019, 11, 2799. [Google Scholar] [CrossRef]
  43. Guo, H.; Cao, D.; Chen, H.; Sun, Z.; Hu, Y. Model predictive path following control for autonomous cars considering a measurable disturbance: Implementation, testing, and verification. Mech. Syst. Signal Process. 2019, 118, 41–60. [Google Scholar] [CrossRef]
  44. Su, G.; Li, N.; Yildiz, Y.; Girard, A.; Kolmanovsky, I. A Traffic Simulation Model with Interactive Drivers and High-fidelity Car Dynamics. IFAC Pap. Line 2019, 51, 384–389. [Google Scholar] [CrossRef]
  45. Martynov, S.B.; Mason, D.J.; Heikal, M.R. Numerical Simulation of Cavitation Flows Based on Their Hydrodynamic Similarity. Int. J. Engine Res. 2006, 7, 283–296. [Google Scholar] [CrossRef] [Green Version]
  46. The Use of Crude Rapeseed Oil as a Fuel for Diesel Engines; Report on the implementation of the development Project No. R1003703; Faculty of Production Engineering, Warsaw University of Life Sciences: Warsaw, Poland, 2011.
Figure 1. General scheme of the fuel injection research system.
Sustainability 11 03451 g001
Figure 2. Effect of temperature, O100%: pk = 0.5 MPa, pCR = 65 MPa, λ= 1.25. (O—Diesel Oil).
Sustainability 11 03451 g002
Figure 3. Influence of temperature, R100%: pk = 0.5 MPa, pCR = 65 MPa, λ= 1.25. (R—Rapeseed Oil).
Sustainability 11 03451 g003
Figure 4. Effect of temperature, R85%, O15%: pk = 0.5 MPa, pCR = 65 MPa, λ= 1.25. (R—Rapeseed Oil), (O—Diesel Oil).
Sustainability 11 03451 g004
Figure 5. Effect of temperature, R70%, O30%: pk = 0.5 MPa, pCR = 65 MPa, λ = 1.25. (R—Rapeseed Oil), (O—Diesel Oil).
Sustainability 11 03451 g005
Figure 6. Effect of temperature, R50%, O50%: pk = 0.5 MPa, pCR = 65 MPa, λ = 1.25. (R—Rapeseed Oil), (O—Diesel Oil).
Sustainability 11 03451 g006
Figure 7. Effect of temperature, R30%, O30%: pk = 0.5 MPa, pCR = 65 MPa, λ = 1.25. (R—Rapeseed Oil), (O—Diesel Oil).
Sustainability 11 03451 g007
Figure 8. Fuel effect [O]: T = 500 °C, pk = 0.5 MPa, pCR = 65 MPa, λ = 1.25. (R—Rapeseed Oil), (O—Diesel Oil).
Sustainability 11 03451 g008
Figure 9. Fuel effect [O]: T = 425 °C, pk = 0.5 MPa, pCR = 65 MPa, λ = 1.25. (R—Rapeseed Oil), (O—Diesel Oil).
Sustainability 11 03451 g009
Figure 10. Fuel effect [O]: T = 500 °C, pk = 0.5 MPa, pCR = 100 MPa, λ = 1.25. (R—Rapeseed Oil), (O—Diesel Oil).
Sustainability 11 03451 g010
Figure 11. Fuel effect [O]: T = 425 °C, pk = 0.5 MPa, pCR = 100 MPa, λ = 1.25. (R—Rapeseed Oil), (O—Diesel Oil).
Sustainability 11 03451 g011
Figure 12. Normalized value of pressure increases in the chamber as a function of diesel oil (O) content for various test parameters. Description of the sample: first number—temperature [°C], second number—initial pressure ×10−1 [MPa], third number—injection pressure [MPa], fourth number—excess air factor ×10−3.
Sustainability 11 03451 g012
Table 1. Symbols used in calculations.
SymbolDescription
p pressure
V volume
m gas mass
R gas constant
T temperature
t i i-th instant of time
p ( t i ) pressure in the chamber at the i-th instant of time
t i 1 i-1 instant of time
p ( t i 1 ) pressure in the chamber in i-1 instant of time
t i + 1 i + 1 instant of time
p ( t i + 1 ) chamber pressure in i + 1 instant of time
p n pressure in the chamber at the i-th instant of time after smoothing
[ O 2 ] mass fraction of oxygen
[ N 2 ] mass fraction of nitrogen
[ C O 2 ] mass fraction of carbon dioxide
[ H 2 O ] mass fraction of water vapor
C p specific heat at constant pressure of the gas mixture in the chamber
C v specific heat at a constant volume of the gas mixture in the chamber
[ C p o 2 ] mass heat at constant oxygen pressure
[ C p N 2 ] mass heat at constant nitrogen pressure
[ C p C O 2 ] specific heat at constant carbon dioxide pressure
[ C p H 2 O ] specific heat at constant water vapor pressure
R 1 individual gas constant
a 1 , a 2 , a 3 , a 4 , a 5 coefficients, individual for each gas
m p mass of burnt fuel or mass of injected fuel
d Q emitted heat
C s the heat of burning fuel
[ O 2 ] i 1 mass fraction of oxygen at the instant i-1
[ N 2 ] i 1 mass fraction of nitrogen at the instant i-1
[ C O 2 ] i 1 mass fraction of carbon dioxide at the instant i-1
[ H 2 O ] i 1 mass fraction of water vapor at the instant i-1
[ O 2 ] i mass fraction of oxygen at the i-th instant of time
[ N 2 ] i mass fraction of nitrogen at the i-th instant of time
[ C O 2 ] i mass fraction of carbon dioxide at the i-th instant of time
[ H 2 O ] i mass fraction of water vapor at the i-th instant of time
x H mass share of hydrogen in the fuel
x C mass fraction of carbon in fuel
x O mass fraction of oxygen in fuel
m i 1 mass of gas at i-1 instant of time
m i the mass of gas at the instant i
m r mass fraction of rapeseed oil in fuel
m d mass fraction of diesel oil in fuel
p k m a x maximum pressure in the chamber
V k chamber volume
W u calorific value of fuel
Table 2. The composition of the fuel mixture.
MixtureDiesel Oil [% m/m]Rapeseed Oil [% m/m]
Case 1100-
Case 2-100
Case 31585
Case 43070
Case 55050
Case 67030
Table 3. Properties of the fuels investigated.
FuelDiesel OilMethyl Esters of Rapeseed OilRapeseed Oil
Calorific value [MJ/kg]42.538.037.5
Mass fraction of hydrogen [%]12.612.111.4
Mass fraction of carbon [%]87.477.577.4
Mass fraction of oxygen [%]-10.411.2

