The Collapse of Venezuela vs. The Sustainable Development of Selected South American Countries


Abstract
:1. Introduction
2. Literature Review
Theoretical-Conceptual Approaches
3. Methodology
3.1. Data Envelopment Analysis Model
3.2. DEA Model only with Outputs
4. Results
5. Discussion
6. Conclusions
Author Contributions
Funding
Conflicts of Interest
References
- Kuhlmann, S.; Rip, A. Next-Generation innovation policy and grand challenges. Sci. Public Policy 2018, 45, 448–454. [Google Scholar] [CrossRef]
- van Oost, E.; Kuhlmann, S.; Ordóñez-Matamoros, G.; Stegmaier, P. Futures of science with and for society: Towards transformative policy orientations. Foresight 2016, 18, 276–296. [Google Scholar] [CrossRef]
- De la Vega, I. Estudio longitudinal de sistemas tecnocientíficos. Comparativa entre venezuela y tres países de América del sur. Revista Venezolana de Análisis de Coyuntura 2017, 23, 123–150. [Google Scholar]
- De la Vega, I. Tráfico pesado de venezolanos cualificados hacía múltiples destinos. In Diáspora del Talento. Migración y Educación en Venezuela: Análisis y Propuestas; Peralta, R., Lares, C., Kerdel-Vegas, F., Eds.; Talven-Fundacelac: Valencia, Venezuela, 2014; pp. 57–88. ISBN 978-980-12-7676-0. [Google Scholar]
- Audretsch, D.B.; Seitz, N.; Rouch, K.M. Tolerance and innovation: The role of institutional and social trust. Eurasian Bus. Rev. 2018, 18, 71–92. [Google Scholar] [CrossRef]
- Beugelsdijk, S.; Van Schaik, T. Social capital and growth in European regions: An empirical test. Eur. J. Political Econ. 2005, 21, 301–324. [Google Scholar] [CrossRef]
- Lehmann, E.E.; Seitz, N. Freedom and innovation: A country and state level analysis. J. Technol. Transf. 2017, 42, 1009–1029. [Google Scholar] [CrossRef]
- De la Vega, I. Mundos en Movimiento. El Caso de la Movilidad y Migración de los Científicos y Tecnólogos Venezolanos; Fundación Polar: Caracas, Venezuela, 2005. [Google Scholar]
- De la Vega, I.; Requena, J.; Rodríguez, L.G.; Ruiz, N.; Liendo, P. Estudio bibliométrico en el área de la salud y calidad de vida en Venezuela: El caso de la Universidad Central de Venezuela (UCV). Período 1981–2007. Argos 2010, 27, 38–58. [Google Scholar]
- De la Vega, I. El uso de la cienciometría en la construcción de las políticas tecnocientíficas en América Latina: Una relación incierta. Redes 2009, 15, 217–240. [Google Scholar]
- OECD Chile. OECD Science, Technology and Innovation Outlook 2016; OECD Publishing: Paris, France, 2016. [Google Scholar] [CrossRef]
- World Commission on Environment and Development (WCED). Our Common Future; Oxford University Press: New York, NY, USA, 1987; ISBN 978-0-19-282080-8. [Google Scholar]
- Zemigala, M. Tendencies in research on sustainable development in management sciences. J. Clean. Prod. 2019, 218, 796–809. [Google Scholar] [CrossRef]
- Findler, F.; Schönherr, N.; Lozano, R.; Reider, D.; Martinuzzi, A. The impacts of higher education institutions on sustainable development: A review and conceptualization. Int. J. Sustain. High. Educ. 2019, 20, 23–38. [Google Scholar] [CrossRef]
- Bush, V. Science the Endless Frontier: A Report to the President by Vannevar Bush; US Government Printing Office: Washington, DC, USA, 1945.
- Sábato, J.; Botana, N. La ciencia y la tecnología en el desarrollo futuro de América Latina. Revista de la Integración 1968, 1, 15–36. [Google Scholar]
- Freeman, C. Technology, Policy, and Economic Performance: Lessons from Japan; Pinter Publishers: London, UK, 1987; ISBN 978-0-86187-928-1. [Google Scholar]
- Callon, M.; Laredo, P.; Mustar, P. Panorama de la science française. Recherche 1994, 25, 378–383. [Google Scholar]
- Gibbons, M.; Limoges, C.; Nowotny, H.; Schwartzman, S.; Scott, P.; Trow, M. The New Production of Knowledge: The Dynamics of Science and Research in Contemporary Societies; Sage: London, UK, 1994; ISBN 0-8039-7794-8. [Google Scholar]
- Leydesdorff, L.; Etzkowitz, H. The triple helix as a model for innovation studies. Sci. Public Policy 1998, 25, 195–203. [Google Scholar]
- Chesbrough, H.W. Open Innovation: The New Imperative for Creating and Profiting from Technology; Harvard Business School Press: Boston, MA, USA, 2003. [Google Scholar]
- Carayannis, E.G.; Campbell, D.F. ‘Mode 3′: Meaning and implications from a knowledge systems perspective. In Knowledge Creation, Diffusion, and Use in Innovation Networks and Knowledge Clusters. A Comparative Systems Approach across the United States, Europe and Asia; Carayannis, E.G., Campbell, D.F., Eds.; Praeger: Westport, CT, USA, 2006; pp. 1–25. [Google Scholar]
- Carayannis, E.G.; Campbell, D.F. “Mode 3′and’Quadruple Helix”: Toward a 21st century fractal innovation ecosystem. Int. J. Technol. Manag. 2009, 46, 201–204. [Google Scholar] [CrossRef]
- Carayannis, E.G.; Barth, T.D.; Campbell, D.F. The quintuple helix innovation model: Global warming as a challenge and driver for innovation. J. Innov. Entrep. 2012, 1, 2. [Google Scholar] [CrossRef]
- Albornoz, M. Los problemas de la ciencia y el poder. CTS: Revista Iberoamericana de Ciencia, Tecnología y Sociedad 2007, 3, 47–65. [Google Scholar]
- Arocena, R.; Sutz, J. Latin American universities: From an original revolution to an uncertain transition. High. Educ. 2005, 50, 573–592. [Google Scholar] [CrossRef]
- Lundvall, B.A. Innovation as an Interactive Process: From User-Producer Interaction to the National Innovation Systems; Pinter Publishers: London, UK, 1988. [Google Scholar]
- Lundvall, B.A. Introduction. In National Systems of Innovation: Toward a Theory of Innovation and Interactive Learning; Lundvall, B.A., Ed.; Pinter Publishers: London, UK, 1992; pp. 1–19. ISBN 1-85567-063-1. [Google Scholar]
- Dosi, G.; Freeman, C.; Nelson, R.; Silverberg, G.; Soete, L. (Eds.) Technical Change and Economic Theory, 1st ed.; IFIAS research series; Pinter Publishers: London, UK, 1988; ISBN 978-0-86187-949-6. [Google Scholar]
- Edquist, C. Systems of innovation approaches—Their emergence and characteristics. In Systems of Innovation: Technologies, Institutions and Organisations; Edquist, C., Ed.; Pinter Publishers: London, UK, 1997; pp. 1–35. ISBN 978-1-136-60059-3. [Google Scholar]
- Nelson, R.R. National innovation systems: A comparative analysis. A Retrospective. In National Innovation Systems: A Comparative Analysis; Nelson, R., Ed.; Oxford University Press Inc.: Oxford, UK, 1993; pp. 505–524. ISBN 13: 978-0195076172. [Google Scholar]
- Amable, B.; Petit, P.A. The Diversity of Social Systems of Innovation and Production During the 1990s N 2001-15; Cepremap: Paris, France, 2001. [Google Scholar]
- Whitley, R. The social construction of economic actors: Institutions and types of firms in Europe and other market economies. In The Changing European Firm: Limits to Convergence; Whitley, R., Kristensen, P.H., Eds.; Routledge: London, UK, 1996; pp. 39–66. ISBN 0-415-12999-0. [Google Scholar]
- Lundvall, B.A. National innovation systems—Analytical concept and development Tool. Ind. Innov. 2007, 14, 95–119. [Google Scholar] [CrossRef]
- Campbell, D.F.J.; Gutell, W.H. Knowledge production of firms: Research networks and the ‘scientification’ of business R&D. Int. J. Technol. Manag. 2005, 31, 152–175. [Google Scholar]
- Carayannis, E.G.; Campbell, D.F.J. Mode 3 Knowledge Production in Quadruple Helix Innovation Systems; Springer International Publishing: New York, NY, USA, 2012; ISBN 978-1-4614-2061-3. [Google Scholar]
- Leydesdorff, L.; Fritsch, M. Measuring the knowledge base of regional innovation systems in Germany in terms of a triple helix dynamics. Res. Policy 2006, 35, 1538–1553. [Google Scholar] [CrossRef]
- Etzkowitz, H.; Zhou, C. Innovation incommensurability and the science park. R D Manag. 2018, 48, 73–87. [Google Scholar] [CrossRef]
- Leydesdorff, L.; Dolfsma, W.; Van der Panne, G. Measuring the knowledge base of an economy in terms of triple-helix relations among ‘technology, organization, and territory. Res. Policy 2006, 35, 181–199. [Google Scholar] [CrossRef]
- Villareal, O.; Calvo, N. From the triple helix model to the global open innovation model: A case study based on international cooperation for innovation in Dominican Republic. J. Eng. Technol. Manag. 2015, 35, 71–92. [Google Scholar] [CrossRef]
- Boguers, M.; Chesbrough, H.; Moedas, C. Open innovation. research, practices and policies. Calif. Manag. Rev. 2018, 60, 5–16. [Google Scholar] [CrossRef]
- Carayannis, E.G.; Grigoroudis, E.; Campbell, D.F.J.; Meissner, D.; Stamati, D. The ecosystem as helix: An exploratory theory-building study of regional co-opetitive entrepreneurial ecosystems as quadruple/quintuple helix innovation models. R D Manag. 2018, 48, 148–162. [Google Scholar] [CrossRef]
- Farrell, M. The measurement of productive efficiency. J. R. Stat. Soc. Ser. A 1957, 120, 253–281. [Google Scholar] [CrossRef]
- Charnes, A.; Cooper, W.W.; Rhodes, E. Measuring the efficiency of decision making units. Eur. J. Oper. Res. 1978, 2, 429–444. [Google Scholar] [CrossRef]
- Banker, R.D.; Charnes, A.; Cooper, W.W. Some models for estimating technical and scale inefficiencies in data envelopment analysis. Manag. Sci. 1984, 30, 1078–1092. [Google Scholar] [CrossRef]
- Lovell, C.A.K.; Pastor, J.T. Radial DEA models without inputs or without outputs. Eur. J. Oper. Res. 1999, 118, 46–51. [Google Scholar] [CrossRef]
- Charles, V.; Zegarra, L. Felipe measuring regional competitiveness through data envelopment analysis: A Peruvian case. Expert Syst. Appl. 2014, 41, 537–5381. [Google Scholar] [CrossRef]
- World Bank World Bank Indicators. Available online: https://data.worldbank.org/indicator?tab=all (accessed on 27 December 2018).
- RICYT Network for Science and Technology Indicators-Ibero-American and Inter-American-(RICYT). Available online: http://www.ricyt.org/homeenglish (accessed on 21 March 2018).
- IMF International Monetary Fund (IMF). Available online: https://www.imf.org/external/datamapper/NGDP_RPCH@WEO/VEN?year=2019 (accessed on 1 April 2019).
- Encovi. Encuesta Nacional de Condiciones de Vida 2016; Encovi: Caracas, Venezuela, 2016. [Google Scholar]
- Sanchez, R.M.; Massey, D. International Migration of Talented and High Skilled Venezuelans to the United States. Available online: https://www.georgetownjournalofinternationalaffairs.org/online-edition/the-intenartional-migration-of-highly-skilled-and-educated-venezuelans-to-the-united-states (accessed on 4 April 2019).
- Sanchez, R.M.; Masey, D. Migración de talento y profesionales cualificados: El caso reciente de inmigrantes venezolanos a EEUU. In Diáspora de Talento. Migración y Educación en Venezuela: Análisis y Propuestas; Peralta, R., Lares, C., Kerdel Vegas, F., Eds.; Talven-Fundacelac: Valencia, Venezuela, 2014; pp. 31–57. [Google Scholar]

| Author(s) | Typologies | Evolution |
|---|---|---|
| Bush (1945) [15] | Linear model | Considered as the first explanatory approach to the relations between government, industry, and universities. This interpretation was considered as a linear process since it described the generation of knowledge as the progression of what scientists did in their laboratory, then it passed onto the engineers in order to look for applications, and finally, the product reached the market |
| Botana and Sábato (1968) [16] | Sábato’s Triangle | This approach allowed for understanding the importance of the interactions between the three actors (government–university industry). The basic relations between the vertices of the triangle were also defined. This model had among its objectives to present a development proposal. The authors considered the political actor as the mobilizer and generator of circuits. |
| Freeman (1987) [17] | National Innovation Systems (NIS) | The NIS definition recognizes the importance of knowledge in all its forms. It is the engine of change and plays a crucial role in the economic and social progress. Therefore, it is complex and systemic. This approach has been widely used in Latin America and has been evolving. |
| Callon (1994) [18] | Research Compass Card model | This Eurocentric view of social actors explains the characteristics and interactions of developed countries. Quality education is a key factor to understand the dynamics of the other actors. This model presents five analytical dimensions that are articulated to generate initiatives. |
| Gibbons (1994) [19] | Mode 1 and Mode 2 | The new production of knowledge is linked to new practices and different relationships. Passing from mode 1 to mode 2 implies going from the disciplinary to the interdisciplinary; from the laboratory to the context of applications; from institutional knowledge to networked knowledge and where the scientist is one more actor. |
| Leydesdorff and Etzkowitz (1998) [20] | Triple Helix | This model is a tool that applies to developed countries because it assumes that some activities are automatically related to economic growth. While this is true, the model focuses on universities but recognizes the dynamic interactions with the other actors. It even proposes the creation of new intermediary organizations that are relevant for promoting knowledge generation processes. |
| Chesbrough (2003) [21] | Open innovation | This approach was considered as a new paradigm for innovative organizations. It assumes that companies generate new dynamics of identification and use of knowledge in and out of the organizations. It promotes a logic based on continuous change and allows interacting with new agents. |
| Carayannis (2006) [22] | Mode 3 | This new mode, called hybrid, focuses on closing the gaps between innovation and civil society. It assumes that emerging technologies do not always coincide with society’s demands and needs, which limits their potential impact. It proposes as a central element to adopt new strategies to seek the development of a competitive and knowledge-based society. |
| Carayannis (2010) [23] | Quadruple Helix Innovation Model | The evolution to the fourth helix comes from the relationship between models such as Mode 2 and the triple helix. It incorporates a new ‘actor’ defined as the environmental one. It is interpreted that renewable and non-renewable natural resources must be part of a new culture that aims to take care of the planet and the decisions of each actor must have an impact in favour of this aspect. |
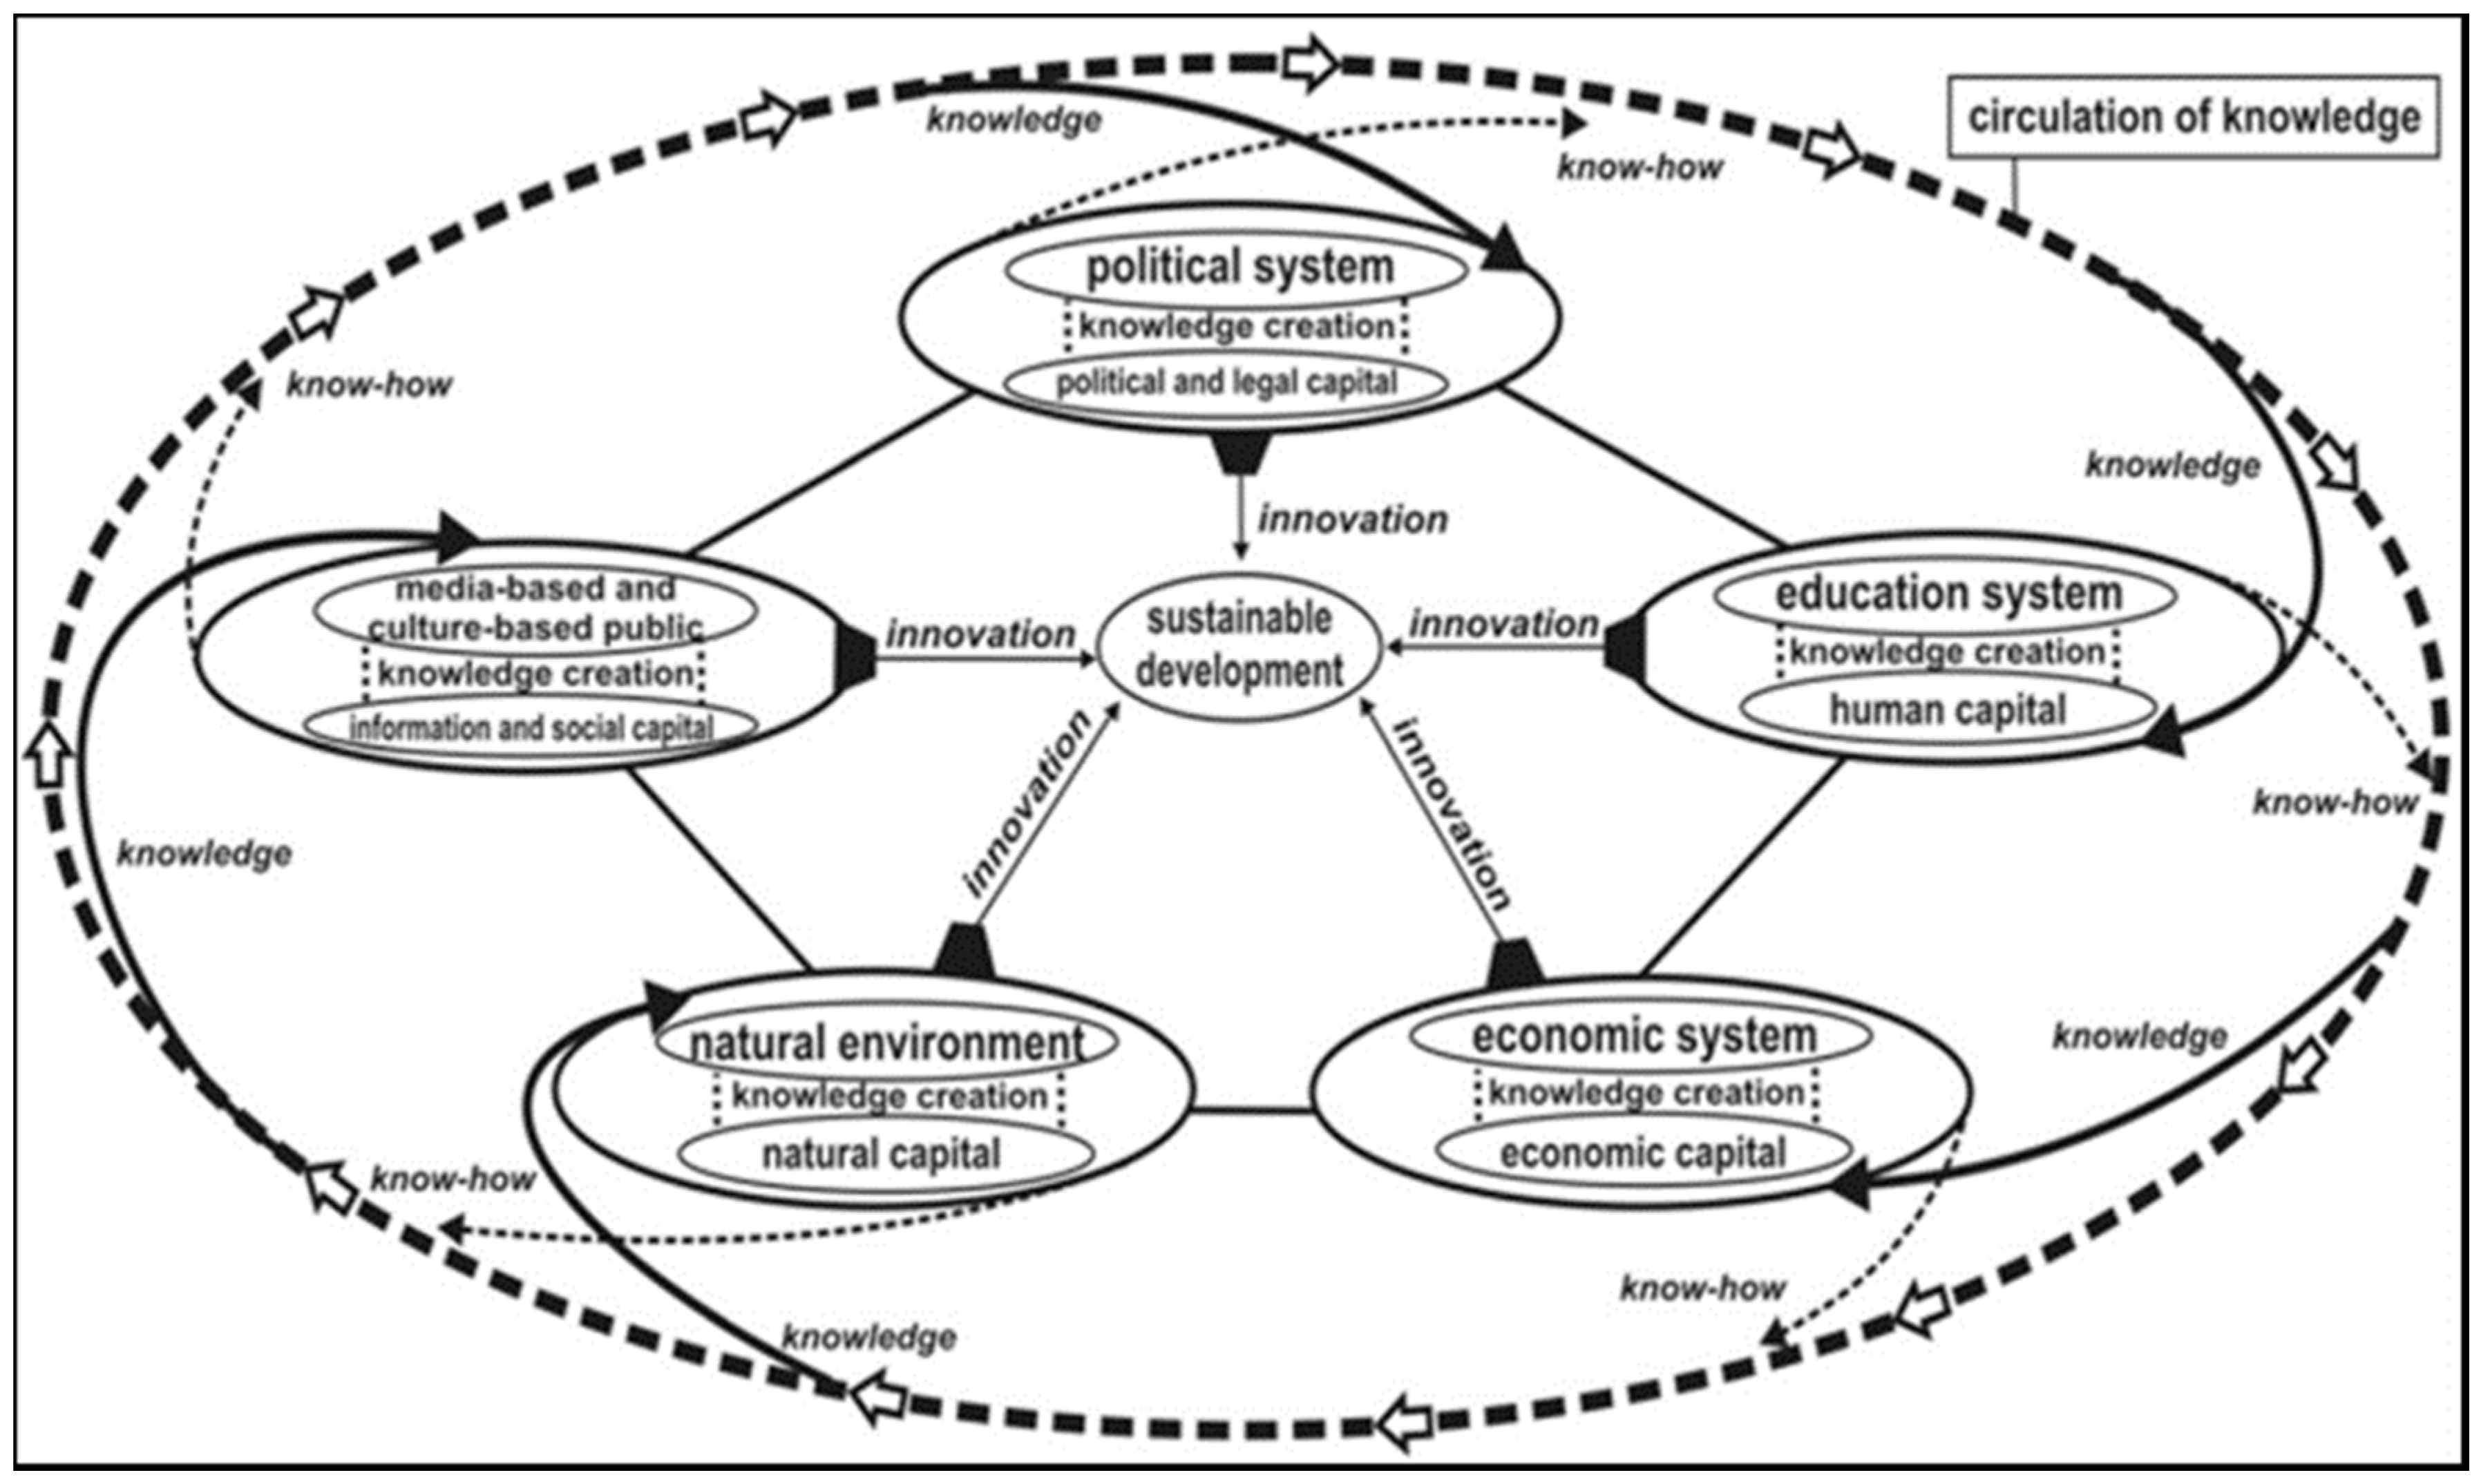
| Carayannis et al. (2012) [24] | Quintuple Helix Innovation Model | Under the same approach of the helices, a fifth is incorporated which was defined as a new subsystem of knowledge called social capital. This actor (society) must be the interlocutor and auditor of the decision-making processes. In this model, social media plays a key modelling and moderating role. It suggests that universities are the mobilizers of the main initiatives that lead to innovative proposals aimed at solving problems. |
| Helix | Definition | Indicator Selected | Relation Between Helix and Indicators |
|---|---|---|---|
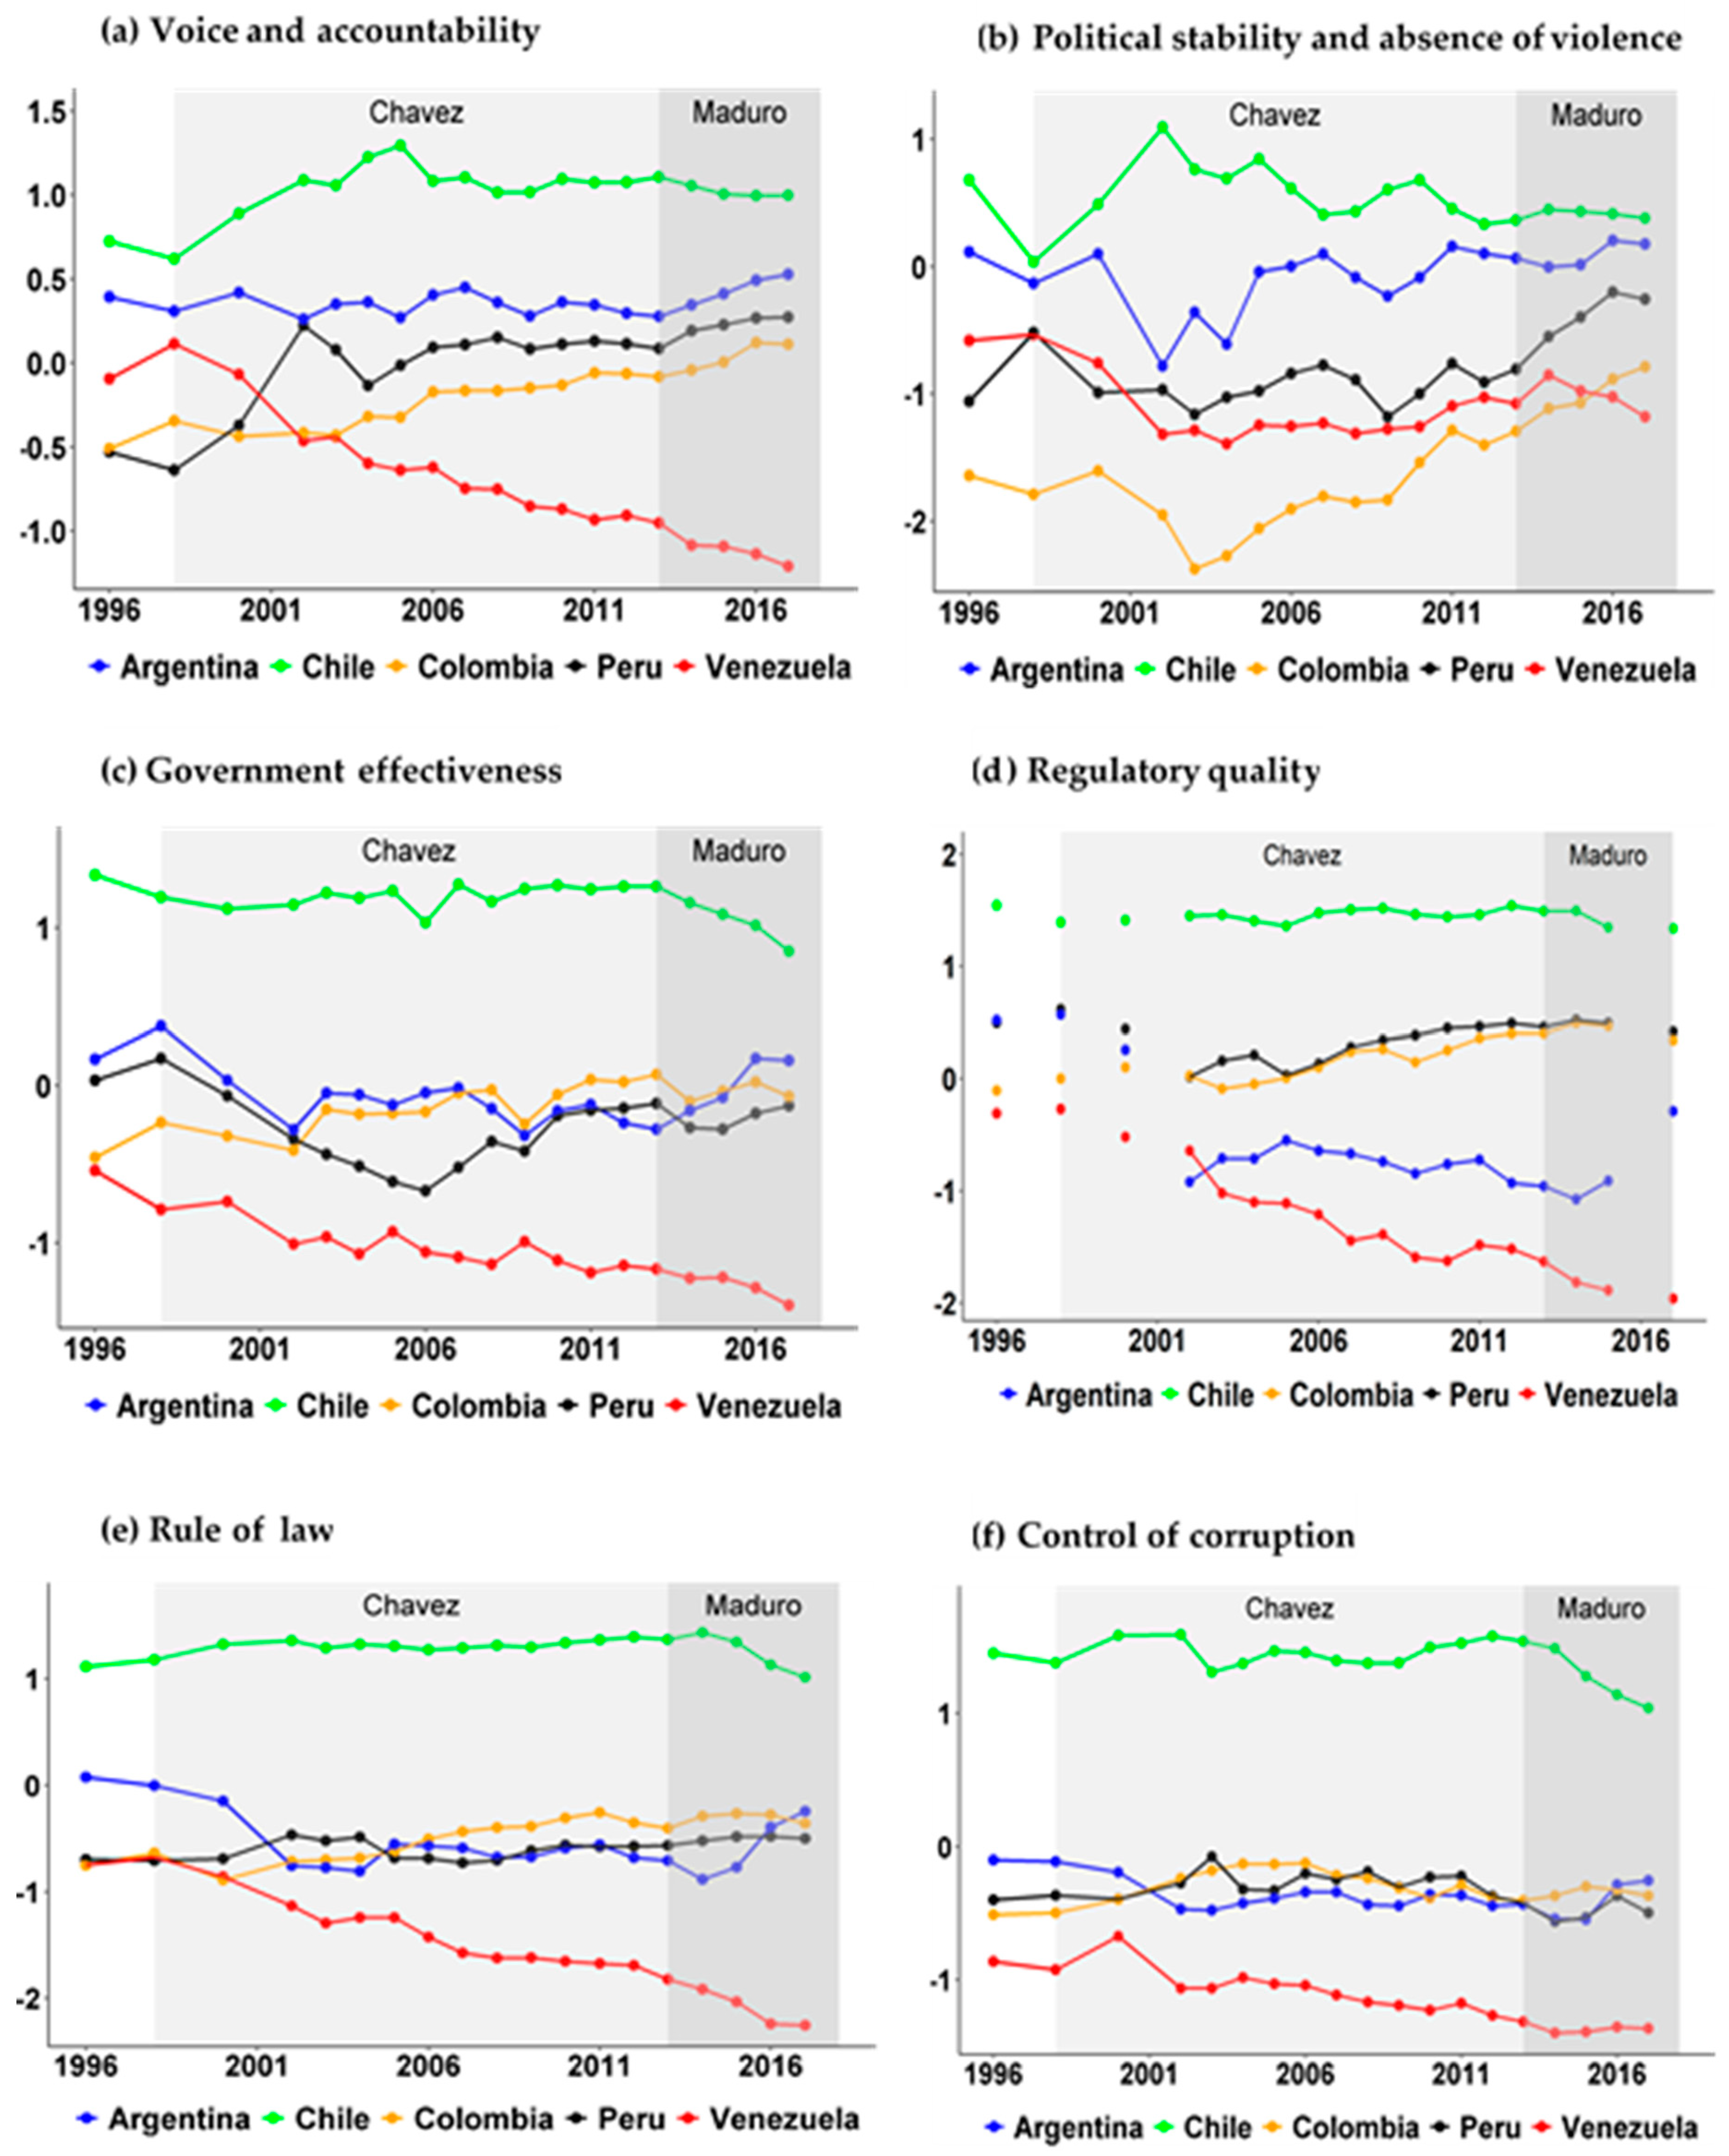
| Political System Helix | The helix related to the Political System is managed by governments. It is understood as a subsystem of knowledge with transversal impact on all the helices | 2.(a) Voice and Accountability 2.(b) Political Stability and Absence of violence 2.(c) Government Effectiveness 2.(d) Regulatory Quality 2.(e) Rule of law 2.(f) Control of Corruption | (a) It seeks to measure performance based on the series of government decisions that are taken on issues such as the control of corruption at all levels. (b) It is understood as the collection of the perceptions on the quality of public services and on the quality of the public function. Another measurement has to do with political stability and the absence of violence, including terrorism. (d) It is understood as the capture of the perceptions about the capability of the government to formulate and apply sound policies and regulations. (e) It is understood as the set of perceptions about whether the agents trust the rules of society and abide by them. (f) It is understood as the perceptions of the extent to which citizens of a country can participate in the selection of their government, as well as freedom of expression, freedom of association, and free media. |
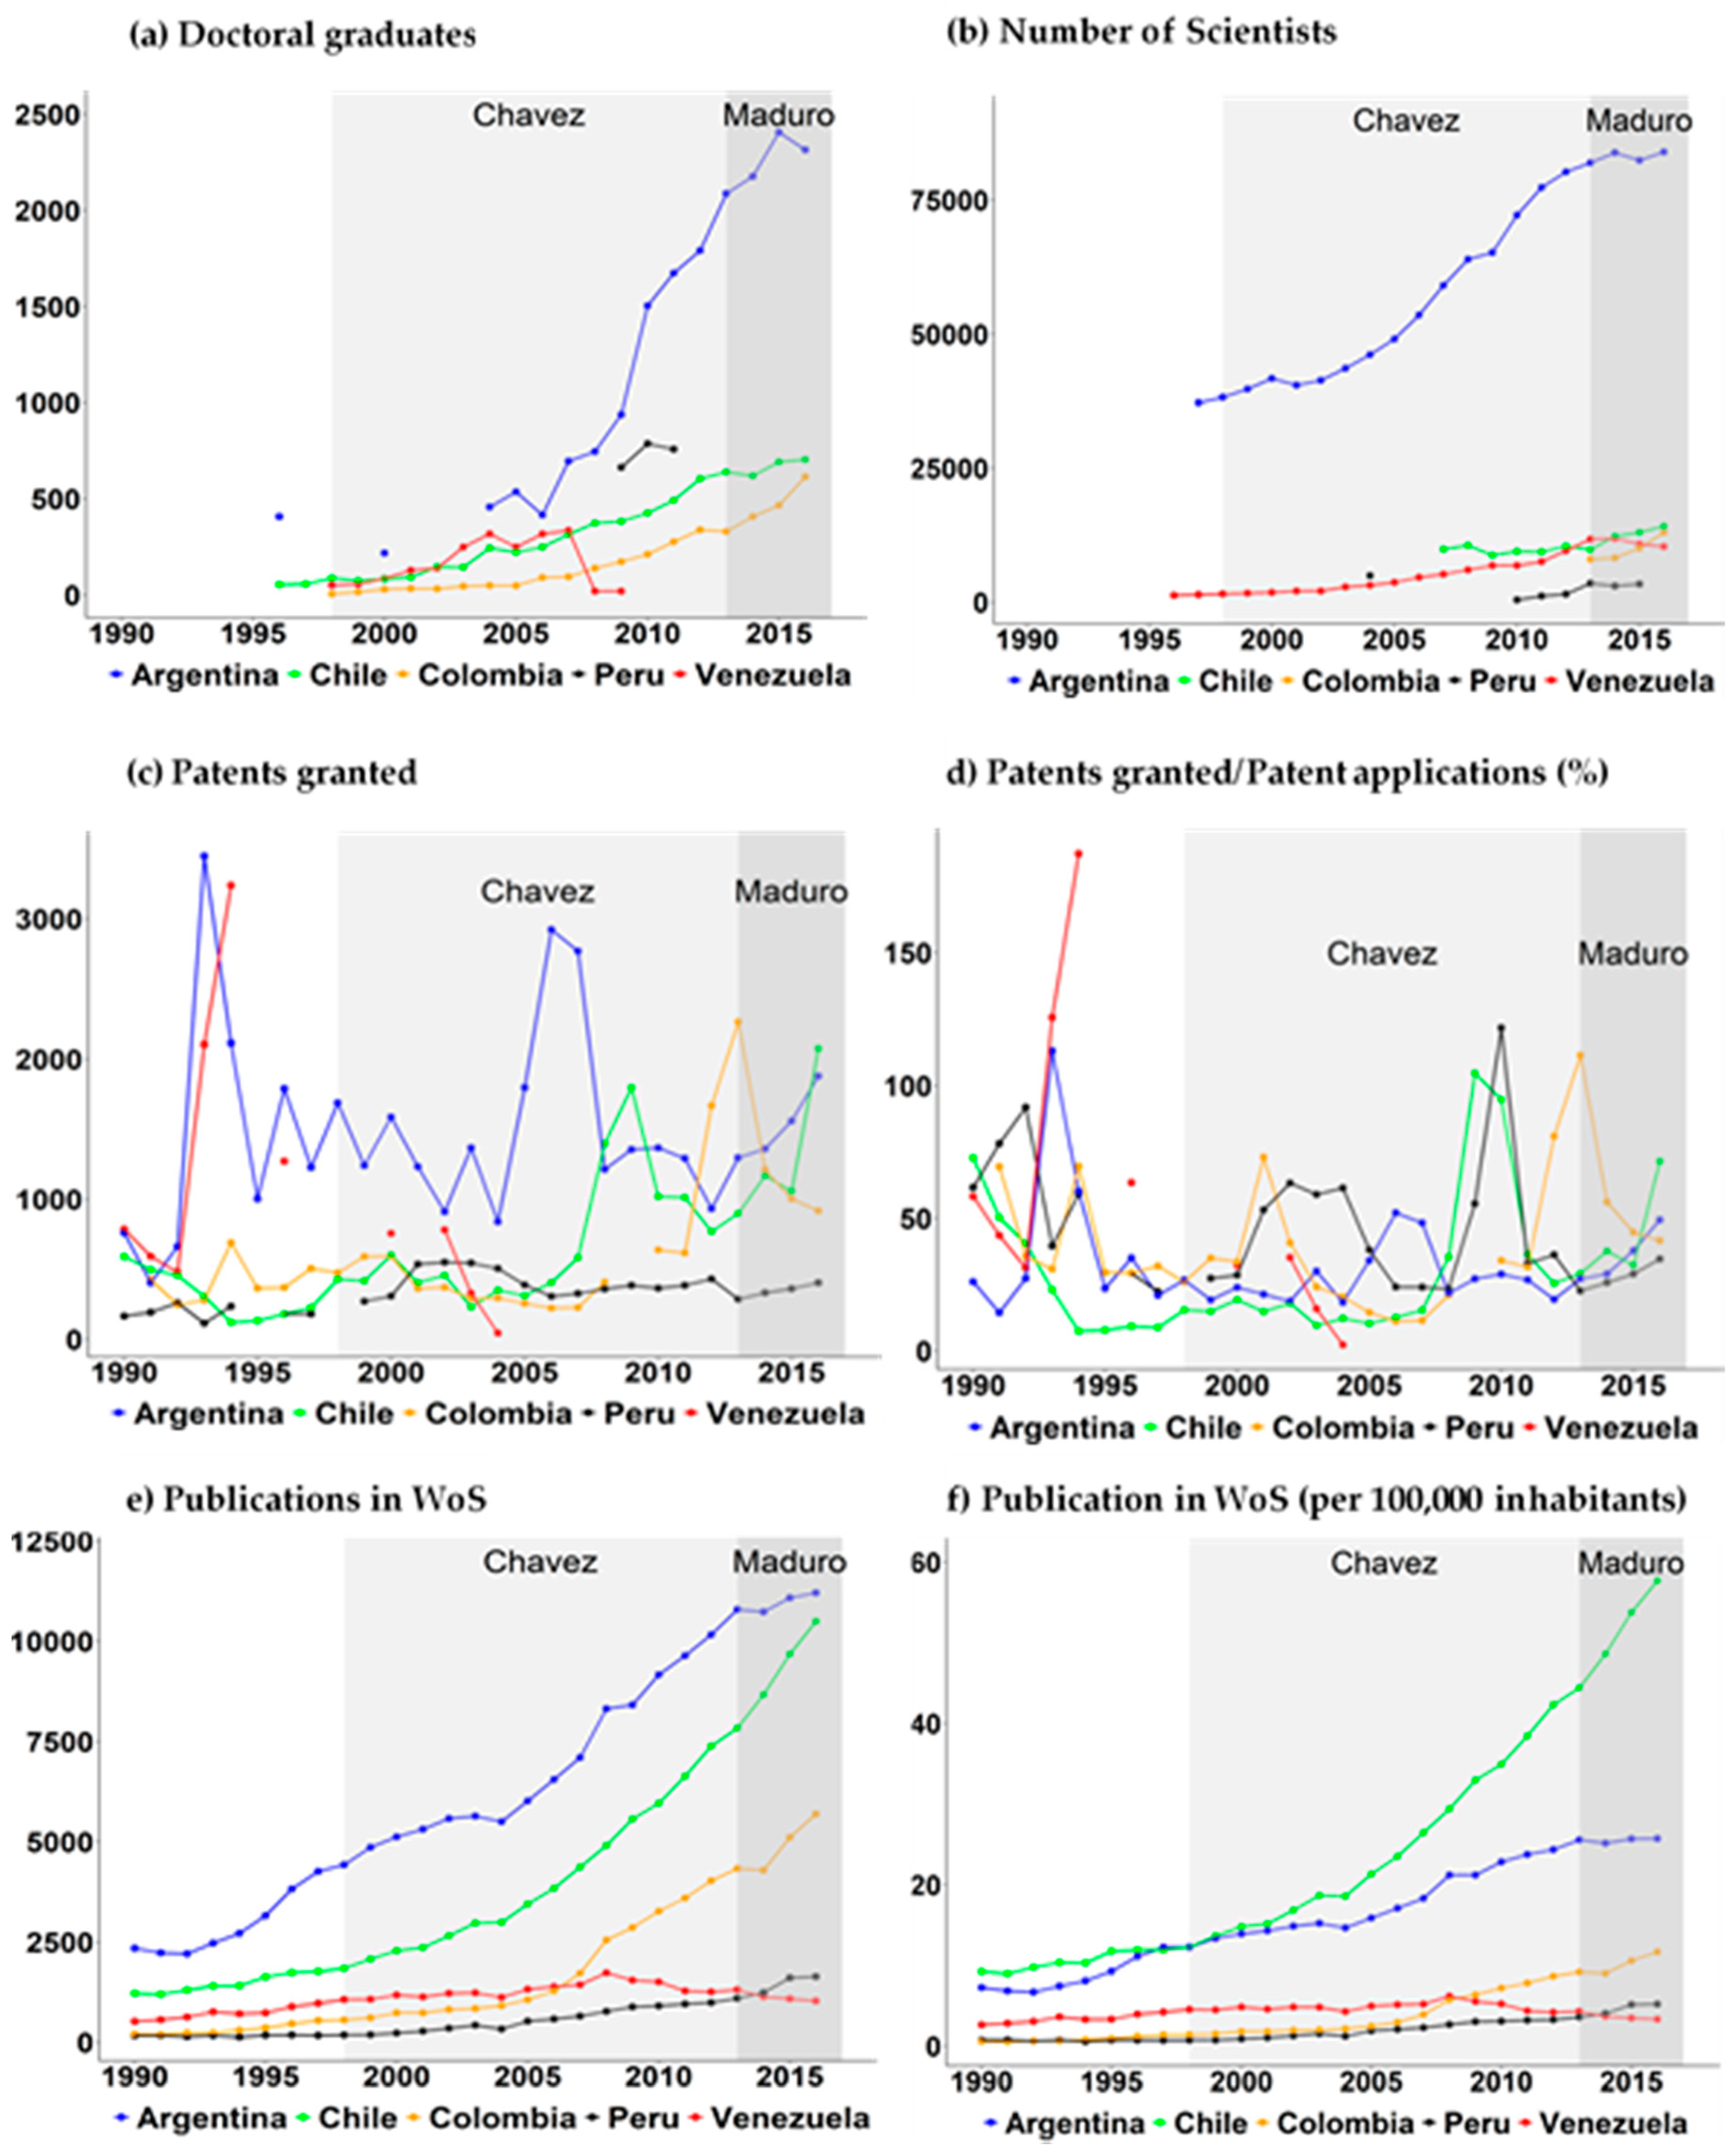
| Education System Helix | The helix defined as the Education System is linked to science and technology activities. It is conceptualized as a subsystem of knowledge based on training and research that also has a transversal impact on all the helices. | 3.(a) Doctoral Graduates 3.(b) Number of Scientists 3.(c) Patent Granted 3.(d) Ratio (%) Patents granted/Patent applications 3.(e) Publications in WoS 3.(f) Publications in WoS (per 1,000,000 inhabitants) | To measure it, the following indicators are used: indicators linked to doctoral-level training and size of the scientific community, and output indicators related to the scientific articles published in the Web of Science (WoS) and the granted patents. |
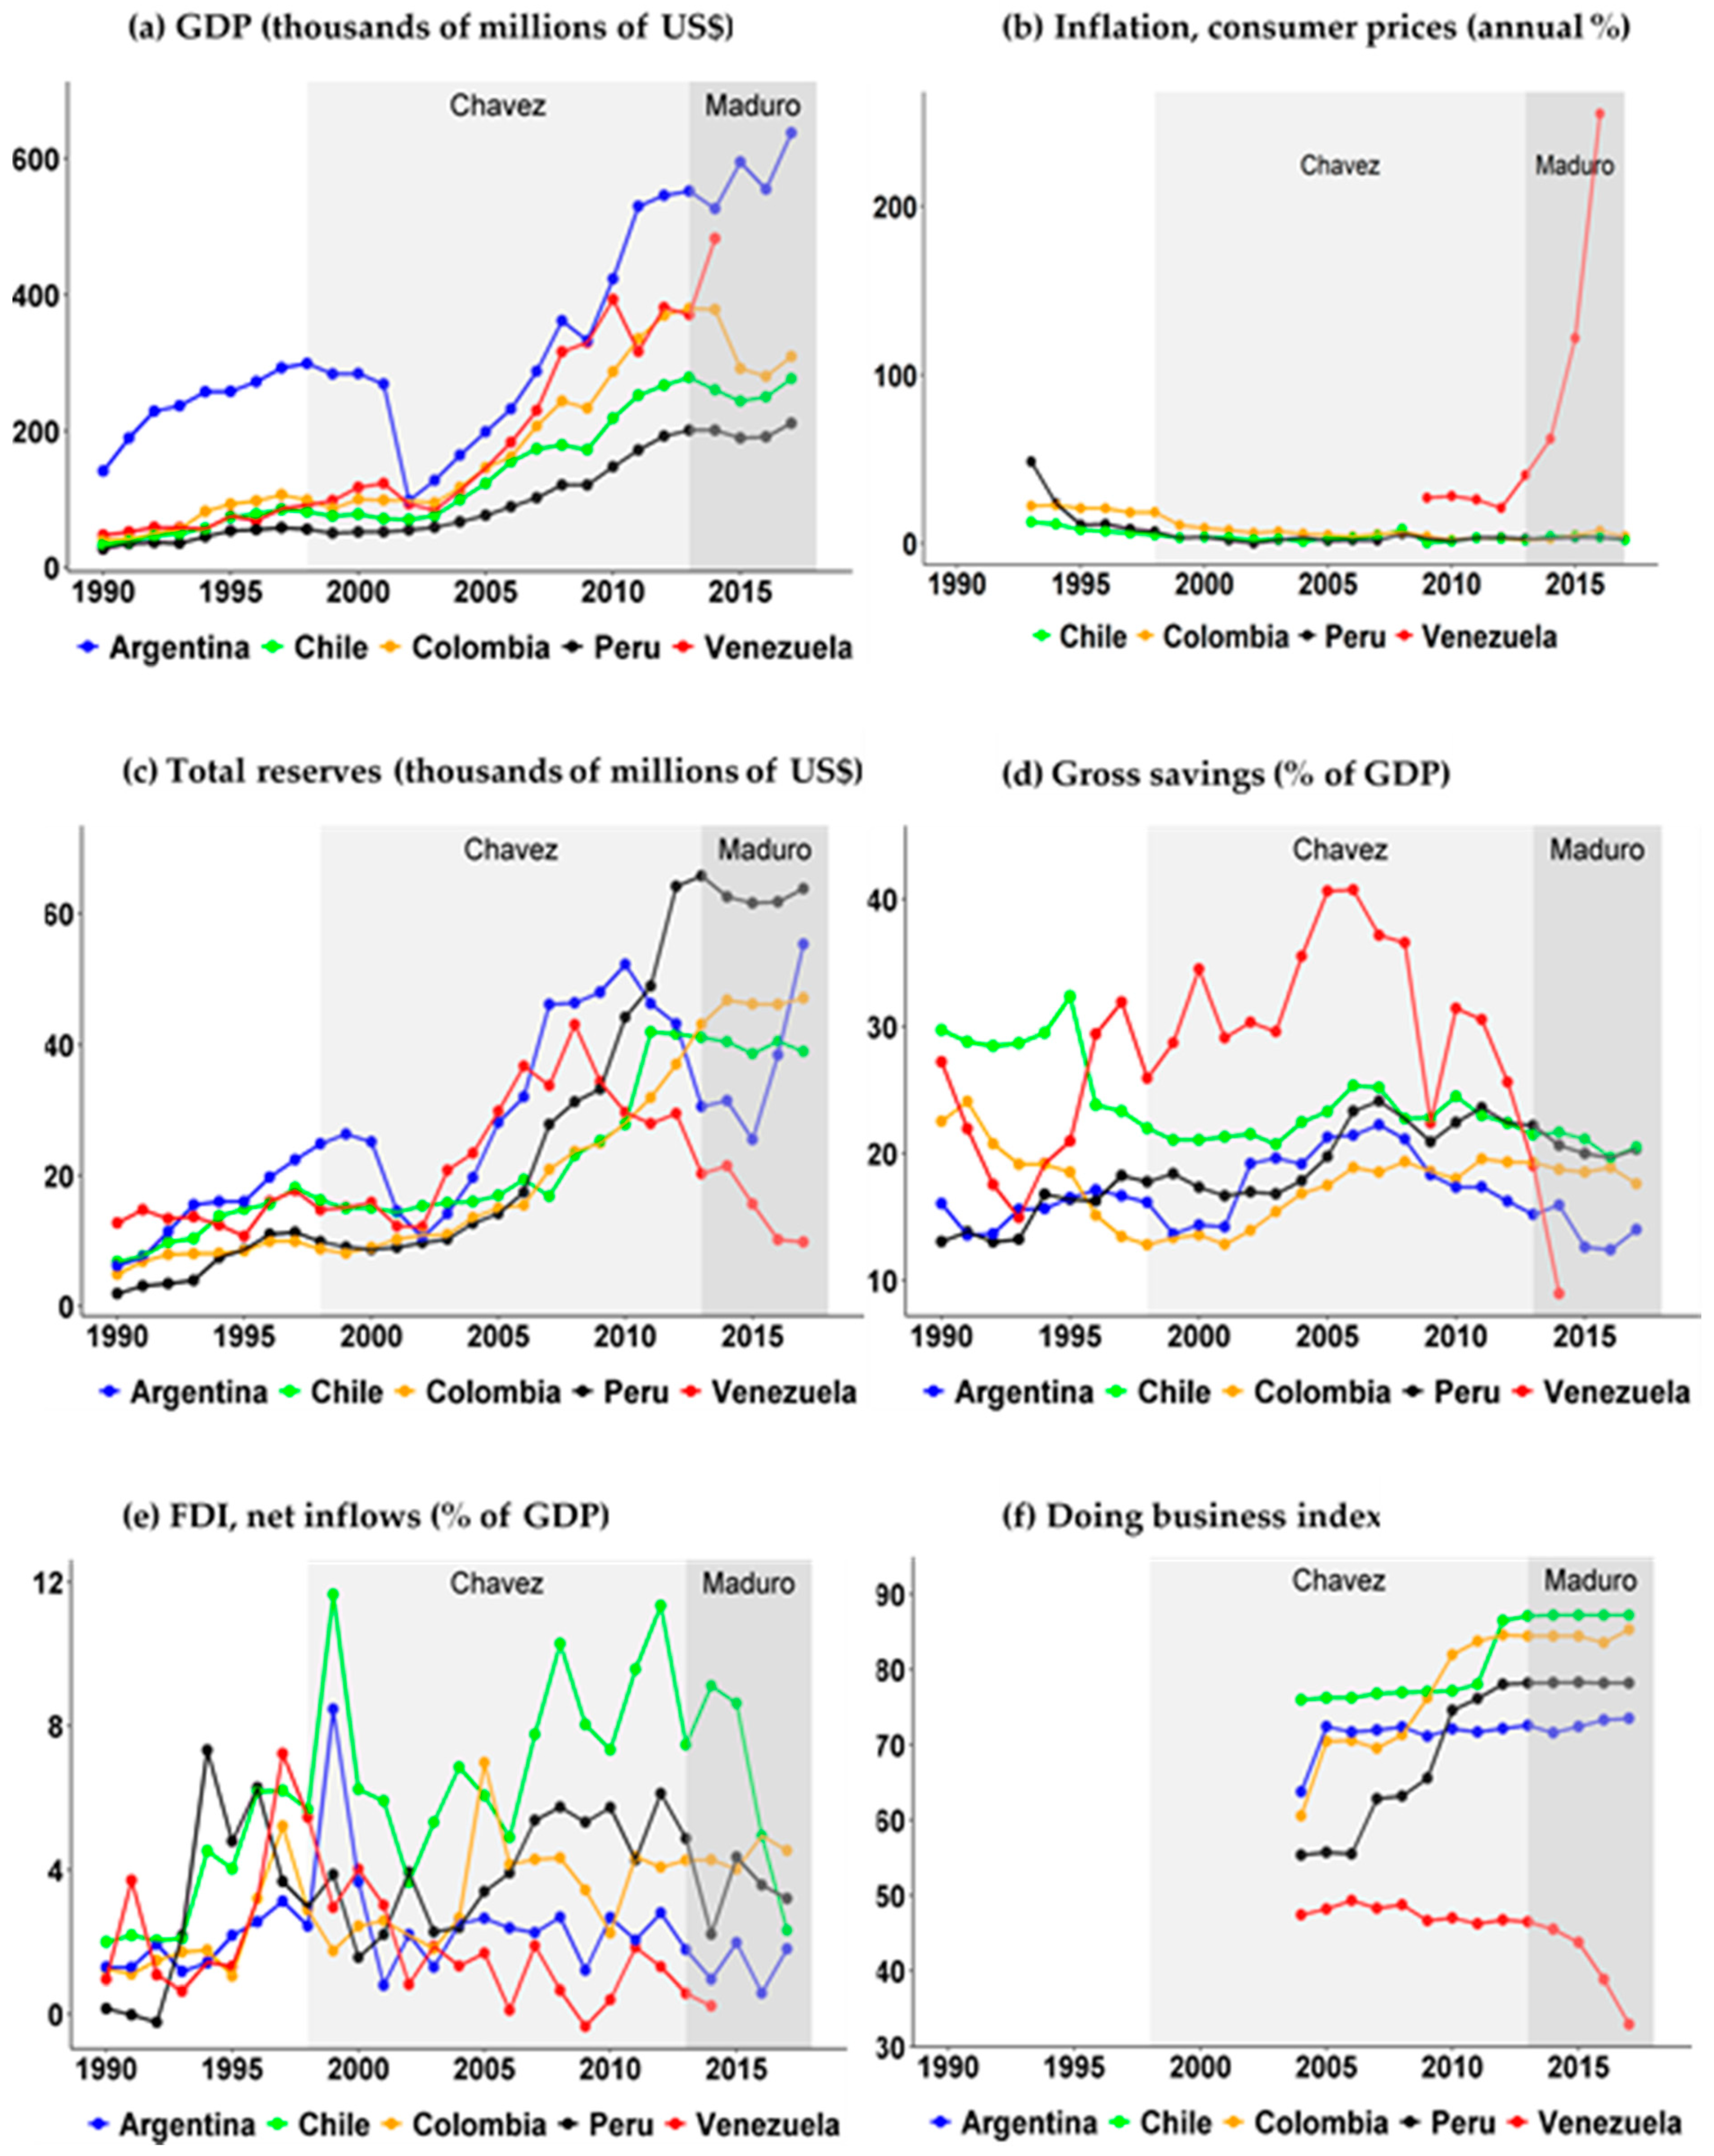
| Economic System Helix | The helix called the Economic System is another subsystem of knowledge and refers to the improvement of the market, to new jobs and to the growth of the economy. | 4.(a) GDP (thousands of millions of US$) 4.(b) Inflation, consumer prices (annual %) 4.(c) Total Reserves (Thousands of millions of US$) 4.(d) Gross savings (% of GDP) 4.(e) FDI, net inflows (% of GDP) 4.(f) Starting a business | (a) This is defined as the price of the buyer and is the sum of the gross added value of all producers residing in the economy plus any tax on the product, minus any subsidy not included in the value of the products. (b) This indicator is measured through the consumer price index. (c) It is defined as the country’s Total Reserves. (d) It is calculated as the gross national income minus the total expenditures, plus the net transfers. It is understood as the acquisition of a long-term management interest through direct investment of foreign capitals in net investment inflow. (d) The last indicator refers to the activities that allow starting a business in a given country. |
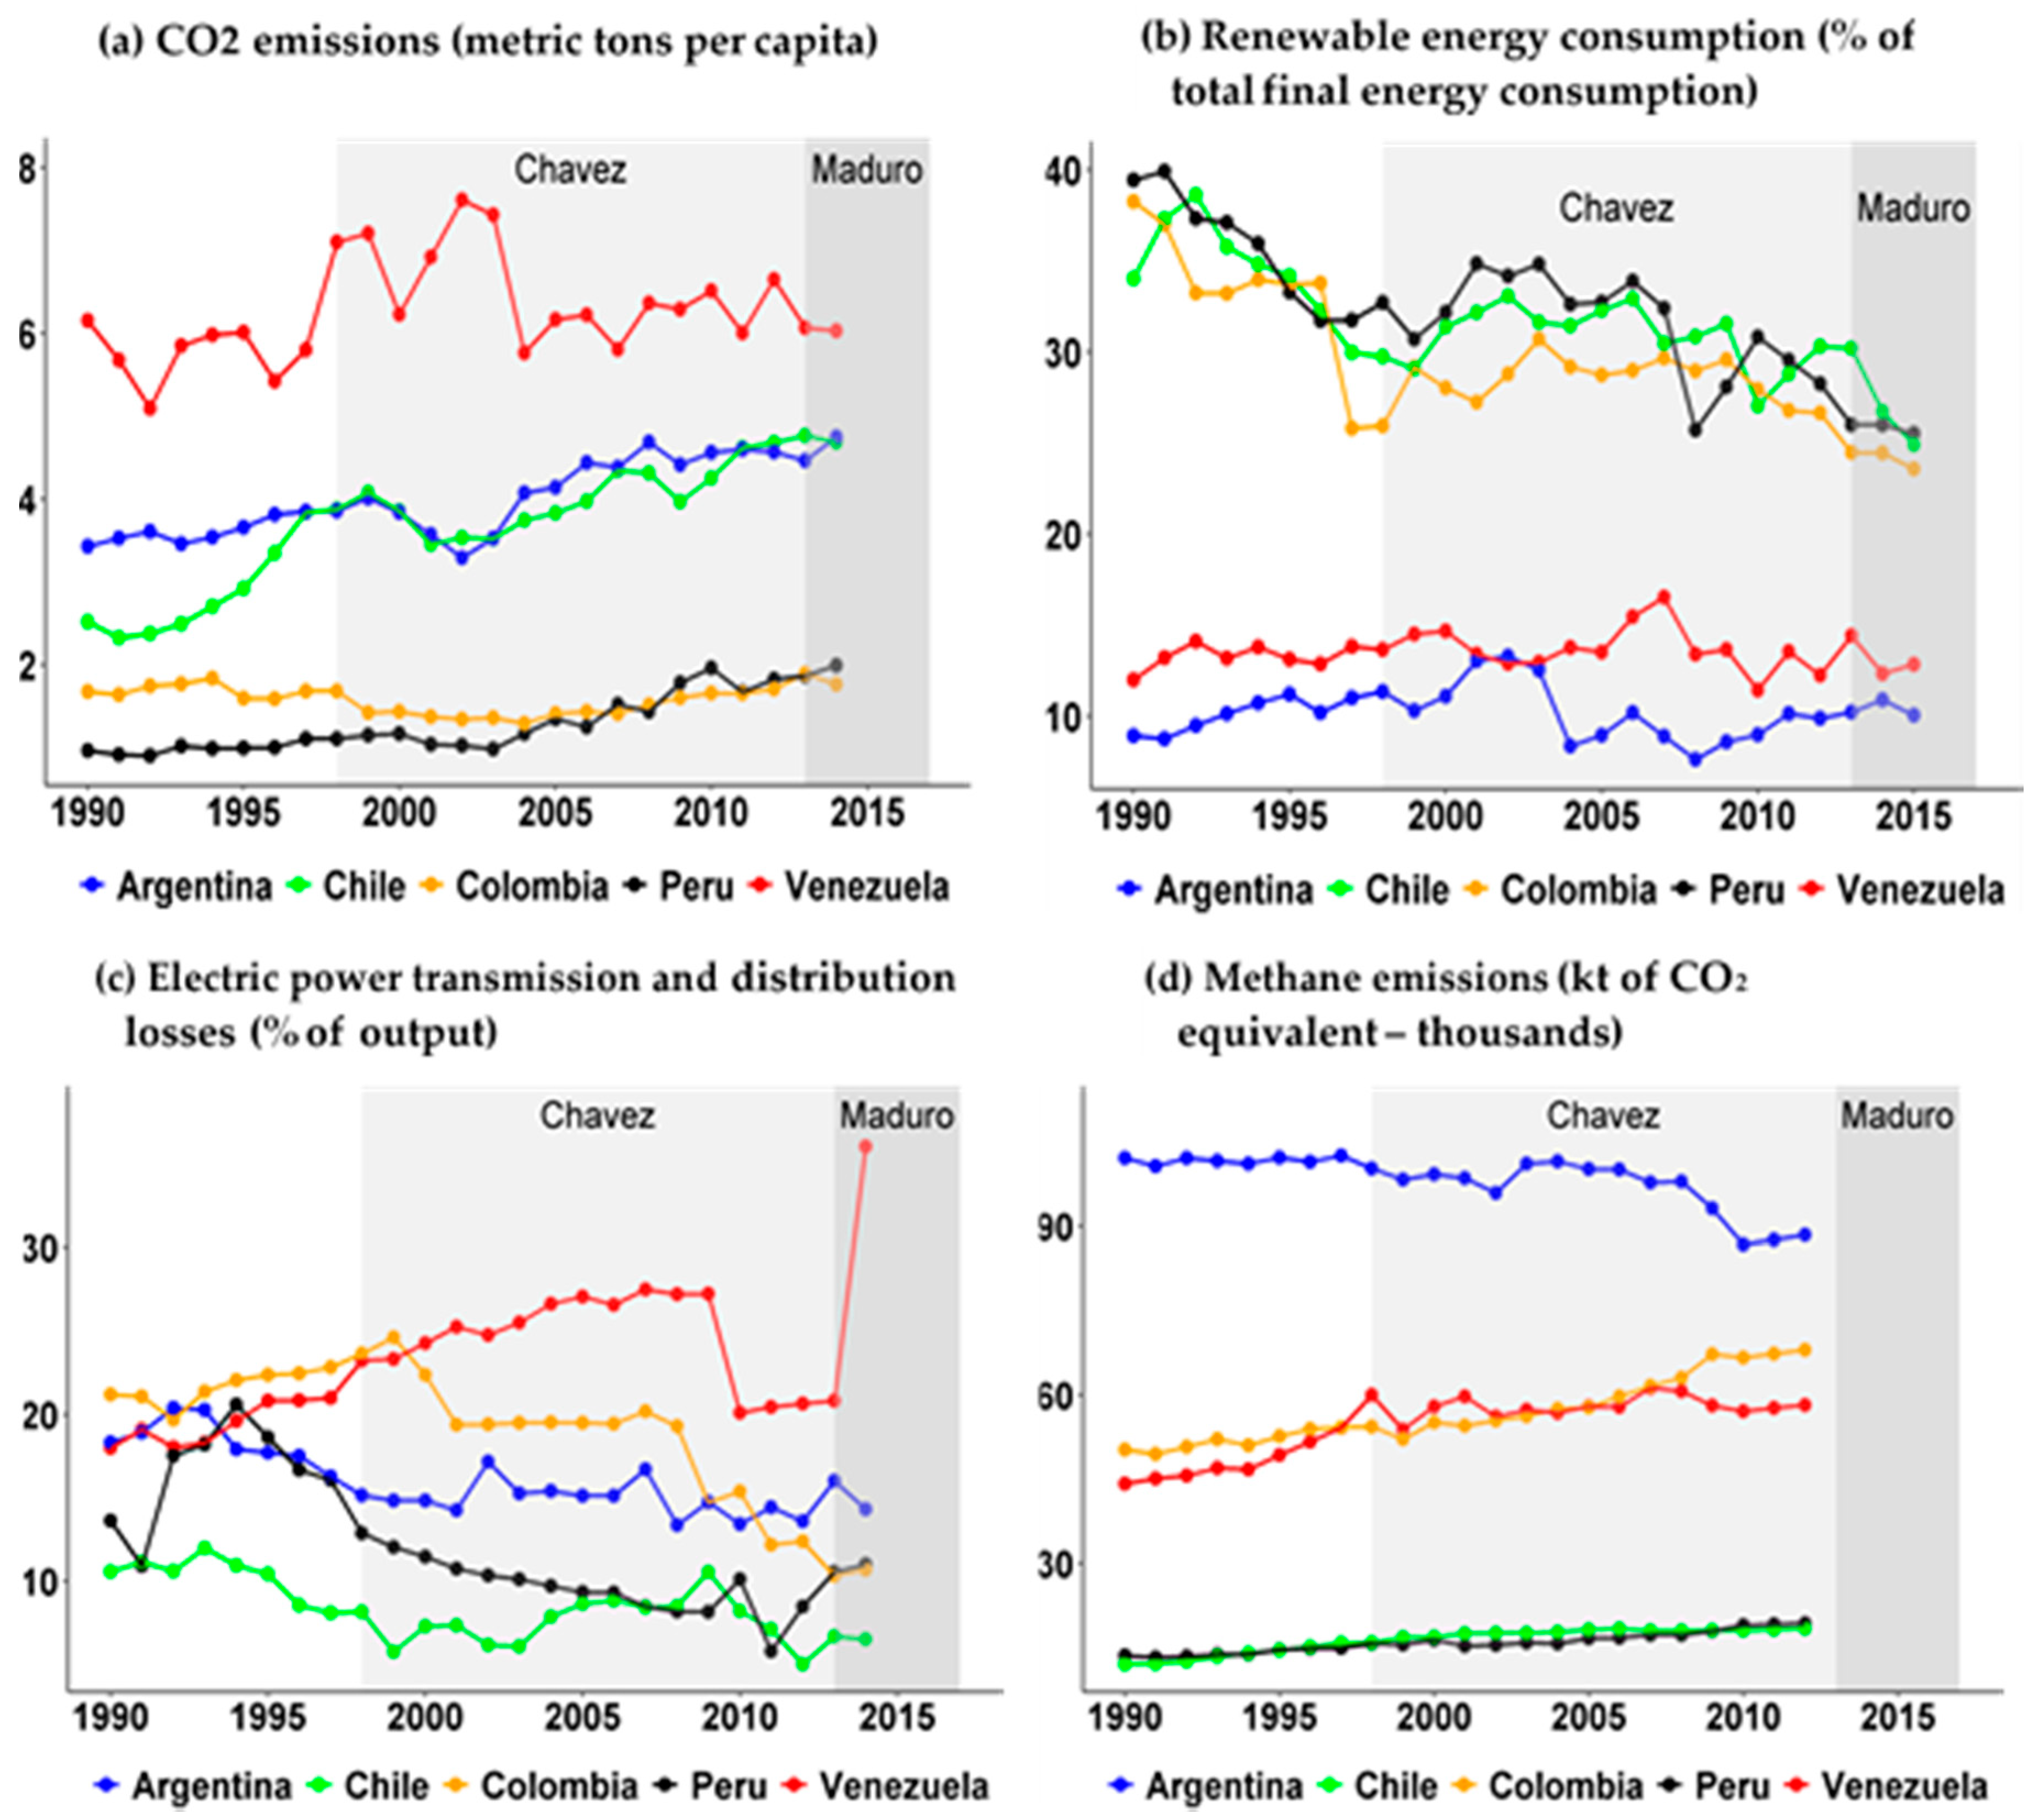
| Natural Environment Helix | The helix defined as environmental refers to the natural capital of each country and the protection that is made of it through global and local measures. | 5.(a) CO2 Emissions 5.(b) Renewable energy consumption 5.(c) Electric power transmission and distribution losses (% of output) 5.(d) Methane emissions | (a) It is understood as the carbon dioxide emissions that are derived from the burning of fossil fuels and the manufacture of cement. It is understood as the consumption of renewable energy and its share in the total final energy consumption. It measures transmission and distribution losses including theft. It is interpreted as the methane emissions that are derived from human activities such as agriculture and industrial production of methane. |
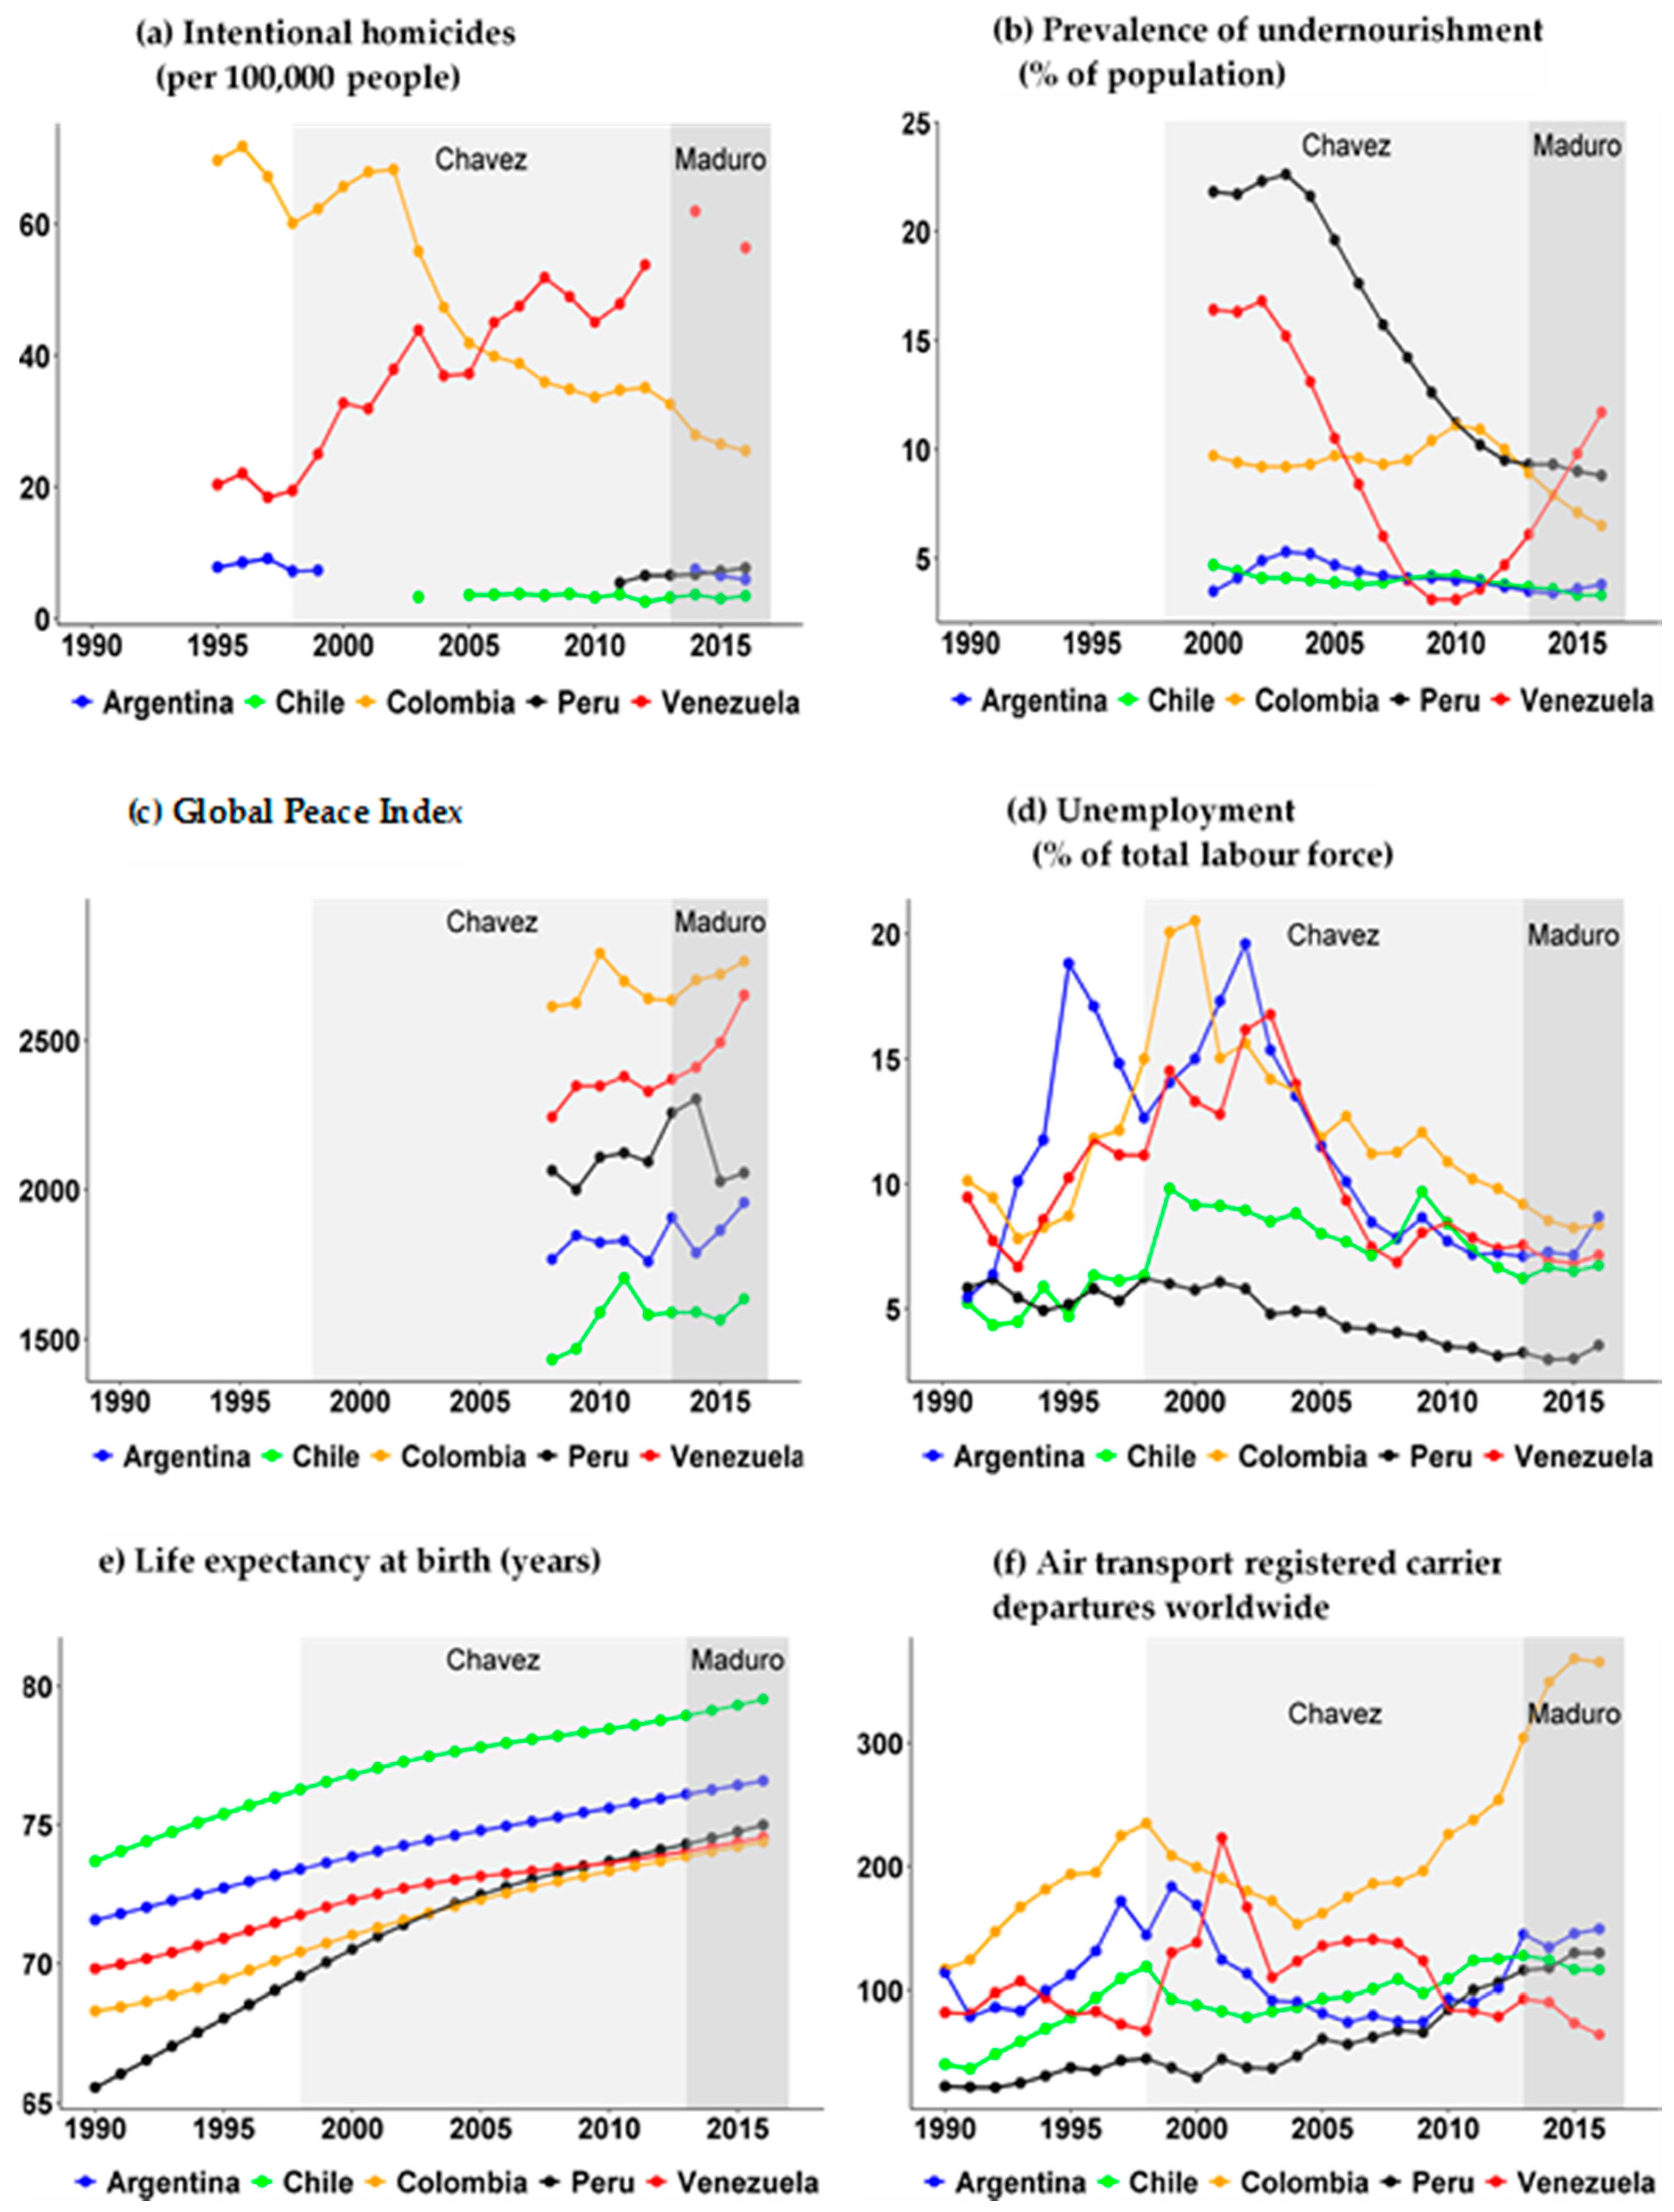
| Media-based and culture-based public Helix | The public helix is based on media and culture. In this study, it is defined as the capacity of interlocution of society as a whole to deal with the other helices, especially with the measures taken by governments. | 6.(a) Intentional homicides (per 100,000 people 6.(b) Prevalence of undernourishment (% of population) 6.(c) Global Peace Index 6.(d) Unemployment, total (% of total labour force) 6.(e) Life expectancy at birth (years) 6.(f) Air transport, registered carrier departures worldwide | (a) It refers to intentional homicides and is understood as estimates of unlawful killings inflicted on purpose as a result of domestic disputes, interpersonal violence, violent conflicts over land resources, intergovernmental violence over lawns or control, and predatory violence and killings by armed groups. (b) It refers to the population that is below the minimum level of food energy consumption. It is used to report annual changes in the state of global peace at the subnational, national, regional, and global levels. (c) The GPI is highly correlated with other measures of quality of life. (d) It is defined as the proportion of the labour force that does not have a job but is available to look for a job. (e) It indicates the number of years a newborn infant would live if prevailing patterns of mortality at the time of its birth were to stay the same throughout its life. (f) It includes the departures of registered carriers around the world. They are take-offs and national take-offs abroad of the airlines registered in a country. |
| Political System Helix | Education System Helix | Economic System Helix | Environment System Helix | Social System Helix |
|---|---|---|---|---|
|
|
|
|
|
| Country | 1996 Index | 2014 Index | Var. % |
|---|---|---|---|
| Peru | 0.17 | 0.25 | 45.7% |
| Chile | 0.64 | 0.45 | −29.9% |
| Argentina | 0.28 | 0.37 | 31.5% |
| Colombia | 0.31 | 0.41 | 29.9% |
| Venezuela | 0.18 | 0.04 | −74.6% |
© 2019 by the authors. Licensee MDPI, Basel, Switzerland. This article is an open access article distributed under the terms and conditions of the Creative Commons Attribution (CC BY) license (http://creativecommons.org/licenses/by/4.0/).
Share and Cite
De la Vega, I.; Puente, J.M.; Sanchez R, M. The Collapse of Venezuela vs. The Sustainable Development of Selected South American Countries. Sustainability 2019, 11, 3406. https://doi.org/10.3390/su11123406
De la Vega I, Puente JM, Sanchez R M. The Collapse of Venezuela vs. The Sustainable Development of Selected South American Countries. Sustainability. 2019; 11(12):3406. https://doi.org/10.3390/su11123406
Chicago/Turabian StyleDe la Vega, Iván, José Manuel Puente, and Magaly Sanchez R. 2019. "The Collapse of Venezuela vs. The Sustainable Development of Selected South American Countries" Sustainability 11, no. 12: 3406. https://doi.org/10.3390/su11123406
APA StyleDe la Vega, I., Puente, J. M., & Sanchez R, M. (2019). The Collapse of Venezuela vs. The Sustainable Development of Selected South American Countries. Sustainability, 11(12), 3406. https://doi.org/10.3390/su11123406