Article

Quantities, Determinants, and Awareness of Households’ Food Waste in Italy: A Comparison between Diary and Questionnaires Quantities

1
Department of Agricultural and Food Sciences, University of Bologna, Via Fanin 50, 40127 Bologna, Italy
2
Department of Statistics, Università di Bologna, via delle Belle Arti, 40100 Bologna, Italy
*
Author to whom correspondence should be addressed.
Sustainability 2019, 11(12), 3381; https://doi.org/10.3390/su11123381
Submission received: 9 May 2019 / Revised: 5 June 2019 / Accepted: 11 June 2019 / Published: 19 June 2019

Abstract

:
Food waste at the household level accounts for a significant share of total food waste in developed economies, according to the Food and Agriculture Organization. Studies have shown that this share varies between 0.3 kg to 4.5 kg per person per week, depending on the definitions and methodologies applied. In Italy, quantities, behaviors, and attitudes regarding food waste have been solely explored through the use of questionnaires, typically leading to discrepant values of food waste. In this study, we estimate and analyse the determinants of food waste over a 388 units’ panel spread over the national territory, through a diary and questionnaire study. Moreover, by comparing food waste value that was declared in questionnaires and reported in diaries, we confirm that the awareness of food waste quantities is heavily biased. The results confirm that the average food waste value is significantly higher when gathered through diaries, while questionnaires are able to catch less than one-third of food waste determinants.

1. Introduction

Food waste is estimated to be roughly one-third of all food produced globally [1]. Food waste at the household level accounts for a significant share of total food waste in developed economies, according to the Food and Agriculture Organization (FAO) [1]. Studies have shown that this share varies between 1 kg per family per week [2] and 4.5 kg per person per week [3], depending on the definitions and methodologies applied in the estimation process and, perhaps, in consumer’s behavior.
The need for a reliable quantification resides in the global agenda on the issue, which asks the national countries to estimate food waste in order to halve it by 2030 [4]; European Countries adhering to the European Union (EU) are also asked to provide, voluntarily, so far, an estimation of food waste, especially at the final stages of the food chain, in order to properly prevent and reduce it within the National Waste Prevention Plans [5]. The methodological guidelines that are recommended by the European Commission, published on the 3rd of May 2019 [6], openly list food diary and waste compositional analysis as methods to be used in national assessment of food waste, while they exclude questionnaires. Questionnaires report intentions, which do not necessarily correspond to facts [7,8,9], especially in the environmental field [10]. A comprehensive literature review on the methods and results about Italian studies [11] highlights that, regardless the method applied to analyze data, surveys have been always conducted through the use of questionnaires [12,13,14,15,16,17] and estimations between 0.3 and 0.6 kg per week per household have been provided, with the most recent exception of [18], who provided a value of 36 kg per person per year. With the exception of one study [19], where the diary format was used to test the impact of an educational intervention of the food waste reduction, diary was never run in Italy before the present survey, neither was run waste sorting analyses, with the exception of [20]. In international literature, examples of diary’s application for Household Food Waste (HFW) quantification have been provided with reference to the United Kingdom (UK) and Finland [21,22,23]; waste sorting was run also Finland [24], Denmark [25], and Canada [3].
Beside quantification, the analysis of behaviors associated with food waste is important to define prevention measures [26]. Behaviors that are associated with high quantities of food waste at the household level have been previously explored and summed up [27], with the results revealing the major predictors of food waste to be the following: gender of the individual doing the shopping [23], single households [11,22,28,29], especially women, in the case of [8], households younger than 65 years old [8,30,31,32,33]; and, the purchase of non-discounted food, which suggested lesser attention being paid to convenience [23,34]; on the contrary, no relation emerged between discounted food products and Buy One Get One Free (BOGOF) purchase and consumption and food waste quantities in [29], while a strong correlation emerged from the frequency of shopping and food waste quantities—suggesting that the most frequently food is purchased, the less is food waste at household. “Having children” was also found to result in higher levels of food waste and, interestingly, higher awareness of it [3], despite the fact that having children is usually associated with greater planning of shopping and food preparation. In addition, individuals who frequently ate out of home tended to display higher levels of organic waste at home, while those who relied on pre-packaged fresh food wasted less [3]. “Poor planning” and “buying more than needed” emerged as causes of higher food waste in [7,35].
As in our pilot, the diary method resulted in being more accurate [3,36,37] than questionnaire in quantification, thus confirming our initial hypothesis. Therefore we decided to combine it with questionnaires in order to detect both the reliable quantities and drivers of food waste at the household stage in the National Survey. In our previous studies [36], some specific biases have been assumed to be responsible of a lack of awareness with regards to quantities, such as positive illusion or social desirability bias, availability, and anchoring [38], or cognitive dissonance [39]. We have a twofold aim in the present study: validating our hypothesis that questionnaires are not a reliable method to gather food waste quantities and providing determinants and quantities of food waste at household stage with reference to Italy.
In the following section, the methodology will be illustrated. In “Results”, the food waste quantities with reference to demographics (Section 3.1) will be first presented, followed by general food waste quantities and causes (Section 3.2), motivations and consumptions habits (Section 3.3), disposal of food waste (Section 3.4), synthesis of all determinants of this study (Section 3.5), and then awareness (Section 3.6). In the discussion paragraph, we will comment on the present study with reference to the scientific literature of the field.

2. Materials and Methods

2.1. Experiment Design and Tools

The study (also labeled as “national survey”) is based on a survey that was conducted by WRAP [22] and it is composed of two phases: a diary stage and a questionnaire stage. The tools were set up and tested twice in pre-test and pilot phases, run in 2015 [36,40]. The national survey was conducted in May–June 2017 (spring/summer in Italy), therefore a seasonal component has been detected in the type of food (especially fruit and vegetables) that has been reported. The CAWI (Computer Assisted Web Interview) questionnaires were sent to respondents two weeks after the end of the diary survey. The respondents were paid the equivalent of 50 euros to attend the experiment, which was granted in form of shopping vouchers.
In the first stage of the data collection, paper diaries were delivered to the families and they had to be completed with details on food that was thrown away at the end of each meal for one week. It was recommended to use a kitchen scale whether possible, or common kitchen tools in alternative (a spoon, a glass). The causes of food waste, as well as the quantities, were required, along with information on the type of food (fresh, canned, frozen, homemade) and the method of disposal (organic, mixed, sewer, pets, other). Both “the product thrown away” and the “causes” were open-end questions, so a space had to be filled out with relevant information. A checkbox survey was used to check whether the wasted food was edible or not edible. The respondents were asked and reminded, during the week, that the weight of food should not have included packaging. One page at the end of the diary was dedicated to the cleaning out of the pantry or fridge, with reference to products that were bought during the week of the experiment that were likely not going to be eaten.
In the second stage of the data collection, a CAWI questionnaire that comprised of 23 questions was sent to the same panel of respondents, which inquired into the shopping and cooking habits, the management of leftovers, and the perceptions of both respondents’ motivations for food waste reduction (both environmental and ethical) and estimations of their waste. The questionnaire was inspired to [22] and the consumption diary that was developed by the National Agency for Italian Statistics, with some slight modifications. Differently from [22], the questionnaire was delivered just once, due to a high abandon rate that was recorded in the pilot experiment [40], which was possibly due to the important burden of work that was asked to respondents.

2.2. Sampling

Stratified random sampling was employed in the selection of participants, based on distribution for macro-regions (North, Center, and South), population of the city (under or above 100.000 inhabitants), and the presence of children. SWG managed the selection process (a marketing and survey company that is specialized in food waste studies). More details can be found in [29]. The comparison between our panel and the Italian population [41] for the selected clusters is presented in Figure 1.
As from the figures, the presence of children in Italy amounts to 43% of the family out of the total, while it corresponds to 35% in our sample. This difference is also due to the difference in estimation, as ISTAT data does not count people’s age when labelling “with children”, thus also including people over 18 years old living with their parents. In the case of Macro-regions, a good representation of the North has been provided, being the Italian population in the area 47% out of the total and 50% in our sample. A slight unbalance is recorded between the populations of center and south Italy, being in ISTAT 20% and 32%, respectively, while in our sample, 27% and 22%. This difference is due to the larger sample size that was selected in the city of Rome, which required more units to guarantee representativeness.

2.3. Definitions

Data were collected both on edible and not edible food waste in order to be consistent with the most widely accepted definitions of food waste at the international level ([42,43,44]) and to allow for comparison with a larger number of studies. A post-hoc classification was made between avoidable and possibly avoidable food waste within the edible fraction, based on the study by [22]. The results that are presented in this study only refer to the edible fraction (both avoidable and possibly avoidable) of food waste, as the study only aimed at exploring the relationships that exist between certain behaviors and the waste of edible food.

2.4. Data Analysis

Data were inserted in a Limesurvey platform and then managed and analyzed with R. All of the weights reported in terms of single product were classified per category (as shown in Figure 2). For instance, “strawberries”, 20 g, was classified as “fruit”. With reference to reasons, we classified all of the provided answers in a classification scheme reported in Table 1. Weight was also required, and just in few cases a proxy was used (spoon, cup). We produced a reference table with the standard weight of products that were not reported in grams by respondents (for instance, a spoon of sugar or yogurt).
The analysis of the determinants was subdivided into two steps: (i) descriptive analysis of the single observed variables, to determine whether there were statistically significant differences in food waste between the subgroups that were defined in each variable. For instance, Region (variable) shows three subgroups (North, Center, South); the presence of children under 16 years of age (variable): yes/no (subgroups). (ii) multivariate analysis aimed at quantifying the capability of the variables combination to explain the per-capita waste and what are their relative influence.
In the first step, non-parametric tests (Kruskal–Wallis H test and Mann–Whitney U test) have been used in order to verify whether the different levels of the qualitative variables identify significantly different behaviors in waste, since the hypotheses of normality and homoscedasticity were not verified.
The multivariate analysis was performed through a regression random forest in order to: (a) determine how much the analyzed factors were able to explain the food waste and (b) what was the relative importance of the different factors. Specifically, we used the conditional inference random forests algorithm [45] that allows an unbiased variable selection and is not required to simplify the resulting tree to avoid overfitting.

3. Results

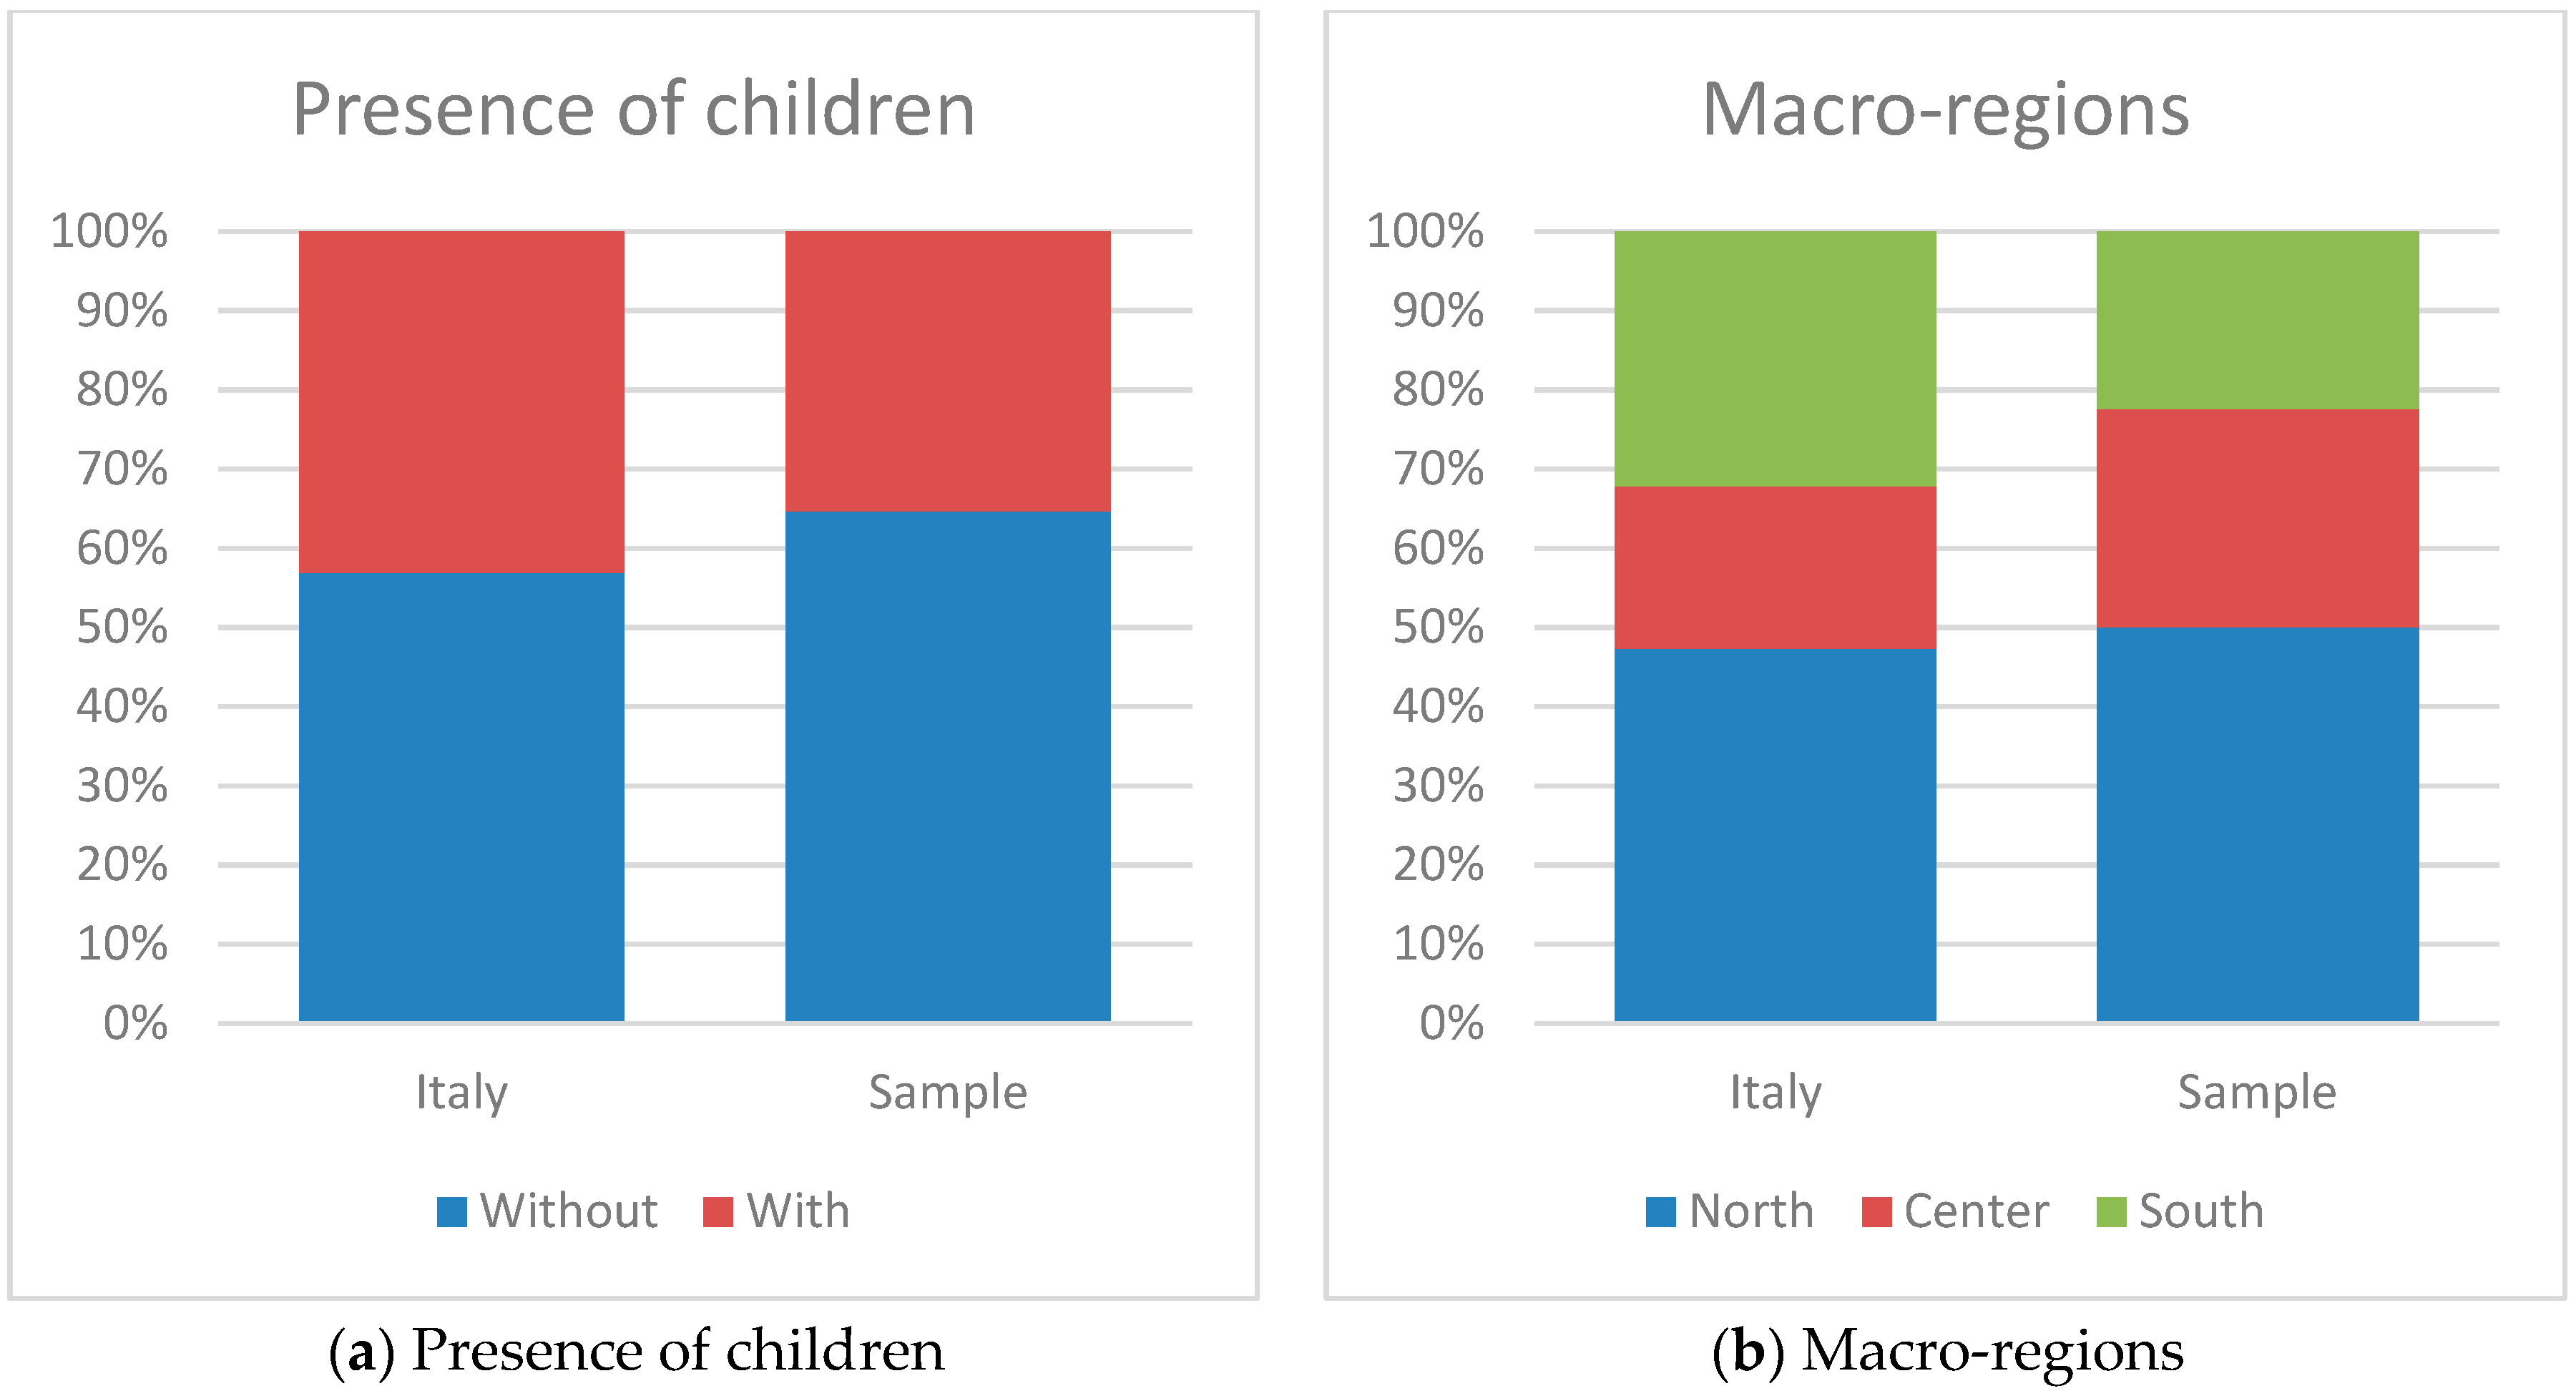
3.1. Household Demographics

Of the 388 families that successfully filled out the diary and answered the questionnaires, 44% were composed of two members (average food waste per capita 600 g), 23% of three members, and 19% of four or more members, while 13% were single households. On average, single households wasted 713.7 g of food, while families composed of three members wasted 375 g of per capita food on average. Families composed of four or more members displayed an average waste of 424.5 g per capita per week. A Kruskal–Wallis test revealed that there was a statistically significant difference in per-capita waste between the four groups (Kruskal–Wallis chi-squared = 21.3, p-value < 0.001). In addition, post-hoc tests revealed significant differences between families of one or two members and those of three or more members. Family food waste levels increased with the number of members, resulting in roughly 1400 g per family per week for families that were composed of four or more members. Despite this, the per capita amount of food waste for these families was lower than that of single householders or couples. Families with children under 18 years old wasted significantly less than those without (Mann–Whitney test = 21433, p-value < 0.001). The per capita food waste of families with children amounted to 443 g per capita per week, while the food waste of families without children amounted to 606 g per capita per week.
Families living in Northern Italy were found to waste significantly less food than families that were living Center or South, with an average waste of 370 g per week as compared to the 616 g displayed in both Central and Southern Italy (Kruskal–Wallis rank sum test, p value = 0.007).

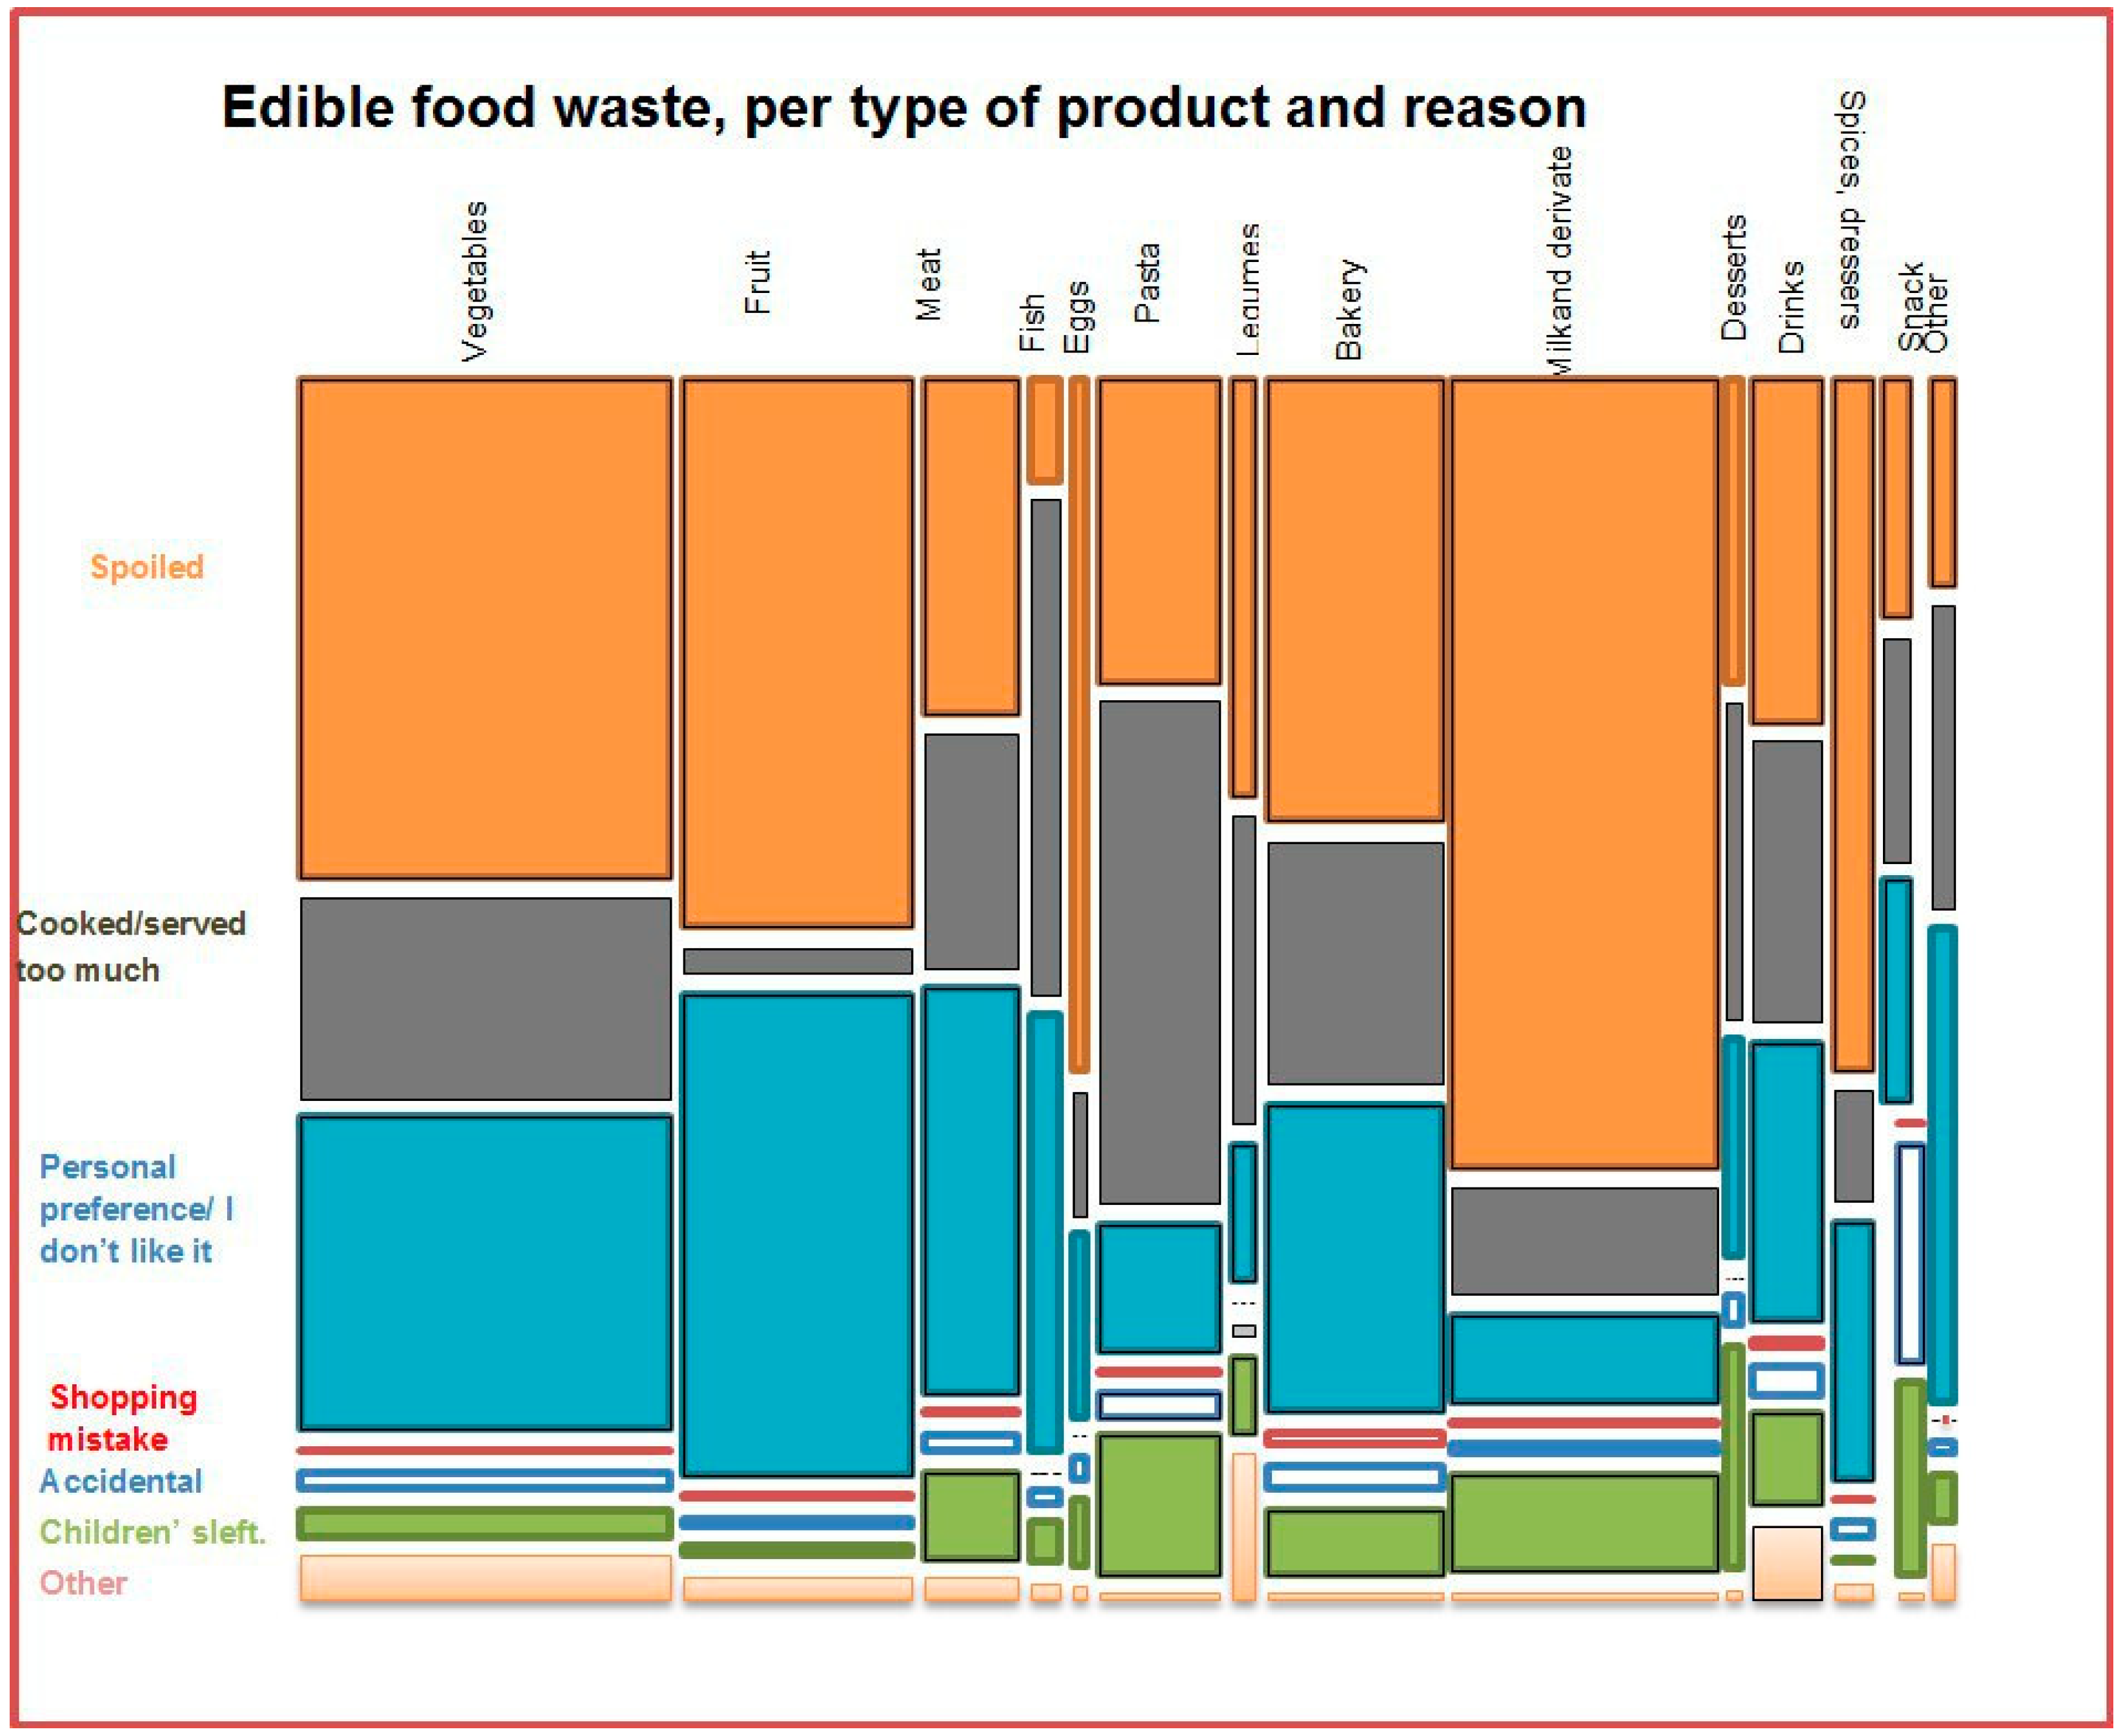
3.2. General Food Waste Results: Quantity and Causes

The overall per person food waste average is 530 g per week. The most frequently wasted food products were vegetables (136 g per person, per week) and milk (92 g), followed by fruits (86 g) and baked goods (61 g) Pasta, rice, and cereals accounts for 40 g per person per week, meat and derivate 34.5 g, and drinks (including all drinks except milk and water) 21 g. All other products accounted for less than 20 g per person per week (see Figure 2 for the complete list of products).
The most frequently cited reason for food waste was that the food was “spoiled”. Out of the overall food waste fraction, 45.8 % depended on this reason. “Personal preferences” was the next most cited reason, accounting for 25.8% of the answers. On average, the families discarded 560.6 g of edible food per week because it was spoiled and 316.1 g due to personal preferences. It is important to note that “personal preferences” was the response that was most frequently associated with “possibly avoidable” food waste: respondents’ generally checked the skin of a chicken as “edible” and yet it was discarded with the reason “I do not like it”. This association (edible food”/” I do not like it”) is what has been classified as “personal preference”. “Cooked or served too much” accounted for the 18.2% out of the total, with 223 g wasted on average by families per week. Other reasons for discarding food (children’s leftover, accidental, shopping mistake, or other) accounted less than 6% each. Contrary to existing data [14], milk was the second most frequently wasted product, although this may have been due to the selected methodology (the diary is the only method that allows for the recording of liquid food waste). Interestingly, the most frequently cited reason for the waste of milk was that it was “spoiled” (43%). The same reason was frequently cited for vegetables and fruit (Table 1).
An association between the products wasted and reasons is proposed in Figure 2. As evidenced in figure, spoiled (orange tabs) is the most frequent reason that is provided by respondents, impacting fresh products first (vegetables, Fruit, Milk, and derivate). “Personal preference” follows, in many cases being selected for products classified as “edible” by respondents themselves but not appreciated anymore (for instance, bread bought one day earlier was classified as edible, but the reason given for throwing it away was “I don’t like it anymore/I bought a new one”). Although not listed among the most cited reasons for wasting food, “children leftovers” was mostly associated with pasta, vegetables, and milk and derivate.

3.3. Motivations, Consumption Habits and Food Waste Quantities

The respondents were asked to assign a value number to each statement (Y axis), from 1 to 5, being 5 the maximum positive value. Then, their food waste value was compared to the answers they provided, to check whether a most positive attitude to certain issues) can influence the actual value of food waste that is produced per person. No differences in food waste quantities were detected among participants with reference to their attitudes (Figure 3, question in the caption). In addition, no differences were found within sub-groups of participants either—specifically, between families that comprised of children and those that did not—except in relation to the response “teaching my children to eat healthy”.
With regard to the question “How healthy do you think you and your family eat?”, the responses indicated higher average waste levels for the families who indicated that they eat healthy (739 g per capita per week), as compared to families who indicated that they do not eat healthy (520 g per capita per week, which is very close to the average of the overall sample at 530 g (Mann-Whitney rank sum test: 0.005). Therefore, the difference between those groups confirms to be significant.
No significant differences in food waste quantities were observed between families that more frequently dined out and families that frequently cooked their own meals (all Kruskal–Wallis test with p-value > 0.05).

3.4. Disposal of Wasted Food

Attitudes that were related to the separation of garbage were found to have a significant impact despite the fact that environmentalism-related values did not significantly affect the amount of food waste produced (Table 2). Specifically, families who separated their edible food waste by throwing it into the organic bin wasted less food (359 g per week) when compared to families who did not separate their waste (537–610 g on average) (Kruskal–Wallis rank sum test, p-value 0.001). The question was formulated as following: “do you dispose your food in a separate bin (organic waste collection bin)? If yes, how much?” We asked to specify a percentage of separate collection of the garbage, since some Municipalities apply the separate collection system as mandatory, thus fining those who mix garbage. We expect such respondents to answer 100% to our question. In other cases, separate collection system is either mandatory but with no fines or voluntary, which leaves families the option to apply it or not.

3.5. Extent to Which the Selected Variables Determine Food Waste

Table 3 lists all of the variables analyzed, along with their impact on food waste production:
Given that some of the variables, among those considered, were found to have significance on food waste quantities, a regression random forest [45] was implemented with the goal of understanding the extent to which the selected variables were able to explain the dependent variable (food waste quantities).
Through the algorithm, it was detected that less one-third of the variance in food waste quantities could be explained by the selected variables (MSE = 153998.3, with an R2 = 0.3027). It is evident that the set of observed variables is only able to provide a very partial explanation of food waste. Among the explanatory variables analyzed, the demographic ones have the main role (family dimension, region of residence, and, less, the presence of minors). These variables are followed by those on the grocery shopping behavior: firstly, the preparation of the list and, to a lesser extent, the frequency, the purchase of discounted products, and how the list was used (Figure 4).

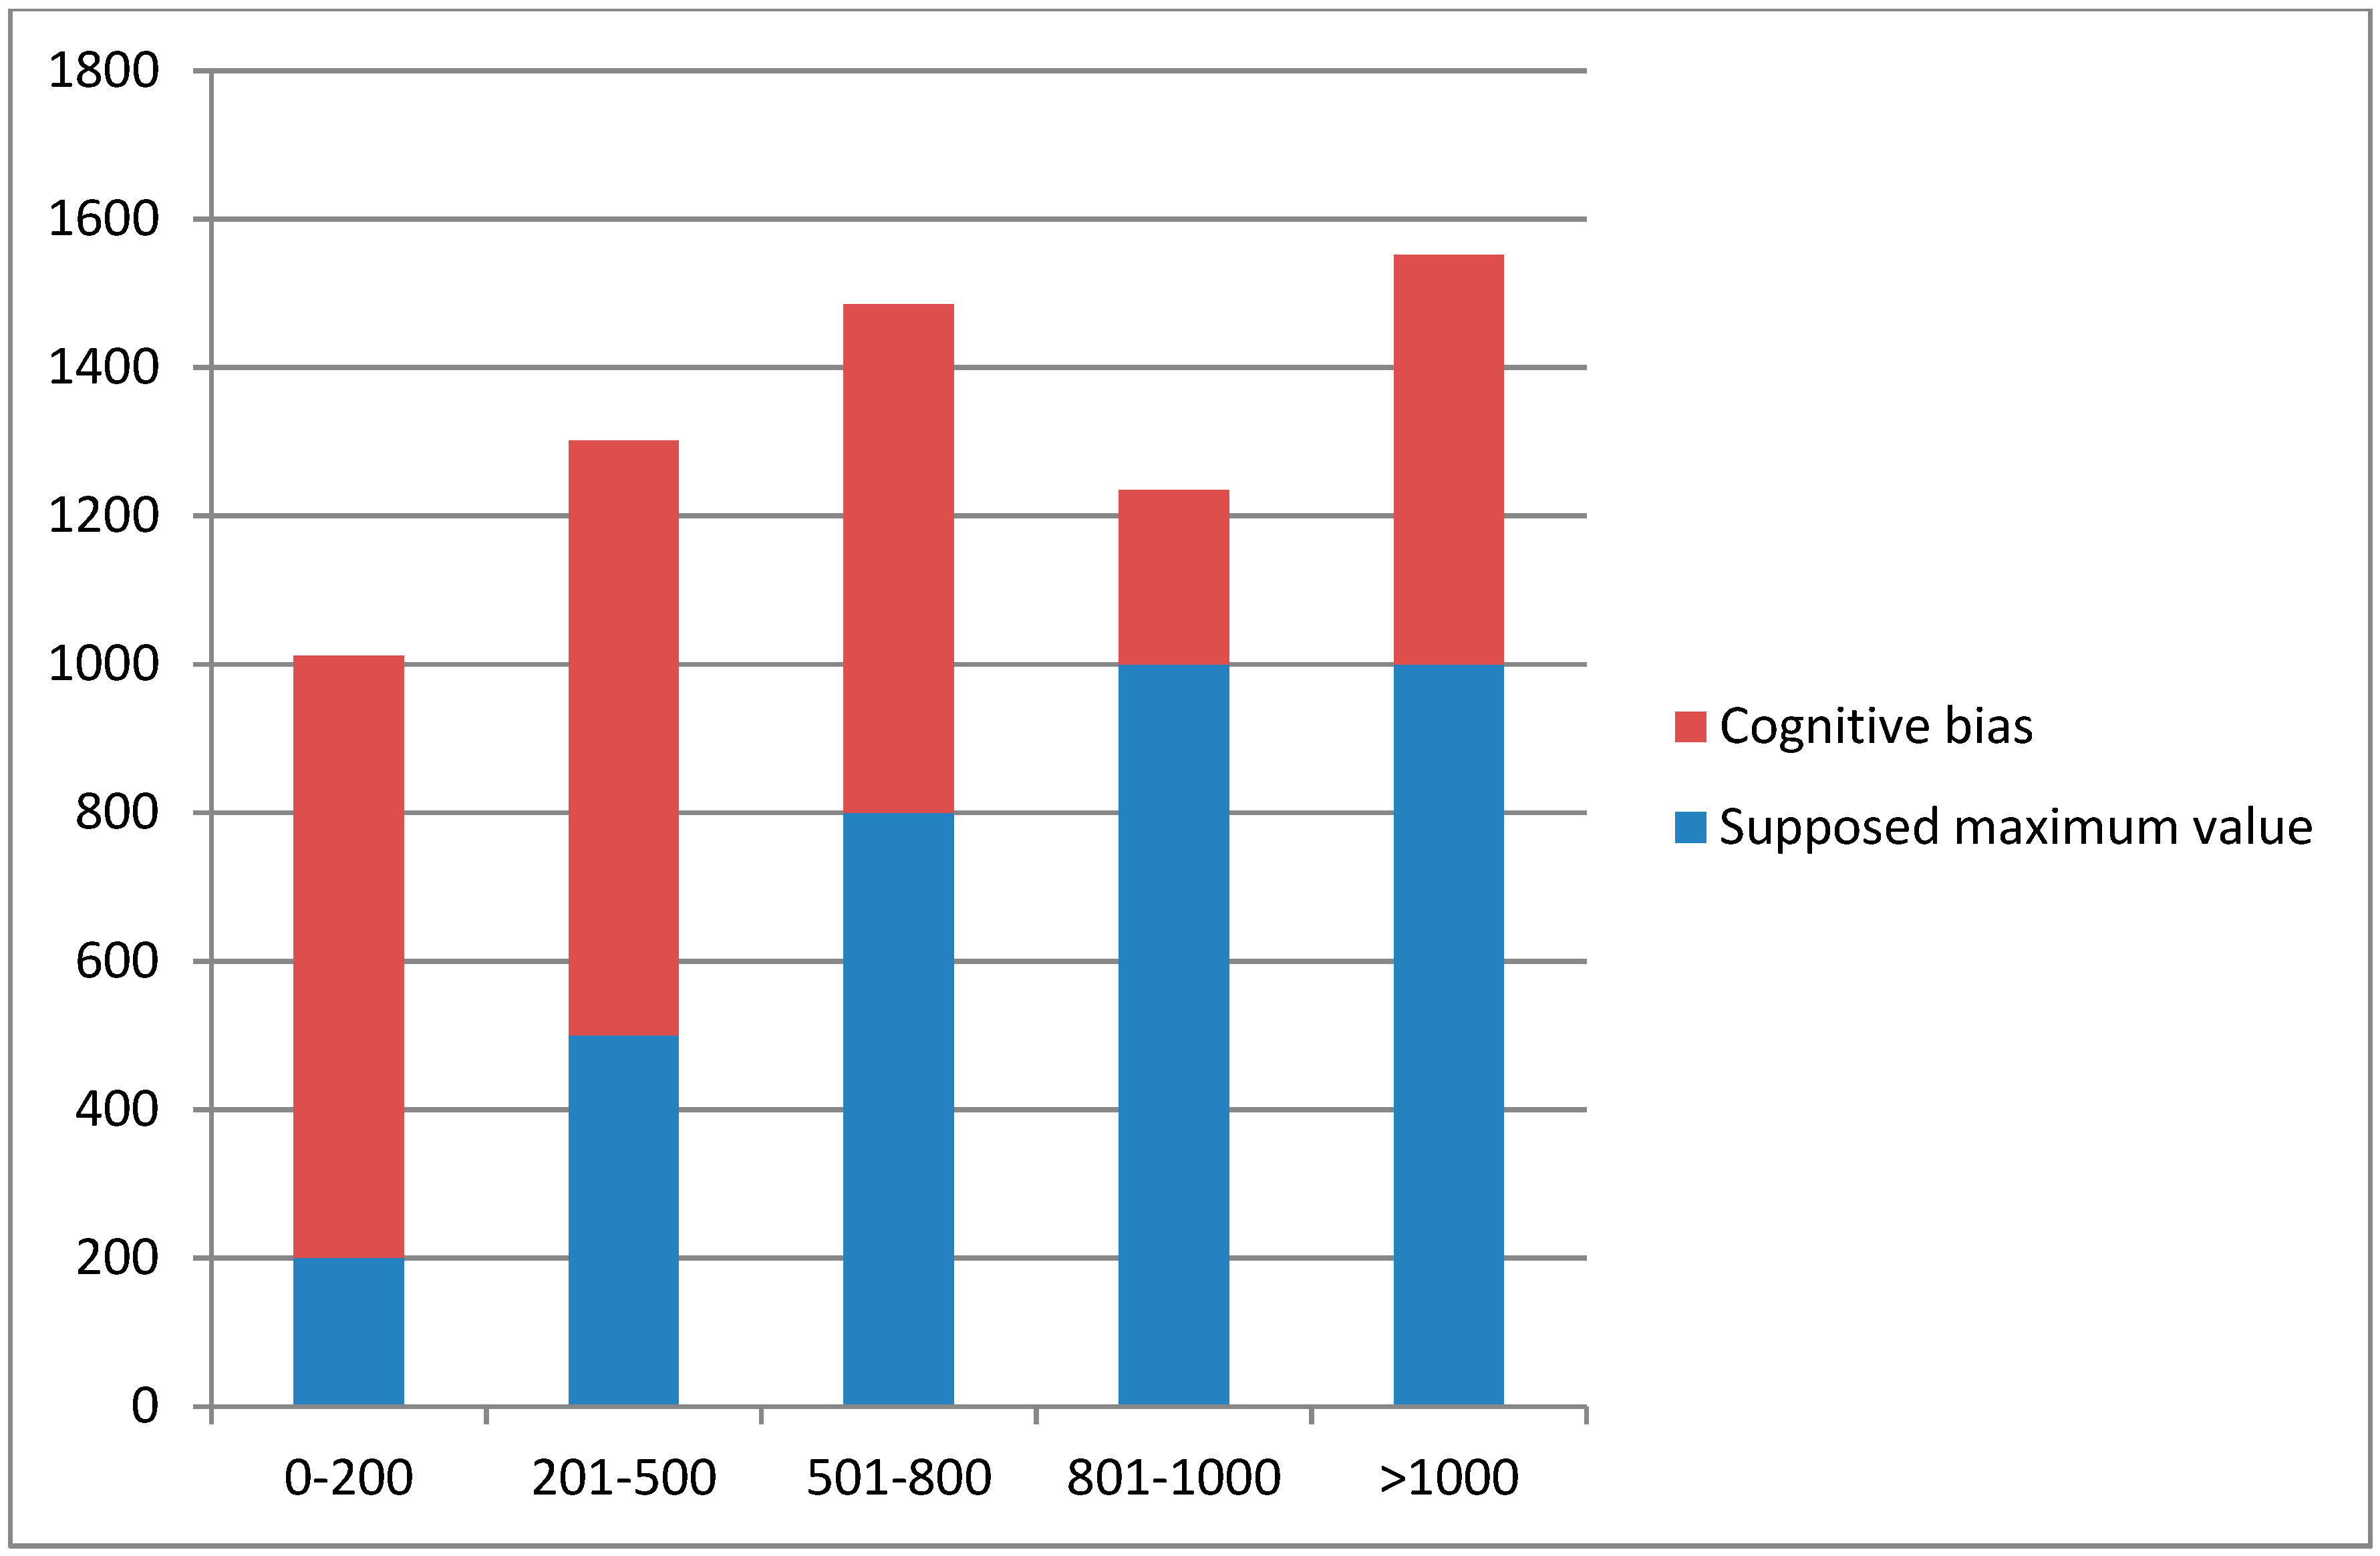
3.6. Awareness of Food Waste Quantities

Asking respondents to indicate an option, among given ones, of the food waste produced in their family, weekly, was used to assess awareness. The answer revealed to be heavily biased, as was detected in the pilot experiment [40]. For those who indicated that they wasted 0–200 g weekly per family, the average waste recorded in their diaries actually amounted to 1011 g per week per family. A similar trend was recorded across all of the responses, so that for those who indicated a weekly waste quantity of between 201 and 500 g, the actual average was 1302 g, and so on (see Table 3). Only 16.8% of families declared a waste quantity that was actually verified through diaries.
Overall, out of 388 families, 308 indicated a weekly waste average of less than 500 g per week. However, the average quantity of food waste was between 1000 and 1300 g per week (Table 4).
The discrepancy between perceived food waste quantities after the one week diary experiment and the actual food waste quantities remained substantial, regardless of the option selected, even for families that declared that they wasted more than 1 kg per week. For those families, the actual food waste average amounted to 1552 g, which confirmed the results that were reported in the pilot experiment (Figure 5).
The red sections of the bar chart represent actual food waste quantities, which significantly surpassed the perceived quantities that were reported by participants. As can be deduced from the chart (Figure 5), the actual food waste values were always higher than 1 kg per family per week, regardless of the quantities that participants admitted to wasting in their responses.

4. Discussion

Thanks to this study, some main findings emerged regarding the type of food most frequently spoiled, along with quantities; determinants of food waste. Moreover, the assumption that questionnaires might be a wrong method to assess FW [9,27,36,46] has been verified, thus confirming the need for applying alternative methods. The average weekly household estimate of edible food waste is 530 g per capita, as from our previous paper [29]. Being scaled to a yearly average, this amount equates to 27.5 kg per person per year. This value is not too far from the values that were reported by Koivupuro et al. [23], who estimated an average food waste of 23 kg per person per week in Finland. However, it must be stressed that there is still a risk of underestimation that is related to the diary method. This underestimation was calculated in the pilot study [40] to be about 20% of actual food waste quantities, and it can be interpreted as a lack of accuracy from the respondents in the reporting phase. Therefore, according to these studies, the value of food waste quantities may be considered to be between 27.5 and 33 kg per person per year. Within the same research project of the present study, a parallel quantification of food waste at a treatment plant run in three regions of Italy through a waste compositional analysis [20] was conducted, producing similar values (27 kg of edible food waste per inhabitant per year).
However, the present results substantially differ from statistical approximations that were previously reported in the literature, which estimated a household food waste of about 88 kg per year [47]. To date, inferences from [42] and FUSIONS project for Europe [43] have been revealed to be overestimated when compared to field studies that were conducted on food waste. Our estimates are also very different from existing values of food waste generated by questionnaires [9,13,14,15,16], which are between 0.3–0.6 kg per household per week, with the exception of Fanelli’s, who recently estimated a value of 37 kg per week through a web survey that was conducted in the some regions of Italy [18]. The diary and waste compositional analysis have both been found to be more reliable in estimating quantities of food waste, mainly due to the perception-related biases that are associated with questionnaires (as confirmed in the present study), or what is defined as “attitude-behavior gap” [10]. It is possible to assume that frequency might play an important role, along with availability bias. The average food waste value (530 g per person per week) corresponds to 75 g per day. This value also possibly includes avoidable food waste, namely skins, for instance, so it barely corresponds to half an apple, or two/three biscuits. In other words, not remarkable quantities of food but little quantities that may just not be “fixed” in memory, supported by the frequency of the action, thus becoming not easily detectable by questionnaires and later recalling.
On the other side, Gaiani et al. reported the same most frequently wasted food products [11], where respondents reported vegetables, milk and derivate, and bread being the three most frequently wasted products, while there are differences with the results of Fanelli [18], who found bread to be the most frequently wasted product. The difference in results might be associated to the socio-demographic characteristics of the sample, which are very different in the two studies. Methodology that was selected for the quantification is to be considered as an important reason, as what respondents declare in questionnaires is different from what is found through diaries and waste compositional analysis.
Some socio-demographic variables were found to influence the production of food waste. The results from the present study largely confirmed what emerged in the studies that were conducted by [3,23]. For example, the major determinant of food waste levels was found to be the number of members in a family. Specifically, food waste was found to be higher when more people shared the same house. At the same time, the food waste quantities in these families were lower when per capita quantities were considered. In this regard, food waste quantities were the highest in households comprising of singles or couples without children. This is a result that is widely confirmed in the literature, even being included in studies run through questionnaires [18,22,27]. An interesting socio-demographic determinant of food waste was found in the area of residency, with food waste quantities being found to be significantly lower for families that were living in Northern Italy. The reason for this is not clear, but it could reside in a more developed and widespread system of separate waste collection (64% on average in North Italy against 38% in South based on ISPRA [48]), which could be a driver of higher environmental sensitivity [49]. This inference is perhaps supported by the observation that food waste quantities were lower for families that separated their food waste 100%. However, an in-depth analysis regarding food habits between North and South Italy can be suggested in order to analyze the impact of other possible variables, such as food culture and income. As was the case in the studies by [23,37]; those who indicated that they ate healthy were found to have higher levels of food waste, which was possibly due to the preference for fresh products [37], but seasonality might also have an influence, with a possible higher preference for fresh foods in summer. No differences were found across participant segments with regard to the level of accuracy in perception of food waste, confirming the findings that were reported in the pilot study and hypothesis that had already been made in the literature [27]. In addition, a severe underestimation of food waste quantities persists, even after participants have taken part in the diary experiment, regardless of their profiling in terms of shopping habits and motivation to reduce food waste. This finding is relevant in relation to the efficacy of awareness-raising campaigns as an instrument to reduce households’ food waste, as the cognitive dissonance that seems to cover the issue of food waste might lead the consumer to not consider itself a target of the campaign. Romani et al. [19] ran an interesting and supportive experiment, where the impact of an educational intervention was found to be positive on food waste production in the short term. No studies have been run on the efficacy of campaigns in the long term, to our knowledge—and this might depend on the fact that food waste reduction is a relatively recent topic of debate and policy agenda.
The frequency of shopping was also found to have an impact on food waste quantities, with food waste levels almost doubling for families who shopped once a month or every two weeks. The type of locations visited while shopping was not found to significantly influence food waste levels; in other words, the food waste levels were not different between families who shopped in large retail stores and families who shopped in smaller stores. Surprisingly, making a shopping list itself, as well as assessing the pantry and fridge prior to shopping, was not found to significantly affect food waste quantities. A dedicated analysis and discussion of the relation between shopping habits and food waste can be found in [29].
Contrary to many studies, such as [3,35,50], the frequency of dining out and ordering food at home was also not found to have an impact on food waste in the present study.
Motivation to reduce food waste showed a surprising result: none among the stated answers seems to be related to smaller food waste quantities, or to specific awareness. No meaningful differences in quantities have been recorded among the different options that were selected. In other words, being more sensitive to environmental sustainability does not equate to less food waste, or saving money or teaching to children to eat well. Differently from most of the studies that enquired into the motivations to reduce food waste [31,33,46,51], our study compared the motivation with the average food waste reported in diaries, so they are not result of a respondent’s belief but actual waste. However, the design of our question was actually leading to an ambiguous result, as most of the respondents ranked all of the given answers with maximum values in our Likert scale (assigning much importance to all options). Perhaps, asking them to re-order answers for importance would have been more useful. Accordingly, the result that was obtained might be related to this limitation of the question’s design.
Based on all the findings of the present study, some recommendations need to be formulated at the policy level: as recently suggested from the EU methodology for the quantification of food waste, using diaries or waste compositional analysis is more reliable than questionnaires. Questionnaires reflect intentions but no real quantities. They should be definitely set aside for quantification, which is also the direction that was recently taken by the European Union to monitor food waste quantities. This finding also has implications for awareness raising campaigns if we consider that they could not be so effective if citizens’ are unaware of their own food waste. This implication, as a matter of facts, goes deep in contrast with measures that were proposed and financed in the most recent law known as “Legge Gadda” [52] approved in Italy, which provides financial measures to run TV and radio interventions to raise awareness against food waste, but leave educational campaigns in schools and other forms of interventions with no financial support. Awareness raising campaigns are currently the most widespread measure to tackle food waste at the international level [53].
In addition, the hypothesis that separate waste collection systems encourage food waste reduction may have major implications for waste management policies. In scientific terms, we would recommend implementing a specific study to verify the impact of separate collection on food waste production to eventually confirm the present result.
With reference to behaviors and attitude, some of our results are in contrast with most of the scientific literature—for instance, the role of shopping list and place for shopping in food waste quantities—but, apparently, literature regarding food waste is still at a screening phase, where the results deeply diverge from one another and an increasing number of studies are published [27]. However, it is already known within the scientific community [27,54] that the academic debate is insisting too much on finding individual factors that determine food waste in daily life, at the household stage, and not looking at “system-related” causes (time spent inside home, type of work–life balance, education and awareness in the field of nutrition, logistics of the place of living, etc.). For instance, if the frequency of shopping is a factor determining less waste, a coherent strategy to allow for citizens to shop more frequently could be studied and, from an academic point of view, this opportunity may be explored through different disciplines. Therefore, also based on the results of our random forest that suggest a limited explanatory contribution of the observed variables, we renew our suggestion [29,55,56] to adopt a more holistic approach to the study of food waste, which is able to look at the phenomenon from new perspectives.

5. Conclusions

In conclusion, the most interesting finding from the present study was the confirmation of a highly biased perception of food waste that is produced at home. This has implications both for future studies and for communication strategies in intervention measures. We highly recommend not using questionnaires to assess the quantities and motives, as they seem to reflect positive illusion bias or other forms of cognitive dissonance. Diaries and waste sorting analysis, coupled together, if possible, is highly recommended to produce a reliable quantitative and qualitative assessment. In order to gather other variables that are associated with food waste, we also recommend running ethnographic-type studies, such as Evans’s [55], which might be better able to highlight the meaning associated to food consumption and waste.
The results on socio-demographic determinants of food waste, as well as on shopping habits, mostly confirm the findings reported in the previous literature.
Results from the regression random forest revealed that the considered variables explained only about 30% of the variation in food waste quantities. This suggests that some important drivers of food waste have not been captured in the present study. On the other hand, a more detailed questionnaire, which is able to provide a more comprehensive set of responses, involves the risk of selecting the wrong variables. For this reason, further studies that are focused on the familiar narrative surrounding food are recommended. Running focus groups before the questionnaire is designed or applying alternative methodologies to questionnaires—such as an ethnographic approach, for example—may also prove more capable of identifying and explaining the causes of food waste as compared to questionnaires. The role of environmental education at school may need to be addressed, in addition to other factors that are related to food culture and work–life balance.
In policy making terms, the role that BOGOF and discounted food products have in increasing food waste at home can be questioned, while actions that are aimed at enabling a more frequent food shopping and separate waste collection are envisaged.
However, we highly recommend to couple diaries with waste compositional analysis for further national assessments. A diary contains the embedded limitation of being mediated by the respondent; instead, a third-party assessment does not imply a change in behavior or limitations of diary reporting. Especially with reference to European Union, we suggest updating the waste accounting assessments (waste statistics), run per each Country, by also including the food waste fraction in the compositional analysis.

Author Contributions

C.G. is responsible for conception and design of the study, acquisition and analysis of data. F.A. is responsible for dataset management and the statistical analysis. L.F. is supervisor of the overall research project (REDUCE), and contributed to the conception and design of the study.

Funding

The present work is part of the REDUCE project: Ricerca, EDUcazione, ComunicazionE: an integrated approach for food waste prevention (Ref. RINDEC -2015-0000088), financed by the Ministry of Environment, Land and Sea of Italy. The aim of REDUCE was to quantify, analyze and elaborate measures to prevent food waste in the final stage of the food chain, in order to comply with the waste prevention targets of the EU and the Sustainable Development Goal 12.3. Quantification and analysis of household food waste through diary and questionnaires is task R1.

Acknowledgments

We thank Valeria Verona for her essential contribution to the data entry phase and Giancarlo M. Chiarenza for his precious support in proof reading phase.

Conflicts of Interest

The authors declare no conflict of interest.

References

  1. FAO. Global Food Losses and Food Waste—Extent, Causes and Prevention; FAO: Rome, Italy, 2011; Available online: http://www.fao.org/3/a-i2697e.pdf (accessed on 10 October 2018).
  2. Abeliotis, K.; Lasaridi, K.; Chroni, C. Attitudes and behavior of Greek households regarding food waste prevention. Waste Manag. Res. 2014, 32, 237–240. [Google Scholar] [CrossRef]
  3. Parizeau, K.; von Massow, M.; Martin, R. Household level dynamics of food waste production and related beliefs, attitudes and behaviors in Guelph, Ontario. Waste Manag. 2015, 35, 201–217. [Google Scholar] [CrossRef]
  4. SDG 12.3. n.d. Available online: https://champions123.org/target-12-3/ (accessed on 27 July 2018).
  5. Directive 2018/851 of the European Parliament and of the Council of 30 May 2018, Amending Directive 2008/98/EC on Waste Directive (EU) 2018/851. Available online: https://eur-lex.europa.eu/legal-content/EN/TXT/?uri=CELEX:32018L0851 (accessed on 2 February 2019).
  6. COMMISSION DELEGATED DECISION (EU) 3211 Final of 3rd of May 2019 Supplementing Directive 2008/98/EC of the European Parliament and of the Council as Regards a Common Methodology and Minimum Quality Requirements for the Uniform Measurement of Levels of Food Waste and Annex. Available online: http://ec.europa.eu/transparency/regdoc/rep/3/2019/EN/C-2019-3211-F1-EN-MAIN-PART-1.PDF (accessed on 10 May 2019).
  7. Stefan, V.; Van Herpen, E.; Tudoran, A.; Lahteenmaki, L. Avoiding food waste by Romanian consumers: The importance of planning and shopping routines. Food Qual. Prefer. 2013, 28, 375–381. [Google Scholar] [CrossRef]
  8. Quested, T.E.; Marsh, E.; Stunell, D.; Parry, A.D. Spaghetti soup: The complex world of food waste behaviours. Resour. Conserv. Recycl. 2013, 79, 43–51. [Google Scholar] [CrossRef]
  9. Jörissen, J.; Priefer, C.; Bräutigam, K.R. Food Waste Generation at Household Level: Results of a Survey among Employees of Two European Research Centers in Italy and Germany. Sustainability 2015, 7, 2695–2715. [Google Scholar] [CrossRef] [Green Version]
  10. Vermeir, I.; Verbeke, W. Sustainable Food Consumption: Exploring the Consumer “Attitude–Behavioral Intention” Gap. J. Agric. Environ. Ethics 2006, 19, 169. [Google Scholar] [CrossRef]
  11. Gaiani, S.; Caldeira, S.; Adorno, V.; Segrè, A.; Vittuari, M. Food wasters: Profiling consumers’ attitude to waste food in Italy. Waste Manag. 2017, 72, 17–24. [Google Scholar] [CrossRef]
  12. Camillo, F.; Adorno, V. Lo Spreco Alimentare Nelle Famiglie Italiane; Waste Watcher: Bologna, Italy, 2013. [Google Scholar]
  13. Last Minute Market and SWG. Waste Watcher: Observatory of Italian Household Food Waste 2012; Last Minute Market: Bologna, Italy, 2013. [Google Scholar]
  14. Last Minute Market and SWG. Waste Watcher: Observatory of Italian Household Food Waste 2013; Last Minute Market: Bologna, Italy, 2014. [Google Scholar]
  15. Last Minute Market and SWG. Waste Watcher: Observatory of Italian Household Food Waste 2014; Last Minute Market: Bologna, Italy, 2015. [Google Scholar]
  16. Last Minute Market and SWG. Waste Watcher: Observatory of Italian Household Food Waste 2015; Last Minute Market: Bologna, Italy, 2016. [Google Scholar]
  17. Setti, M.; Falasconi, L.; Segrè, A.; Cusano, I.; Vittuari, M. Italian consumers’ income and food waste behavior. Br. Food J. 2016, 118, 1731–1746. [Google Scholar] [CrossRef]
  18. Fanelli, R.M. Using Causal Maps to Analyze the Major Root Causes of Household Food Waste: Results of a Survey among People from Central and Southern Italy. Sustainability 2019, 11, 1183. [Google Scholar] [CrossRef]
  19. Romani, S.; Grappi, S.; Bagozzi, R.; Barone, A.M. Domestic food practices: A study of food management behaviors and the role of food preparation planning in reducing waste. Appetite 2018, 121, 215–227. [Google Scholar] [CrossRef]
  20. Grosso, M.; Falasconi, L. Addressing food wastage in the framework of the UN Sustainable Development Goals. Waste Manag. Res. 2018, 36, 97–98. [Google Scholar] [CrossRef] [Green Version]
  21. Langley, J.; Yoxall, A.; Heppell, G.; Rodriguez, E.M.; Bradbury, S.; Lewis, R.; Luxmoore, J.; Hodzic, A.; Rowson, J. UK pilot study testing a methodology for compositional domestic food waste analysis. Waste Manag. Res. 2010, 28, 220–227. [Google Scholar] [CrossRef]
  22. WRAP. Household Food and Drink Waste in the UK 2012; Waste and Resources Action Programme: Banbury, UK, 2013; Available online: http://www.wrap.org.uk/sites/files/wrap/hhfdw-2012-main.pdf.pdf (accessed on 11 September 2019).
  23. Koivupuro, H.K.; Hartikainen, H.; Katajajuuri, J.M.; Heikintalo, M.; Reinikaninen, A.; Jalkanen, L. Influence of socio-demographical, behavioural and attitudinal factors on the amount of avoidable food waste generated in Finnish households. Int. J. Consum. Stud. 2012, 6, 183–191. [Google Scholar] [CrossRef]
  24. Silvennoinen, K.; Katajajuuri, J.M.; Hartikainen, H.; Heikkila, L.; Reinikainen, A. Food waste volume and composition in Finnish households. Br. Food J. 2014, 116, 1058–1068. [Google Scholar] [CrossRef]
  25. Edjabou, M.E.; Petersen, C.; Scheutz, C.; Astrup, T.F. Food waste from Danish households: Generation and composition. Waste Manag. 2016, 52, 256–268. [Google Scholar] [CrossRef] [Green Version]
  26. Aschemann-Witzel, J.; De Hooge, I.; Amani, P.; Bech-Larsen, T.; Oostindjer, M. Consumer-Related Food Waste: Causes and Potential for Action. Sustainability 2015, 7, 6457–6477. [Google Scholar] [CrossRef] [Green Version]
  27. Schanes, K.; Dobernig, K.; Gözet, B. Food waste matters—A systematic review of household food waste practices and their policy implications. J. Clean. Prod. 2018, 182, 978–991. [Google Scholar] [CrossRef]
  28. Baker, D.; Fear, J.; Denniss, R. What a Waste: An Analysis on Households Expenditure on Food; The Australian Institute: Manuka, Australia, 2019; Available online: http://www.tai.org.au/sites/default/files/PB%206%20What%20a%20waste%20final_7.pdf (accessed on 10 September 2018).
  29. Giordano, C.; Alboni, F.; Cicatiello, C.; Falasconi, L. Do discounted food products end up in the bin? An investigation into the link between deal-prone shopping behavior and quantities of household food waste. Int. J. Consum. Stud. 2018, 1–11. [Google Scholar] [CrossRef]
  30. Secondi, L.; Principato, T. Laureti Household food waste behaviour in EU-27 countries: A multilevel analysis. Food Policy 2015, 56, 25–40. [Google Scholar] [CrossRef]
  31. Stancu, V.; Haugaard, P.; Lähteenmäki, L. Determinants of consumer food waste behaviour: Two routes to food waste. Appetite 2016, 96, 7–17. [Google Scholar] [CrossRef]
  32. Visschers, V.H.; Wickli, N.; Siegrist, M. Sorting out food waste behaviour: A survey on the motivators and barriers of self-reported amounts of food waste in households. J. Environ. Psychol. 2016, 45, 66–78. [Google Scholar] [CrossRef]
  33. Qi, D.; Roe, B.E. Household food waste: Multivariate regression and principal components analyses of awareness and attitudes among US consumers. PLoS ONE 2016, 11, e0159250. [Google Scholar] [CrossRef] [PubMed]
  34. Aschemann-Witzel, J.; Jensen, J.H.; Jensen, M.H.; Kulikovskaja, V. Consumer behavior towards price-reduced suboptimal foods in the supermarket and the relation to food waste in households. Appetite 2017, 116, 246–258. [Google Scholar] [CrossRef] [PubMed]
  35. Evans, D. Beyond the Throwaway Society: Ordinary Domestic Practice and a Sociological Approach to Household Food Waste. Sociology 2012, 46, 41–56. [Google Scholar] [CrossRef]
  36. Giordano, C. Assessing Household Food Waste in Italy: A Methodology for Detecting Drivers and Quantities. Ph.D. Thesis, Department of Agricultural and Food Sciences, University of Bologna, Bologna, Italy, 2016. Available online: http://amsdottorato.unibo.it/7567/ (accessed on 12 January 2019).
  37. WRAP WE DON’T WASTE FOOD! A Householder Survey. Exodus Research 2007. Available online: https://www.yumpu.com/en/document/read/40583001/we-dont-waste-food-a-householder-survey-wrap (accessed on 10 September 2018).
  38. Tversky, A.; Kahneman, D. Availability: A heuristic for judging frequency and probability. Cogn. Psychol. 1973, 5, 207–232. [Google Scholar] [CrossRef]
  39. Festinger, L. A Theory of Cognitive Dissonance; Stanford University Press: Palo Alto, CA, USA, 1957. [Google Scholar]
  40. Giordano, C.; Piras, S.; Boschini, M.; Falasconi, L. Are questionnaires a reliable method to measure household food waste? Br. Food J. 2018, 120, 2885–2897. [Google Scholar] [CrossRef]
  41. ISTAT Rapporto Annuale 2016 La Situazione del Paese. 2016. Available online: https://www.istat.it/it/files//2016/04/Cap_2_Ra2016.pdf (accessed on 12 January 2019).
  42. OECD-FAO. OECD-FAO Agricultural Outlook 2017. Available online: http://stats.oecd.org/Index.aspx?datasetcode=HIGH_AGLINK_2017 (accessed on 12 January 2019).
  43. WRI, Food Loss and Waste Accounting and Reporting Standard. World Resource Institute: Washington, DC, USA, 2016. Available online: http://flwprotocol.org/wp-content/uploads/2017/05/FLW_Standard_final_2016.pdf (accessed on 19 January 2018).
  44. Stenmarck, A.; Jensen, C.; Quested, T.; Moates, G. Estimates of European Food Waste Levels; FUSIONS, 2016; Available online: https://www.eu-fusions.org/phocadownload/Publications/Estimates%20of%20European%20food%20waste%20levels.pdf (accessed on 19 March 2016).
  45. Strobl, C.; Boulesteix, A.L.; Zeileis, A.; Hothorn, T. Bias in random forest variable importance measures: Illustrations, sources and a solution. BMC Bioinform. 2007, 8, 25. [Google Scholar] [CrossRef]
  46. Neff, R.A.; Spiker, M.L.; Truant, P.L. Wasted Food: U.S. Consumers’ Reported Awareness, Attitudes, and Behaviors. PLoS ONE 2015, 10. [Google Scholar] [CrossRef]
  47. Monier et al. Preparatory Study on Food Waste. Final Report. EC_ DG ENV; BIOis 2010. Available online: http://ec.europa.eu/environment/eussd/pdf/bio_foodwaste_report (accessed on 15 October 2016).
  48. ISPRA. Rapporto Rifiuti Urbani Ed. 2017. Available online: http://www.isprambiente.gov.it/files2017/pubblicazioni/rapporto/RapportoRifiutiUrbani_Ed.2017n.273_Vers.Estratto_agg06_11_2017.pdf (accessed on 12 January 2018).
  49. Bernstad, A. Household food waste separation behavior and the importance of convenience. Waste Manag. 2014, 34, 1317–1323. [Google Scholar] [CrossRef]
  50. Ganglbauer, E.; Fitzpatrick, G.; Comber, R. Negotiating food waste: Using a practice lens to informdesign. ACM Trans. Comput.-Hum. Interact. 2013, 20, 2. [Google Scholar] [CrossRef]
  51. Graham-Rowe, E.; Jessop, D.C.; Sparks, P. Identifying motivations and barriers to minimizing household food waste. Res. Conserv. Recycl. 2014, 84, 15–23. [Google Scholar] [CrossRef]
  52. Gazzetta Ufficiale della Repubblica Italiana, Law n. 166 of the 19 August 2016 (Legge Gadda against Food Waste). Available online: https://www.gazzettaufficiale.it/eli/id/2016/08/30/16G00179/sg (accessed on 4 April 2019).
  53. Fanelli, R.M.; Di Nocera, A. How to implement new educational campaigns against food waste: An analysis of best practices in European Countries. Econ. Agroaliment./Food Econ. 2017, 19, 223–244. [Google Scholar] [CrossRef]
  54. Evans, D. Blaming the consumer once again: The social and material context of waste. Crit. Public Health 2011, 21, 429–440. [Google Scholar] [CrossRef]
  55. Cicatiello, C.; Giordano, C. Measuring household food waste at national level: A systematic review on methods and results. CAB Rev. Perspect. Agric. Vet. Sci. Nutr. Nat. Resour. 2019, 13, 1–8. [Google Scholar] [CrossRef]
  56. Mourad, M. Recycling, recovering and preventing “food waste”: Competing solutions for food systems sustainability in the United States and France. J. Clean. Prod. 2016, 126, 461–477. [Google Scholar] [CrossRef]
Figure 1. Comparison between the Italian population (ISTAT 2016) and our panel (2017), split in the presence of children and macro-regions.
Sustainability 11 03381 g001
Figure 2. Edible food waste quantity, split in product and reason (average).
Sustainability 11 03381 g002
Figure 3. Attitudes and values of the respondents, revealed in response to the question: “Which of the following motivations might encourage you to reduce your food waste?”
Sustainability 11 03381 g003
Figure 4. Variable importance plot resulting from the random forest. The more the accuracy of the random forest decreases due to the permutation of a single variable, the more important that variable is deemed: hence, variables with a large mean decrease in accuracy (household size and region) are more important for classification of the data.
Sustainability 11 03381 g004
Figure 5. Difference between response provided (blue section) and FW average estimated from diaries (blue + red sections).
Sustainability 11 03381 g005
Table 1. Frequent causes for wasted products.
CausesFraction Out of Total Edible Waste (in Percentage)Wasted Quantity (Average, grams/amily/week)Wasted Quantity (Average, grams/per capita/week)
Spoiled45.8560.6250.9
Personal preferences (I don’t like it)25.8316.1137.8
Cooked or served too much18.2223.498.0
Children’s leftovers5.769.520.3
Other2.429.211.9
Accidental (burnt, felt on floor, etc)1.822.09.2
Bought too much/ shopping mistake0.33.51.8
Total100.01224.4529.9
Source: [29]. The table is very similar to [29], since the two samples differ only for three units. Therefore, the total food waste average is 530 g per person per week in both cases and very slight variations are reported in these values.
Table 2. Presence of a separated waste disposal system and FW average.
Food Disposed Separately (%)Number of FamiliesFood Waste Average Per Person (g)
0–5084610.4
50–7570662.3
75–100134537.8
100100359.2
Total388529.9
Table 3. Variables impacting on food waste quantities according to the present study.
Variables AnalyzedImpact on Food Waste Production, Per Capita (Yes/NO)
Demographics—number of components of the householdY
Demographics—having children Y
Demographics—location (North, Center, South of Italy)Y
Shopping habits—frequency of shopping (see [29]Y
Consumption habits and diets—eating healthyY
Disposal of wasted food—separate collection system Y
Shopping habits—buying discounted food productsN
Shopping habits—place of shopping (see [29]N
Shopping habits—preparing a list(see [29])N
MotivationsN
Consumption habits and diets- eating outN
Table 4. Answers to the question: “After the experiment, how much food do you think your family wastes weekly?”.
Provided OptionsNumber of Families That Selected the OptionAverage FW of Group of Respondents
0–200 g1411010.9
201–500 g1671301.7
501–800 g591484.9
801–1000 g161235.4
More than 1000 g51551.8
Total3881224.4

