1. Introduction
With the acceleration of industrialization and urbanization, energy and environmental issues that seriously affects human survival and development have become the focus of the entire world. Among various kinds of energy and environmental issues, air pollution is of the most public concern [
1]. Emissions of conventional fuel vehicles (CFVs) is a major source of air pollution, and the most representative one in recent years is the continuous severe haze weather which has been reported recently in China [
2]. Meanwhile, the uptake of CFVs causes growing oil demand, which aggravates the energy shortage problem. According to the prediction of the International Energy Agency, oil consumption of global transportation in 2030 will be reached at 32 million tons, accounting for about 55% of total oil consumption. As the largest developing country, China in the current development stage needs a large amount of energies (e.g., coal, oil, and natural gas). Given the above backdrop, finding a feasible approach to alleviate the air pollution and oil consumption carries enormous significance. In the transport sector, there are usually two ways to solve this problem. One is improving the energy efficiency of internal combustion engines, and another is the widespread use of alternative energies (e.g., wind, solar, and nuclear) [
3]. Electric vehicles (EVs), which are powered by electricity, are of high energy efficiency and are promoted large-scale in the transport sector to address present energy and environment problems [
4]. In China, the EV promotion goal—that the combined production and sales volume of EVs from 2012 to 2020 should exceed 5 million—has already been proposed by the Industry Development Plan of Energy saving and New Energy Vehicles. In order to fulfill such a goal, numerous policy incentives have been issued by both national and local government.
These policy incentives can be divided into four types, and they mainly focus on EV purchasing, registering, driving, and charging stages, respectively [
5]. The first category (EV purchasing) is incentives that stimulate consumers in the purchasing stage. They include government subsidies, purchase tax exemption, vehicle use tax exemption, and insurance discounts. Giving government subsidies is the earliest incentive policy in China, and it was first launched by an EV demonstration project (“Ten Cities, One Thousand Vehicles”) in 2011 [
4]. The rapid development of EVs in recent years depends largely on this policy [
6]. In order to support EVs with more advanced technology, government decreases the subsidy and improves the subsidy criteria year by year, and the subsidy is planned to cancel in 2020. Purchase tax exemption and vehicle-use tax exemption were launched in 2014 and 2011, respectively, and they focus on reducing EV purchasers’ tax burden since the high purchasing price of EVs result in heavier taxes compared to that of similar CFVs. Insurance discount only refers to the mandatory traffic liability insurance, and is not implemented across the country. Only purchasers in several cities (e.g., Xi’an and Hefei) have such privileges. The second category (EV registering) provides convenience for purchasers to register their EVs, and these incentive policies contain no purchasing restriction, vehicle registration fee exemption and dedicated registration channel, and dedicated license plates. In order to solve the problem of urban traffic congestion and to alleviate traffic pressure, some large cities have adopted the purchase restriction policy to control the increasing ownership of cars [
7]. However, consumers who intend to purchase EVs are not restricted. In the following registration for EVs, purchasers in some cities can enjoy the dedicated channel and do not need to pay registration fees. Moreover, the license plates of EVs are mostly green in color, and this is quite different from CFVs’ blue license plates. The third category (EV driving) gives EV purchasers some privileges during driving, and these incentive policies refer to no driving restriction, parking benefits, road/bridge toll exemption, and vehicle inspection fee exemption/dedicated inspection channel. Some megapolis have implemented driving restriction policies, such as vehicles with odd or even numbers are banned from driving in Beijing, but EV drivers are not limited by this restriction [
8]. Parking benefits are mainly implemented in the public parking lots, and EV drivers can park for free if the parking time is no more than 1 to 2 h. Road/bridge toll exemption refers to exempting the tolls for some specific roads, such as the expressway. Vehicle inspection fee exemption/dedicated inspection channel provides convenient service and reduces the cost for EV owners when they conduct the periodical inspection. The final category (EV charging) covers charging infrastructure construction subsidy and charging discount. The former encourages the construction of EV charging infrastructures so as to meet the fast charging demand caused by the rapid growth of EV ownership, and the later aims to further reduce the driving cost of EVs since the price of electricity is relatively lower than that of oil [
9]. As we can see, the above four categories encourage people to adopt EVs from various aspects, and they play crucial roles in promoting EVs.
Under the stimulation of above incentive policies, the ownership of EVs in China reaches 2.61 million according to the report of Ministry of Public Security, and is now the top in the world. However, compared with other countries, the share of EVs in China, which is no more than 10% of the automobile market, is still very low [
10]. For example, Norway is the biggest country for the EV market share in the world, and its EVs account for over a half of the automobile market [
11]. One significant reason resulting in the fast development of EVs in Norway is the generous incentive policies which attract private customers from various aspects [
12]. Studies showed that the success of one emerging technology product relies on the acceptance of customers, and present low market share of EVs in China is concerned with individual low purchasing intention [
13]. Considering the performance of EVs (e.g., driving range and charging time) could not develop rapidly, EV-related incentive policies drive individual purchasing intention to a large extent, thereby promoting EV market share. Therefore, understanding the effectiveness of policy incentives on the uptake of EVs in China, the focus of this paper, carries enormous significance. For one thing, it could supplement present studies since most of them focus on the effectiveness of individual EV adoption intention rather than adoption behaviors; for another, it could provide references for policy makers to adjust and improve future incentives. Based on the foregoing analysis, the main objective of this paper is to analyze the effect of policy incentives on the uptake of electric vehicles in China by using a panel regression analysis. In addition, the differences and similarities between the effect of policy incentives on adoption intention and behavior are also discussed. The rest of the paper is structured as follows:
Section 2 presents a review of related literatures;
Section 3 reports the selection of dependent variables and independent variables as well as the data collection; results are described in
Section 4 and then discussed in
Section 5; the last section concludes.
2. Literature Review
In order to promote EVs effectively, countries around the world have launched numerous incentive policies. Presently, there are some studies that have summarized and reviewed EV-related policies for one country, such as China [
14], Japan [
15], the United States [
16], Germany [
17], Lithuania [
18], Norway [
12], Austria [
19], and so on. Policy contrasts between different countries have also been conducted. For examples, Zhang et al. (2014) [
8] compared EV-related polices among Japan, the United States, and Europe from the aspects of financial incentives, technical support, and charging infrastructure. They suggested that countries should learn successful experience from each other, and launch EV incentive policies in combination with their social and economic characteristics. After comparing financial incentives in encouraging the adoption of EVs in China, Japan, the United States, and Europe, Zhou et al. (2015) [
20] found the increase of EV market share in each country is accompanied with the launch of incentive policies. In order to further analyze EV-related policies, some studies divided them into several types so as to distinguish their content and characteristic. For examples, Zhang et al. (2014) [
21] suggested that present EV incentive policies include pilot schemes, financial subsidies, tax reduction/exemption, and R&D investment; in the study of Yuan et al. (2015) [
22], these policies refer to industrial development, development plans, demonstration projects, fiscal subsidies, and tax incentives; similar to the above two studies, Li et al. (2016) [
5] further divided them into seven categories, and they are macroscopic, demonstration, subsidization, preferential tax, technical support, industry management, and infrastructure.
As for EV-related policies in China, Fang and Hu (2009) [
23] believed that EVs in China are still in the initial development stage. Compared with CFVs, the purchasing price, driving range, charging time, and charging infrastructures of EVs are still in an inferior position. So, there is urgent need for the government to launch relevant incentive policies. Chen et al. (2010) [
24] suggested that EVs are the inevitable choice for a low-carbon economy and the future development direction of the automotive industry, and EV relevant incentive policies are the direct driving force of EV industrialization. Li and Chen (2018) [
25] put forward that EV incentive policies need to focus on three aspects: First, supporting R&D for key technologies and vehicle parts; second, making efforts to achieve large-scale application; third, innovating government management system according to the national energy development target as well as energy conservation and emission reduction plan. Chen et al. (2010) [
26] believed the government needs to create a favorable external environment to realize large-scale development of EVs from the aspects of central and local subsidies, government procurement, and tax relief. Yuan and Yang (2010) [
27] analyzed the problems of the EV market through the perspective of technology and economy, and suggestions were proposed to formulate macro strategies, to improve infrastructures, and to develop key technologies. Wei and Guo (2014) [
28] suggested that there are excessive control tools and insufficient internal policy tools in existing EV incentive policies. Perfecting existing policies could introduce the concept of “new governance”, which can be interpreted as policy tools could be more marketization- and socialization-oriented. To be specific, marketization-oriented policies promote internal motivation of enterprises to develop EVs, and the synergy development between EVs and society could be improved through socialization-oriented policies. Xie and Tian (2015) [
29] analyzed the content of policy texts related to China’s EV industry from two dimensions: policy tools and innovation value chain. Results showed governments pay more attention to R&D and market promotion, while they ignore the industrialization. In the future, the development of the EV industry could be continuously improved by supply policies (e.g., infrastructure construction), environment policies (e.g., EV-related laws) and demand policies (e.g., government procurement). Chen and Zhang (2013) [
30] illustrated that there are some problems in the present incentive policies, such as excessive regulation and target planning policies, lack of demand-oriented policies, and unreasonable policy structure. Future policies could pay more attention to talent cultivation, R&D, infrastructure construction, financial support, and tax relief to get rid of present dilemmas.
From these studies, we can see that present incentive policies concern various aspects to develop and promote EVs. Since the large-scale promotion of EVs relies on the acceptance of private consumers, many studies focused on analyzing the effect of incentive policies on individual adoption behavior. However, present EVs only account for a small part of all automobiles, so finding EV owners as the research object is relatively difficult and is of high cost. Existing studies generally select other groups as alternatives, such as consumers in 4s stores [
31], individuals who once experienced EVs [
32], and individuals who are interested in or well understand EVs [
18]. Finding respondents in these groups is representative, but it is difficult to analyze the adoption behavior in that they are not EV owners or drivers. Thus, existing studies focused more on individual adoption intention rather than actual adoption behavior. In most of these studies, incentive policies are regarded as a positive role in facilitating individual adoption intention of EVs, and results of Ko and Hahn (2013) [
33] showed that this effect was found to increase when more powerful policies were issued. According to the results of Aasness and Odeck (2015) [
34], from the economic standpoint, EV-related incentive policies can help drivers reduce the purchasing and driving cost, and EV purchasers are mainly influenced by these economic stimulations. In addition, studies showed that the effect of incentive policies differs a lot. For examples, consumers prefer one-way subsidy rather than installments [
35]; incentive policies that can reduce purchasing cost of EVs (e.g., purchasing subsidy and purchasing tax exemption) are more powerful than others [
10]; some incentive policies (e.g., road/bridge toll exemption and driving privilege for bus lanes) only affect individuals within specific groups [
12]. There are also studies showed that the positive effect of incentive policies on the adoption intention is lower than we expected. For instances, Hoen and Koetse (2014) [
36] suggested that although incentive policies can improve individual adoption intention, they cannot eliminate public doubt about key defects of EVs (e.g., short driving range, long charging time, and insufficient charging infrastructures). Green et al. (2014) [
37] further believed that present incentive policies that aim at realizing the large-scale application of EVs are of high operation cost and low efficiency, since these incentives need to satisfy the demand of mainstream consumers.
Intention, a prior physiological factor, has direct effect on adoption behavior of EVs, but someone with high adoption intention may not adopt EVs since there are lots of psychological factors that may work. These factors include perceived behavioral control, social influence, symbols, values, lifestyle, and so on [
10]. Perceived behavioral control refers to control belief stemming from inner and outer force [
38]. Someone who intends to purchase EVs need to estimate their confidence and abilities to drive EVs in daily life; if they have insufficient confidence or abilities, their purchasing intention may not convert to actual behavior [
39]. Social influence denotes that people’s behavior can be influenced by others around them [
40]. For example, someone who has strong intention to purchase EVs may be neutralized by others’ negative opinion towards EVs. Symbols mean that people who have one specific product can reflect their self-image and social status to some extent [
41]. People who drive EVs are labeled as “energy saving,” “environment protection,” and “emissions reducing” [
42]. If someone does not want to be given such labels, their purchasing intention maybe weakened. Values are generally regarded as the criterion that people use to evaluate and choose a specific behavior as well as to estimate themselves and others. Values can reflect people’s sense of what is right or wrong, and then influence their choices [
43]. For example, egoistic values may hinder the adoption of EVs since environmental attributes of EVs benefit others more than the users. Lifestyle can be interpreted as the interests, opinions, behaviors, and behavioral orientations of an individual or a group [
44]. If EVs are inconsistent with people’s lifestyle, they may refuse to adopt. Because of the above factors, it is difficult to understand the direct contact between incentive policies and individual adoption behavior. In order to solve this problem, some studies focused on individual adoption behavior by using some other methods. One is finding EV owners/drivers and collecting surveying data from them. This method can only be applied in countries/regions with high EV market share, such as Norway, otherwise it is impossible to find enough respondents. Bjerkan et al. (2016) [
12] evaluate the effect of incentive policies on individual adoption behavior by using surveying data from 3400 EV owners in Norway. Results showed that exemptions of added-value tax and purchase tax had the most influence resulting in individual adoption behavior. Another method is using statistic data (e.g., EV ownership) as an alternative, and this method can be applied in countries whereby EVs are not very popular. For examples, Wang et al. (2017) [
45] utilized a multiple linear regression model to analyze EV sales with incentive policies of 41 pilot cities in China. Results showed that license fee exemption, no driving restriction, and giving priority to charging infrastructure construction are the most effectiveness policies. Ma et al. (2017) [
46] established a multivariate co-integration model and an error correction model to analyze the long/short-term effects of incentive policies in China. Results illustrated positive co-integration for the relationship between EV market share and incentive policies (i.e., purchasing subsidy, tax exemption, no purchasing restrictions, and no driving restrictions). As we can see, the effect of incentive policies on adoption behavior is different from that on adoption intention. Present studies that analyze the effect of incentive policies in China generally focus on adoption intention rather than adoption behavior since it is very hard to find enough EV owners. Therefore, a more comprehensive study which incorporates bigger sample size should be conducted to evaluate the effect of different incentive policies on EV diffusion.
3. Methods
3.1. Panel Regression Method
As we mentioned in the former section, there are usually two ways to collect EV adoption data. One is collecting surveying data from EV owners/drivers, and another is using statistic data (e.g., EV sales volume). We tried to use the former method, but it was difficult to find enough representatives. Most of the survey participants were potential purchasers, and we could nor analyze EV adoption through such a sample. Thus, our previous studies, such as Li et al. (2016) [
5] and Li et al. (2018) [
3], mainly concerned the effect of policy incentives on EV adoption intention. Since results through analyzing actual adoption were of more implications, we tried to use statistic data. Statistic data can generally be divided into three types, and they are cross-sectional data, time-series data, and panel data. If we constructed time series regression models, the data length was relatively shorter since EV promotion began from the year 2011 and only annual data were available. Cross-sectional regression models were also not very suitable since the sample size was relatively small (cities that have public adoption data of EVs are limited). Considering panel regression models can include more data, their results are able to provide better explanations and are more generalizable. Therefore, panel regression methods are more suitable than the above two methods and we used such methods to analyze the effect of policy incentives on the uptake of EVs. Although there are already some studies, such as Wang et al. (2017) [
45] and Ma et al. (2017) [
46], using EV adoption as the object, they generally discuss a part of inventive policies and their studies still have some deficiencies. For example, the time span of data in the study of Wang et al. (2017) [
45] is relatively short (from year 2013 to 2014), and the sample in the study of Ma et al. (2017) [
46] only consists of six cities, which is not very representative. Therefore, a more comprehensive study which incorporated a bigger sample size was conducted to evaluate the effect of different incentive policies on EV diffusion in this paper.
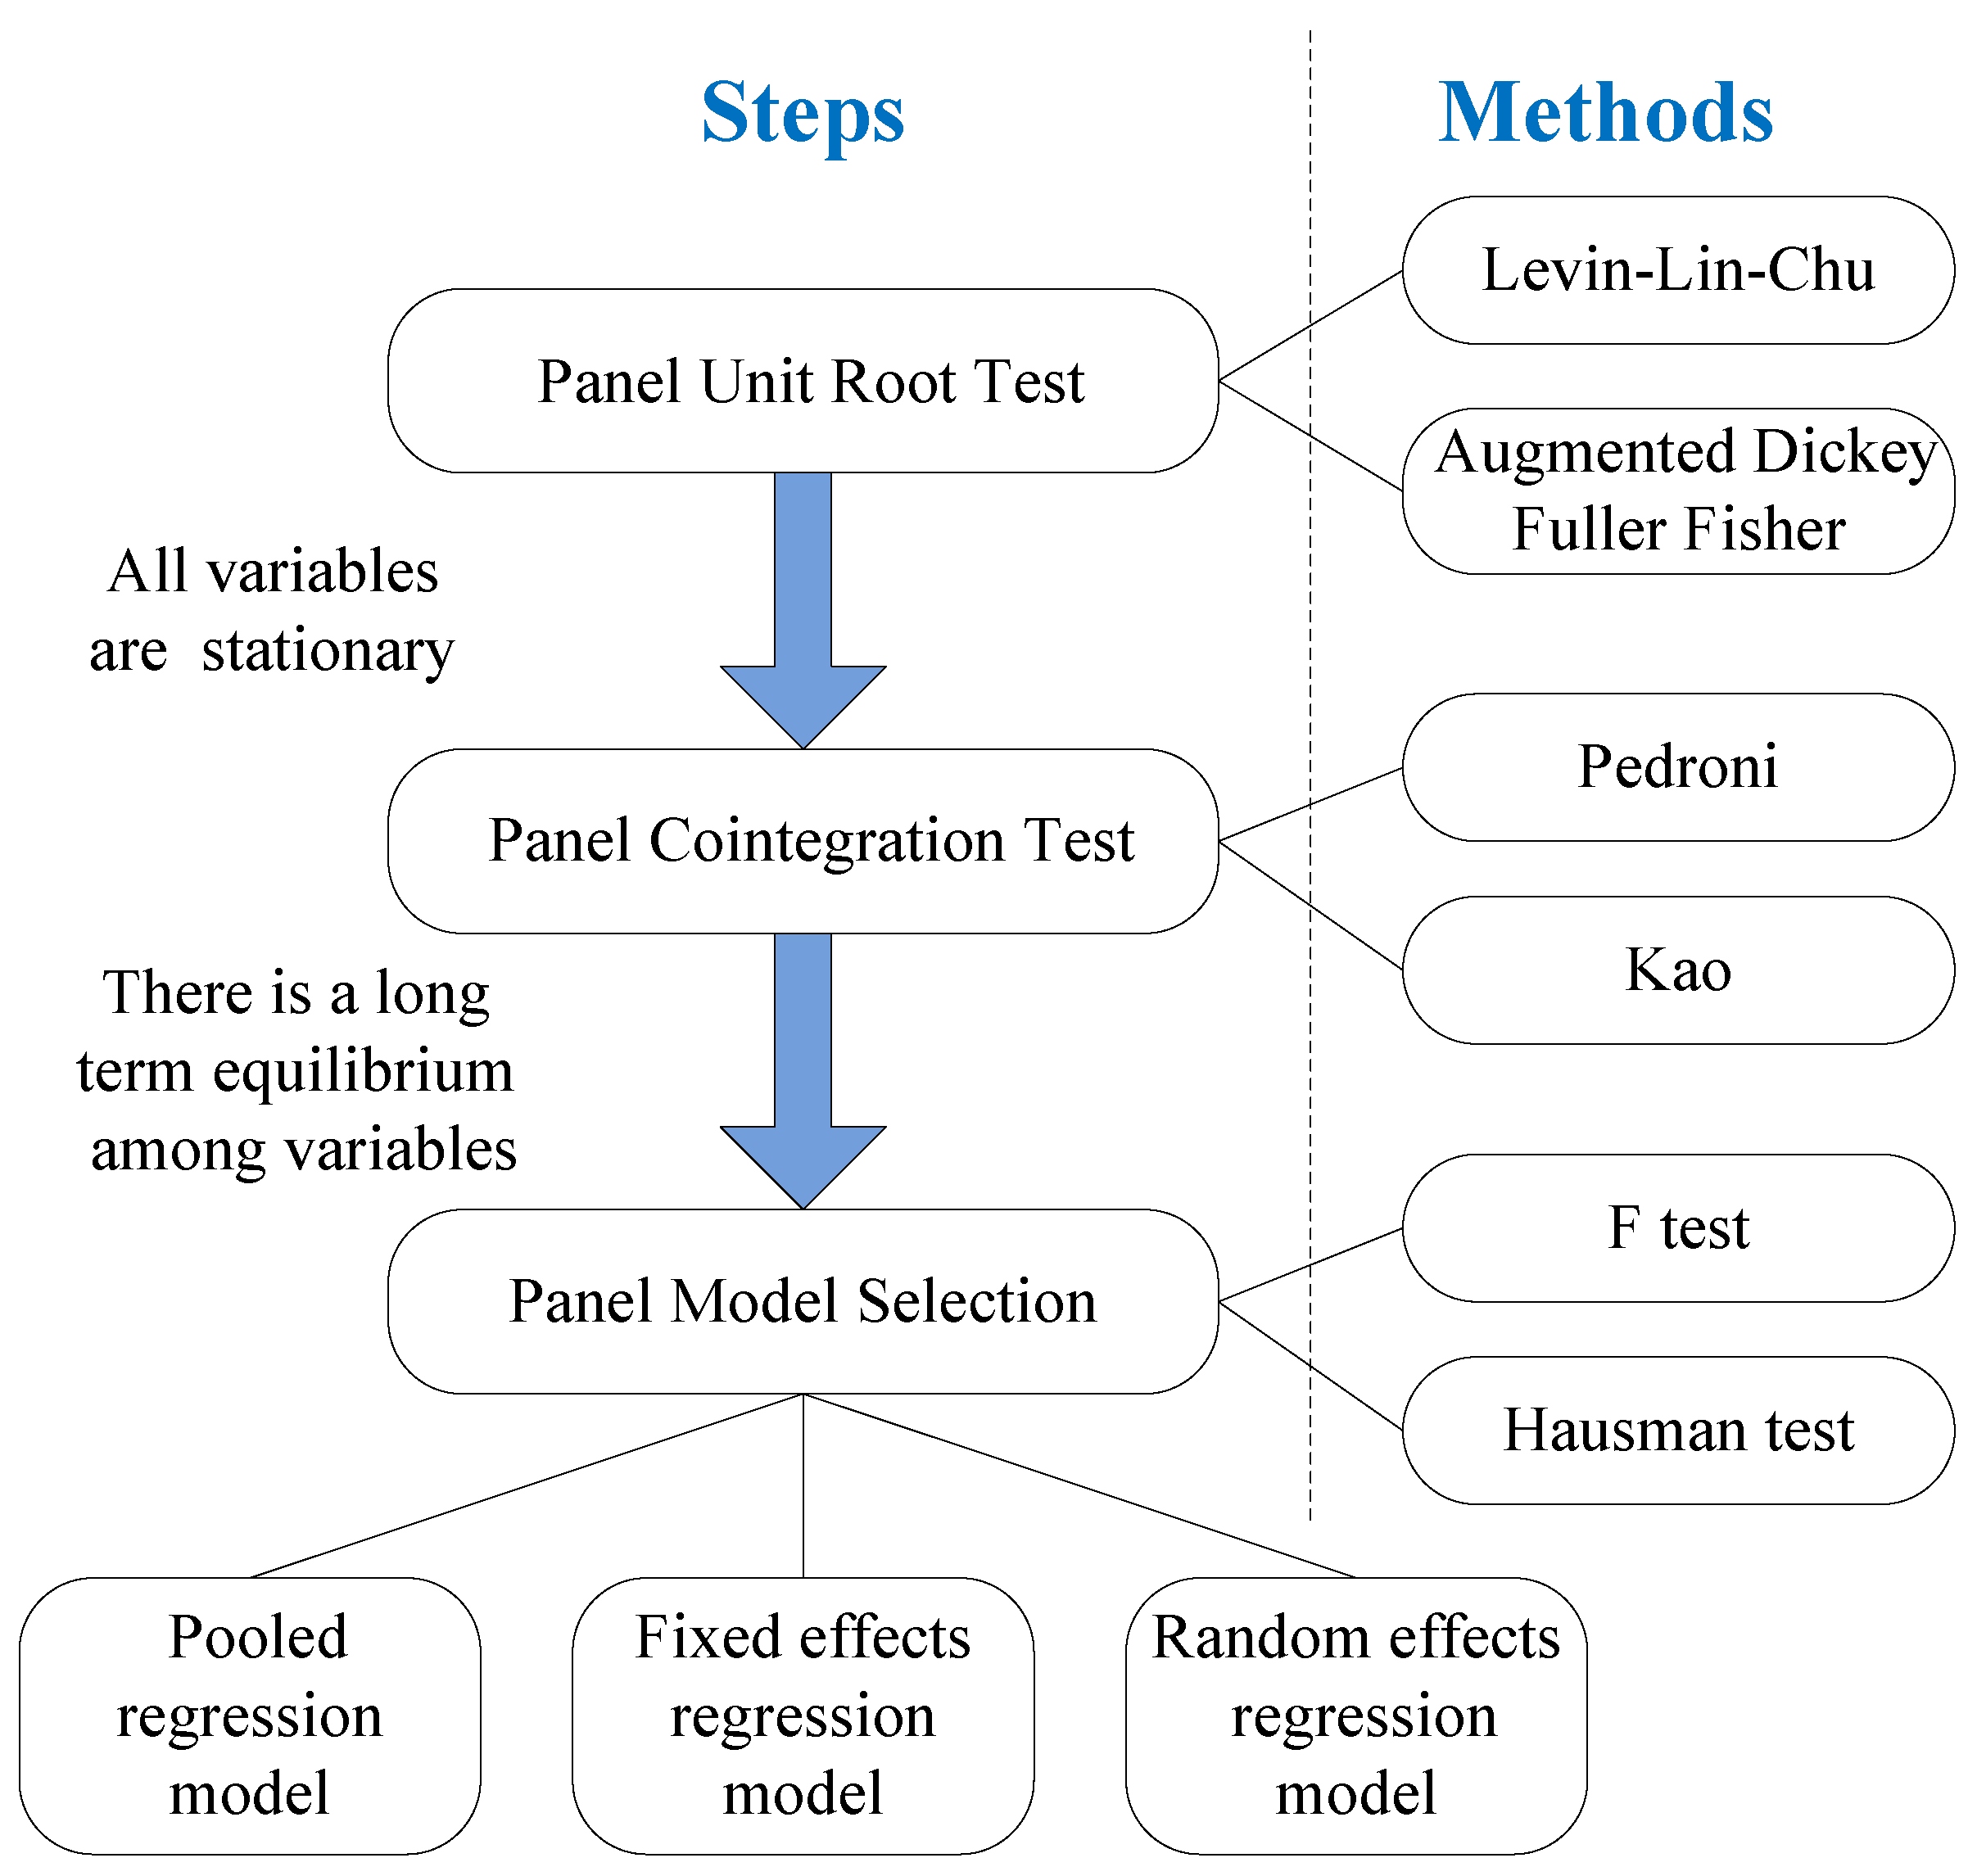
Steps of constructing a panel regression model are presented below in detail, which can also be seen in
Figure 1. For starters, the stationarity of each variable needed to be examined in order to avoid spurious regression. If non-stationary variables were used to construct the regression model directly, even if the value of R square was high, the regression results might have little practical significance [
46]. Levin-Lin-Chu (LLC) and Augmented Dickey Fuller Fisher (ADF-Fisher) are two methods that are usually used to judge unit root of panel data. If test results of the two methods both showed that the null hypothesis (i.e., there is a unit root) was rejected, it suggested that the variable was a stationary series; otherwise it was a non-stationary series. When a variable was non-stationary, we analyzed the stationarity of the first order difference of this variable. If the first order difference was still non-stationary, we had to conduct the second order difference. By that analogy, when the result showed that it was stationary, the unit root test stopped. Second, after ensuring all variables were stationary, the co-integration test was needed to evaluate whether there was a long-term equilibrium among them [
45]. Pedroni and Kao methods are two methods that are widely used in a co-integration test. If variables passed the co-integration test, it suggested that there was a long-term equilibrium among them. We could then construct panel regression models to get accurate regression results. The final step was to select a suitable panel regression model. There are usually three types of panel regression models, and they are: pooled regression model, fixed effects regression model, and random effects regression model [
46]. In selecting the type of panel regression model, we used the F test to decide whether to select the pooled regression model or fixed effects regression model, and then used the Hausman test to determine whether the random effects model or the fixed effects model should be established.
3.2. Dependent Variable and Independent Variables
The dependent variable was the EV market share of each city, and the independent variables included EV incentive policies and socio-economic factors. EV incentive policies referred to those that are implemented in the public domain; those which are the same in all cities were not included in the independent variables. Socio-economic factors included population size, disposable income per capita, charging stations, and oil price. The dependent and independent variables are presented in
Table 1.
Presently, automobile purchase restriction and driving restriction are two ways that are widely used to alleviate traffic pressure in large cities. Since these policies are implemented in parts of the sample cities, which can be seen in
Table 2, they cannot be treated as dummy variables. Considering that EVs are not limited by these two restrictions, EV owners can save lots of costs (e.g., license auction cost and cost selecting other travel modes). Therefore, savings under each incentive policy can be used as alternatives to measure these two policies. The reasons are presented below in detail.
3.2.1. No Purchasing Restriction
Automobile purchase restriction can be divided into two types: license plate lottery and license plate auction. The former means the acquisition of a license plate depends on luck; the latter means someone who wants to get a license plate has to pay the highest auction price [
46]. In reality, these two restrictions are always implemented at the same time in some cities (i.e., Guangzhou, Shenzhen, Tianjin, and Hangzhou), and consumers can acquire a license plate through any way. Specially, the automobile purchase restrictions of Beijing and Shanghai are quite different from that of other cities, and consumers in these two cities only have one way to obtain a license plate. That is, consumers in Beijing have to join the license plate lottery, and in Shanghai consumers have to participate in license plate auction. The cost of acquiring a license plate through auction can be evaluated quantitatively, and is basically equal to the auction price [
46]. As for license plate lottery, the cost mainly refers to the time waiting for the lucky day to get a license plate. Since the cost of waiting time is difficult to measure and previous studies showed that time cost has no significant impact on individuals, this paper only took the cost of the license plate auction into consideration. In the panel regression model, the auction cost of the license plate referred to average auction price, and the value of cities without automobile purchase restriction was taken as 0. In addition, since license plate auction is not implemented in Beijing, this city was not included in the sample when analyzing the effect of no purchasing restriction incentive.
3.2.2. No Driving Restriction
Traffic restriction mainly refers to vehicles that are not permitted to drive on the road in accordance with some conditions, and it includes restrictions based on the last digit of license plate numbers (e.g., traffic restrictions based on even- and odd-numbered license plates), specific time periods (e.g., trucks are not permitted to drive in the center areas of some cities during peak hours), and specific areas (e.g., vehicles are not permitted to drive in scenic spots). It can be seen that the impact of traffic restriction on consumers mainly refers to the restriction time in which consumers cannot drive their cars. In order to quantitatively measure the cost of traffic restriction, the rental cost of a car in the traffic restriction time period was taken as the alternative. Based on methods of Wang et al. (2017) [
45] and Ma et al. (2017) [
46], traffic restriction cost can be modeled as follows:
where
PRCt is the annual driving restriction cost of city
t, and
kt is restriction days of city
t in one week.
Qt is the rental cost and it depends on the local income and price level. In this case, the annual driving restriction cost equals to the product of restriction days and car rental cost, and the value of cities without traffic restriction was set as 0. In addition, traffic restrictions in some cities are only implemented in parts of roads and areas, and the impact of them is limited. In order to precisely analyze the impact of traffic restriction, cities with partial traffic restrictions were not included in the sample, and they refer to Hangzhou, Jinan, Nanchang, Wuhan, Changchun, and Chengdu.
3.2.3. Other Incentive Policies
Other incentive policies include government subsidy, purchase tax exemption, vehicle use tax exemption, dedicated license plate, parking benefits, road/bridge toll exemption, infrastructure construction subsidy, and charging discount. Government subsidy was regarded as a numeric variable, and the value of it equaled to the summary of national, provincial, and city level subsidies. Except for government subsidies, others were all regarded as true/false binaries. The value of these incentive policies was assigned as 1 if they were implemented in a city, otherwise it was 0.
3.2.4. Socio-Economic Factors
Since individual adoption intention of EVs is also influenced by other factors, it is necessary to include such variables to improve the explanatory power of panel regression models. In this paper, we selected population size, disposable income per capita, charging stations per million square kilometers, and oil price as control variables. We selected these variables for the following reasons. For starters, emerging technology products generally begin to be loved in the metropolis. Population size can reflect the city size to a large extent, so it was included in our model. Second, private cars are big-ticket items for most families, and the price of EVs is higher than that of CFVs with similar performance. Considering this, individual consumption ability is a significant influence, and we selected disposable income per capita to reflect this factor. Third, present EVs support short distance travel (about 150 to 200 km), and the convenience of charging wins wide attention by consumers. Sufficient charging stations can help EVs achieve long-distance travel, so this factor should also be considered. The number of charging stations cannot directly reflect the difference among cities, and we selected charging stations per million square kilometers as the alternative. Finally, compared with CFVs, the driving cost of EVs is lower. Since the price of electricity is relatively stable, the price of oil decides the cost savings of driving EVs. Present oil price differs among provinces, we also took this factor into consideration.
3.3. Data Collection
After ensuring the dependent variable and independent variables, statistics data was needed to construct panel regression models. The data were collected mainly from government portal websites and relevant statistical yearbooks. To be specific, the EV ownership and charging stations of each city came from Yearbook of Energy-Saving and New Energy Vehicles 2011 to 2017; purchasing restriction cost was the mean value of the license plate lottery price which can be found by the car indicator management system; restriction days were obtained by checking the traffic control policies on the websites of traffic management bureaus; government subsidies was the summary of national, provincial, and city level subsidies, and these data can be obtained from detailed rules for implementing financial subsidies to promote EVs or similar documents; other incentive policies were confirmed by checking related documents of EVs in each cities’ government portal websites; oil price was collected from the website of China Association of Petroleum Enterprises; population size and disposable income per capita came from the website of National Bureau of Statistics, China Statistical Yearbook (2011–2017), and Statistical Yearbook of each city (2011–2017). In this process, we found some cities had insufficient data. If cities lacked too much data, they were excluded in our sample. If there were a few missing data, we used an interpolation method to supplement them. We found that the data of 43 cities was available, and they were included in our sample. These cities included Beijing, Shanghai, Tianjin, Chongqing, Changchun, Dalian, Hangzhou, Jinan, Wuhan, Hefei, Nanchang, Changsha, Kunming, Shenzhen, Haikou, Zhengzhou, Xiamen, Suzhou, Tangshan, Guangzhou, Shenyang, Chengdu, Nantong, Xianyang, Hohhot, Langfang, Zhongshan, Yancheng, Dongguan, Urumqi, Shaoguan, Xian, Nanjing, Changzhou, Qingdao, Taiyuan, Xinxiang, Yangzhou, Wuhu, Weifang, Shaoxing, Ningbo, and Baoding. These cities are all national EV demonstration pilot cities, and only their EV-related data and incentive policies are accessible in public. In addition, they distribute in a broad range involving 24 provinces in China, and they are representative in geography. The data was collected from year 2011 to 2017, and there were no abnormal values after observing the data of all cities. The reason why we focused on this time period is that promoting consumers to adopt EVs began with the “Ten Cities, One Thousand Vehicles,” and major incentives of this project were launched by 2011. Before 2011 there were few incentive policies in each city, so it is not necessary to include the data before 2011. Besides, the most related statistical yearbooks are the 2018 editions, and we can only get related data until 2017, since one statistical yearbook only counts the related data of the last year. Thus, relevant data for the 43 cities before 2011 and after 2017 both were unavailable. Based on the above statement, this paper intended to construct panel regression models by using public data of these 43 cities from year 2011 to 2017, and regression results can be seen in the following section.
5. Discussion
Both no purchasing and driving restrictions had a positive impact on the uptake of EVs; this impact was more significant than the impact of government subsidies, as indicated by high coefficients (1.558 and 1.131) for these two policy incentives as compared with coefficients (0.435 to 0.491) for government subsidies (see
Table 5 and
Table 8). This large impact of no purchasing and driving restrictions gets further substantiated by a recent survey undertaken by the China Automotive Technology and Research Center, which found that more than 95% of the consumers in Shanghai would either postpone, or even withdraw, their plan of purchasing EVs if the existing incentives of no purchasing restriction were abolished. It also finds that in the absence of no driving restriction, around 60% of consumers in Beijing, who are currently planning to purchase EVs, would change their minds [
47]. Results of previous studies have also proved the importance of no purchasing and driving restrictions. For example, Whitehead et al. (2014) [
48] interviewed the owners of energy saving vehicles in Stockholm (the capital of Sweden) and found that the traffic congestion exemption policy indeed improves the sales volume of energy saving vehicles. Wang et al. (2017) [
45] conducted a regression model based on questionnaire data and found that the adoption of EVs is driven by automobile purchase restrictions. Similarly, Ma et al. (2017) [
46] suggested that there is a positive relationship between automobile purchase restrictions and EV market share. As for no driving restriction, Wang et al. (2017) [
49] found that the effectiveness of no driving restriction is higher than that of charging discount, purchase tax exemption, road/bridge toll exemption, and parking benefits. In another study, by using statistic data, Wang et al. (2017) [
45] verified the effectiveness of no driving restriction of EVs again. Similarly, the positive correlation relationship between no driving restriction and EV market share is proved by Ma et al. (2017) [
46].
Besides, purchase tax exemption and government subsidies also had a positive impact (0.881 and 0.435, in
Table 11) on the uptake of EVs. This is understandable if one notes the fact that these two policy incentives are focused on reducing the up-front costs of EVs—one of the main barriers for the uptake of EVs. According to a recent survey conducted by the China Automotive Technology and Research Center, about 60% of the consumers who are currently thinking of purchasing EVs would change their plans if the existing subsidies for EVs were cancelled [
47]. In addition, dedicated license plates also had a positive impact (1.007, in
Table 11) on the uptake of EVs. This is connected with the following issues. The color of dedicated license plates, which is primarily green, is quite different from that of traditional blue license plates. Individuals who drive a car with green license plates are given an environmental protection identity [
50]. Meanwhile, EVs are more easily identified through green license plates, and are gradually accepted by consumers since individuals have more chance to come across such green cars on the road.
Results of previous studies that focus on individual adoption intention of EVs are not totally consistent with that of this study. Some incentives (i.e., purchase tax exemption and government subsidies) that have a positive impact on individual adoption intention also drive the uptake of EVs. There are also some exceptions, such as parking benefits, road/bridge toll exemption, and infrastructure construction subsidy. These incentives are favored by consumers, but they have no significant impact on actual adoption. It is believed that there is a gap between the effect of incentive policies on individual intention and actual behavior [
51]. Many consumers select EVs not because they favor such vehicles but rather because they have no choice [
52]. For instance, in some metropolis, if someone decides to purchase CFVs they have to pay a high license plate auction cost or wait for a long time until they are chosen to qualify to purchase. Thus, if someone want to purchase vehicles without driving restrictions, EVs are the best choice. Such situations force consumers to select EVs. Therefore, the positive effect of no purchasing restriction and no driving restriction, which was verified in this study, is consistent with the reality. Compared with purchase tax exemption and government subsidies, these two incentives are more powerful and attract more consumers. That is, no purchasing restriction and no driving restriction decide the acquisition and ease of use, while cost saving measures just influence the purchasing and using cost. In terms of consumers, the former aspect is of more concern than the latter [
53]. As for other incentives, the positive impact of dedicated license plates is higher than that of purchase tax exemption and government subsidies. In fact, the impact of dedicated license plates is the summary of several incentives such as parking benefits and road/bridge toll exemption. Although the effect of them is not obvious, their combined effect, which can be reflected by dedicated license plates, is significant. This shows incentives that aim at providing convenience for consumers do have a positive effect, but their effect is relatively small. However, previous studies showed the effect of regulation policies is significant in the short-term; in the long-term point of view; however, the diffusion of emerging products (e.g., EVs) rely more on various motivations. Only when consumers are of high purchasing intention can the large-scale application of this product be possible [
54]. The implication from these results is that the promotion of EVs not only relies on driving force, but also on various motivations. In the present stage, regulations (e.g., traffic restriction measures) are needed to help realize initial development of EVs, and various incentives are necessary to motivate consumers to generate the synergy effect.
At present, a growing number of automobiles has resulted in problems which urgently need to be addressed. For starters, energy pressure is increasing, affecting national energy security. According to the Oil Industry Development Report (2018), China’s net oil imports are 440 million tons in 2018, and oil external dependence rose to 69.8%. It is expected that China’s oil dependence will continue to rise in 2019, and oil external dependence may exceed 70% at that time [
55]. Second, the shortage of energy restricts the sustainable development of the automobile industry. China’s oil resource is not rich, and per capita recoverable reserves is less than 10% of the world’s average level [
56]. The unsustainable development of the automobile industry may occur if there are no alternative energy sources [
57]. Third, the backward technology level of the automobile increases the pressure of energy supply. China has implemented the limit value standard for vehicle fuel consumption since 2005. With the continuous addition of standards since then, the performance of the automotive has made great progress. However, there is still a large gap between China’s automotive energy consumption level and the world’s advanced level [
58]. Finally, irrational automobile consumption behavior is an important factor that affects the social sustainable development. Specifically, pursuing luxury and ostentatious consumption trends results in the increasing number of medium- and large-scale automobiles which have high emissions [
59]. Under such circumstances, the development of EVs has become an important way to ensure the sustainable development. Why is this so? The power source of electricity differs a lot, so the development of EVs can help the automobile industry remove the dependence on oil resources and alleviate national energy pressure [
60]. In addition, EVs are of high energy efficiency, which can help reduce the energy consumption of the automobile industry. Therefore, the promotion of EVs can help the realization of the sustainable development of the automobile industry, which also benefits the whole society [
61]. Based on the results of this paper, effective measures can be proposed to drive the promotion of EVs in China, which are presented below in detail. With an increasing percentage of EVs in China’s automobile market, sustainable development for both the automobile industry and society could be realized.
Policies that aim at restricting CFVs could be implemented reasonably, avoiding excessively forcing consumers to select EVs. According to the analysis in the former part, CFV restriction policies force individuals to purchase EVs to a large extent but they do not favor this kind of incentive. As for individuals, restrictions limit their choice of private cars, and they have to obey. Since these incentives are of high effectiveness, with the improvement of residents’ living standards and the acceleration of the urbanization process, they will play important roles in modern society. However, we cannot only rely on restriction policies, other policies that can promote individuals through various motivations (e.g., economic, psychological, and social influence) should also be issued to achieve the synergy effect. For example, information that contains the driving cost (cost per kilometer or annual cost) and carbon emissions can be provided to the public to help consumers know the cost and environmental advantage of EVs.
Dedicated license plates of EVs could be actively promoted, and its convenience in the driving process could be improved. At present, China has more than 1 million EVs, but it is still far less than the number of CFVs. Most consumers still have a fallback attitude towards EVs. With the increasing number of EVs, the striking green license plate on the road is like a mobile advertisement, which will be considered to some extent as a symbol of social identity/status. Through the green license plate, EV owners and users can pass on information such as “energy saving, environment protection, and carbon emissions reduction,” “responsible for society,” and “paying attention to others” to the people around them. This plays a very good role in popularizing EVs, and the users of electric vehicles will build up greater self-confidence and honor. Therefore, in the future, the government could actively promote dedicated license plates of EVs throughout the country in order to play the propaganda role; on the other hand, the traffic management system should be upgraded to ensure EVs with dedicated license plates can easily enjoy the privileges.
Ensuring the continuity of the purchase tax exemption incentive in order to establish consumer confidence. With the downhill trend of EV purchase subsidies, the preferential purchase tax policy has become a bright spot for consumers when choosing EVs [
62]. Compared with CFVs, EVs are of higher price, and exemption of purchase tax can reduce acquisition costs. At present, the vehicle purchase tax is 8.547% of the car price. Consumers who purchase an EV selling for ¥ 200,000 yuan can get about ¥ 17,000 tax relief. According to results of this study, the implementation of purchase tax exemption indeed promotes EV market share, and the effect of this policy is higher than that of government subsidies. In the future, the government could consider extending the implementation period of this policy to attract consumers. Meanwhile, the catalogue of purchase tax exemption could be timely updated to ensure consumers have more choices in the purchase process.
Furthermore, existing policy incentives for promoting EVs are primarily regulation-based, focusing on creating a demand for EVs by the introduction of purchasing and driving restrictions on conventional vehicles, and removing some economic barriers (such as high up-front costs) that would have impeded the uptake of EVs. This strategy for promoting EVs may be effective in the short-term, as evidenced by a rapid increase in EV stock from nearly negligible in 2009, to more than 2.6 million in 2018—the highest in the world [
10]. Its long-term effectiveness is; however, dubious, due to the inherent complexity of the factors that could affect consumers’ preference for EVs, which makes it difficult for government agencies to identify specific factors, and to introduce appropriate policy measures for redressing them. This issue has already been recognized by the government, and policy initiatives have been implemented to replace the regulatory incentives with market-oriented incentives under the New Energy Vehicle Mandate scheme (see, for example, [
6]). There are; however, several issues that may adversely affect the effectiveness of the market incentives. Some of these issues are, for example, fragmented authority in regulating the EV market, as various government agencies at both central and provincial levels are currently made responsible for regulating issues related to EVs; and local protectionism that may hinder the development of a well-functioning market for EVs, as some local governments are likely to protect their local EV makers and discriminate EV makers from other regions. Policymakers may like to seriously consider these issues in the process of designing and implementing market incentives for EVs.
6. Conclusions
This paper has developed a quantitative analysis of the impacts of various policy incentives on the uptake of EVs. Policy incentives included in this analysis include no purchasing and driving restrictions, government subsidies, purchase tax exemption, vehicle tax exemption, dedicated license plates, parking benefits, road/bridge toll exemption, subsidy on building charging infrastructure, and charging discount. The uptake of EVs is measured in this analysis in terms of EV market share. The panel regression model is adopted in this analysis, using annual data of 43 cities, covering the period 2011 to 2017.
The results of the analysis suggest that no purchasing and driving restrictions are significant incentives for promoting the uptake of EVs, and their significance is even higher than that of incentives aimed at reducing the up-front costs of EVs. This is reflective of the fact that these policy incentives have created a demand for EVs by introducing purchasing and driving restrictions on conventional vehicles and forcing consumers to purchase EVs. The results also suggest that purchase tax exemption, government subsidies, and dedicated license plates have a positive impact on the uptake of EVs, as these incentives have lowered the costs of purchasing and using electric vehicles. For example, purchase tax exemption and government subsidies have reduced the up-front costs of EVs, which is widely considered as one of the main barriers for the uptake of EVs. Besides, electric vehicles with special license plates are eligible for exemptions on parking fees, and road/bridge tolls, which lead to reduced costs of using electric vehicles.
This paper has also made three main suggestions for policymakers. One, the existing exemption on purchasing tax should be maintained (at least in the short-term) in order to provide sufficient incentives for individuals to adopt EVs in the backdrop of high up-front costs of EVs, and gradual removal of purchase subsidies. Two, current policy incentives primarily focus on creating a market for EVs by, for example, the introduction of purchasing and driving restrictions on conventional vehicles. A broader policy focus is needed to further incentivize individuals to adopt EVs. Examples of these policies include: 1) Public education about the economic (for example, low driving costs) and environmental (such as, less emissions) benefits arising from EVs; and 2) dedicated license plates for EVs, which could create a social image for EV owners as socially-responsible. Three, a replacement of existing regulatory incentives with market-oriented ones could contribute to the provision of more appropriate incentives for consumers to adopt EVs. There are; however, several issues that may hinder the development of a well-functioning market for EVs including, for example, fragmented authority in regulating EV-related matters, and local protectionism against EVs manufactured by non-local automakers. A serious consideration of these issues is; therefore, needed for policymakers.
There are some limitations in this paper. To begin with, the period of promoting EVs in China is not very long and only parts of cities can obtain public EV-related data, resulting in a small sample size in this paper. What is more, incentive policies in this paper mainly focus on the demand-side since they have direct effect on EV diffusion. The effect of supply-side policies could be analyzed when the EV market becomes more nature and more public data are available.


