Local Scale Prioritisation of Green Infrastructure for Enhancing Biodiversity in Peri-Urban Agroecosystems: A Multi-Step Process Applied in the Metropolitan City of Rome (Italy)


Abstract
1. Introduction
2. Materials and Methods
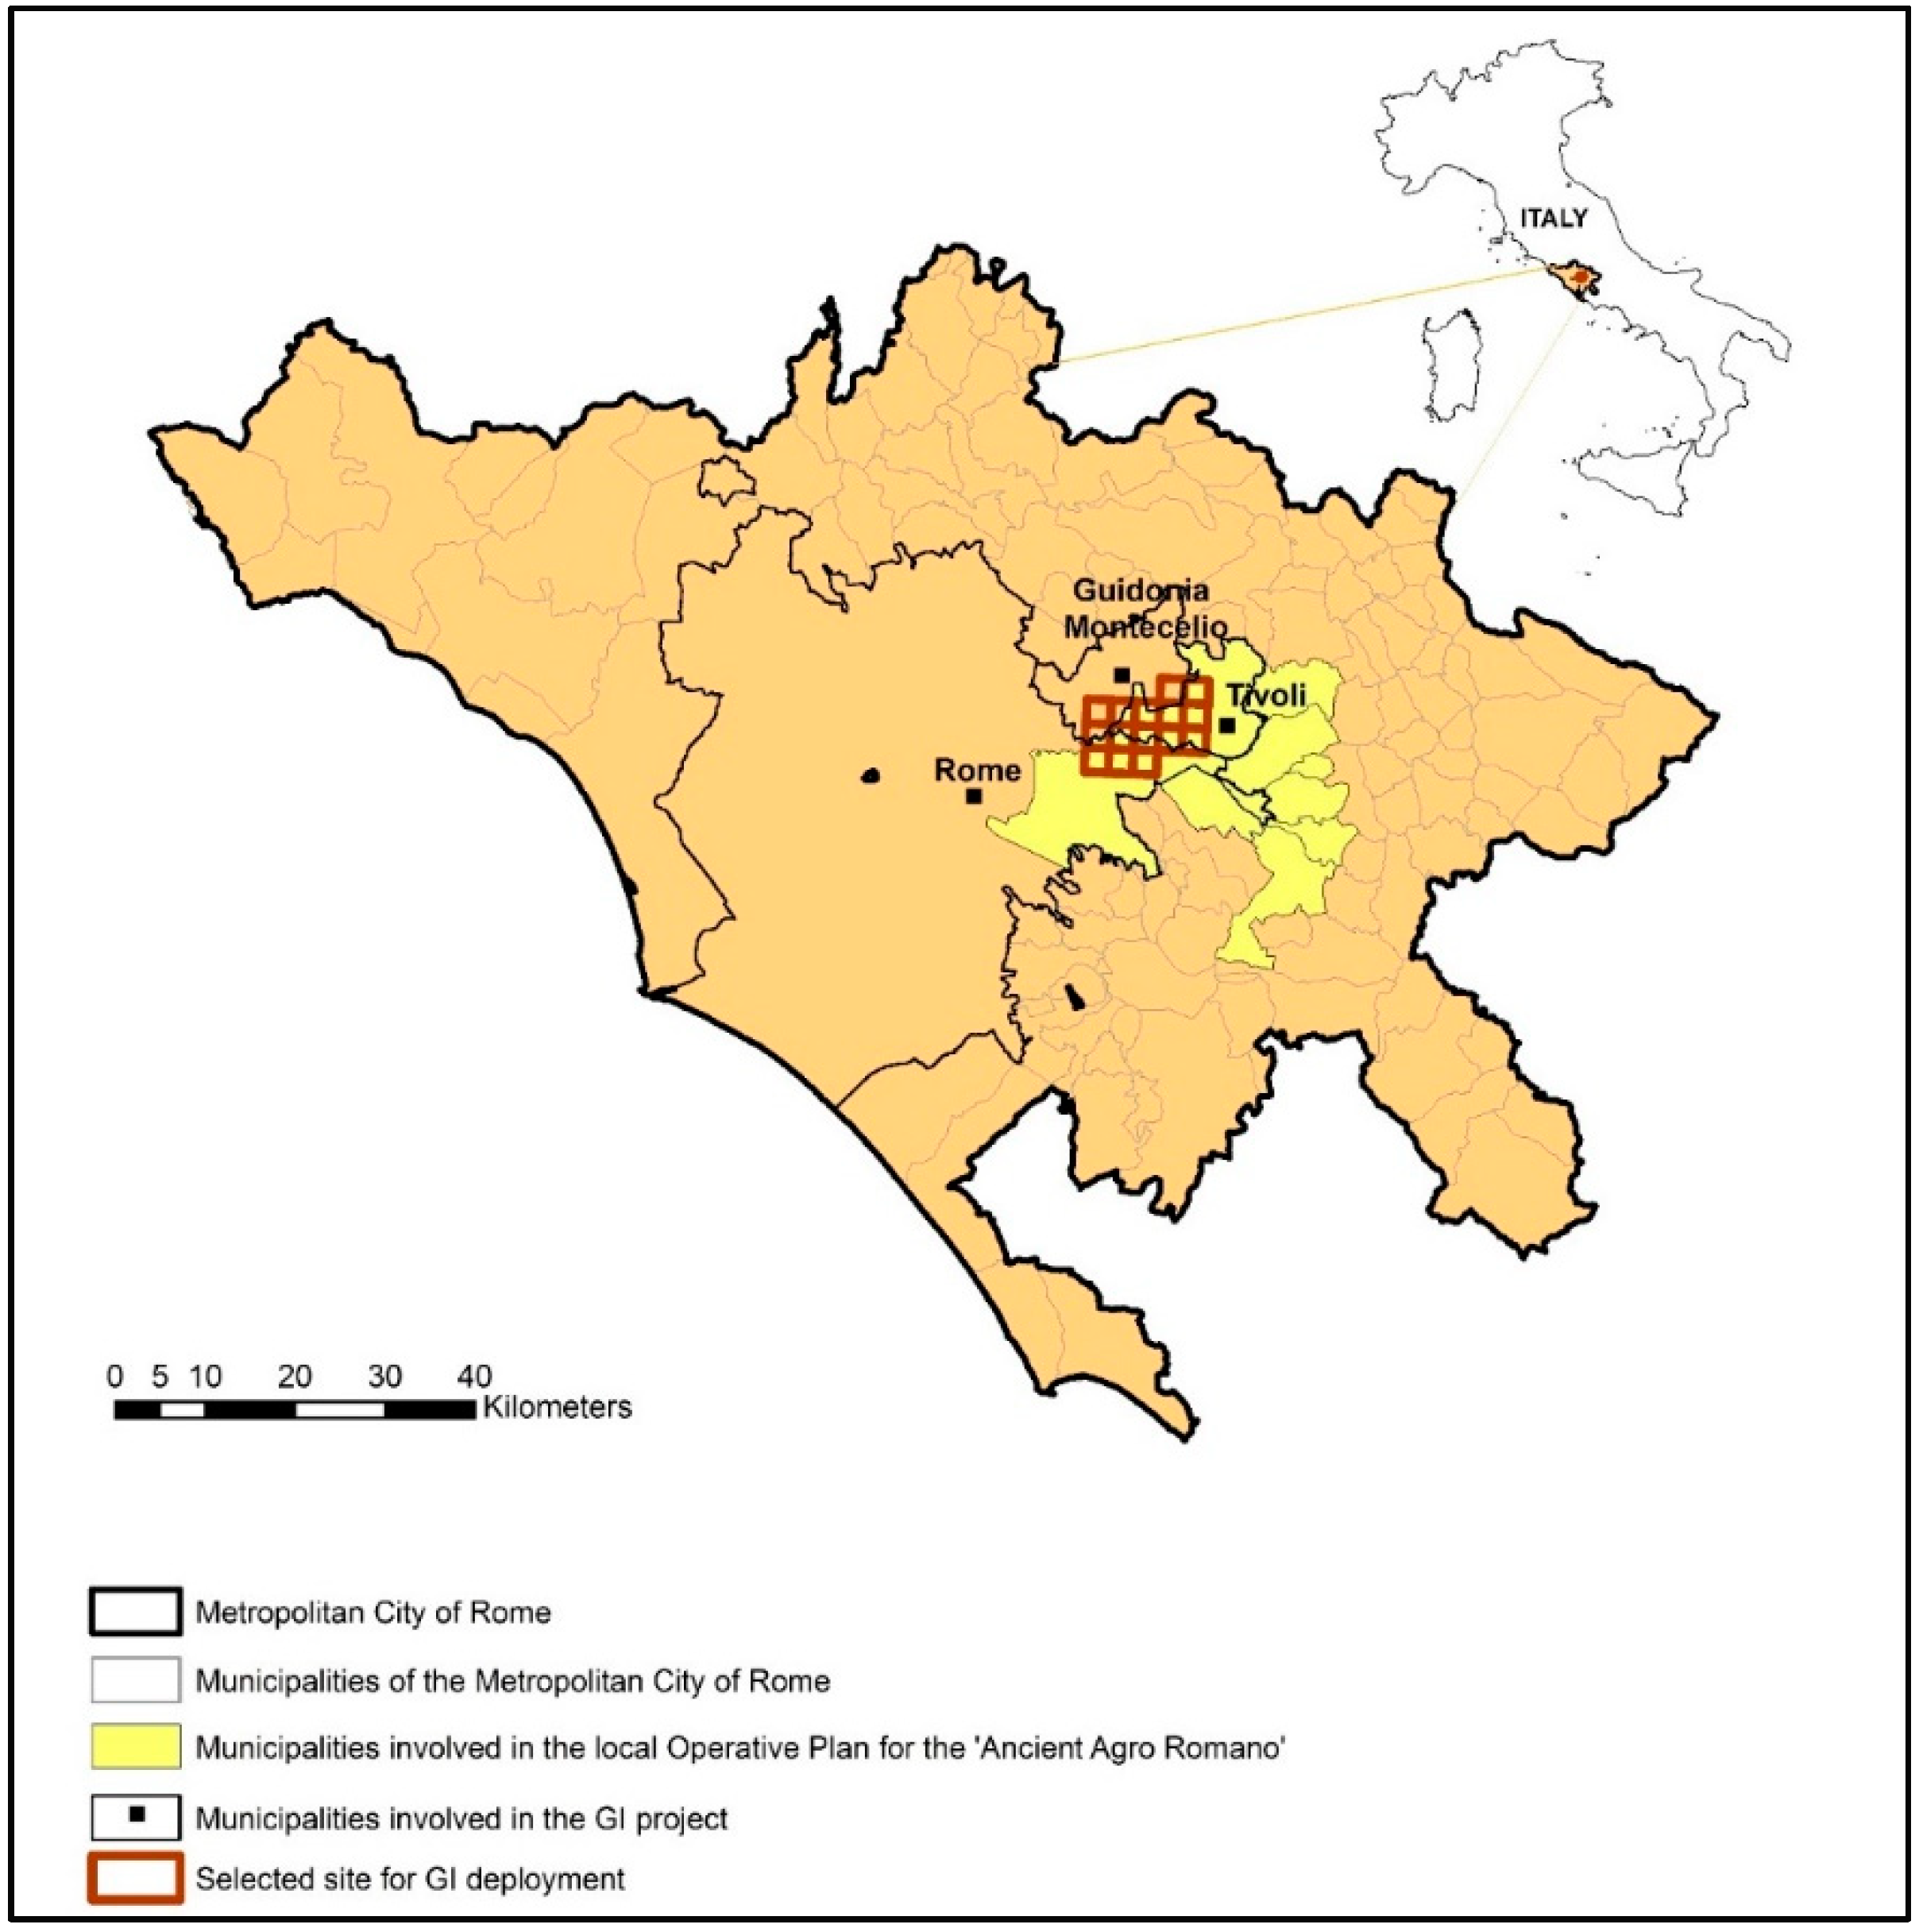
2.1. Study Area
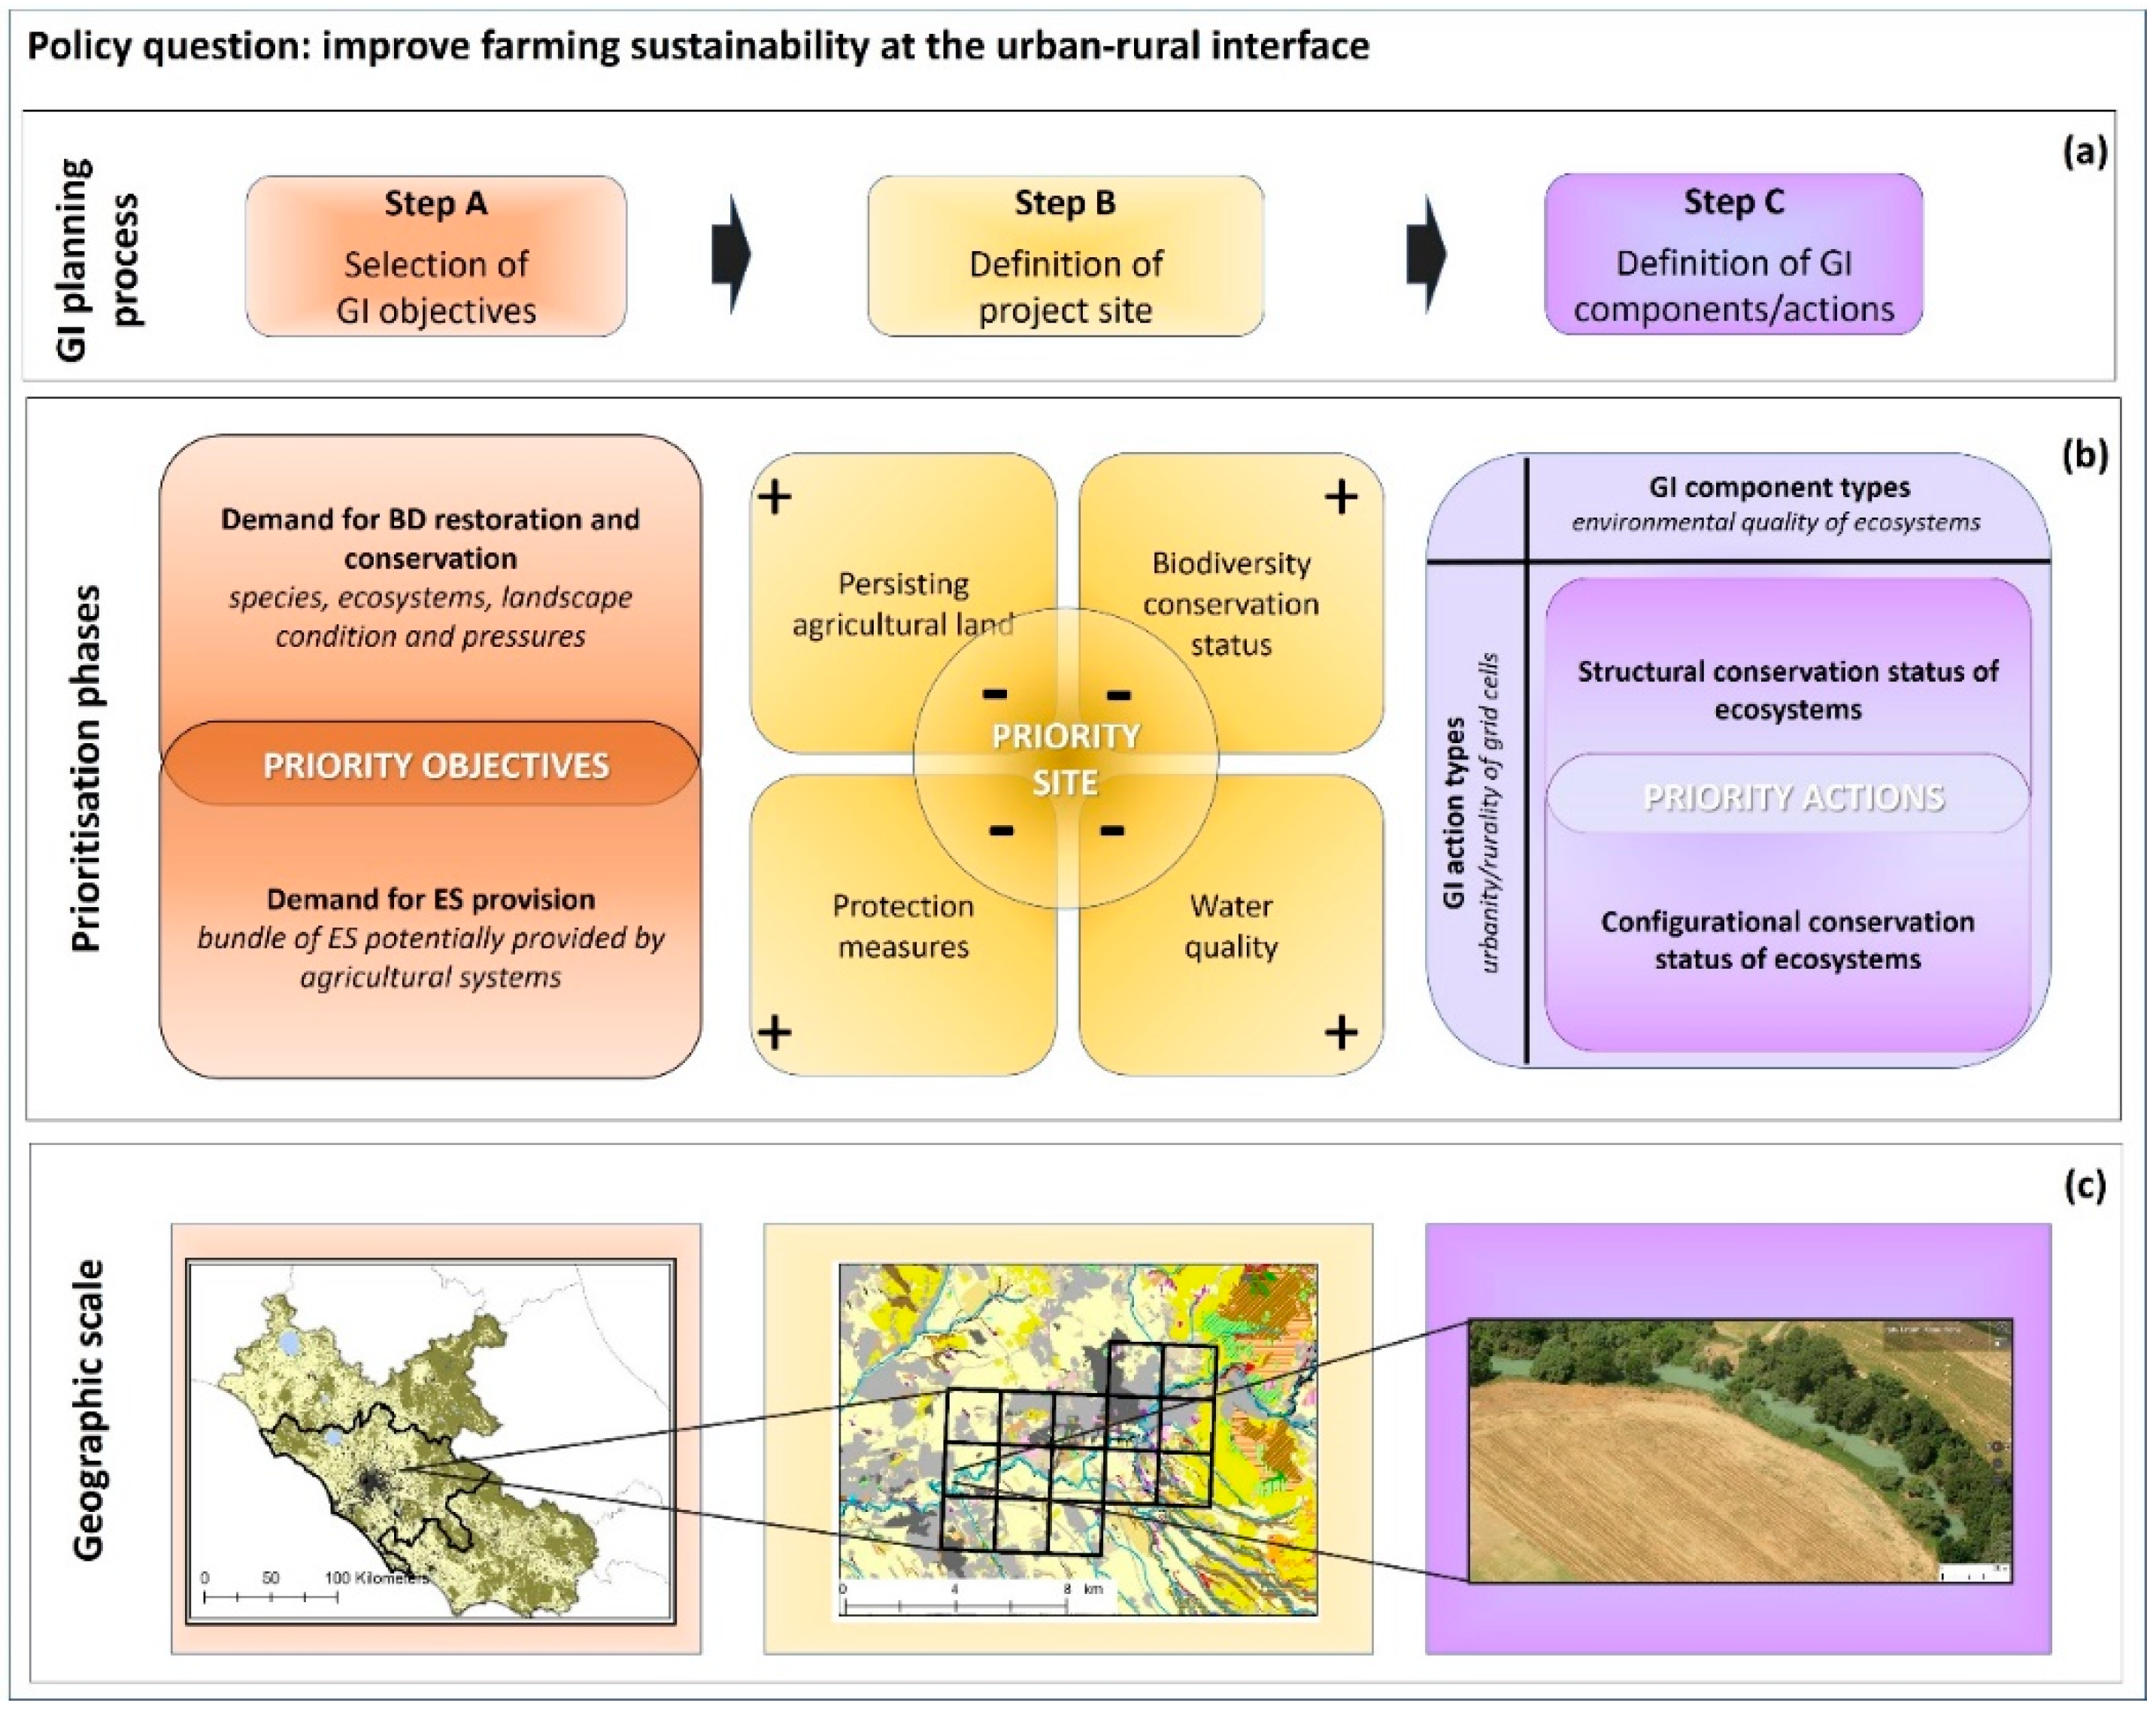
2.2. Overall GI Design Process
- Step A—Definition of priority GI objectives, considering the synergic demands for biodiversity restoration/conservation and ES provision at the landscape scale (metropolitan/regional decision level);
- Step B—Identification of a priority location for GI deployment, according to the spatial overlay of critical issues for both biodiversity and ES at the countryside scale (municipal/sub-municipal decision level);
- Step C—Definition of priority restoration and conservation actions, according to ecosystem extent and condition at the site scale (farm/field decision level).
2.2.1. Step A—Prioritisation of GI Objectives
2.2.2. Step B—Prioritisation of GI Location
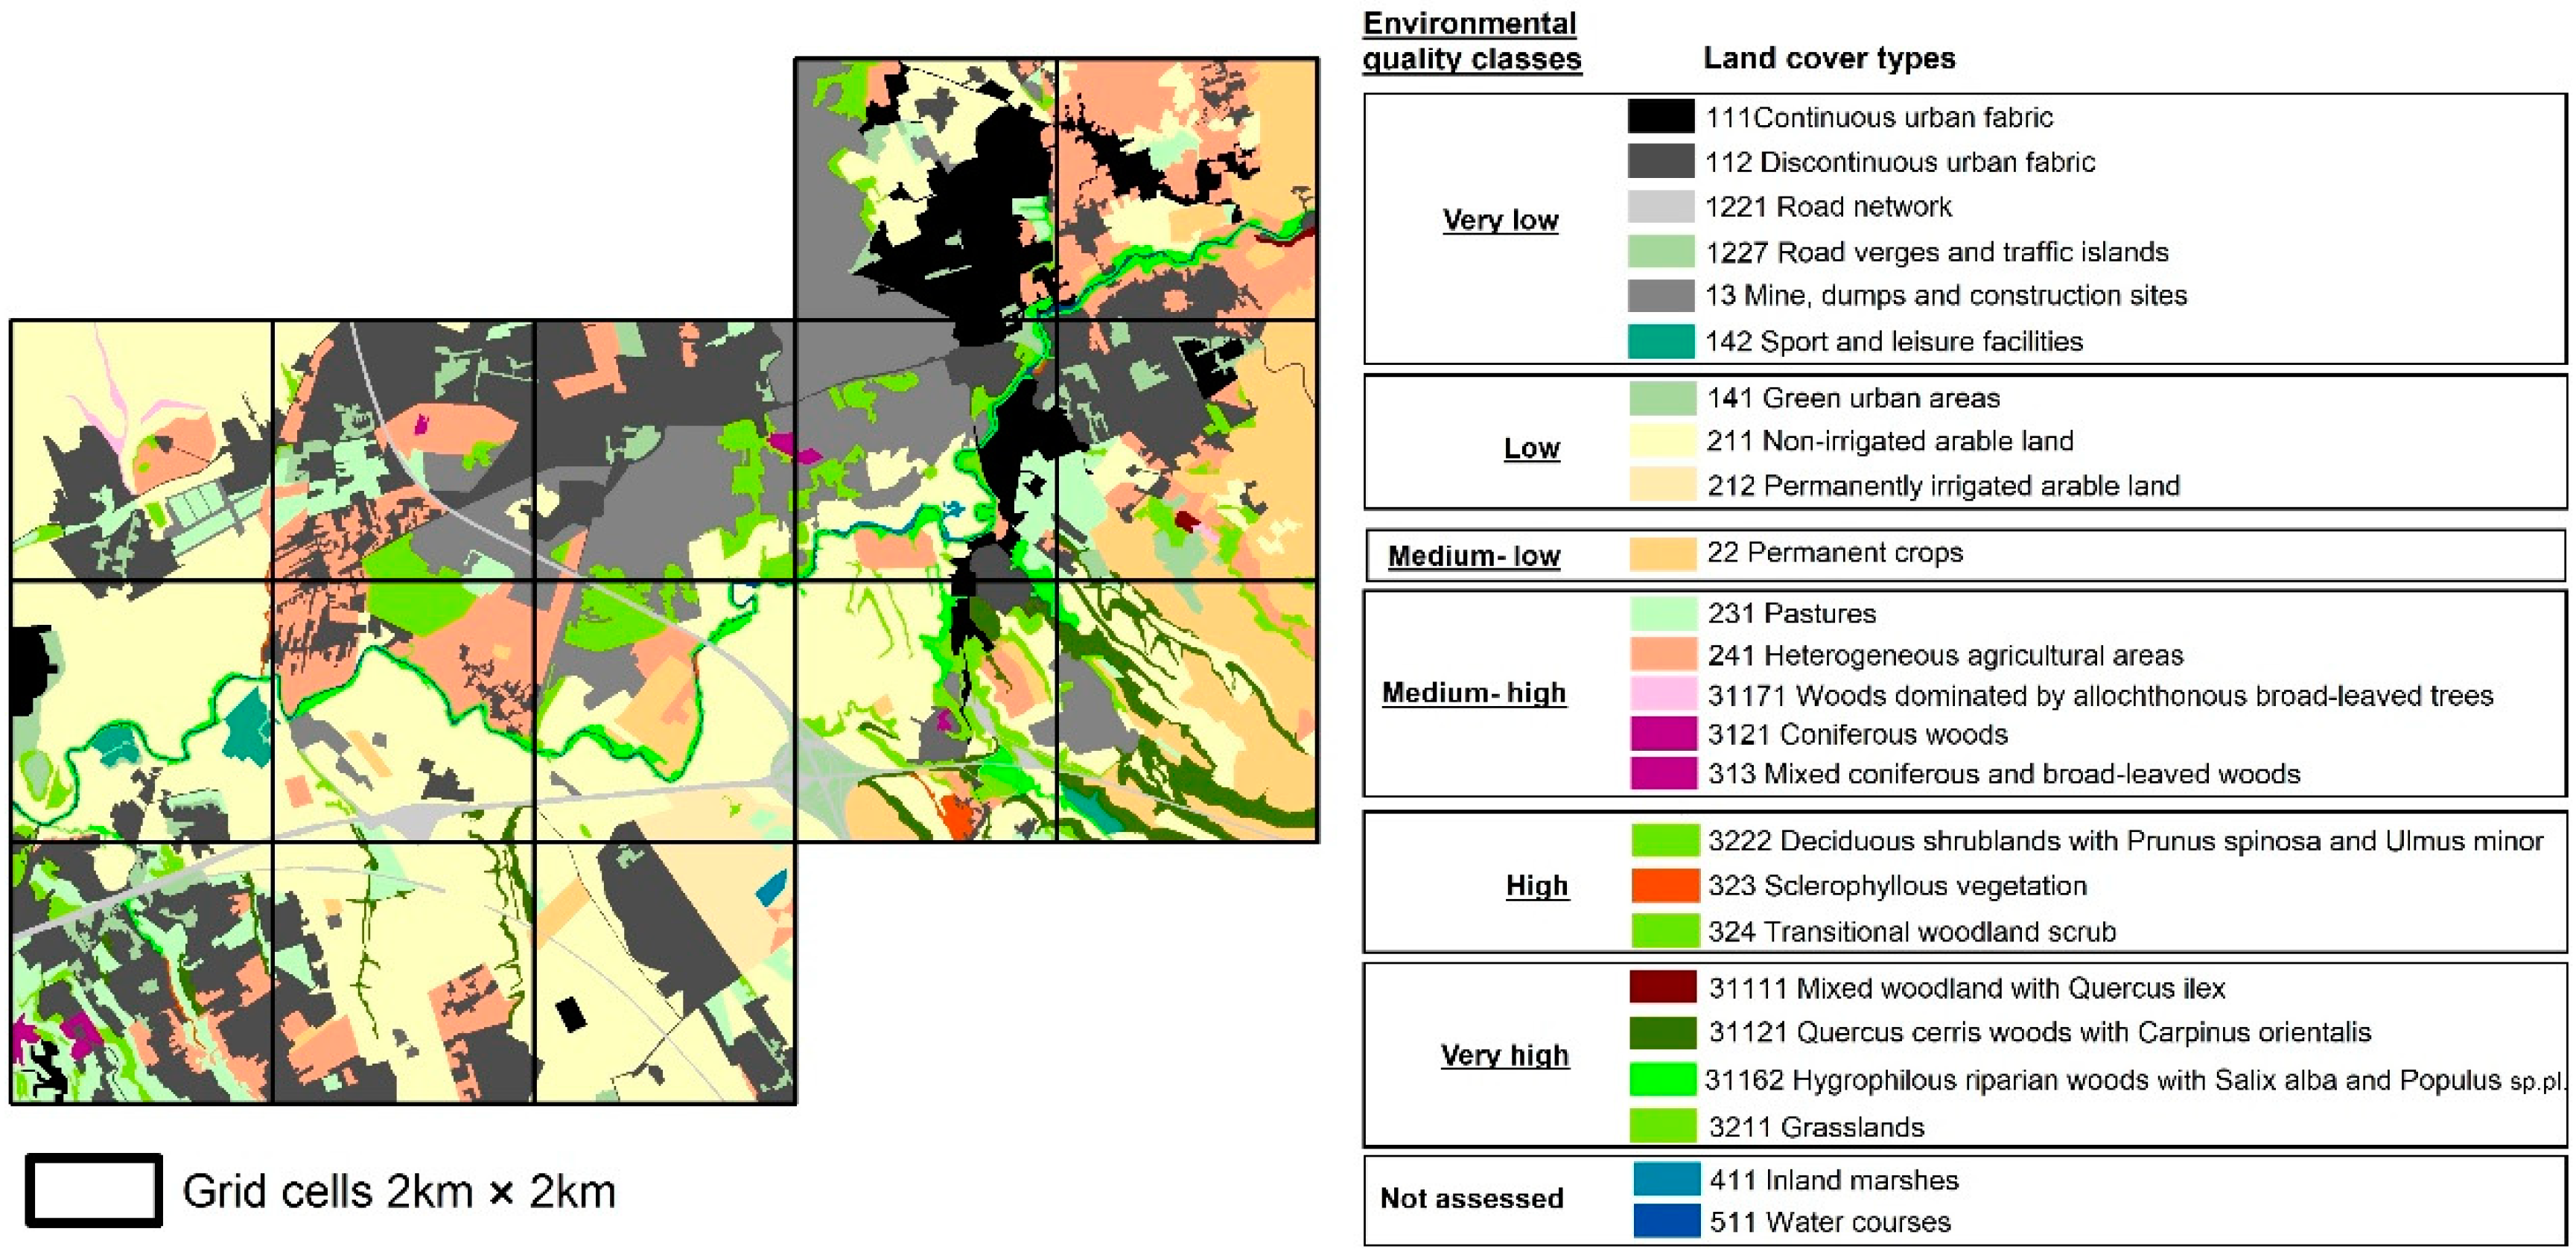
2.2.3. Step C—Prioritisation of GI Restoration and Conservation Actions
- The degree of urbanity/rurality of grid cells (determined by the relative extent of artificial, agricultural and natural cover types and the contacts between them);
- The conservation status in structural terms of ecosystem patches occurring in each grid cell (determined according to patch extent and presence/absence of linear semi-natural elements);
- The conservation status in terms of spatial configuration of ecosystem types in each grid cell (determined according to measures of ecosystem isolation and quality of the spatial contacts).
2.2.4. Recognition of Expected Benefits
3. Results
3.1. Priority GI Objectives in the Ancient Agro Romano Metropolitan Sector
- Restoration of vulnerable and biogeographically representative communities, especially mixed woods with Quercus cerris and Q. virgiliana/Q. pubescens, Quercus cerris woods with Carpinus orientalis, and riparian vegetation mosaic wherever natural and semi-natural vegetation is heavily shrunk and fragmented [52];
- Improved balance between quarry activities and biodiversity conservation in the travertine outcrop land unit that shows a very low conservation status [52];
- Enhancement of environmental protection tools wherever the number and extent of protected sites are very limited, i.e., realisation of the Ancient Agro Romano Metropolitan Park and of the Provincial Park of the River Aniene corridor, creation of buffer zones around the Natura2000 sites, and strict preservation of the ecological corridors of the Land Ecological Network [52,56];
- Enhancement of self-healing capacity and banks stabilisation of the river courses by means of restored riparian vegetation [56];
- Restoration of the entire floodplain by means of morphology and vegetation requalification [56].
3.2. Priority Location for GI Deployment at the Urban–Rural Interface
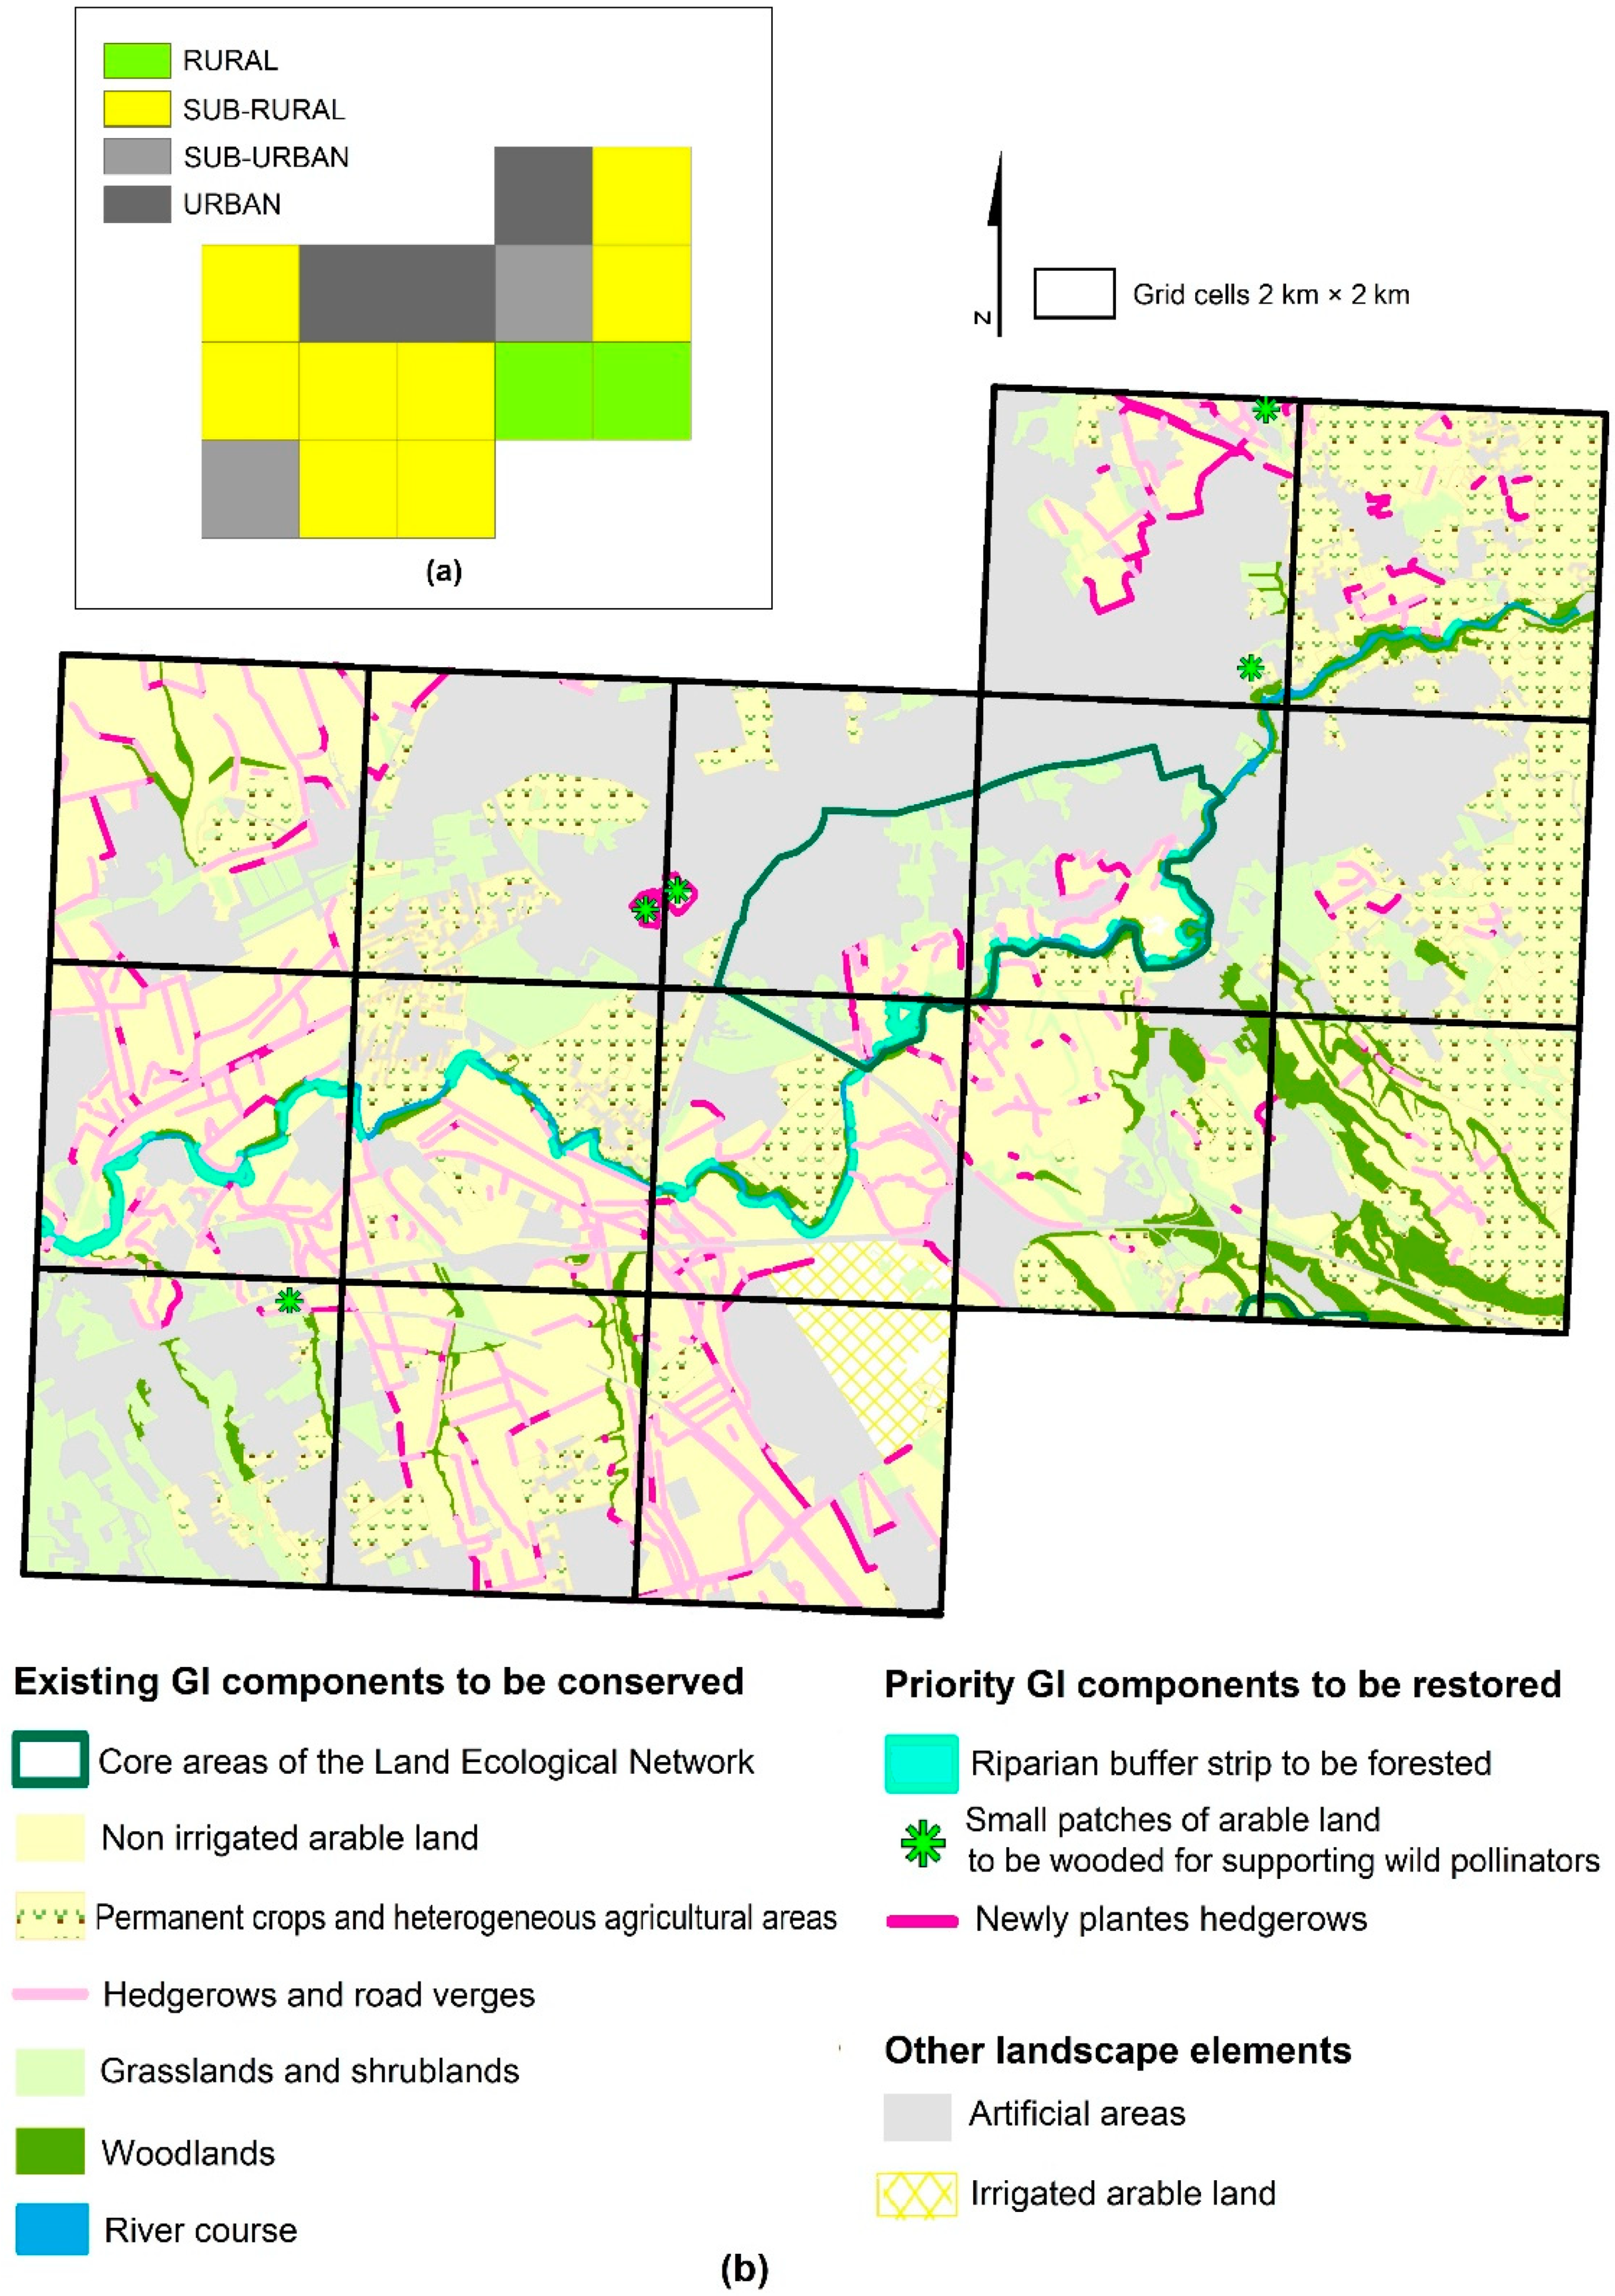
3.3. Priority GI Restoration and Conservation Actions
- Rural cells (2 out of 15), which are characterised by an agricultural matrix (ranging from 55% to 62% of the cell’s surface) with relatively high persistence of (semi-)natural ecosystems (ranging from 24% to 27%) and small amount of shared contacts between agricultural and artificial surfaces (ranging from 9% to 23% of the overall contacts of agricultural surfaces);
- Sub-rural cells (8 out of 15), which are characterised by an agricultural matrix (ranging from 53% to 72% of the cell’s surface) with relatively high coverage of artificial areas (ranging from 19 to 40%), from very few to few persisting (semi-) natural ecosystems (ranging from 0.1% to 13%), and large amount of shared contacts between agricultural surfaces and artificial areas (ranging from 42% to 65% of the overall contacts of agricultural surfaces);
- Sub-urban cells (2 out of 15), which are characterised by an artificial matrix (ranging from 53% to 59% of the cell’s surface) with relatively high coverage of agricultural surfaces (ranging from 25% to 36%), few persisting (semi-) natural ecosystems (ranging from 11% to 13%), and small to medium share of contacts between agricultural surfaces and artificial areas (ranging from 16% to 40% of the overall contacts of agricultural surfaces);
- Urban cells (3 out of 15), which are characterised by an artificial matrix (ranging from 60% to 80% of the cell’s surface) with relatively low coverage of agricultural surfaces (ranging from 12% to 32%), very few persisting (semi-) natural ecosystems (ranging from 5% to 9%), and very large share of contacts between agricultural surfaces and artificial areas (ranging from 74% to 85% of the overall contacts of agricultural surfaces).
- In rural cells the improvement of landscape elements density for enhancing the ecological connectivity was set as the main restoration action. In this case, restoration priority was given to the densification of woody landscape elements within extensive patches of arable land that are placed between the most distant (semi-)natural ecosystems;
- In sub-rural cells main restoration actions and pertaining priority were set as (i) the densification of woody landscape elements within arable land, especially for extensive patches placed between isolated (semi-)natural ecosystems (in the 4 cells with high ENN values, ranging from 85 to 1614 m), and (ii) restoration of the riparian vegetation wherever the river course adjoined some agricultural surface;
- In sub-urban cells main restoration actions and pertaining priority were set as (i) the densification of woody landscape elements within arable land, especially for the agroecosystem patches that are more extensive and/or may improve the ecological connections between the Natura2000 site and the surrounding landscape, and (ii) restoration of habitats that are suitable for supporting wild pollinators in small residual and no longer cultivated patches;
- In urban cells main restoration actions and pertaining priority were set as i) the densification of woody landscape elements within extensive patches of arable land to connect distant (semi-)natural ecosystems and to reduce contrast with adjoining artificial areas, and ii) restoration of habitats that are suitable for supporting wild pollinators in small residual and no longer cultivated patches.
3.4. Expected Benefits
4. Discussion
5. Conclusions
Author Contributions
Funding
Acknowledgments
Conflicts of Interest
References
- Seto, K.C.; Fragkias, M.; Güneralp, B.; Reilly, M.K. A meta-analysis of global urban land expansion. PLoS ONE 2011, 6, e23777. [Google Scholar] [CrossRef]
- Tilman, D.; Balzer, C.; Hill, J.; Befort, B.L. Global food demand and the sustainable intensification of agriculture. Proc. Natl. Acad. Sci. USA 2011, 108, 20260–20264. [Google Scholar] [CrossRef] [PubMed]
- Iojă, C.I.; Niţă, M.R.; Vânău, G.O.; Onose, D.A.; Gavrilidis, A.A. Using multi-criteria analysis for the identification of spatial land-use conflicts in the Bucharest Metropolitan Area. Ecol. Indic. 2014, 42, 112–121. [Google Scholar] [CrossRef]
- Marraccini, E.; Debolini, M.; Moulery, M.; Abrantes, P.; Bouchier, A.; Chéry, J.P.; Sanz Sanz, E.; Sabbatini, T.; Napoleone, C. Common features and different trajectories of land cover changes in six Western Mediterranean urban regions. Appl. Geogr. 2015, 62, 347–356. [Google Scholar] [CrossRef]
- Salvati, L.; Mavrakis, A. Narrative and quantitative analysis of human pressure, land-use and climate aridity in a transforming industrial basin in Greece. Int. J. Environ. Res. 2014, 8, 115–122. [Google Scholar]
- Vizzari, M.; Sigura, M. Landscape sequences along the urban–rural–natural gradient: A novel geospatial approach for identification and analysis. Landsc. Urban Plan. 2015, 140, 42–55. [Google Scholar] [CrossRef]
- Vizzari, M.; Hilal, M.; Sigura, M.; Antognelli, S.; Joly, D. Urban-rural-natural gradient analysis with CORINE data: An application to the metropolitan France. Landsc. Urban Plan. 2018, 171, 18–29. [Google Scholar] [CrossRef]
- Allen, A. Environmental planning and management of the peri-urban interface: Perspectives on an emerging field. Environ. Urban 2003, 15, 135–148. [Google Scholar] [CrossRef]
- Herrero-Jáuregui, C.; Arnaiz-Schmitz, C.; Reyes, M.; Telesnicki, M.; Agramonte, I.; Easdale, M.; Schmitz, M.F.; Aguiar, M.; Gómez-Sal, A.; Montes, C. What do We Talk about When We Talk about Social-Ecological Systems? A Literature Review. Sustainability 2018, 10, 2950. [Google Scholar] [CrossRef]
- Kroll, F.; Müller, F.; Haase, D.; Fohrer, N. Rural–urban gradient analysis of ecosystem services supply and demand dynamics. Land Use Policy 2012, 29, 521–535. [Google Scholar] [CrossRef]
- Tu, M.C.; Smith, P. Modeling Pollutant Buildup and Washoff Parameters for SWMM Based on Land Use in a Semiarid Urban Watershed. Water Air Soil Pollut. 2018, 229, 121. [Google Scholar] [CrossRef]
- Alberti, M. The Effects of Urban Patterns on Ecosystem Function. Int. Reg. Sci. Rev. 2005, 28, 168–192. [Google Scholar] [CrossRef]
- Bajocco, S.; De Angelis, A.; Perini, L.; Ferrara, A.; Salvati, L. The Impact of Land Use/Land Cover Changes on Land Degradation Dynamics: A Mediterranean Case Study. Environ. Manag. 2012, 49, 980. [Google Scholar] [CrossRef] [PubMed]
- EC (European Commission). Communication from the Commission to the European Parliament, the Council, the European Economic and Social Committee and the Committee of the Regions ‘Green Infrastructure (GI)—Enhancing Europe’s Natural Capital’ (COM(2013) 249 Final of 6 May 2013). 2013. Available online: http://eur-lex.europa.eu/LexUriServ/LexUriServ.do?uri=COM:2013:0249:FIN:EN:PDF (accessed on 18 March 2019).
- Lafortezza, R.; Davies, C.; Sanesi, G.; Konijnendijk, C.C. Green Infrastructure as a tool to support spatial planning in European urban regions. iForest 2013, 6, 102. [Google Scholar] [CrossRef]
- O’Brien, L.; De Vreese, R.; Kern, M.; Sievänen, T.; Stojanova, B.; Atmiş, E. Cultural ecosystem benefits of urban and peri-urban green infrastructure across different European countries. Urban For. Urban Green. 2017, 24, 236–248. [Google Scholar] [CrossRef]
- Sanesi, G.; Colangelo, G.; Lafortezza, R.; Calvo, E.; Davies, C. Urban green infrastructure and urban forests: A case study of the Metropolitan Area of Milan. Landsc. Res. 2017, 42, 164–175. [Google Scholar] [CrossRef]
- Lennon, M. Green infrastructure and planning policy: A critical assessment. Local Environ. 2015, 20, 957–980. [Google Scholar] [CrossRef]
- Schneiders, A.; Van Daele, T.; Van Landuyt, W.; Van Reeth, W. Biodiversity and ecosystem services: Complementary approaches for ecosystem management? Ecol. Indic. 2012, 21, 123–133. [Google Scholar] [CrossRef]
- Baró, F.; Gómez-Baggethun, E.; Haase, D. Ecosystem service bundles along the urban-rural gradient: Insights for landscape planning and management. Ecosyst. Serv. 2017, 24, 147–159. [Google Scholar] [CrossRef]
- EC (European Commission). Communication from the Commission to the European Parliament, the Council, the Economic and Social Committee and the Committee of the Regions. Our life Insurance, Our Natural Capital: An EU Biodiversity Strategy to 2020 (COM(2011)244 Final). 2011. Available online: http://eur-lex.europa.eu/legal-content/EN/TXT/?uri=celex%3A52011DC0244 (accessed on 18 March 2019).
- EC (European Commission). Key European Action Supporting the 2030 Agenda and the Sustainable Development Goals (COM(2016) 739 Final). 2016. Available online: https://ec.europa.eu/europeaid/sites/devco/files/swd-key-european-actions-2030-agenda-sdgs-390-20161122_en.pdf (accessed on 18 March 2019).
- Salbitano, F.; Borelli, S.; Conigliaro, M.; Yujuan, C. Guidelines on Urban and Peri-Urban Forestry; FAO Forestry Paper No. 178; Food and Agriculture Organization of the United Nations: Rome, Italy, 2016. [Google Scholar]
- Wendling, L.A.; Huovila, A.; zu Castell-Rüdenhausen, M.; Hukkalainen, M.; Airaksinen, M. Benchmarking Nature-Based Solution and Smart City assessment schemes against the Sustainable Development Goal indicator framework. Front. Environ. Sci. 2018, 6, 69. [Google Scholar] [CrossRef]
- Baró, F.; Palomo, I.; Zulian, G.; Vizcaino, P.; Haase, D.; Gómez-Baggethun, E. Mapping ecosystem service capacity, flow and demand for landscape and urban planning: A case study in the Barcelona metropolitan region. Land Use Policy 2016, 57, 405–417. [Google Scholar] [CrossRef]
- Larondelle, N.; Haase, D. Urban ecosystem services assessment along a rural–urban gradient: A cross-analysis of European cities. Ecol. Indic. 2013, 29, 179–190. [Google Scholar] [CrossRef]
- Maes, J.; Teller, A.; Erhard, M.; Grizzetti, B.; Barredo, J.I.; Paracchini, M.-L.; Condé, S.; Somma, F.; Orgiazzi, A.; Jones, A.; et al. Mapping and Assessment of Ecosystems and Their Services: An Analytical Framework for Ecosystem Condition; Publications office of the European Union: Luxembourg, 2018. [Google Scholar]
- Vallecillo, S.; Polce, C.; Barbosa, A.; Castillo, C.P.; Vandecasteele, I.; Rusch, G.M.; Maes, J. Spatial alternatives for Green Infrastructure planning across the EU: An ecosystem service perspective. Landsc. Urban Plan. 2018, 174, 41–54. [Google Scholar] [CrossRef]
- Garmendia, E.; Apostolopoulou, E.; Adams, W.M.; Bormpoudakis, D. Biodiversity and green infrastructure in Europe: Boundary object or ecological trap? Land Use Policy 2016, 56, 315–319. [Google Scholar] [CrossRef]
- Pelorosso, R.; Gobattoni, F.; Geri, F.; Leone, A. PANDORA 3.0 plugin: A new biodiversity ecosystem service assessment tool for urban green infrastructure connectivity planning. Ecosyst. Serv. 2017, 26, 476–482. [Google Scholar] [CrossRef]
- EEA (European Environment Agency). Spatial Analysis of Green Infrastructure in Europe Technical Report No 2/2014; Publications Office of the European Union: Luxembourg, 2014. [Google Scholar]
- Kukkala, A.S.; Moilanen, A. Ecosystem services and connectivity in spatial conservation prioritization. Landsc. Ecol. 2016, 32, 5–14. [Google Scholar] [CrossRef]
- Jacobs, S.; Verheyden, W.; Dendoncker, N. Why to map? In Mapping Ecosystem Services; Burkhard, B., Maes, J., Eds.; Pensoft Publishers: Sofia, Bulgaria, 2017. [Google Scholar]
- Verhagen, W.; Kukkala, A.S.; Moilanen, A.; van Teeffelen, A.J.; Verburg, P.H. Use of demand for and spatial flow of ecosystem services to identify priority areas. Conserv. Biol. 2017, 31, 860–871. [Google Scholar] [CrossRef] [PubMed]
- Kremer, P.; Hamstead, Z.A.; McPhearson, T. The value of urban ecosystem services in New York City: A spatially explicit multicriteria analysis of landscape scale valuation scenarios. Environ. Sci. Policy 2016, 62, 57–68. [Google Scholar] [CrossRef]
- Norton, B.A.; Coutts, A.M.; Livesley, S.J.; Harris, R.J.; Hunter, A.M.; Williams, N.S. Planning for cooler cities: A framework to prioritise green infrastructure to mitigate high temperatures in urban landscapes. Landsc. Urban Plan. 2015, 134, 127–138. [Google Scholar] [CrossRef]
- Derkzen, M.L.; van Teeffelen, A.J.A.; Verburg, P.H. Green infrastructure for urban climate adaptation: How do residents’ views on climate impacts and green infrastructure shape adaptation preferences? Landsc. Urban Plan. 2017, 157, 106–130. [Google Scholar] [CrossRef]
- Hansen, R.; Pauleit, S. From multifunctionality to multiple ecosystem services? A conceptual framework for multifunctionality in green infrastructure planning for urban areas. Ambio 2014, 43, 516–529. [Google Scholar] [CrossRef]
- Albert, C.; Von Haaren, C. Implications of Applying the Green Infrastructure Concept in Landscape Planning for Ecosystem Services in Peri-Urban Areas: An Expert Survey and Case Study. Plan. Pract. Res. 2017, 32, 227–242. [Google Scholar] [CrossRef]
- Estreguil, C.; Caudullo, G.; Rega, C.; Paracchini, M.L. Enhancing Connectivity, Improving Green Infrastructure. Cost-Benefit Solutions for Forest and Agri-Environment; A Pilot Study in Lombardy; Office for Official Publications of the European Union: Luxembourg, 2016. [Google Scholar]
- Spanò, M.; Gentile, F.; Davies, C.; Lafortezza, R. The DPSIR framework in support of green infrastructure planning: A case study in Southern Italy. Land Use Policy 2017, 61, 242–250. [Google Scholar] [CrossRef]
- Blasi, C.; Capotorti, G.; Marchese, M.; Marta, M.; Bologna, M.A.; Bombi, P.; Bonaiuto, M.; Bonnes, M.; Carrus, G.; Cifelli, F.; et al. Interdisciplinary research for the proposal of the Urban Biosphere Reserve of Rome Municipality. Plant Biosyst. 2008, 142, 305–312. [Google Scholar] [CrossRef]
- Blasi, C.; Capotorti, G.; Copiz, R.; Guida, D.; Mollo, B.; Smiraglia, D.; Zavattero, L. Classification and mapping of the ecoregions of Italy. Plant Biosyst. 2014, 148, 1255–1345. [Google Scholar] [CrossRef]
- Salvati, L. Agro-forest landscape and the ‘fringe’ city: A multivariate assessment of land-use changes in a sprawling region and implications for planning. Sci. Total Environ. 2014, 490, 715–723. [Google Scholar] [CrossRef]
- Salvati, L.; Sabbi, A. Exploring long-term land cover changes in an urban region of southern Europe. Int. J. Sustain. Dev. World Ecol. 2011, 18, 273–282. [Google Scholar] [CrossRef]
- Frondoni, R.; Mollo, B.; Capotorti, G. A landscape analysis of land cover change in the Municipality of Rome (Italy): Spatio-temporal characteristics and ecological implications of land cover transitions from 1954 to 2001. Landsc. Urban Plan. 2011, 100, 117–128. [Google Scholar] [CrossRef]
- Regione Lazio. Regional Statistics: Resident Population, Territorial Surface, Density and Mountain Municipalities at 1 January 2013. 2013. Available online: http://www.regione.lazio.it/statistica/areeTematiche/elenco/0/11/0/ (accessed on 18 March 2019).
- Capotorti, G.; Alós Ortí, M.M.; Copiz, R.; Fusaro, L.; Mollo, B.; Salvatori, E.; Zavattero, L. Biodiversity and ecosystem services in urban green infrastructure planning: A case study from the metropolitan area of Rome (Italy). Urban For. Urban Green. 2019, 37, 87–96. [Google Scholar] [CrossRef]
- Blasi, C.; Zavattero, L.; Marignani, M.; Smiraglia, D.; Copiz, R.; Rosati, L.; Del Vico, E. The concept of land ecological network and its design using a land unit approach. Plant Biosyst. 2008, 142, 540–549. [Google Scholar] [CrossRef]
- CIRBFEP (Centro di Ricerca Interuniversitario Biodiversità, Fitosociologia ed Ecologia del Paesaggio). Relazione Finale su Serie di Vegetazione e Vegetazione Naturale Potenziale della Provincia di Roma. 2013. Available online: http://websit.cittametropolitanaroma.gov.it/BDV2014/RelazioneP.pdf (accessed on 18 March 2019).
- CIRBFEP (Centro di Ricerca Interuniversitario Biodiversità, Fitosociologia ed Ecologia del Paesaggio). Carta della Vegetazione reale della Provincia di Roma. 2013. Available online: http://websit.cittametropolitanaroma.gov.it/BDV2014/100_vr_ridotta_4nov.jpg (accessed on 18 March 2019).
- Provincia di Roma. PTPG: Rapporto Territorio. 2010. Available online: http://ptpg.cittametropolitanaroma.gov.it/UploadDocs/2010/rapporto_territorio/ (accessed on 18 March 2019).
- Regione Lazio. Parchi e Natura 2000. 2011. Available online: http://www.regione.lazio.it/prl_ambiente/?vw=contenutidettaglio&id=202 (accessed on 18 March 2019).
- Cavallo, A.; Di Donato, B.; Marino, D. Mapping and assessing urban agriculture in Rome. Agric. Agric. Sci. Procedia 2016, 8, 774–783. [Google Scholar] [CrossRef]
- Salvati, L.; Munafò, M.; Morelli, V.G.; Sabbi, A. Low-density settlements and land use changes in a Mediterranean urban region. Landsc. Urban Plan. 2012, 105, 43–52. [Google Scholar] [CrossRef]
- Regione Lazio. Piano di tutela delle acque regionale (PTAR) Aggiornamento. 2016. Available online: http://www.regione.lazio.it/prl_ambiente/?vw=documentazioneDettaglio&id=39549 (accessed on 18 March 2019).
- Berry, P.; Turkelboom, F.; Verheyden, W.; Martín-López, B. Ecosystem Services Bundles. In Ecosystem Services Reference Book; Potschin, M., Jax, K., Eds.; 2016; Available online: www.openness-project.eu/library/reference-book (accessed on 18 March 2019).
- Raudsepp-Hearne, C.; Peterson, G.D.; Bennett, E.M. Ecosystem service bundles for analyzing tradeoffs in diverse landscapes. Proc. Natl. Acad. Sci. USA 2010, 107, 5242–5247. [Google Scholar] [CrossRef]
- Huang, J.; Tichit, M.; Poulot, M.; Darly, S.; Li, S.; Petit, C.; Aubry, C. Comparative review of multifunctionality and ecosystem services in sustainable agriculture. J. Environ. Manag. 2015, 149, 138–147. [Google Scholar] [CrossRef]
- Maes, J.; Liquete, C.; Teller, A.; Erhard, M.; Paracchini, M.L.; Barredo, J.I.; Grizzetti, B.; Cardoso, A.; Somma, F.; Petersen, J.-E.; et al. An indicator framework for assessing ecosystem services in support of the EU Biodiversity Strategy to 2020. Ecosyst. Serv. 2016, 17, 14–23. [Google Scholar] [CrossRef]
- Power, A.G. Ecosystem services and agriculture: Tradeoffs and synergies. Philos. Trans. R. Soc. Lond. B Biol. Sci. 2010, 365, 2959–2971. [Google Scholar] [CrossRef]
- Wiggering, H.; Weißhuhn, P.; Burkhard, B. Agrosystem Services: An Additional Terminology to Better Understand Ecosystem Services Delivered by Agriculture. Landsc. Online 2016, 49, 1–15. [Google Scholar] [CrossRef]
- Hahs, A.K.; McDonnell, M.J. Selecting independent measures to quantify Melbourne’s urban–rural gradient. Landsc. Urban Plan. 2006, 78, 435–448. [Google Scholar] [CrossRef]
- Newbold, T.; Hudson, L.N.; Hill, S.L.; Contu, S.; Lysenko, I.; Senior, R.A.; Day, J. Global effects of land use on local terrestrial biodiversity. Nature 2015, 520, 45–50. [Google Scholar] [CrossRef]
- Regione Lazio. Carta delle formazioni naturali e seminaturali della Regione Lazio mediante approfondimento a IV e V livello Corine Land Cover della Carta dell’Uso del Suolo della Regione Lazio. 2011. Available online: http://dati.lazio.it/catalog/it/dataset/cus-lazio-approfondimento-delle-formazioni-naturali-e-seminaturali-iv-e-v-livello-corine-land-cover (accessed on 18 March 2019).
- Blasi, C.; Capotorti, G.; Alós Ortí, M.M.; Anzellotti, I.; Attorre, F.; Azzella, M.M.; Carli, E.; Copiz, R.; Garfì, V.; Manes, F.; et al. Ecosystem mapping for the implementation of the European Biodiversity Strategy at the national level: The case of Italy. Environ. Sci. Policy 2017, 78, 173–184. [Google Scholar] [CrossRef]
- Maes, J.; Teller, A.; Erhard, M.; Liquete, C.; Braat, L.; Berry, P.; Egoh, B.; Puydarrieux, P.; Fiorina, C.; Santos, F.; et al. Mapping and Assessment of Ecosystems and Their Services. An Analytical Framework for Ecosystem Assessments Under Action 5 of the EU Biodiversity Strategy to 2020; Publications Office of the European Union: Luxembourg, 2013. [Google Scholar]
- Arnaiz-Schmitz, C.; Herrero-Jáuregui, C.; Schmitz, M.F. Losing a heritage hedgerow landscape. Biocultural diversity conservation in a changing social-ecological Mediterranean system. Sci. Total Environ. 2018, 637, 374–384. [Google Scholar] [CrossRef]
- García-Feced, C.; Weissteiner, C.J.; Baraldi, A.; Paracchini, M.L.; Maes, J.; Zulian, G.; Kempen, M.; Elbersen, B.; Pérez-Soba, M. Semi-natural vegetation in agricultural land: European map and links to ecosystem service supply. Agron. Sustain. Dev. 2015, 35, 273–283. [Google Scholar] [CrossRef]
- Capotorti, G.; Alós Ortí, M.M.; Anzellotti, I.; Azzella, M.M.; Copiz, R.; Mollo, B.; Zavattero, L. The MAES process in Italy: Contribution of vegetation science to implementation of European Biodiversity Strategy to 2020. Plant Biosyst. 2015, 149, 949–953. [Google Scholar] [CrossRef]
- Capotorti, G.; Zavattero, L.; Anzellotti, I.; Burrascano, S.; Frondoni, R.; Marchetti, M.; Marignani, M.; Smiraglia, D.; Blasi, C. Do National Parks play an active role in conserving the natural capital of Italy? Plant Biosyst. 2012, 146, 258–265. [Google Scholar] [CrossRef]
- Capotorti, G.; Mollo, B.; Zavattero, L.; Anzellotti, I.; Celesti-Grapow, L. Setting priorities for urban forest planning. A comprehensive response to ecological and social needs for the metropolitan area of Rome (Italy). Sustainability 2015, 7, 3958–3976. [Google Scholar] [CrossRef]
- McGarigal, K.; Cushman, S.A.; Neel, M.C.; Ene, E. Fragstats: Spatial Pattern Analysis Program for Categorical Maps. Available online: http://www.umass.edu/landeco/research/fragstats/fragstats.html (accessed on 18 March 2019).
- Capotorti, G.; Del Vico, E.; Lattanzi, E.; Tilia, A.; Celesti-Grapow, L. Exploring biodiversity in a metropolitan area in the Mediterranean region: The urban and suburban flora of Rome (Italy). Plant Biosyst. 2013, 147, 174–185. [Google Scholar] [CrossRef]
- Capotorti, G.; Del Vico, E.; Anzellotti, I.; Celesti-Grapow, L. Combining the conservation of biodiversity with the provision of ecosystem services in urban green infrastructure planning: Critical features arising from a case study in the metropolitan area of Rome. Sustainability 2017, 9, 10. [Google Scholar] [CrossRef]
- Comitato del Verde Pubblico (Italian Public Green Committee). Strategia Nazionale del Verde Urbano. 2018. Available online: http://www.minambiente.it/sites/default/files/archivio/allegati/comitato%20verde%20pubblico/strategia_verde_urbano.pdf (accessed on 18 March 2019).
- Aparicio, A.; Albaladejo, R.G.; Olalla-Tárraga, M.A.; Carrillo, L.F.; Rodríguez, M.Á. Dispersal potentials determine responses of woody plant species richness to environmental factors in fragmented Mediterranean landscapes. For. Ecol. Manag. 2008, 255, 2894–2906. [Google Scholar] [CrossRef]
- Flynn, S.; Turner, R.M.; Stuppy, W.H. Seed Information Database. 2006. Available online: http://www.kew.org/data/sid (accessed on 18 March 2019).
- Mirabile, M.; Bianco, P.M.; Silli, V.; Brini, S.; Chiesura, A.; Vitullo, M.; Ciccarese, L.; De Lauretis, R.; Gaudioso, D. Guidelines of Sustainable Urban Forestry for the Municipality of Rome; ISPRA: Roma, Italy, 2015. [Google Scholar]
- Mazzone, P.; Persano Oddo, L. Apicoltura e Mieli Della Campania; Campania Region Department of Agriculture: Naples, Italy, 2003. [Google Scholar]
- Persano Oddo, L. Mieli e flora mellifera del Lazio; Regione Lazio: Rete Rurale Nazionale, Italy, 2006. [Google Scholar]
- Salvati, L. Lost in complexity, found in dispersion: ‘Peripheral’development and deregulated urban growth in Rome. Cities 2015, 47, 73–80. [Google Scholar] [CrossRef]
- Borrelli, P. Studio del rischio di erosione del suolo nelle aree agricole della provincia di Roma: Valutazioni preliminari alla luce dei recenti eventi meteorologici di straordinaria intensità. In L’analisi Del Rischio Ambientale. La Lettura Del Geografo; Di Somma, A., Ferrari, V., Eds.; Associazione Geografica per l’Ambiente e il Territorio—AGAT: Roma, Italy, 2012. [Google Scholar]
- Manfreda, S.; Nardi, F.; Samela, C.; Grimaldi, S.; Taramasso, A.C.; Roth, G.; Sole, A. Investigation on the use of geomorphic approaches for the delineation of flood prone areas. J. Hydrol. 2014, 517, 863–876. [Google Scholar] [CrossRef]
- Piazza, M.G. Mappatura Delle Aree Nettarifere Del Lazio; CRA, Istituto Sperimentale di Zoologia Agraria, Sezione Apicoltura: Roma, Italy, 2007. [Google Scholar]
- De Natale, F.; Pignatti, G.; Trisorio, A. Aree Agricole Ad Alto Valore Naturale; Regione Lazio: Rete Rurale Nazionale, Italy, 2014; Available online: https://www.reterurale.it/flex/cm/pages/ServeBLOB.php/L/IT/IDPagina/13563 (accessed on 18 March 2019).
- Henke, R.; Vanni, F. Il carattere periurbano dell’agricoltura romana. Roma Mod. E Contemp. 2016, 24, 77–106. [Google Scholar] [CrossRef]
- Giardini, M. La flora vascolare del Montarozzo del Barco. Ann. Mus. Civ. Rovereto 2013, 28, 161–197. [Google Scholar]
- Anzalone, B.; Iberite, M.; Lattanzi, E. La Flora vascolare del Lazio. Inf. Bot. Ital. 2010, 42, 187–317. [Google Scholar]
- Bakker, J.D.; Wilson, S.D. Using ecological restoration to constrain biological invasion. J. Appl. Ecol. 2004, 41, 1058–1064. [Google Scholar] [CrossRef]
- Bullock, J.M.; Aronson, J.; Newton, A.C.; Pywell, R.F.; Rey-Benayas, J.M. Restoration of ecosystem services and biodiversity: Conflicts and opportunities. Trends Ecol. Evol. 2011, 26, 541–549. [Google Scholar] [CrossRef]
- Harvey, C.A.; Komar, O.; Chazdon, R.; Ferguson, B.G.; Finegan, B.; Griffith, D.M.; Martínez-Ramos, M.; Morales, H.; Nigh, R.; Soto-Pinto, L.; et al. Integrating agricultural landscapes with biodiversity conservation in the Mesoamerican hotspot. Conserv. Biol. 2008, 22, 8–15. [Google Scholar] [CrossRef]
- Snäll, T.; Lehtomäki, J.; Arponen, A.; Elith, J.; Moilanen, A. Green infrastructure design based on spatial conservation prioritization and modeling of biodiversity features and ecosystem services. Environ. Manag. 2016, 57, 251–256. [Google Scholar] [CrossRef]
- Liquete, C.; Kleeschulte, S.; Dige, G.; Maes, J.; Grizzetti, B.; Olah, B.; Zulian, G. Mapping green infrastructure based on ecosystem services and ecological networks: A pan-European case study. Environ. Sci. Policy 2015, 54, 268–280. [Google Scholar] [CrossRef]
- Meerow, S.; Newell, J.P. Spatial planning for multifunctional green infrastructure: Growing resilience in Detroit. Landsc. Urban Plan. 2017, 159, 62–75. [Google Scholar] [CrossRef]
- Madureira, H.; Andresen, T. Planning for multifunctional urban green infrastructures: Promises and challenges. Urban Des. Int. 2014, 19, 38–49. [Google Scholar] [CrossRef]
- Geneletti, D.; La Rosa, D.; Spyra, M.; Cortinovis, C. A review of approaches and challenges for sustainable planning in urban peripheries. Landsc. Urban Plan. 2017, 165, 231–243. [Google Scholar] [CrossRef]
- Rolf, W.; Peters, D.; Lenz, R.; Pauleit, S. Farmland–an Elephant in the Room of Urban Green Infrastructure? Lessons learned from connectivity analysis in three German cities. Ecol. Indic. 2018, 94, 151–163. [Google Scholar] [CrossRef]
- Niedźwiecka-Filipiak, I.; Rubaszek, J.; Potyrała, J.; Filipiak, P. The Method of Planning Green Infrastructure System with the Use of Landscape-Functional Units (Method LaFU) and its Implementation in the Wrocław Functional Area (Poland). Sustainability 2019, 11, 394. [Google Scholar] [CrossRef]
- Dondina, O.; Saura, S.; Bani, L.; Mateo-Sánchez, M.C. Enhancing connectivity in agroecosystems: Focus on the best existing corridors or on new pathways? Landsc. Ecol. 2018, 33, 1741–1756. [Google Scholar] [CrossRef]
- Estreguil, C.; Dige, G.; Kleeschulte, S.; Carrao, H.; Raynal, J.; Teller, A. Informing Strategic Green Infrastructure and Restoration Planning Through Mapping and Assessment Methods Based on Spatial and Technical Data. European Commission. 2018. Available online: https://www.eustafor.eu/uploads/ReportGI_EUSTAFORcomments.pdf (accessed on 18 March 2019).
- Lammerant, J.; Peters, R.; Snethlage, M.; Delbaere, B.; Dickie, I.; Whiteley, G. Implementation of 2020 EU Biodiversity Strategy: Priorities for the Restoration of Ecosystems and Their Services in the EU; Report to the European Commission; Arcadis: Amsterdam, The Netherlands, 2013. [Google Scholar]
- Rodríguez-Loinaz, G.; Alday, J.G.; Onaindia, M. Multiple ecosystem services landscape index: A tool for multifunctional landscapes conservation. J. Environ. Manag. 2014, 147C, 152–163. [Google Scholar] [CrossRef]
- Lefebvre, M.; Espinosa, M.; Gomez y Paloma, S.; Paracchini, M.L.; Piorr, A.; Zasada, I. Agricultural landscapes as multi-scale public good and the role of the Common Agricultural Policy. J. Environ. Plan. Manag. 2015, 58, 2088–2112. [Google Scholar] [CrossRef]
- Grêt-Regamey, A.; Weibel, B.; Rabe, S.E.; Burkhard, B. A tiered approach for ecosystem services mapping. In Mapping Ecosystem Services; Burkhard, B., Maes, J., Eds.; Pensoft Publishers: Sofia, Bulgaria, 2017; pp. 213–217. [Google Scholar]
- Lennon, M.; Scott, M. Delivering ecosystems services via spatial planning: Reviewing the possibilities and implications of a green infrastructure approach. Town Plan. Rev. 2014, 85, 563–587. [Google Scholar] [CrossRef]
- Ustaoglu, E.; Williams, B. Determinants of Urban Expansion and Agricultural Land Conversion in 25 EU Countries. Environ. Manag. 2017, 60, 717–746. [Google Scholar] [CrossRef]
- Balzan, M.V.; Caruana, J.; Zammit, A. Assessing the capacity and flow of ecosystem services in multifunctional landscapes: Evidence of a rural-urban gradient in a Mediterranean small island state. Land Use Policy 2018, 75, 711–725. [Google Scholar] [CrossRef]
- Hauck, J.; Schmidt, J.; Werner, A. Using social network analysis to identify key stakeholders in agricultural biodiversity governance and related land-use decisions at regional and local level. Ecol. Soc. 2016, 21, 49. [Google Scholar] [CrossRef]
- Zhang, W.; Ricketts, T.H.; Kremen, C.; Carney, K.; Swinton, S.M. Ecosystem services and dis-services to agriculture. Ecol. Econ. 2007, 64, 253–260. [Google Scholar] [CrossRef]
- Benayas, J.M.R.; Bullock, J.M. Vegetation restoration and other actions to enhance wildlife in European agricultural landscapes. In Rewilding European Landscapes; Pereira, H.M., Navarro, L., Eds.; Springer: Cham, Switzerland, 2015; pp. 127–142. [Google Scholar]
- Barral, M.P.; Benayas, J.M.R.; Meli, P.; Maceira, N.O. Quantifying the impacts of ecological restoration on biodiversity and ecosystem services in agroecosystems: A global meta-analysis. Agric. Ecosyst. Environ. 2015, 202, 223–231. [Google Scholar] [CrossRef]
- de la Fuente, B.; Mateo-Sánchez, M.C.; Rodríguez, G.; Gastón, A.; de Ayala, R.P.; Colomina-Pérez, D.; Melero, M.; Saura, S. Natura 2000 sites, public forests and riparian corridors: The connectivity backbone of forest green infrastructure. Land Use Policy 2018, 75, 429–441. [Google Scholar] [CrossRef]
- Fanfarillo, E.; Latini, M.; Bonifazi, E.; Nescatelli, S.; Abbate, G. Evaluating and mapping naturalness of agricultural areas: A case study in central Italy. Plant Biosyst. 2017, 151, 766–769. [Google Scholar] [CrossRef]
- Howe, C.; Suich, H.; Vira, B.; Mace, G.M. Creating win-wins from trade-offs? Ecosystem services for human well-being: A meta-analysis of ecosystem service trade-offs and synergies in the real world. Glob. Environ. Chang. 2014, 28, 263–275. [Google Scholar] [CrossRef]
- Morelli, F.; Pruscini, F.; Santolini, R.; Perna, P.; Benedetti, Y.; Sisti, D. Landscape heterogeneity metrics as indicators of bird diversity: Determining the optimal spatial scales in different landscapes. Ecol. Indic. 2013, 34, 372–379. [Google Scholar] [CrossRef]
- Marando, F.; Salvatori, E.; Sebastiani, A.; Fusaro, L.; Manes, F. Regulating Ecosystem Services and Green Infrastructure: Assessment of Urban Heat Island effect mitigation in the municipality of Rome, Italy. Ecol. Model. 2019, 392, 92–102. [Google Scholar] [CrossRef]
- Tomaselli, V.; Adamo, M.; Veronico, G.; Sciandrello, S.; Tarantino, C.; Dimopoulos, P.; Medagli, P.; Nagendra, H.; Blonda, P. Definition and application of expert knowledge on vegetation pattern, phenology, and seasonality for habitat mapping, as exemplified in a Mediterranean coastal site. Plant Biosyst. 2017, 151, 887–899. [Google Scholar] [CrossRef]


| Indicator | Type | Territorial Level | Description | Critical Conditions and Pressures Occurring in the Ancient Agro Romano |
|---|---|---|---|---|
| Species occurrence and distribution | C | M | Number of species per 2 km × 2 km grid cells in the Ancient Agro Romano (129 out of the 1560 cells of the Metropolitan City) | Prevailing very low richness and uneven distribution of species of conservation concern (52% of cells without records; 32% of cells with less than 5 species; 8% of cells with 6–10 species; 5% of cells with 11–20 species; 3% of cells with more than 20 species) |
| Natural and semi-natural vegetation occurrence and distribution | C | M | Number, extent and isolation of autochthonous forest patches in the peri-urban area | Persistence of small and isolated fragments of autochthonous forests (235 patches with a mean area of 7 ha and a mean distance from the nearest neighbourhood of 338 m) |
| Landscape conservation status | C | M | Index of Landscape Conservation (ILC) measured for distinct ecological land units in the peri-urban area (the index varies between 0.0–high level of artificialisation and 1.0–high level of naturalness) | Low conservation status of occurring ecological land units (0.2 < ILC ≤ 0.4 for alluvial plains, travertine outcrops, detritic fans and polygenic conglomerates, clayey hills, volcanic hills, lava flows) |
| Protected areas; Natura2000 sites; main components of the Land Ecological Network (LEN) | C | R | Number and extent of protected sites within the Ancient Agro Romano | Lack of protected areas; 2 Natura2000 sites/core areas of the LEN (931 ha); Lack of buffer zones of the LEN |
| Quality of water bodies | C | R | Combined assessment of the biological and physical-chemical status of the Aniene water course in the peri-urban area | Ecological status varying from ‘moderate’ to ‘poor’ |
| Land use/land cover changes | P | M | Intensity and typology of changes in the peri-urban area in different time-spans (1954–2001; 1960–2008) | High incidence of urban sprawl |
| Environmental quality of the river basins | P | R | Load of pollutants (organic materials and nitrogen) from agriculture, industry, population in the Aniene River Basin | Very high pressure on the water courses from diffuse sources |
| Species | Potential Natural Vegetation | Functional Relevance | |||||||
|---|---|---|---|---|---|---|---|---|---|
| Native Trees | RIP | HYG | TRV | CLY | PYR | LVF | DIS | WLD | POL |
| Acer campestre L. | X | X | X | √ | |||||
| Acer monspessulanum L. | X | X | √ | ||||||
| Alnus glutinosa (L.) Gaertn. | X | √ | |||||||
| Carpinus orientalis Mill. | X | X | X | √ | |||||
| Celtis australis L. | X | √ | |||||||
| Cercis siliquastrum L. | X | √ | |||||||
| Fraxinus ornus L. | X | X | X | √ | |||||
| Fraxinus angustifolia Vahl subsp. oxycarpa | X | √ | |||||||
| Ostrya carpinifolia Scop. | X | √ | |||||||
| Populus alba L. | X | X | √ | √ | |||||
| Quercus cerris L. | X | X | X | √ | √ | ||||
| Quercus ilex L. subsp. ilex | X | X | √ | √ | |||||
| Quercus pubescens Willd. subsp. pubescens | X | X | X | √ | √ | ||||
| Quercus robur L. subsp. robur | X | √ | √ | ||||||
| Salix alba L. subsp. alba | X | √ | |||||||
| Ulmus minor Mill. subsp. minor | X | X | X | √ | |||||
| Native shrubs | √ | ||||||||
| Cornus mas L. | X | X | √ | ||||||
| Cornus sanguinea L. subsp. sanguinea | X | X | X | √ | |||||
| Crataegus monogyna Jacq. subsp. monogyna | X | X | X | X | X | √ | √ | ||
| Cytisus villosus Pourr. | X | √ | √ | ||||||
| Laurus nobilis L. | X | √ | √ | ||||||
| Ligustrum vulgare L. | X | X | |||||||
| Prunus spinosa L. subsp. spinosa | X | X | √ | √ | |||||
© 2019 by the authors. Licensee MDPI, Basel, Switzerland. This article is an open access article distributed under the terms and conditions of the Creative Commons Attribution (CC BY) license (http://creativecommons.org/licenses/by/4.0/).
Share and Cite
Capotorti, G.; De Lazzari, V.; Alós Ortí, M. Local Scale Prioritisation of Green Infrastructure for Enhancing Biodiversity in Peri-Urban Agroecosystems: A Multi-Step Process Applied in the Metropolitan City of Rome (Italy). Sustainability 2019, 11, 3322. https://doi.org/10.3390/su11123322
Capotorti G, De Lazzari V, Alós Ortí M. Local Scale Prioritisation of Green Infrastructure for Enhancing Biodiversity in Peri-Urban Agroecosystems: A Multi-Step Process Applied in the Metropolitan City of Rome (Italy). Sustainability. 2019; 11(12):3322. https://doi.org/10.3390/su11123322
Chicago/Turabian StyleCapotorti, Giulia, Vera De Lazzari, and Marta Alós Ortí. 2019. "Local Scale Prioritisation of Green Infrastructure for Enhancing Biodiversity in Peri-Urban Agroecosystems: A Multi-Step Process Applied in the Metropolitan City of Rome (Italy)" Sustainability 11, no. 12: 3322. https://doi.org/10.3390/su11123322
APA StyleCapotorti, G., De Lazzari, V., & Alós Ortí, M. (2019). Local Scale Prioritisation of Green Infrastructure for Enhancing Biodiversity in Peri-Urban Agroecosystems: A Multi-Step Process Applied in the Metropolitan City of Rome (Italy). Sustainability, 11(12), 3322. https://doi.org/10.3390/su11123322