Article

Role of Traditional Ecological Knowledge and Seasonal Calendars in the Context of Climate Change: A Case Study from China

1
Key Laboratory for Plant Diversity and Biogeography of East Asia, Kunming Institute of Botany, Chinese Academy of Sciences, Kunming 650201, China
2
University of Chinese Academy of Sciences, Beijing 100049, China
3
Centre for Mountain Futures (CMF), Kunming Institute of Botany, Chinese Academy of Sciences, Kunming 650201, China
4
East and Central Asia Regional Office, World Agroforestry Centre (ICRAF), Kunming 650201, China
5
Group of Plant Molecular Genetics and Adaptation, CAS Key Laboratory for Plant Diversity and Biogeography of East Asia, Kunming Institute of Botany, Chinese Academy of Sciences, Kunming 650201, China
*
Author to whom correspondence should be addressed.
Sustainability 2019, 11(12), 3243; https://doi.org/10.3390/su11123243
Submission received: 9 May 2019 / Revised: 3 June 2019 / Accepted: 6 June 2019 / Published: 12 June 2019

Abstract

:
A seasonal calendar, based on traditional knowledge of ecological indicators, seasonal variations and associated activities, can provide a baseline for understanding the practices of indigenous along with climatic variation. This paper investigates the ethno-ecological knowledge of indigenous people in Taxkorgan regarding the use of ecological cues to conduct seasonal activities that harmonize with climatic variations. Meteorological data from the nearest station was used to understand climatic variations and develop indices. The results revealed that indigenous elders still adopt traditional methods to decide the time of various annual activities observing and using seasonal cues, such as the height and color of grass, the arriving of migratory birds and phenological observations. Moreover, same or diverse indicators were used at settlements located in different elevations. The analysis revealed that the region was recently getting warmer and wetter compared to previous decades, and local perceptions were matched with climatic recordings. Local inhabitants already practiced earlier plantation of crops (e.g., wheat) in recent years. Climatic indices calculated revealed and validated recent weather condition can support earlier plantation of crops. Hence, the strong forecasting system using meteorological evidence to support existing local knowledge on ecological indicators and adjust seasonal calendars can improve indigenous people’s abilities to cope with climate risks. Furthermore, this can support in developing adaptation schemes that respond to community needs. The approaches and findings can be used to facilitate the management of these natural resource based on the adaptive framework and to create data that can be tested in subsequent studies.

1. Introduction

Climate change poses threats to the indigenous communities in terms of food shortage and security, health, land and water resources, political and economic sidelining, and physical infrastructure [1,2,3,4,5]. Indigenous communities were considered as extremely vulnerable to climate change owing to their direct impacts on crop and animal productivity, food security [6], as well as agricultural patterns [7]. Furthermore, climate change threatens human and social development by altering customary means of livelihood, forceful migration and finally traditional knowledge loss [8,9]. Indigenous communities are active in a broad range of ecosystems [1], they can provide valuable information about social-ecological systems, climatic change, and traditional way of adapting to changes in the place where scientific data is scarce [10,11]. Indigenous people understand and respond to climate change in creative ways, as they find solutions that may help society at large cope with approaching changes based on traditional knowledge and new technologies [2,12,13]. The Intergovernmental Panel on Climate Change (IPCC) has recommended that traditional ecological knowledge (TEK) should be included in climatic adaptation strategies [14].
TEK can contribute to the long-term resilience of social-ecological systems in addressing environmental changes [15,16]. Though predicated on ancient views and norms, TEK is highly detailed and dynamic with the changing environment [17]. TEK has been commonly used to frame social, economic, and ecological adaptation approaches, such as seasonal migration in search of resources or land management [18]. Predicting periodic changes to decide the timing of farming, migrations of livestock (transhumance) and gathering of resources are few examples of TEK applied to an adjusting environment [19,20]. Accordingly, such knowledge can help assess how the socio-cultural values of indigenous communities inform environmental management decisions [18]. Studies of indigenous communities in Africa [11,21], Asia [22,23], Australia [20], and South [18,24] and North America [25] all revealed that indigenous communities have utilized various ecological indicators and approaches based on TEK to predict weather conditions, interpret implications and assess their ecosystems and available resources [26]. Based on their TEK, indigenous people have shifted their crop type to adapt to climate change [11]. They used several indicators to identify seasonal changes and kept records of the times. Vegetation and insects, soil texture [21], typical plant species [23] and even human body acted as a time indicator [22] to illustrate the variations of the changing environment and conduct the annual activities such as predicting the suitable time for hunting, fishing, and farming.
Most of the researches on adaptation to climate change have been focused on tropics and lowland (e.g., Ghana, Zimbabwe and Brazil) [11,21,27]. Recently, documenting the traditional knowledge of aboriginal mountainous communities (e.g., alpine Himalaya region, Ethiopia and Tanzania) [15,28,29,30] was considered an essential task. under the higher climate changing rate and harsher environmental condition, communities in high mountains have been and will be affected by climate change compared with those living in lowland areas [31]. Mountainous communities have limited livelihood options, food supply, as well as water access [32,33]. They have learned to exploit their limited resources to adapt to the harsh and changing climate of mountain ecosystems [34]. For instance, pastoralists in high mountains primarily adopt centuries-old ancestral seasonal migratory livestock raising as a key mechanism for enhancing their ecological sustainability [35,36]. Climate change may also affect the traditional ways to predict seasonal changes for such activities. Besides, indigenous communities use the firsthand observations as ecological indicators [23] to decide the timing of seasonal activities, e.g., farming, which could also change with climate change. Therefore, it is important to record main ecological indicators in the mountains, including which biological and physical changes can indicate seasons, and how communities utilize these indicators.
This paper aimed to evaluate the role of TEK in the seasonal activities of the indigenous mountain community. The overall objectives of this study were to document ecological indicators used by local people accordingly to synchronize their annual activities, and the role of TEK in these indicators within the context of climate change. For this end, this study focused on four questions: What do indigenous people examine in the surroundings to recognize environmental changes? What ecological cues help people to make seasonal activity decisions, and do they depend on such cues? How do indigenous knowledge practices and indicators differ according to environmental conditions and elevation? Do climatic patterns in the region corroborate with people’s perceptions of climate change and their resulting shifts in practices?

2. Materials and Methods

2.1. Study Area

The study was conducted in Taxkorgan Tajik Autonomous County (35°37′ N and 38°40′ N latitudes, and 71°20′ E and 77°01′ E longitudes) in southwest Xinjiang, China (Figure 1) in the eastern Pamir Plateau. The county cover area of 25,000 km2 (average elevation 4000 m), which includes soaring glaciers and winding canyons. The cold desert type of climate in Taxkorgan is overly frigid to support forests, and its fragile ecosystem is highly sensitive to climate [37,38]. The weather conditions along with the strong and steady winds are major inhibiting factors of conventional plant’s growth. Taxkorgan is dominated by an open alpine vegetation landscape, and trees are only present in some valleys below 3400 m [37].
The major indigenous community living in Taxkorgan is Tajik (82.21% of the total population). Besides, Han people (5%) also reside in the county, along with ethnic minorities such as Kirgiz (5.78%), Uyghur (5.16%) and others (0.23%) [39]. The settlements examined in this study mainly included Tajiks (and Kirgiz in one village), of which the major occupation is livestock keeping, primarily yak, sheep and goats, as well as a few cattle [38]. Some had recently begun practicing sedentary farming. The Kirgiz people living in high mountains and in similar environmental conditions to the Tajik people, though they speak a different language. Indigenous people were formerly nomadic, whereas they recently changed their way of life to context-specific migration patterns, thus ensuring fodder availability and pasture sustainability [40].

2.2. Sampling Sites

Indigenous people at different altitudes might engage in diverse agricultural activities and ecological indicators they used might also be varied. Therefore, this study considered nine settlements (Figure 1) located at a different elevation (Table 1) to understand variation in farming and livestock husbandry practices.

2.3. Data Collection

From November 2017 to August 2018, we visited the survey sites five times so that we could witness local activities during all seasons. During each visit, key household surveys, focus group discussions (FGDs), and semi-structured interviews were conducted [15,28] based on recall method for the past five to ten years to investigate the usage of TEK by indigenous communities in adjusting their activities to seasonal and climatic variations. The collected data were informed by factors such as the general understanding of climate change and traditional practices used in Taxkorgan. Local assistants were hired from each community for the surveys in the native languages. Our study area is sensitive, therefore it was not easy to interview local residents or gather them for discussion. We conducted our surveys and interviews after getting permission from the local authority, and can just have the indigenous people who were willing to participate in.
The household survey was conducted with sample households randomly. For the selection of the sample households, a list of all households was taken from the Taxkorgan Nature Reserve office. We discussed agriculture, socio-economic activities, natural events, and observations of weather events with key informants. The interviews were conducted according to the same procedure in all study sites.
The FGD consisted of community members aged between 31 and 85. In this paper, the population aged over 60 years were considered the elder group, taking up 57.5% of the total population. These FGDs were conducted in 15 independent groups, of which each group consisted of seven to ten members, all of whom were polled on different issues, including their farming calendar, transhumance schedule, social activity calendar, as well as the perception of climate variability, climate change and ecological indicators.
The semi-structured interview with knowledgeable people from the community was conducted in the second round of interviews to obtain in-depth information about their lifestyles, community situation, local natural resources, and climate conditions. The key informants shared their built-up knowledge systems and life experiences. We used photographs of wild plants, birds and animals during a household survey, FGD and semi-structured interview after verified from the authority. The meteorological data (1957–2015) from Taxkorgan town was used (Figure 1).

2.4. Data Analysis

Qualitative data from FGDs and semi-structured interviews were analyzed and interpreted in the form of narratives, seasonal calendars, and descriptions. Indicators identified by the community are listed, and how such indicators are used by the community are explained. In this context, the term “indicator” refers to a certain natural phenomenon occurring each year with some variation, e.g., greening of rangeland, change in water level in streams, or the arrival of birds easy to recognize by indigenous people. We also used a ‘seasonal calendar’ to define the calendar that indicates season-wide activities with regard to agriculture and animal husbandry [41].
Comparisons were drawn for farming and livestock-related activities at different settlements located at various elevations. Data were analyzed using descriptive statistics and ordinary least square analysis for temperature and rainfall. In addition to general temperature and precipitation trends, we calculated two indices to understand the weather patterns within the region and the linkage with indigenous people’s activities, viz. growing degree days (GDD) and standard precipitation index (SPI).
The GDD is an indicator that helps understand the growing period and appropriate crop for the area of interest. GDD was calculated for major crops throughout the region, viz. barley and wheat. Their development and growth are largely influenced by daily temperature higher than the base temperature (Tbase). To calculate GDD, the temperature is the major component used [42], as expressed in Equation (1)
G D D = [ T m a x + T m i n 2 ] T b a s e ,
where Tmax denotes the maximum daily temperature; Tmin is the minimum daily temperature. Heat accumulation of above 1810 °C is required for the maturity of wheat (Tbase = 2.6 °C), and above 1450 °C is for barley (Tbase = 0 °C), according to the literature [42,43,44].
The SPI is one of the most useful indices to detect, monitor and evaluate drought events [45]. The SPI calculation for a location is based on the long-term precipitation record for the selected period, which is then changed into a normal distribution, thus creating a variable with a mean of zero and a standard deviation of one [46]. The SPI for a period d (month m) of duration n month is expressed in Equation (2).
S P I d ( n ) = P m ( n ) P ¯ m ( n ) S d m ( n ) ,
where Pm(n) denotes precipitation of duration n months ending in month m; ( P   ¯ ) is average precipitation; Sd is the standard deviation. Drought and wetness severity defined in terms of SPI values are listed in Table 2 [45].

3. Results

3.1. Temperature and Precipitation Trends

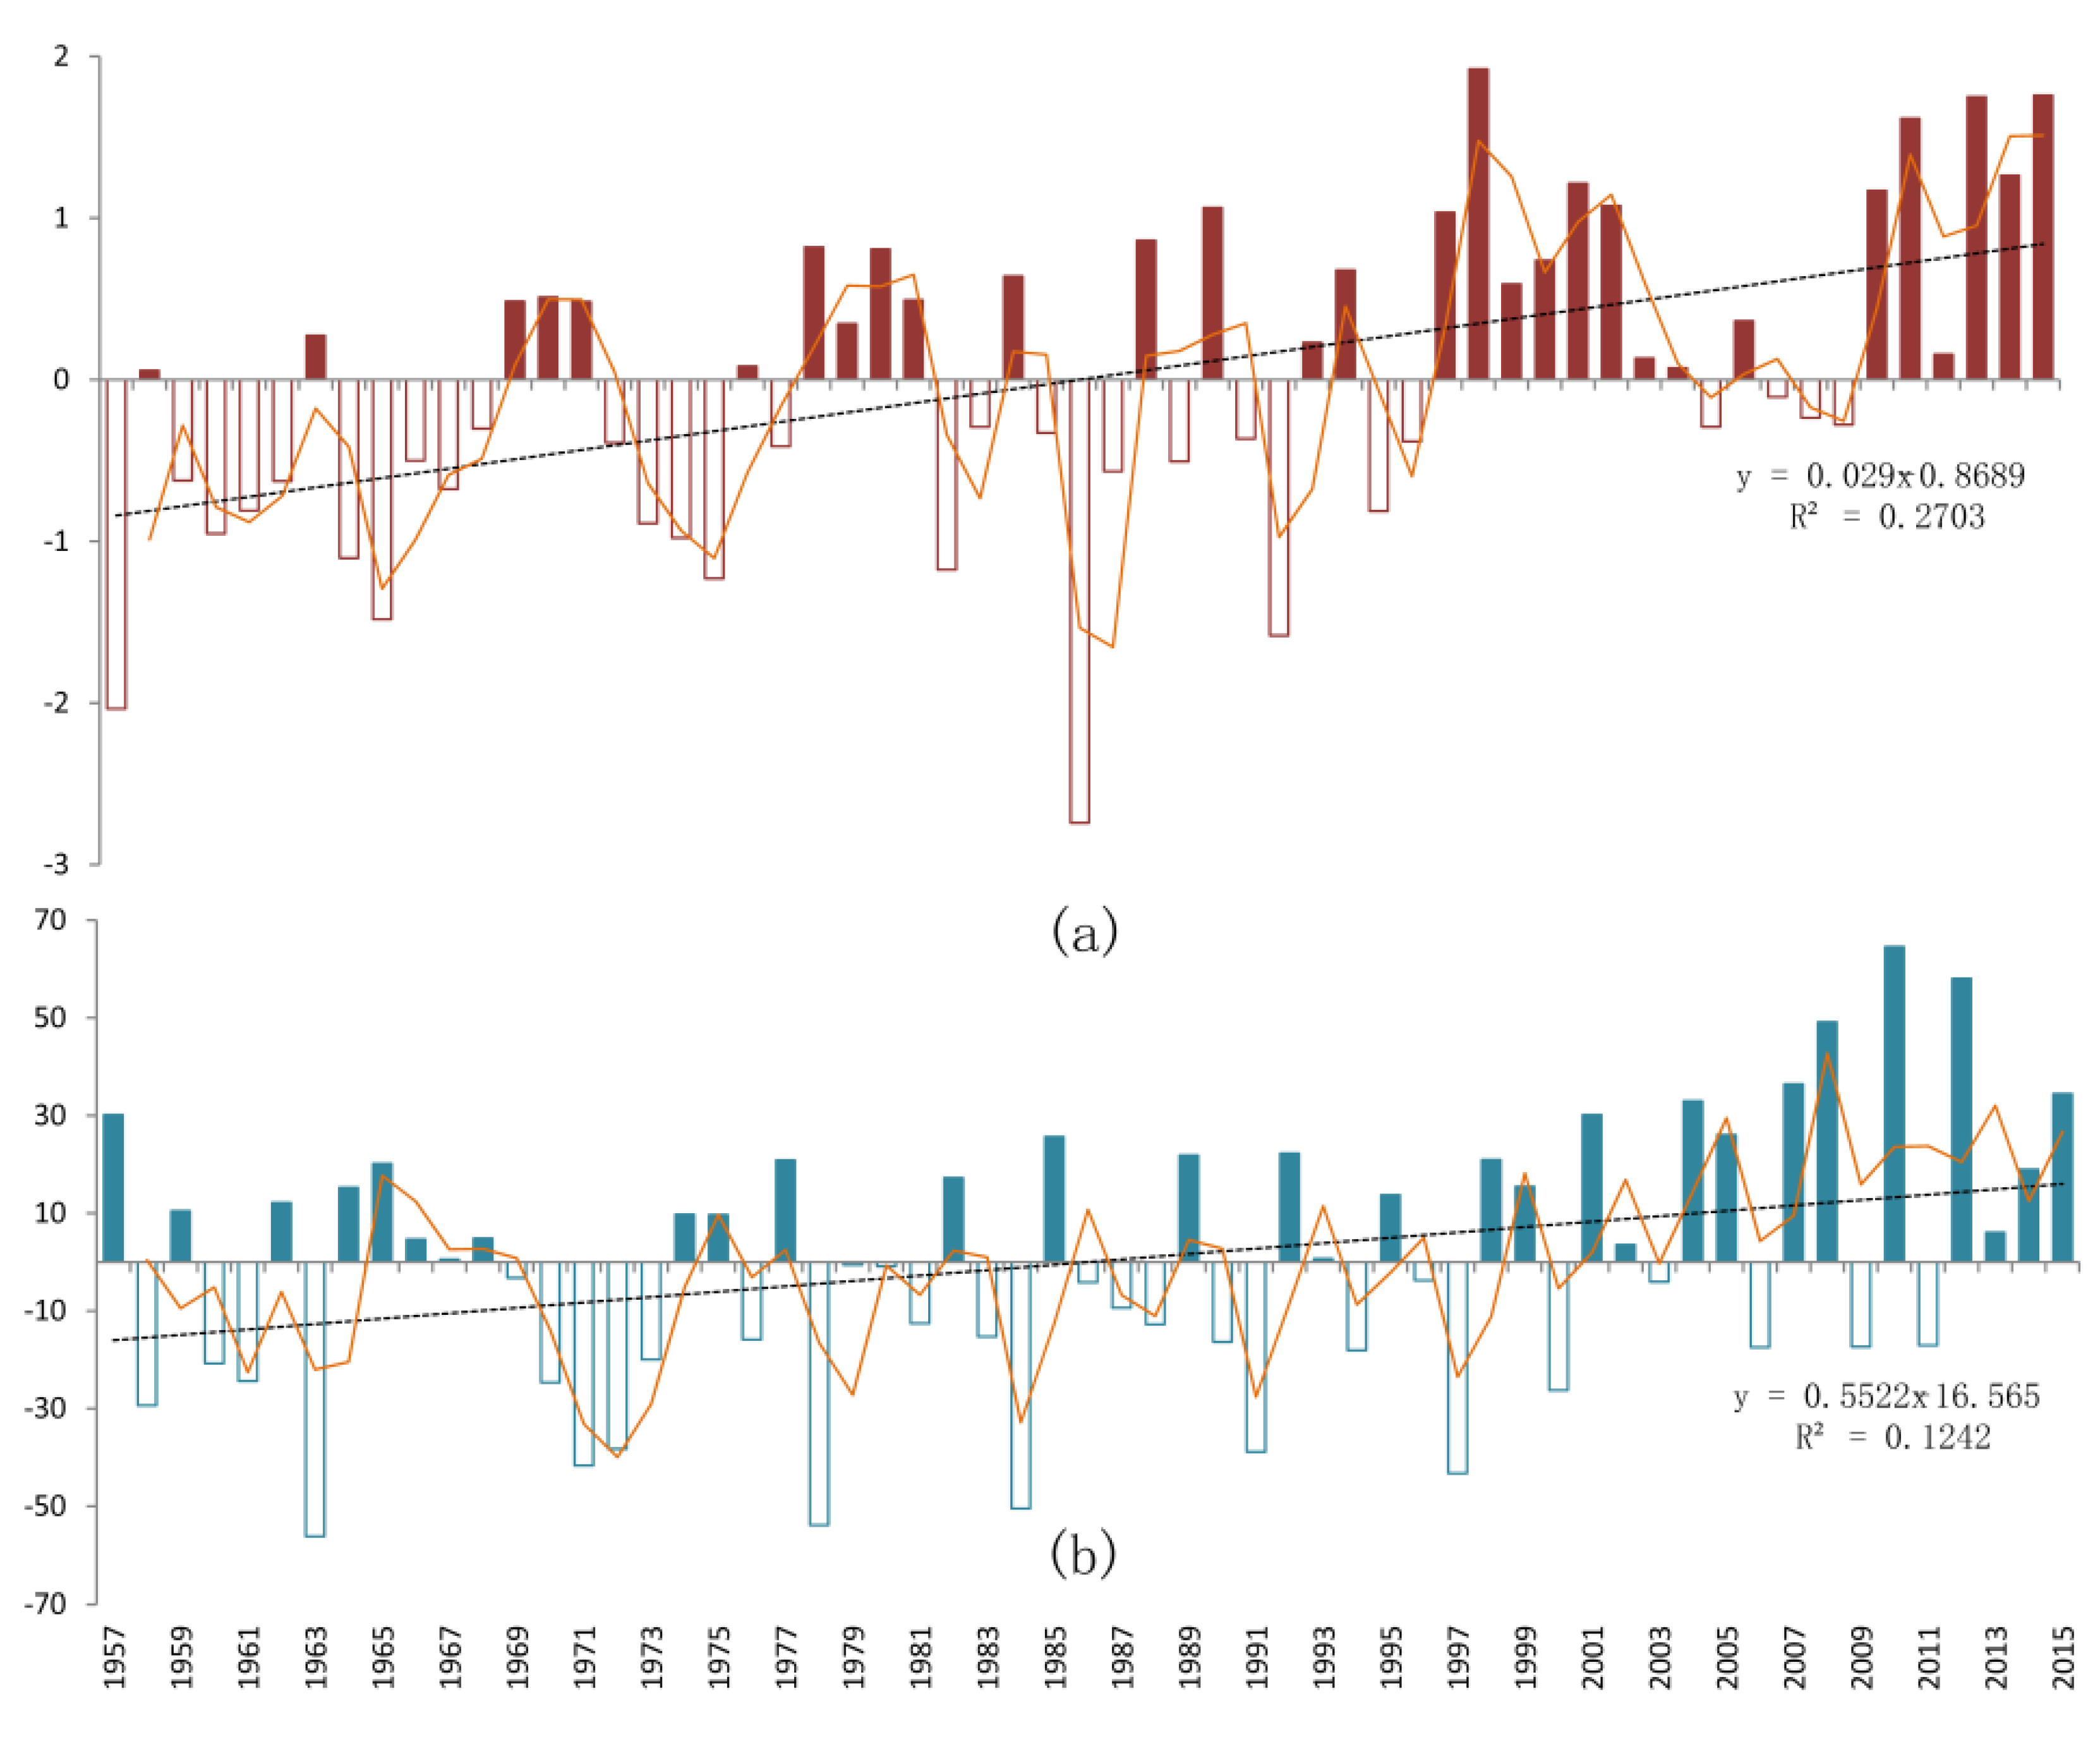
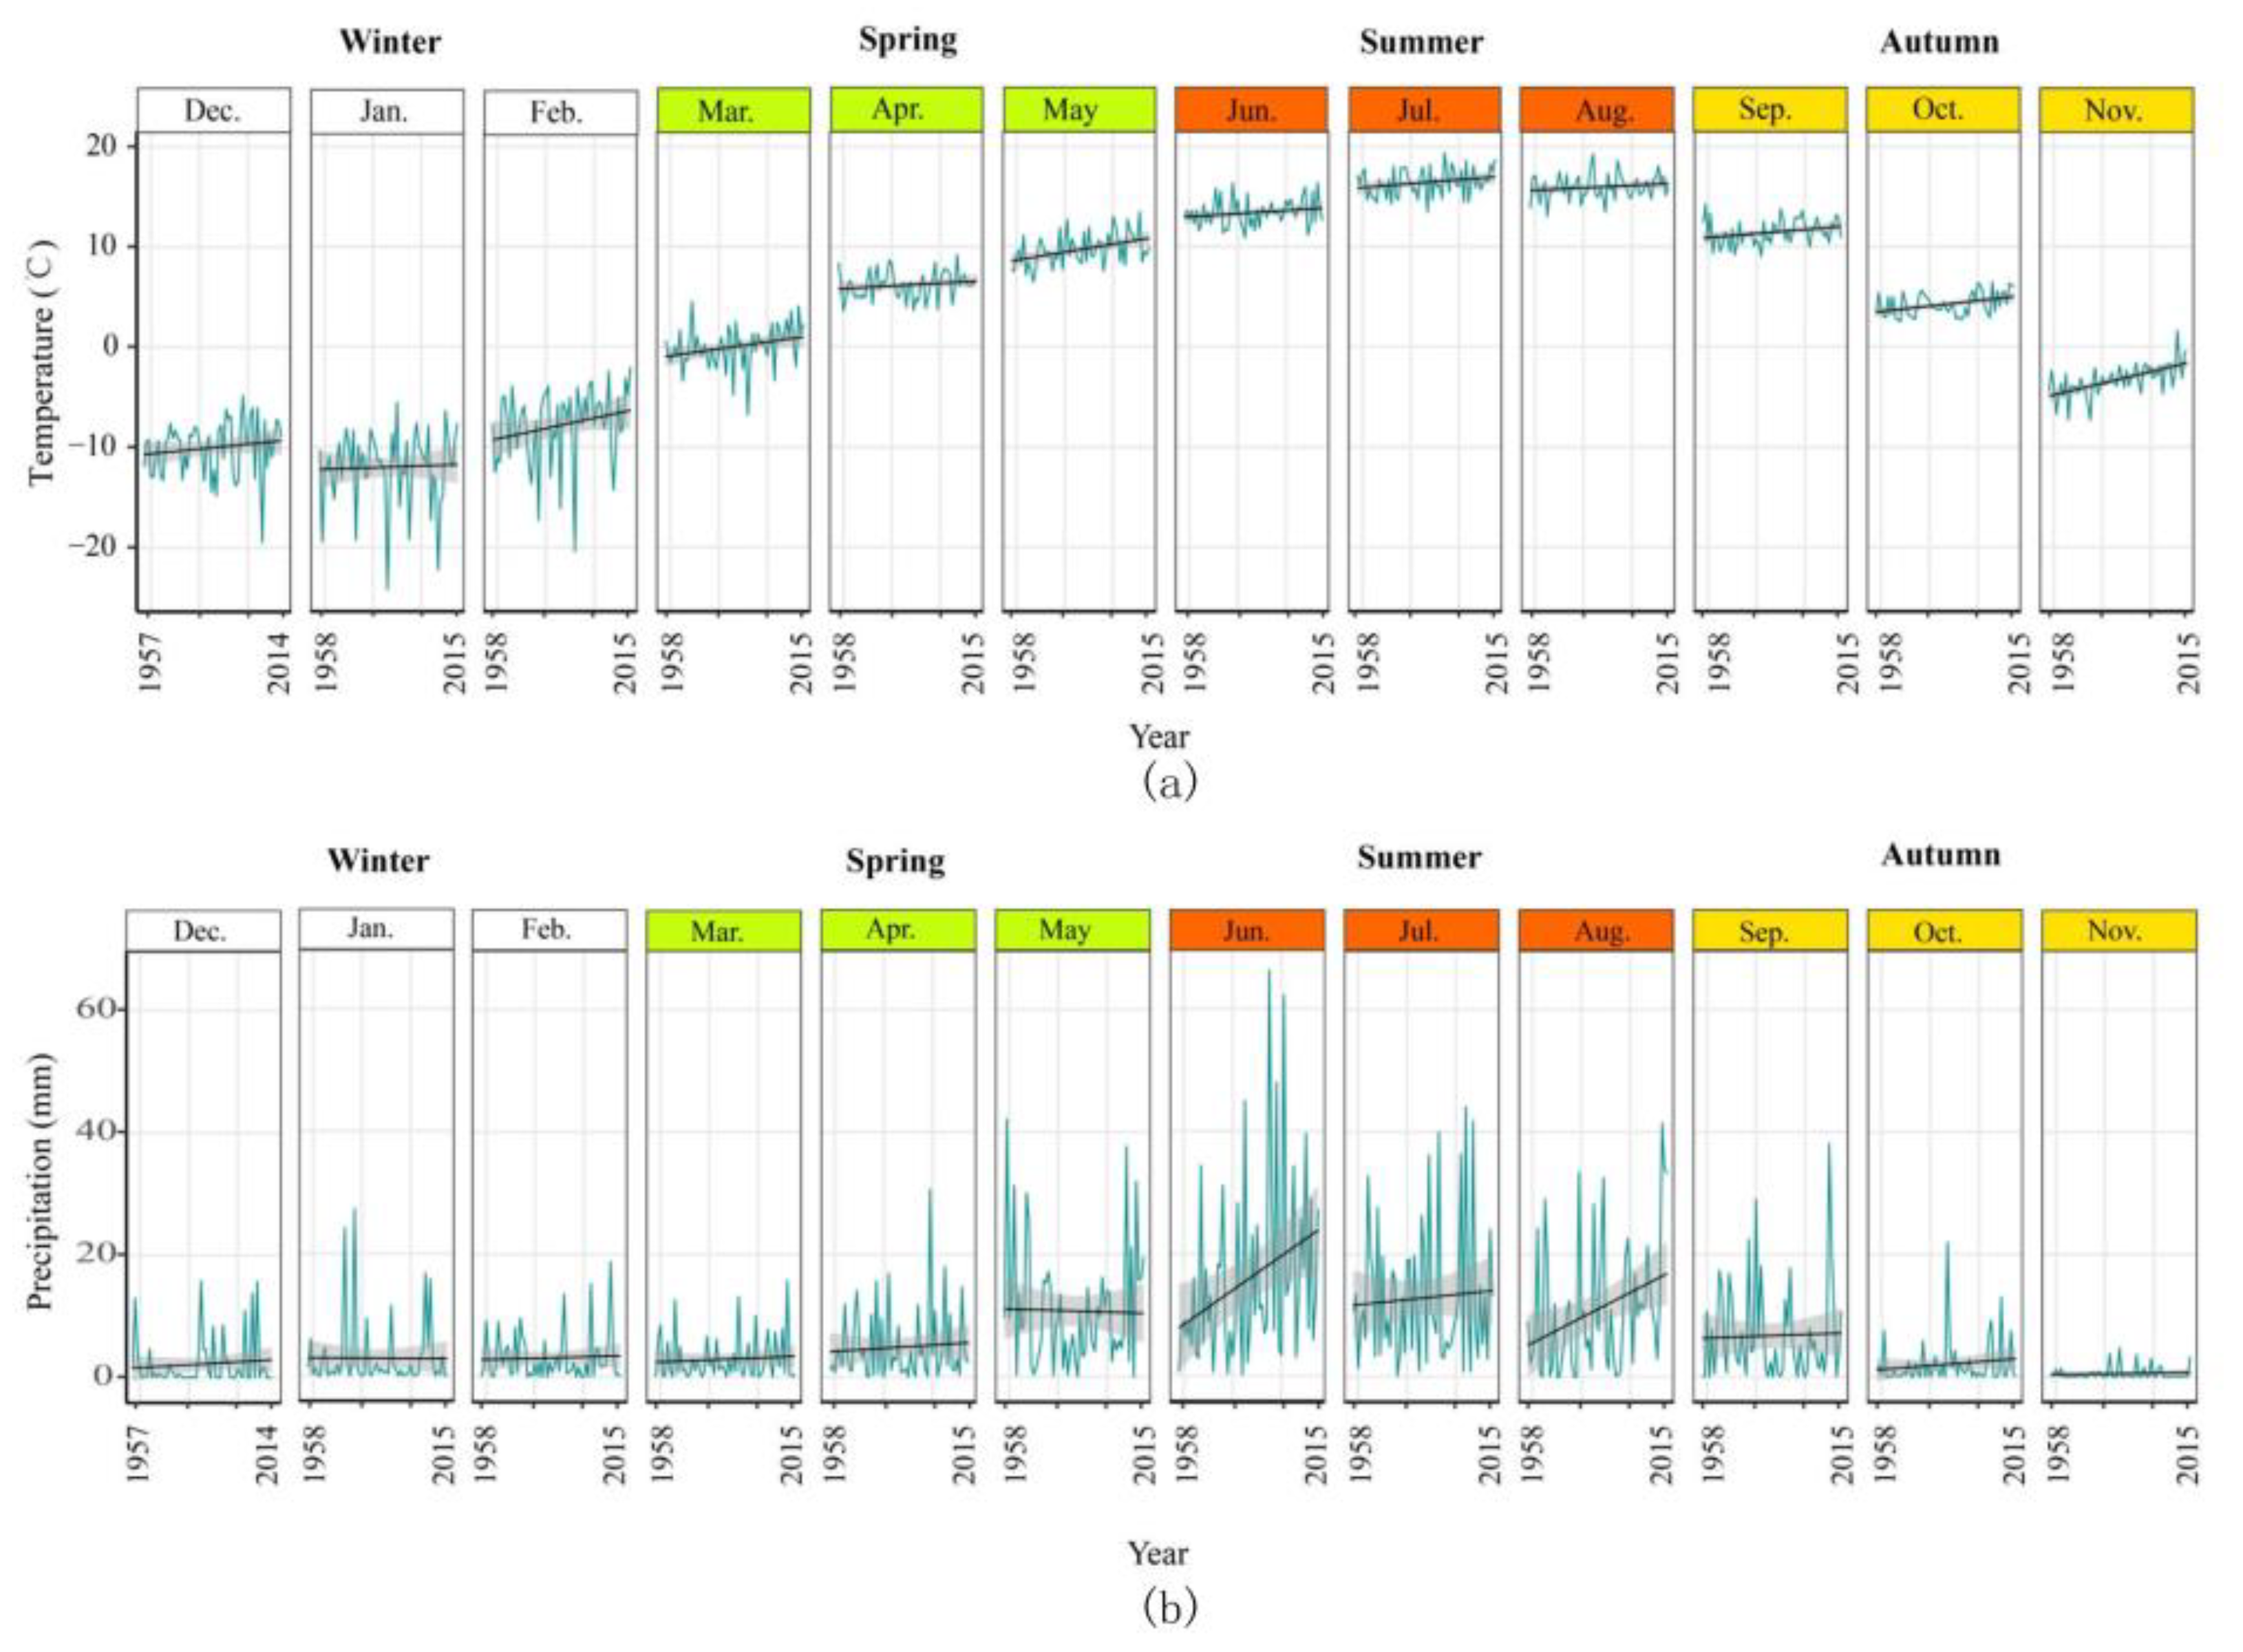
According to temperature and precipitation recordings from the meteorological station, an increase was revealed in both entities from 1957 to 2015, especially after the year 2000. During these 59 years, the temperature rose by 0.29 °C (p < 0.001), and precipitation increased by 5.5 mm (p < 0.001) per decade (Figure A1). During our field survey, local people noted the winter warming and increased rainfall in summer compared with those in past years. Long-term meteorological data is therefore correlated with local perceptions of climate, revealing an increase in late autumn and winter temperatures (Figure 2a). Winter warming might lead to the decreasing length of snow reason in winter, as mentioned by locals. The significant increase in rainfall during August was consistent with the perception of locals. Besides, locals also detected an increasing pattern of rainfall in June (Figure 2b).

3.2. Indicators and Seasonal Activities

In the local language, the four seasons are known as Wook (spring), Minch (summer), Peaze (autumn) and Zemstoon (winter) (Table 3). TEK has been found to play a key role in regulating livelihood-related and social activities in different seasons. The main elements of the TEK used by locals are biotic and abiotic indicators, which guide timing annual activities. We classified the indicators into four classes: (1) Geological events, e.g., softness of land; (2) snowfall/snowmelt, precipitation, water level and heat/cold; (3) plant phenology, e.g., budding, blossoming, and condition and height of grasses; (4) animal behaviors, e.g., the timing of wild animal hibernation and migrating birds. According to our elder informants, these indicators help them initiate seasonal activities and have been passed down for time unmemorable. However, while many locals still follow natural cues to initiate seasonal activities, it is no longer obligatory to do so.
The livelihoods and timing of associated indicators differ across communities in Taxkorgan. Definite timing cues are created based on the climatic variations to help locals adapt to seasonal variation and even to climate change. These strategies include migration to pastures located at different elevations, the timing of crop-planting, and conducting social activities. Besides weather, several factors, such as water distribution, elevation, and farmland size, also affects the decisions on seasonal activities.
We picked indicators based on local observations within seasonal differences and activities into the integrative calendar (Table 3). Using or perceiving indicators, including the appearance of migratory birds (Motacilla alba and Motacilla citreola), the height of grass and the conditions of farmland, etc., indigenous people conducted their activities for the aims of food production, livestock keeping, and fodder and medicine searching. Meanwhile, they created approaches to protect themselves from fuel material shortage (firewood searching) and UV (plant oil making), due to high elevations. These are the indicators that local people recognized, associated with their seasonal activities, and passed from generations.

3.2.1. Transhumance Activities

There are four seasonal pastures, named after the seasons as Wook Ailagh, Minch Ailagh, Peaze Ailagh and Zemstoon Ailagh, respectively. Members of indigenous communities migrated to different pastures two to four times a year, and the timing of migration was based on local observations and indicators (Table 3). We conducted interviews, especially with village elders, and classified the indicators into four classes:
(1) Warm/cold perception was the most direct indicator in recognizing changes in the season based on warm or cold sensations. This perception is commonly used as an alert in observing changes in the surroundings and preparing to migrate.
(2) The quantity of snowfall during winter helped indigenous peoples to determine the timing of migration to spring pastures. Our informant (Mr. Palibaksha, 82-year-old, at the Mazhar site) said, “We move ahead of time if there is no or little snowfall in our village in the last winter”.
Snow conditions were a good indicator for them to understand the conditions of the grass, as well as fodder resource availability. According to the elders and experienced members at Dabudar, “Heavy snowfall on top of mountains and summer pastures refer to good conditions for the grass and an abundance of fodder in the coming year”.
(3) Narrowed or disappeared rivulets/streams indicated it was the time to move down from higher elevation pastures, and frozen water in rivers indicated it was time to return to villages.
(4) The condition for growing grass was the critical indicator in starting annual migration. Indigenous communities built a relationship between the height of grass and the proper time to move from one pasture to another. The timing of movements to spring pastures was indicated by the height of grass, nearly one to two knuckle widths (Figure 3a); for the timing to summer pastures, the height of grass grew as high as three-five fingers (Figure 3b); when it was the time to move back, the grass had turned yellow and withered.
Migrating to seasonal pastures was regarded as the most important activity, especially for access to fodder resources available to livestock while the other agricultural activities were complimentary (Figure 4a). We found that TEK regarding grasslands (Figure 3) and wild animals (e.g., wolves) was essential for local people to continue to access forage resource and avoid frequent encounters with wild animals that impair or kill livestock.
We were informed by respondents that they visit two to four seasonal pastures each year. The pastures are located at different elevations, each of which fulfills unique seasonal fodder requirements. Summer pastures were located at a higher elevation, just sites below snowlines. Spring and autumn pastures were at mid-elevations, and they can be located at the same or different locations, while winter pastures were at a lower elevation. During late summer and autumn, they collected fodder to stall-feed livestock during winter. Furthermore, it was also found that certain communities never moved to spring and/or autumn pastures; rather they return to their settlements from summer pastures. Accordingly, we found three distinct types of seasonal migration patterns among indigenous people.
In the Chinese system, one month is commonly split into three phases. Each phase is named as “Xun” in Chinese. Our interpreter used the term “Xun” to describe the period in questions, and the locals understood it. Thus, the same term was used to describe our findings. One month was divided into three Xun, each of which contains 8 to 11 days (normally 10 days and the last 8 (9) days for February and 11 days in the months with 31 days). Hence, our report included a total of 36 Xun for the year. It is noteworthy that the indigenous people residing at different elevations had different calendars for seasonal pastures (Figure 4b).

3.2.2. Seasonal Cropping

Indigenous people in Taxkorgan also practice sedentary farming as part of traditional activities. By celebrating a meaningful festival called “Yinshui Jie” (“water diversion festival” celebrated around 21 March), they identified the arrival of spring and initiated crop plantation (Table 3). Along with the elevation, indigenous people chose to plant specific fruits/crops at different times according to the local climate. Major farming activities were observed below 3500 m, and highland barley, peas and wheat were the main crops. Highland barley was grown above 3000 m, and wheat below 3000 m, while peas were grown throughout the farming elevation zone. Fruits (apricot, walnut, apple and grapes) and crops were grown at lower elevations (at 2500 m). Apricots grew at a higher elevation than other fruits, whereas they still relied on microclimatic conditions. Langan and Diee were at almost the same elevation level, but apricots grew only at Diee. For cereal crops, maize was grown at lower sites; wheat and highland barley were general crops that provided the original materials of Naan Bread, a traditional crusty pancake in Taxkorgan. Based on TEK that considers the local weather conditions, indigenous communities choose their crop-planting patterns.
They kept crops after sowing in the farmland for a specific number of days for maturity. Livestock keeping was more important when compared with farming in the region; hence, most of the crop products, particularly barley and peas, were harvested for fodder. Only wheat produced in the region was consumed as human food at present, therefore, two varieties were used for relative lower and higher sites where wheat was grown. We plotted the timing of various activities in each Xun based on information obtained from the respondents and group discussion (Figure 4b). In general, local people recognized the snow melting, the softening of soil, leaf growth in trees, apricot bloom and the arrival of birds as indicators to begin cropping in spring (Table 1). We observed delays in the timing of cropping with an increase in elevation. Geographical location, e.g., valley or plain area and aspect; water availability; weather and wind, were all important to local people to make farming decisions.

3.3. Climate and Farming

Indigenous people generally start their crop-planting in April, and harvest during September (Figure 4b). Average temperature and precipitation have continuously increased over the past six decades (Figure 2 and Figure A3), which makes the area suitable for planting an increased number of crop varieties.

3.3.1. Growing Degree Days (GDD)

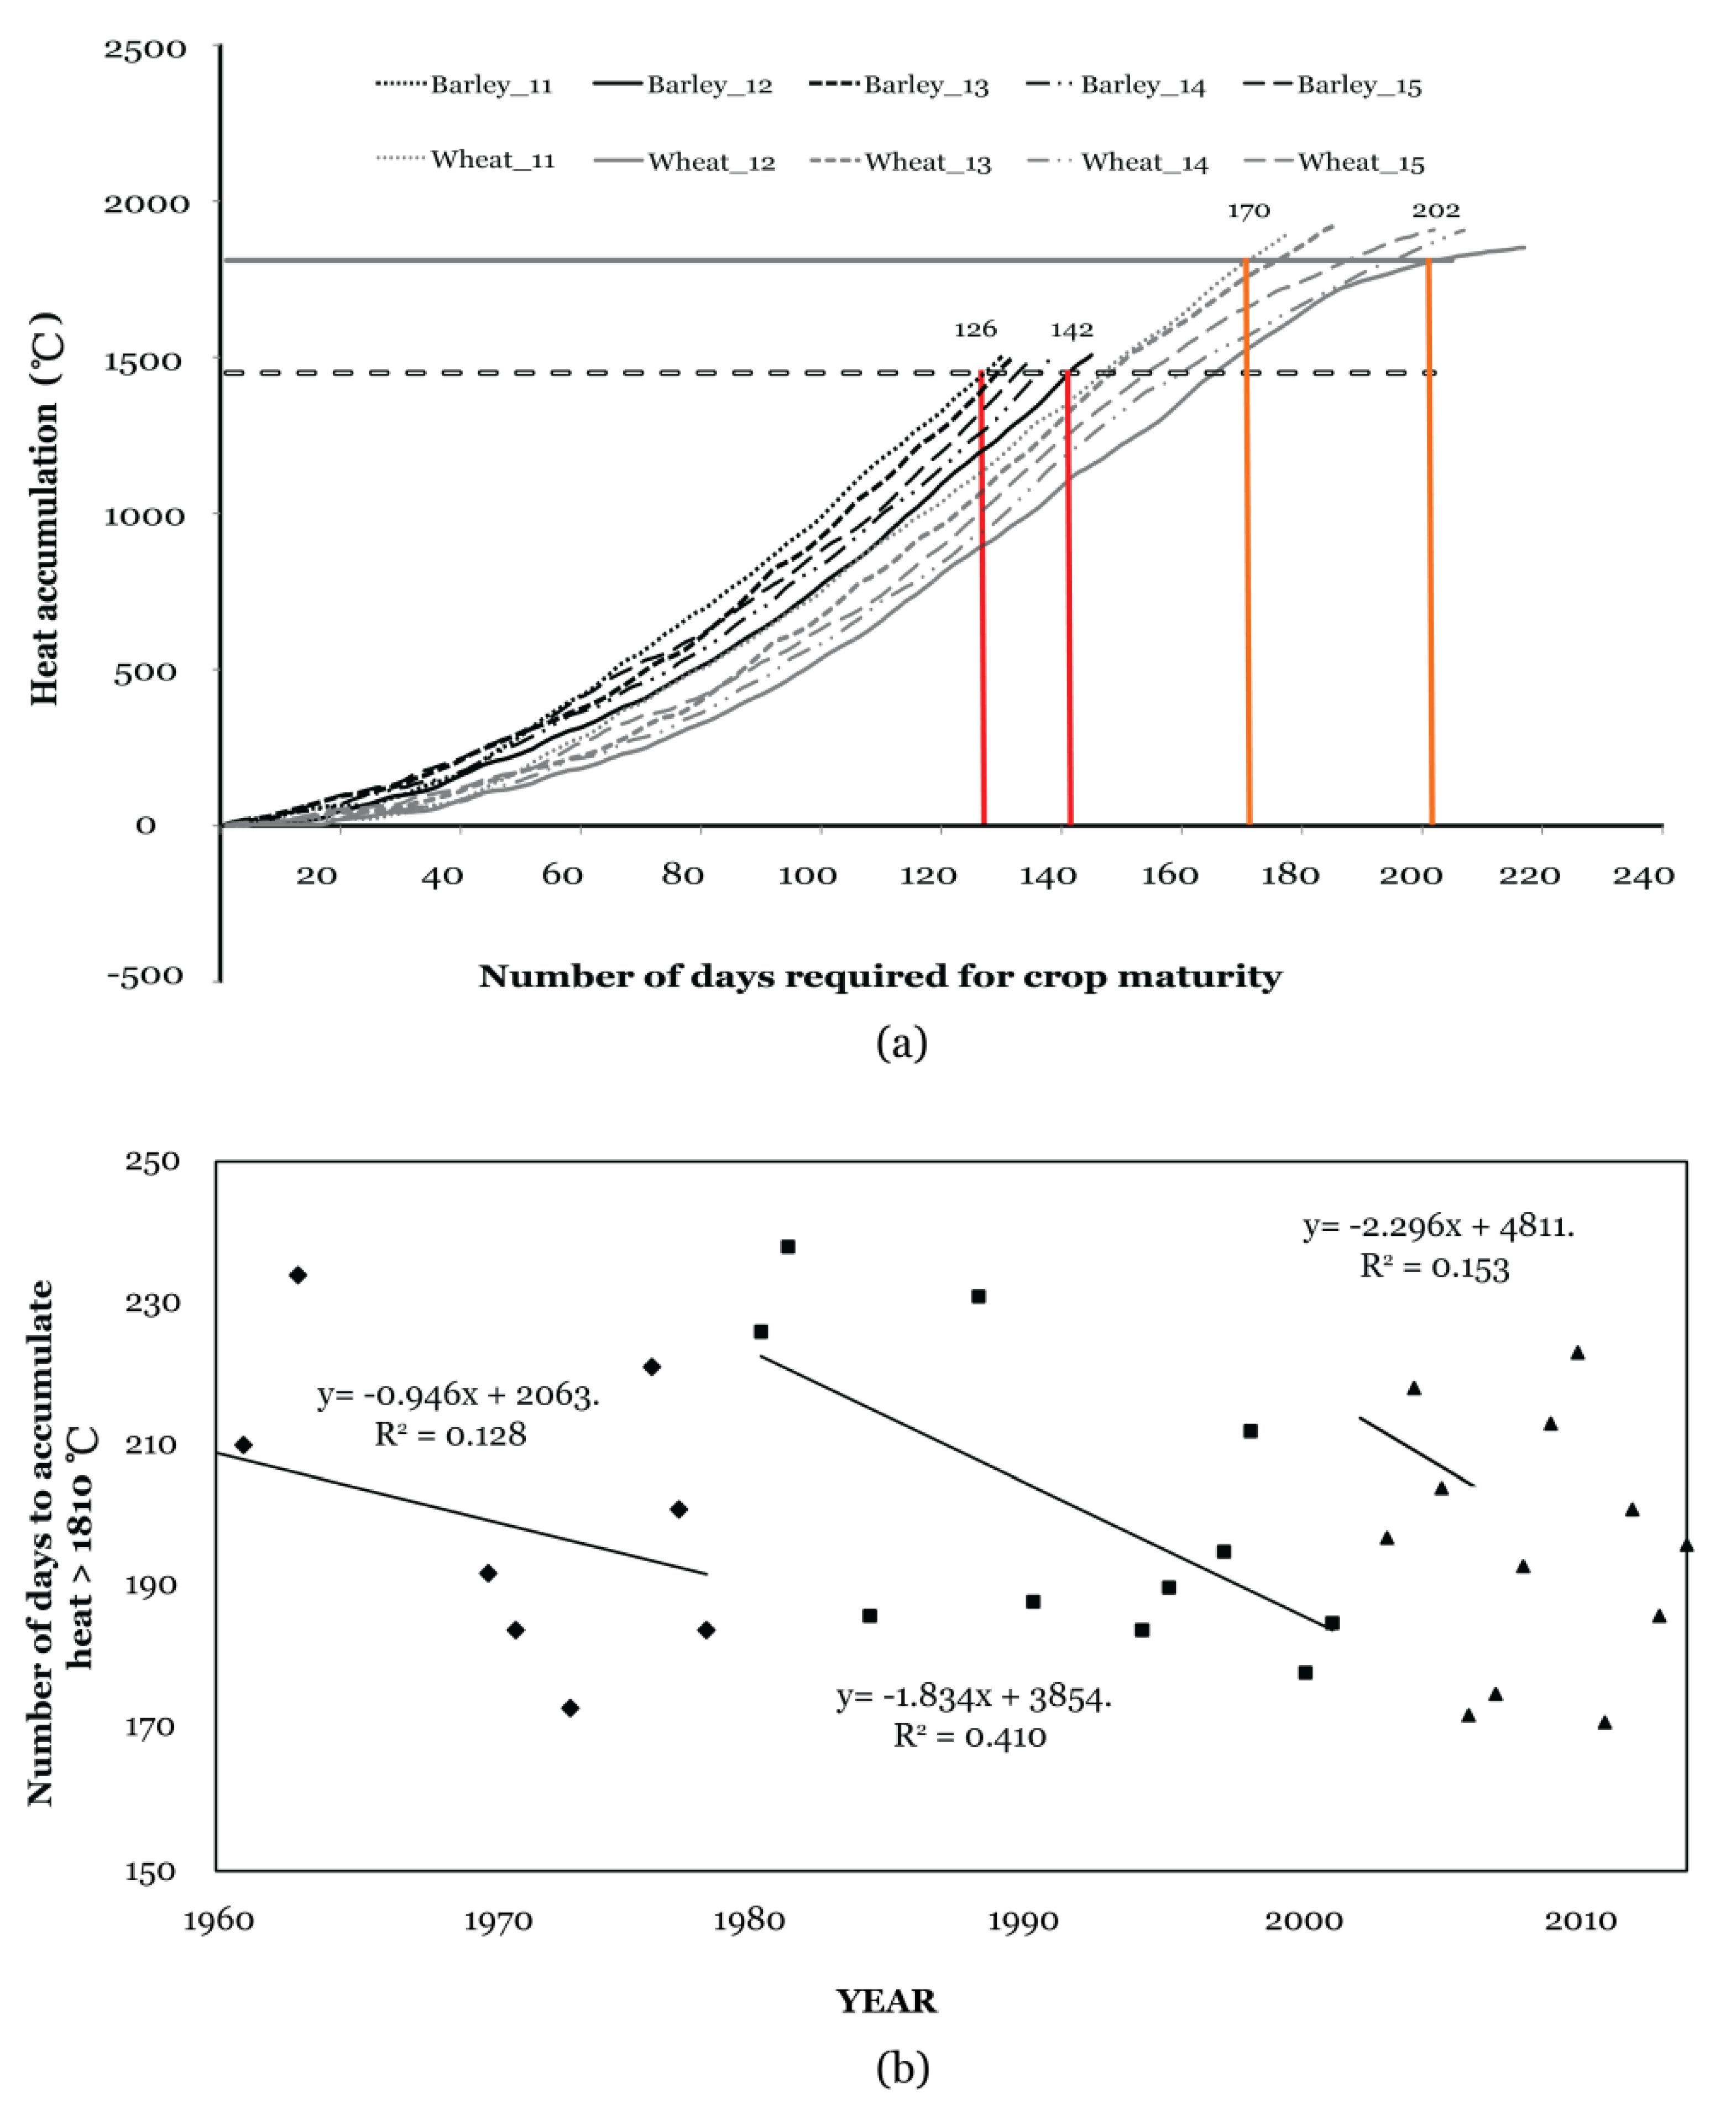
GDD calculation revealed that heat accumulation had increased yearly in the past 59 years, especially during the months of March and October (Figure A2). This indicated a lengthening of the growing period in the region for crops. We estimated the number of days to reach minimum heat accumulation for wheat and barley based on GDD for the years 2011 to 2015 (Figure 5a). The estimated number of days of maturity varies from 126 to 142 days, and 170 to 202 days, for barley and wheat, respectively. This result supported local practices of keeping crops for a specific number of days in farmland before harvest. Furthermore, the requirement of fulfilling heat accumulation might delay with increases in elevation, but in general, GDD calculation for these two crops estimated the time of maturity. We noted wheat as a model crop because it is the major staple consumed at present. Furthermore, the number of days for the accumulation of heat necessary for wheat maturation has been decreasing. We also found that heat accumulation requirements for wheat grain maturity were reduced by nine days per decade from 1960 until the late 1970s; by 18 days per decade from 1980 until 2000; and by 22 days per decade between 2000 and 2014 (Figure 5b). Sufficient warming during March indicated that wheat that could be sown in March that had once been sown in April. During the survey, our observation and information gathered also indicated that indigenous people had begun to sow wheat earlier in the past five to ten years.

3.3.2. Standardized Precipitation Index (SPI)

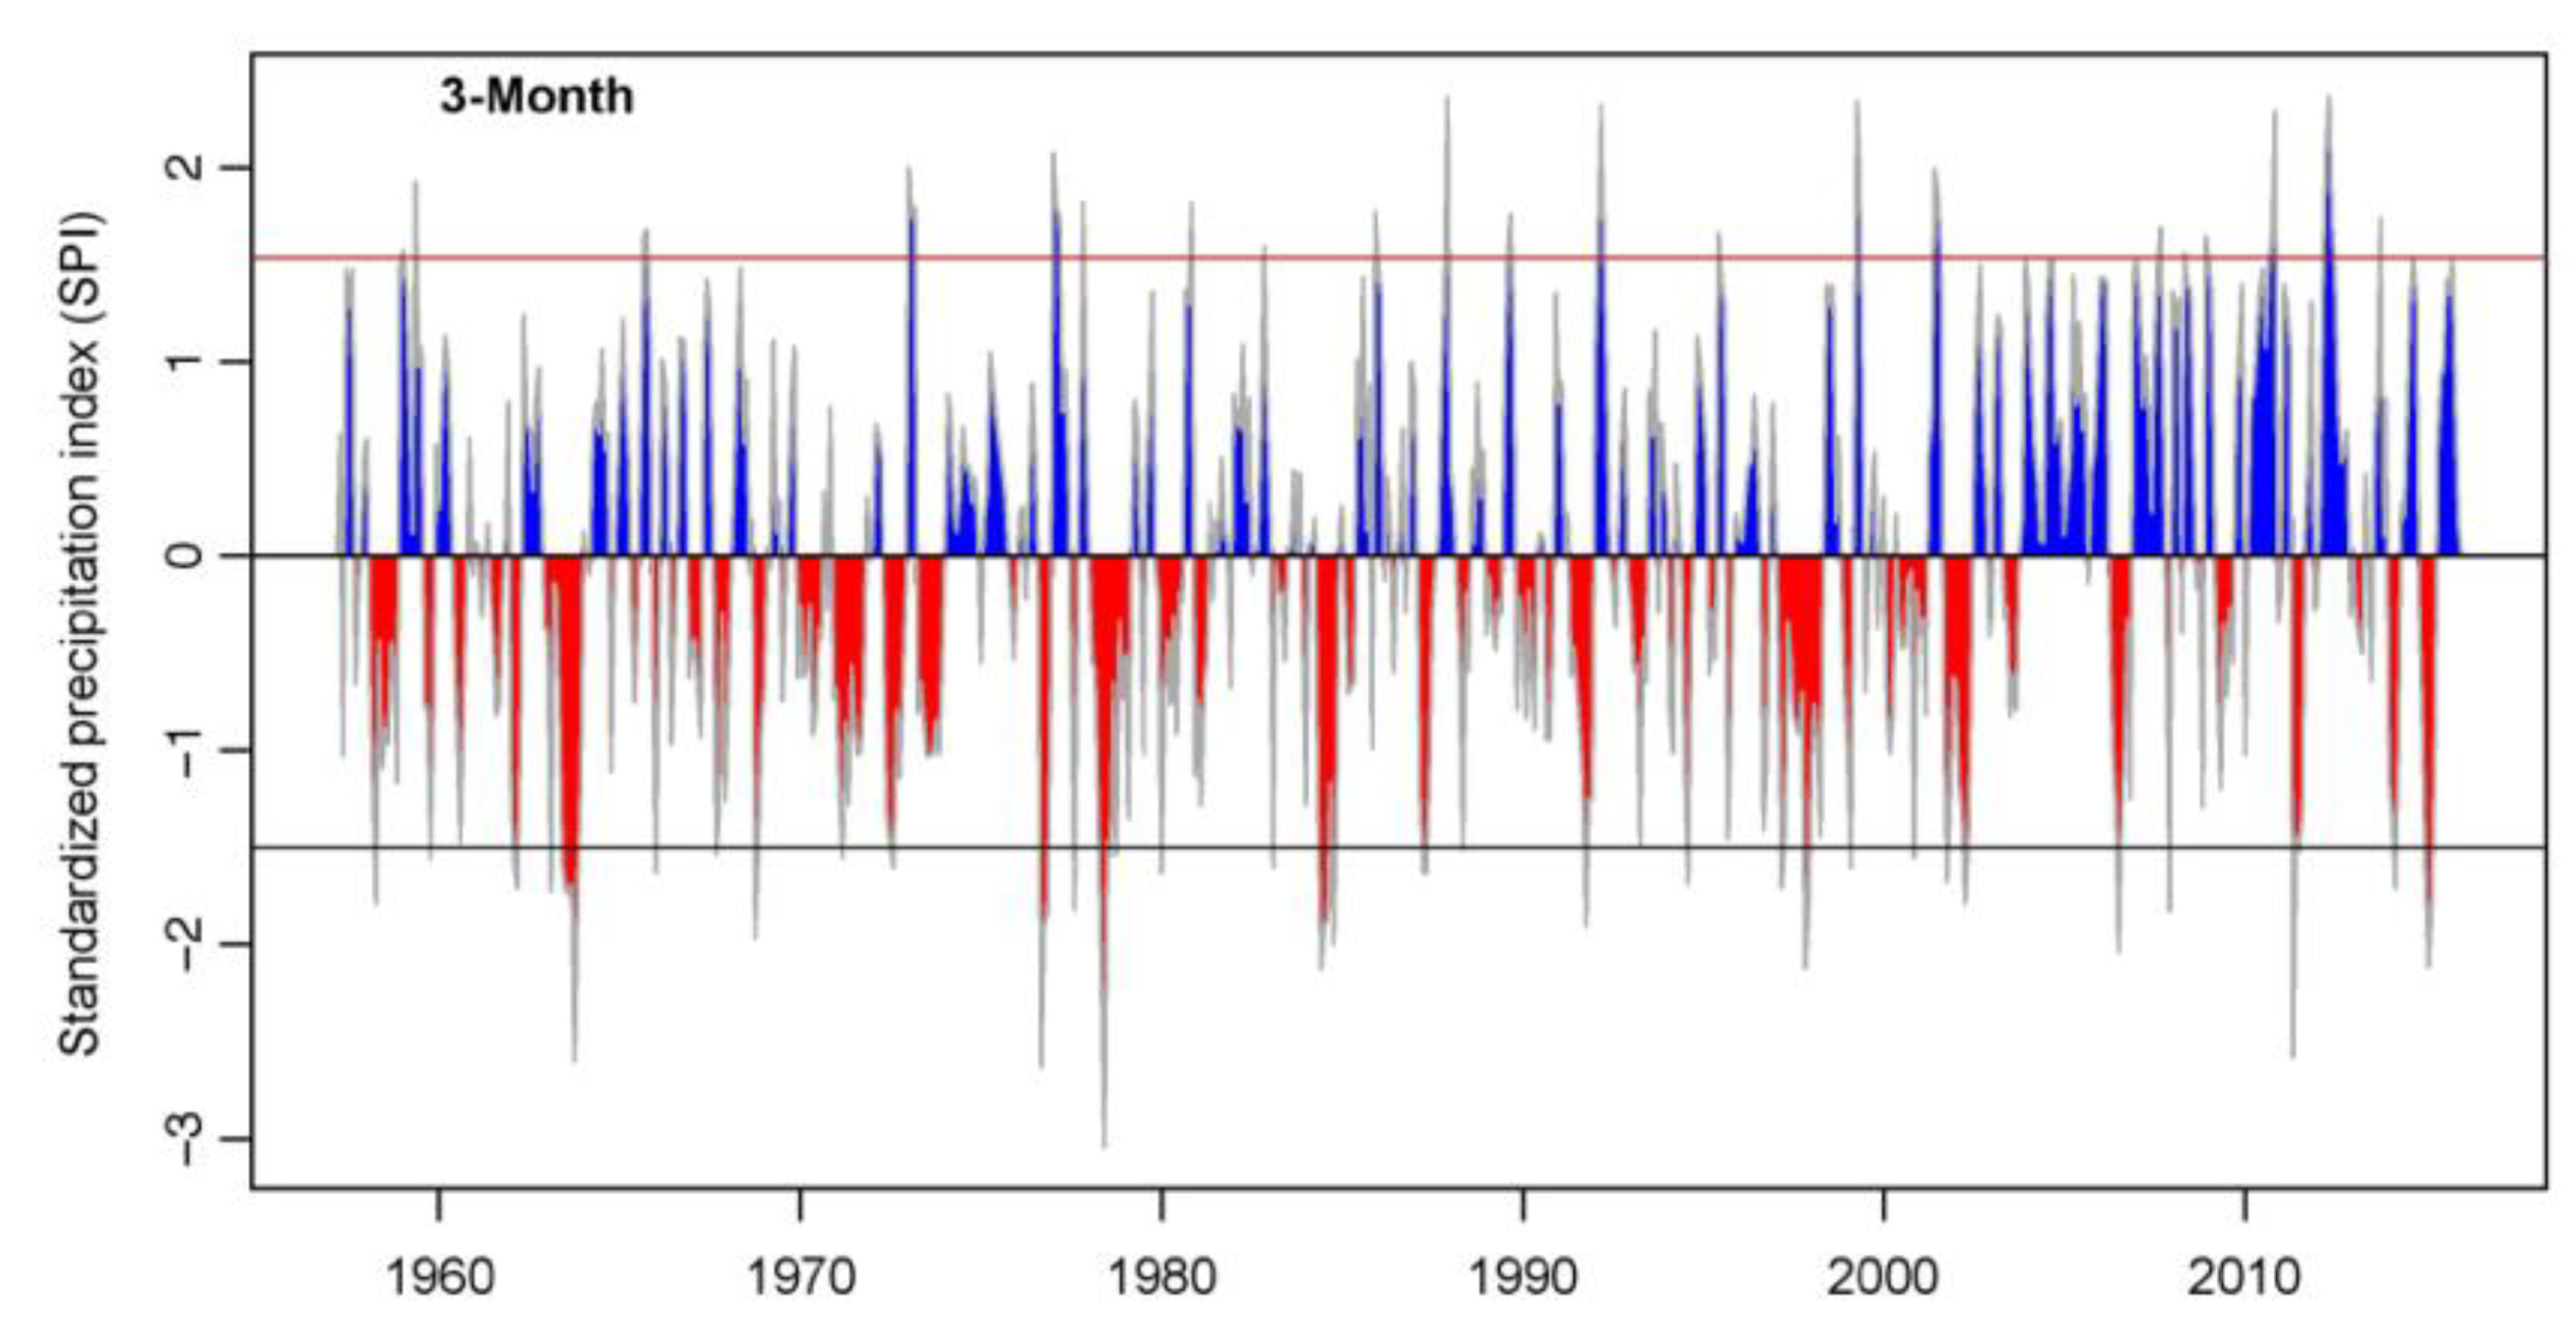
We found drought events were continuously reduced in the region. SPI value in the three-month period revealed (Figure 6) a gradual decrease in extreme and severe drought events in the region (SPI at a different time interval in Figure A3). The region was getting wetter compared with past decades, making it suitable for farming activities. Observation and information obtained during the survey also revealed more crop production in recent years, which could be attributed to an increase in the farming activities in the region. This finding again supports the possibility that indigenous people at Taxkorgan can choose more crop species in the future, which might change current crop distribution and planting patterns.

4. Discussion

4.1. TEK Based Observations

Environmental indicators that are locally used to read its signs and to interpret the expected climate conditions [47]. Indigenous peoples worldwide use cues from nature to carry out seasonal activities, according to studies from different regions [18,27,48]. The management of annual activities is based on long experiences of the aboriginal communities [11,28]. David-Chavez and Gavin [49] developed indicators for assessing responsible community engagement and identified patterns in levels of community engagement. Based on their experience and knowledge, indigenous people used indicators to interpret natural surroundings and predict both short- and long- term seasonal processes [29,50]. Besides the scientific value, indicators and TEK were incorporated in the adjustment with environmental changes [21,27,50], and in developing priorities for adaptive strategies [23,28].
In our study sites, human observation of climate and the timing of seasonal activities (i.e., seasonal calendar) were found to be attuned with natural phenomenon and are in line with the weather patterns obtained from regional meteorological stations. Previous studies suggested that indigenous peoples in different settlements worldwide used various types of signs or indicators to interpret their surroundings, forecast resources, decide activities and predict environmental processes [26]. On the whole, they developed several categories of an indicator, including: Biological signs, such as behaviors of wild animals, reproduction and migration of birds and typical phenological phases of plants, and abiotic environmental conditions, such as temperature/ precipitation, a constellation of stars, cloud cover and type, and soil condition [5,27,47,51]. Likewise, our results are consistent with these researches, which recognizes two types of indicators: Biophysical (e.g., variations in pastures and weather) and socio-cultural [24]. TEK systems were developed based on the observations and experiences continued in an application with necessary adjustments. Since local practices help to shape traditional activities, in the course of time, indicators became a valuable part of society.

4.2. Role of TEK in Annual Activities

Migration to seasonal pastures, i.e., transhumance, refers to a millenary human strategy for addressing environmental changes and climate variations [19]. Both biotic and abiotic phenomena help in decisions related to the annual migration of livestock in high mountain villages aimed at utilizing available fodder resources [52]. Furthermore, it is important to understand the most likely time of wild animal (e.g., Wolves and Dholes) attacks on livestock [38]. Understanding the seasonality of wildlife and possessing the knowledge of how to repel them (e.g., using dogs as in Taxkorgan) contributes to avoiding such a wildlife-conflict and keeping livestock safe [53]. In the meantime, people in Taxkorgan also plan the timing of the birth of lambs based on their inherited knowledge. Two factors necessitate them to control the timing of livestock birth: (1) Minimize the possibility of wild animal attack to livestock, as herders need to take care of young lambs who distract them from other livestock populations in summer [38]; (2) Matching time of availability of abundant fodder resources for goats and sheep. Thus, TEK plays an important role in such strategies and decisions that result from interactions between social, ecological, and institutional factors [54]. Our findings suggest that decisions on farming and livestock activities primarily depend on available resources and associated traditional practices, which were in line with findings from a high mountainous area in the Himalayas, Pamir and Karakoram region [22,28,33,55,56,57].

4.3. Role of TEK in the Context of Climate Change

Both mechanisms of crop production and sustainable land management are guided by TEK [11]. Climate variation risks have always been part of agricultural activities, so in most cases, Taxkorgan farmers have survived and coped with the impacts: They kept various crop patterns dispersing risk and exploited high adaptation using drought- and cold-tolerant crops [30]. However, recent weather patterns indicated a lengthier growth period. Due to climatic changes, the agro-ecological region will shift, creating opportunities for crop diversification [58]. The human-mediated migration of crops to newer regions was one of the original causes of crop diversification [59]. Thus, in the regime of climate change, several crops have a high potential to be introduced into novel cultivated areas at different elevations. Increasing wetter (as shown by SPI analysis) and warmer (based on GDD analysis) conditions, as shown by meteorological data increase the possibility of introducing new crops into the region. Besides, higher elevation sites in which only highland barley has been planted in the past years could also have the potential for planting wheat and other crops typically cultivated in the lower and mid elevations. Indigenous communities based upon their observations and experiences, have expanded certain crop and cultivation methods at different elevations [60]. Previous studies in the periphery of the Tibetan Plateau, e.g., D’Alpoim et al. [61] reported that indigenous peoples were open to adopting new economic systems and integrating new crops with necessary modifications to suit the local requirements of the area. Planting alfalfa in Taxkorgan for fodder supply since 2003 [62] is based on information from other counties. It is highly likely that they can plant more crop varieties for fodder if the growth period is shortened. More fodder resources available near settlements could reduce the time needed to migrate from one pasture to another, and therefore, more time can be spent on farming to ensure food security. In addition, growing more crops, including fodder resources could not only strengthen food security, but also yield nutritious fodder for livestock, thereby improving milk production and helping bridge the dry-season feed gap [57]. Thus, re-adjusting the cropping calendar, intercropping and growing new possible crops suitable to warmer and humid conditions would be beneficial for the community.
During the course of time, indigenous people might have faced several changes that include a change in climate and adjusted and updated their knowledge system. Ecological indicators are always useful in synchronizing seasonal activities, hence still in practice by the indigenous community. This led to mentioning that the role of TEK on ecological indicators would be important in the context of climate change. However, precaution is advisable because climate change is uncertain, and such uncertainty could lead to maladaptation [63]. Even ecological indicators could be altered, due to a sudden change in climatic or climatic extremes.

4.4. Future Perspective

In the mountains, limited land availability is a universal truth, and indigenous people are utilizing that limited resource based on the experience and traditional knowledge inherited from ancestors. Our findings show how important these practices are and people’s perception nearly matches with climatic recordings when it comes to conducting livelihood activities. The present study in Taxkorgan clearly suggests that indigenous people’s knowledge and carrying out traditional practices allow them to adapt to the changing environmental conditions, including climate variations. Accordingly, it is important to value the local practices and include it in the livelihood-related policies. Based on the information obtained from the study area, we listed several indicators that indigenous people are using to recognize the season, though Gregorian calendars are easily available at the present. This study revealed that aboriginal people in the mountains still use their ethno-ecological knowledge to keep track of the season. In that context, the conservation of such valuable knowledge is very important. At the same time, it is necessary to scientifically validate traditional practices of using indicators for beginning livelihood activities. Such validation could provide essential information about how climate and other environmental changes affect important ecological indicators and how indigenous community could readjust their practices. It is advisable that there needs to develop a system that assists to incorporate climatic information and ecological information in seasonal calendars, from which the community can minimize the risk of climate change while maximizing the benefits from the opportunity brought by climate changes by introducing more crops or cash-crop plantations and developing crop-livestock integration system [56,57]. Integration of TEK and climate science for accommodating seasonal calendar decisions based on adjustment of TEK and climate science could ensure maximum benefits from livelihood activities in these mountainscapes [47]. Modifications in knowledge systems and seasonal calendars that combine indigenous methods, and scientific evidence could support adaptation planning and better respond to community needs [5].

5. Conclusions

This research has recorded the ethnoecological knowledge and practices of indigenous peoples, involving ecological indicators, and seasonal activities. Findings of the research specify TEK significantly help the community continue their livelihood activities in many spheres of life. Indigenous elders still practice traditional modes of knowledge and ecological indicators as a cue to make decisions on seasonal activities. The timing of such activities is largely based on an understanding of their surroundings. Arrival of white wagtail (Motacilla alba) and citrine wagtail (Motacilla citreola), first flowering of Dandelion (Taraxacum) in summer, height of forage grass, etc., are critical indicators of seasonal changes and cues for local people to launch specific activities such as farming (e.g., preparing butter-making, cropping and taking livestock to rangeland). Local decisions for beginning farming activities and livestock migration vary with elevation, based on the perceptions of weather, resource availability and ecological cues. This research portrays local people’s knowledge of ecological indicators and their association with seasonal activities. However, the study site represents few settlements in the Pamir landscape where significant variance in the ethnoecological knowledge might remain and need to be explored. Furthermore, another limitation of our study was that most parts of our research were based on recall method and for a limited period. This confines us to fully explore all ecological indicators that include fewer common ones. Research conducted elsewhere using similar approaches also mentioned identical limitations of such research [64].
In this study, a long-term weather recording at the meteorological station was used, which shows significant warming and fewer drought events compared with the past decades in Taxkorgan. The perceptions of the indigenous people corroborate with climatic data analysis. In addition, the climatic indices such as GDD and SPI estimated in the study support the local practice of shifting plantation time of crops, introducing crops growing at lower elevation to higher elevation and trial with new crops. Yet, it is important to update TEK and practices along with climate change.

Author Contributions

Conceptualization, H.Y., S.R. and J.X.; Data curation, H.Y.; Formal analysis, S.R. and M.Z.; Funding acquisition, J.X.; Investigation, H.Y., Z.W. and Y.J.; Methodology, S.R.; Project administration, S.D.G.; Software, S.R. and M.Z.; Supervision, J.X.; Validation, H.Y.; Visualization, D.Z.; Writing—original draft, H.Y.; Writing—review and editing, S.R., D.Z., S.D.G., M.A.S. and J.X.

Funding

This research was funded by the National Natural Science Foundation of China (NSFC), grant number 41661144001, the Bureau of International Cooperation, Chinese Academy of Sciences, grant number 151853KYSB20160032 and partially supported by the CGIAR Research Program on climate change (FTA-FP5).

Acknowledgments

We acknowledge Xinjiang Institute of Ecology and Geography, Chinese Academy of Sciences for providing meteorological data, and Taxkorgan Nature Reserve of wildlife for supporting filed investigations. Contributions from other co-researchers—William Alexander Julian, Xiaoou Ou, Wenxuan Xu, Yang Lu and the participants of field surveys—Jianwei Yang, Milu Mamat and Gawarxia—are also acknowledged with much gratitude.

Conflicts of Interest

The authors declare no conflict of interest. The funders had no role in the design of the study; in the collection, analyses, or interpretation of data; in the writing of the manuscript, or in the decision to publish the results.

Appendix A

Figure A1. Weather patterns of Taxkorgan County from 1957 to 2015: (a) Mean temperature variation and (b) annual total precipitation variation.
Sustainability 11 03243 g0a1
Figure A2. Monthly change in the GDD calculated for wheat (base temperature of 2.6 °C) for a span of 59 years from 1957 to 2015.
Sustainability 11 03243 g0a2
Figure A3. Change in SPI value in different timescale from 1957 to 2015.
Sustainability 11 03243 g0a3

References

  1. Salick, J.; Byg, A. (Eds.) Indigenous Peoples and Climate Change; A Tyndall Centre Publication. Tyndall Centre for Climate Change Research: Oxford, UK, 2007. [Google Scholar]
  2. Aryal, S.; Cockfield, G.; Maraseni, T.N. Vulnerability of Himalayan transhumant communities to climate change. Clim. Chang. 2014, 125, 193–208. [Google Scholar] [CrossRef]
  3. Ford, J.D. Indigenous health and climate change. Am. J. Public Health 2012, 102, 1260–1266. [Google Scholar] [CrossRef] [PubMed]
  4. Nelson, M.C.; Ingram, S.E.; Dugmore, A.J.; Streeter, R.; Peeples, M.A.; McGovern, T.H.; Hegmon, M.; Arneborg, J.; Kintigh, K.W.; Brewington, S.; et al. Climate challenges, vulnerabilities, and food security. Proc. Natl. Acad. Sci. USA 2016, 113, 298–303. [Google Scholar] [CrossRef] [PubMed]
  5. Jiri, O.; Mafongoya, P.L.; Mubaya, C.; Mafongoya, O. Seasonal climate prediction and adaptation using indigenous knowledge systems in agriculture systems in southern africa: A Review. J. Agric. Sci. 2016, 8. [Google Scholar] [CrossRef]
  6. Naah, J.-B.S.N.; Braun, B. Local agro-pastoralists’ perspectives on forage species diversity, habitat distributions, abundance trends and ecological drivers for sustainable livestock production in West Africa. Sci. Rep. 2019, 9. [Google Scholar] [CrossRef] [PubMed]
  7. Abid, M.; Scheffran, J.; Schneider, U.A.; Ashfaq, M. Farmers’ perceptions of and adaptation strategies to climate change and their determinants: The case of Punjab province, Pakistan. Earth Syst. Dyn. 2015, 6, 225–243. [Google Scholar] [CrossRef]
  8. Jaakkola, J.J.K.; Juntunen, S.; Näkkäläjärvi, K. The holistic effects of climate change on the culture, well-being, and health of the saami, the only indigenous people in the European Union. Curr. Environ. Health Rep. 2018, 5, 401–417. [Google Scholar] [CrossRef] [PubMed]
  9. Kronik, J.V.; Verner, D. (Eds.) Chaper 1: Introduction. In Indigenous Peoples and Climate Change in Latin America and the Caribbean; The World Bank: Washington, DC, USA, 2010. [Google Scholar]
  10. Schick, A.; Sandig, C.; Krause, A.; Hobson, P.R.; Porembski, S.; Ibisch, P.L. People-centered and ecosystem-based knowledge co-production to promote proactive biodiversity conservation and sustainable development in Namibia. Environ. Manag. 2018, 62, 858–876. [Google Scholar] [CrossRef]
  11. Mugambiwa, S.S. Adaptation measures to sustain indigenous practices and the use of indigenous knowledge systems to adapt to climate change in Mutoko rural district of Zimbabwe. Jàmbá J. Disaster Risk Stud. 2018, 10, 388. [Google Scholar] [CrossRef]
  12. Mapfumo, P.; Mtambanengwe, F.; Chikowo, R. Building on indigenous knowledge to strengthen the capacity of smallholder farming communities to adapt to climate change and variability in southern Africa. Clim. Dev. 2015, 8, 72–82. [Google Scholar] [CrossRef]
  13. Hyland, J.J.; Jones, D.L.; Parkhill, K.A.; Barnes, A.P.; Williams, A.P. Farmers’ perceptions of climate change: Identifying types. Agric. Hum. Values 2015, 33, 323–339. [Google Scholar] [CrossRef]
  14. IPCC. Climate Change: Impacts, Adaptation and Vulnerability; Contribution of working group II to the fourth assessment report of the intergovernmental panel on climate change; Cambridge University Press: Cambridge, UK, 2007. [Google Scholar]
  15. Ingty, T. High mountain communities and climate change: Adaptation, traditional ecological knowledge, and institutions. Clim. Chang. 2017, 145, 41–55. [Google Scholar] [CrossRef]
  16. Kupika, O.L.; Gandiwa, E.; Nhamo, G.; Kativu, S. Local ecological knowledge on climate change and ecosystem-based adaptation strategies promote resilience in the middle zambezi biosphere reserve, zimbabwe. Scientifica 2019, 2019, 3069254. [Google Scholar] [CrossRef] [PubMed]
  17. Reyes-Garcia, V.; Aceituno-Mata, L.; Calvet-Mir, L.; Garnatje, T.; Gomez-Baggethun, E.; Lastra, J.J.; Ontillera, R.; Parada, M.; Rigat, M.; Valles, J.; et al. Resilience of traditional knowledge systems: The case of agricultural knowledge in home gardens of the Iberian Peninsula. Glob. Environ. Chang.-Hum. Policy Dimens. 2014, 24, 223–231. [Google Scholar] [CrossRef] [Green Version]
  18. Saylor, C.R.; Alsharif, K.A.; Torres, H. The importance of traditional ecological knowledge in agroecological systems in Peru. Int. J. Biodivers. Sci. Ecosyst. Serv. Manag. 2017, 13, 150–161. [Google Scholar] [CrossRef]
  19. Oteros-Rozas, E.; Ontillera-Sanchez, R.; Sanosa, P.; Gomez-Baggethun, E.; Reyes-Garcia, V.; Gonzalez, J.A. Traditional ecological knowledge among transhumant pastoralists in Mediterranean Spain. Ecol. Soc. 2013, 18. [Google Scholar] [CrossRef]
  20. Green, D.; Billy, J.; Tapim, A. Indigenous Australians’ knowledge of weather and climate. Clim. Chang. 2010, 100, 337–354. [Google Scholar] [CrossRef]
  21. Gyasi, E.A.; Awere, K.G. Adaptation to climate change: Lessons from farmer responses to environmental changes in Ghana. In Strategies for Building Resilience against Climate and Ecosystem Changes in Sub-Saharan Africa; Saito, O., KranjacBerisavljevic, G., Takeuchi, K., Gyasi, E.A., Eds.; Springer: Singapore, 2018; pp. 291–312. [Google Scholar]
  22. Kassam, K.A.; Bulbulshoev, U.; Ruelle, M. Ecology of time: Calendar of the human body in the Pamir Mountains. J. Persianate Stud. 2011, 4, 146–170. [Google Scholar] [CrossRef]
  23. Khan, S.M.; Page, S.; Ahmad, H.; Harper, D. Ethno-ecological importance of plant biodiversity in mountain ecosystems with special emphasis on indicator species of a Himalayan Valley in the northern Pakistan. Ecol. Indic. 2014, 37, 175–185. [Google Scholar] [CrossRef]
  24. Castillo, L.; Ladio, A. Mammals and birds as ethno-indicators of change: Their importance to livestock farmers in Arid Patagonia (Argentina). Environ. Dev. Sustain. 2018, 20, 2161–2179. [Google Scholar] [CrossRef]
  25. Pearce, T.; Ford, J.; Willox, A.C.; Smit, B. Inuit Traditional Ecological Knowledge (TEK), Subsistence Hunting and Adaptation to Climate Change in the Canadian Arctic. Arctic 2015, 68, 233–245. [Google Scholar] [CrossRef]
  26. Salite, D. Traditional prediction of drought under weather and climate uncertainty: Analyzing the challenges and opportunities for small-scale farmers in Gaza province, southern region of Mozambique. Nat. Hazards 2019. [Google Scholar] [CrossRef]
  27. Sobral, A.; de los Angeles La Torre-Cuadros, M.; Nobrega Alves, R.R.; Albuquerque, U.P. Conservation efforts based on local ecological knowledge: The role of social variables in identifying environmental indicators. Ecol. Indic. 2017, 81, 171–181. [Google Scholar] [CrossRef]
  28. Sujakhu, N.M.; Ranjitkar, S.; Niraula, R.R.; Salim, M.A.; Nizami, A.; Schmidt-Vogt, D.; Xu, J. Determinants of livelihood vulnerability in farming communities in two sites in the Asian Highlands. Water Int. 2018, 43, 165–182. [Google Scholar] [CrossRef] [Green Version]
  29. Hameso, S. Farmers and policy-makers’ perceptions of climate change in Ethiopia. Clim. Dev. 2018, 10, 347–359. [Google Scholar] [CrossRef]
  30. Kangalawe, R.; Mwakalila, S.; Masolwa, P. Climate change impacts, local knowledge and coping strategies in the Great Ruaha River Catchment Area, Tanzania. Nat. Resour. 2011, 2, 212–223. [Google Scholar] [CrossRef]
  31. Salick, J.; Ross, N. Traditional peoples and climate change Introduction. Glob. Environ. Chang.-Hum. Policy Dimens. 2009, 19, 137–139. [Google Scholar] [CrossRef]
  32. Palomo, I. Climate change impacts on ecosystem services in high mountain areas: A literature review. Mt. Res. Dev. 2017, 37, 179–187. [Google Scholar] [CrossRef]
  33. Dong, S.; Sherman, R. Enhancing the resilience of coupled human and natural systems of alpine rangelands on the Qinghai-Tibetan Plateau. Rangel. J. 2015, 37, I–III. [Google Scholar] [CrossRef]
  34. Ba, Q.-X.; Lu, D.-J.; Kuo, W.H.-J.; Lai, P.-H. Traditional farming and sustainable development of an indigenous community in the mountain area - a case study of Wutai Village in Taiwan. Sustainability 2018, 10, 3370. [Google Scholar] [CrossRef]
  35. Wu, N.; Ismail, M.; Joshi, S.; Yi, S.-L.; Shrestha, R.M.; Jasra, A.W. Livelihood diversification as an adaptation approach to change in the pastoral Hindu-Kush Himalayan region. J. Mt. Sci. 2014, 11, 1342–1355. [Google Scholar] [CrossRef] [Green Version]
  36. Fu, Y.; Grumbine, R.E.; Wilkes, A.; Wang, Y.; Xu, J.-C.; Yang, Y.-P. Climate change adaptation among tibetan pastoralists: Challenges in enhancing local adaptation through policy support. Environ. Manag. 2012, 50, 607–621. [Google Scholar] [CrossRef] [PubMed]
  37. Schaller, G.B.; Li, H.; Talipu, L.H.; Ren, J.R.; Qiu, M.J.; Wang, H.B. Status of large mammals in the Taxkorgan Reserve, Xinjiang, China. Biol. Conserv. 1987, 42, 53–71. [Google Scholar] [CrossRef]
  38. Wang, J.; Damerell, P.; Shi, K.; Riordan, P.; Zhu, K.; Wang, X.; Wang, P.; Reheman, A.; Yang, J. Human-wildlife conflict pattern and suggested mitigation strategy in the Pamirs of northwestern China. Rangel. Ecol. Manag. 2019, 72, 210–216. [Google Scholar] [CrossRef]
  39. SBX. Xinjiang Statistical Yearbook, 1st ed.; Statistical Bureau of Xinjiang Uygur Autonomous Region: Urumqi, China, 2018; pp. 94–95. [Google Scholar]
  40. Liao, C.; Morreale, S.J.; Kassam, K.-A.S.; Sullivan, P.J.; Fei, D. Following the Green: Coupled pastoral migration and vegetation dynamics in the Altay and Tianshan Mountains of Xinjiang, China. Appl. Geogr. 2014, 46, 61–70. [Google Scholar] [CrossRef]
  41. Bhagawati, K.; Sen, A.; Kumar Shukla, K. Seasonal calendar and gender disaggregated daily activities of indigenous Galo farmers of eastern Himalayan region of India. Curr. Agric. Res. J. 2017, 5, 325–330. [Google Scholar] [CrossRef]
  42. Ram, H.; Gupta, N.; Saini, J.S. Accumulated growing degree-day requirements and yield ability of irrigated durum wheat as influenced by sowing time. Agric. Res. J. 2016, 53, 303–306. [Google Scholar] [CrossRef]
  43. Seefeldt, S.S.; Kidwell, K.K.; Waller, J.E. Base growth temperatures, germination rates and growth response of contemporary spring wheat (Triticum aestivum L.) cultivars from the US Pacific Northwest. Field Crops Res. 2002, 75, 47–52. [Google Scholar] [CrossRef]
  44. Juskiw, P.E.; Jame, Y.W.; Kryzanowski, L. Phenological development of spring barley in a short-season growing area. Agron. J. 2003, 95, 1633. [Google Scholar] [CrossRef]
  45. Lloyd-Hughes, B.; Saunders, M.A. A drought climatology for Europe. Int. J. Climatol. 2002, 22, 1571–1592. [Google Scholar] [CrossRef]
  46. Kim, K.; Wang, M.-C.; Ranjitkar, S.; Liu, S.-H.; Xu, J.-C.; Zomer, R.J. Using leaf area index (LAI) to assess vegetation response to drought in Yunnan province of China. J. Mt. Sci. 2017, 14, 1863–1872. [Google Scholar] [CrossRef]
  47. Zuma-Netshiukhwi, G.; Stigter, K.; Walker, S. Use of traditional weather/climate knowledge by farmers in the south-western free state of South Africa: Agrometeorological learning by scientists. Atmosphere 2013, 4, 383–410. [Google Scholar] [CrossRef]
  48. Clarke, P.A. Australian aboriginal ethnometeorology and seasonal calendars. Hist. Anthr. 2009, 20, 79–106. [Google Scholar] [CrossRef]
  49. David-Chavez, D.M.; Gavin, M.C. A global assessment of Indigenous community engagement in climate research. Environ. Res. Lett. 2018, 13, 123005. [Google Scholar] [CrossRef]
  50. Turner, N.J.; Clifton, H. “It’s so different today”: Climate change and indigenous lifeways in British Columbia, Canada. Glob. Environ. Chang. 2009, 19, 180–190. [Google Scholar] [CrossRef]
  51. Reyes-Garcia, V.; Fernandez-Llamazares, A.; Gueze, M.; Garces, A.; Mallo, M.; Vila-Gomez, M.; Vilaseca, M. Local indicators of climate change: The potential contribution of local knowledge to climate research. Wiley Interdiscip. Rev. Clim. Chang. 2016, 7, 109–124. [Google Scholar] [CrossRef]
  52. Kreutzmann, H. Pamir or pamirs: Perceptions and interpretations. In Mapping transition in the Pamirs; Herrmann, K., Teiji, W., Eds.; Springer: Cham, Switzerland, 2016; pp. 17–40. [Google Scholar]
  53. Kikvidze, Z.; Tevzadze, G. Loss of traditional knowledge aggravates wolf-human conflict in Georgia (Caucasus) in the wake of socio-economic change. Ambio 2015, 44, 452–457. [Google Scholar] [CrossRef]
  54. Moyo, B.; Dube, S.; Lesoli, M.; Masika, P.J. Communal area grazing strategies: Institutions and traditional practices. Afr. J. Range Forage Sci. 2008, 25, 47–54. [Google Scholar] [CrossRef]
  55. Negi, V.S.; Maikhuri, R.K.; Pharswan, D.; Thakur, S.; Dhyani, P.P. Climate change impact in the Western Himalaya: People’s perception and adaptive strategies. J. Mt. Sci. 2017, 14, 403–416. [Google Scholar] [CrossRef]
  56. Madhav Karki, P.P.; Jay, R.A. Climate change: Integrating indigenous and local knowledge into adaptation policies and practices: A case study from Nepal. In Shifting Cultivation Policies: Balancing Environmental and Social Sustainability; Cairns, M., Ed.; CABI: Oxfordshire, UK, 2017. [Google Scholar]
  57. Sujakhu, N.M.; Ranjitkar, S.; Niraula, R.R.; Pokharel, B.K.; Schmidt-Vogt, D.; Xu, J. Farmers’ perceptions of and adaptations to changing climate in the melamchi valley of nepal. Mt. Res. Dev. 2016, 36, 15–30. [Google Scholar] [CrossRef]
  58. Meyer, R.S.; Purugganan, M.D. Evolution of crop species: Genetics of domestication and diversification. Nat. Rev. Genet. 2013, 14, 840–852. [Google Scholar] [CrossRef] [PubMed]
  59. Chen, Y.H.; Shapiro, L.R.; Benrey, B.; Cibrián-Jaramillo, A. Back to the origin: In situ studies are needed to understand selection during crop diversification. Front. Ecol. Evolut. 2017, 5. [Google Scholar] [CrossRef]
  60. Skarbo, K.; VanderMolen, K. Maize migration: Key crop expands to higher altitudes under climate change in the Andes. Clim. Dev. 2016, 8, 245–255. [Google Scholar] [CrossRef]
  61. D’Alpoim Guedes, J.A.; Lu, H.; Hein, A.M.; Schmidt, A.H. Early evidence for the use of wheat and barley as staple crops on the margins of the Tibetan Plateau. Proc. Natl. Acad. Sci. USA 2015, 112, 5625–5630. [Google Scholar] [CrossRef] [PubMed] [Green Version]
  62. SBX. Xinjiang Statistical Yearbook, 1st ed.; Statistical Bureau of Xinjiang Uygur Autonomous Region: Urumqi, China, 2004; p. 321. [Google Scholar]
  63. Akkari, C.; Bryant, C.R. The co-construction approach as approach to developing adaptation strategies in the face of climate change and variability: A conceptual framework. Agric. Res. 2016, 5, 162–173. [Google Scholar] [CrossRef]
  64. O’Connor, M.; Prober, S. A Calendar of Ngadju Seasonal Knowledge. A Report to Ngadju Community and Working Group; CSIRO Sustainable Ecosystems: Floreat, WA, USA, 2010; p. 3. [Google Scholar]
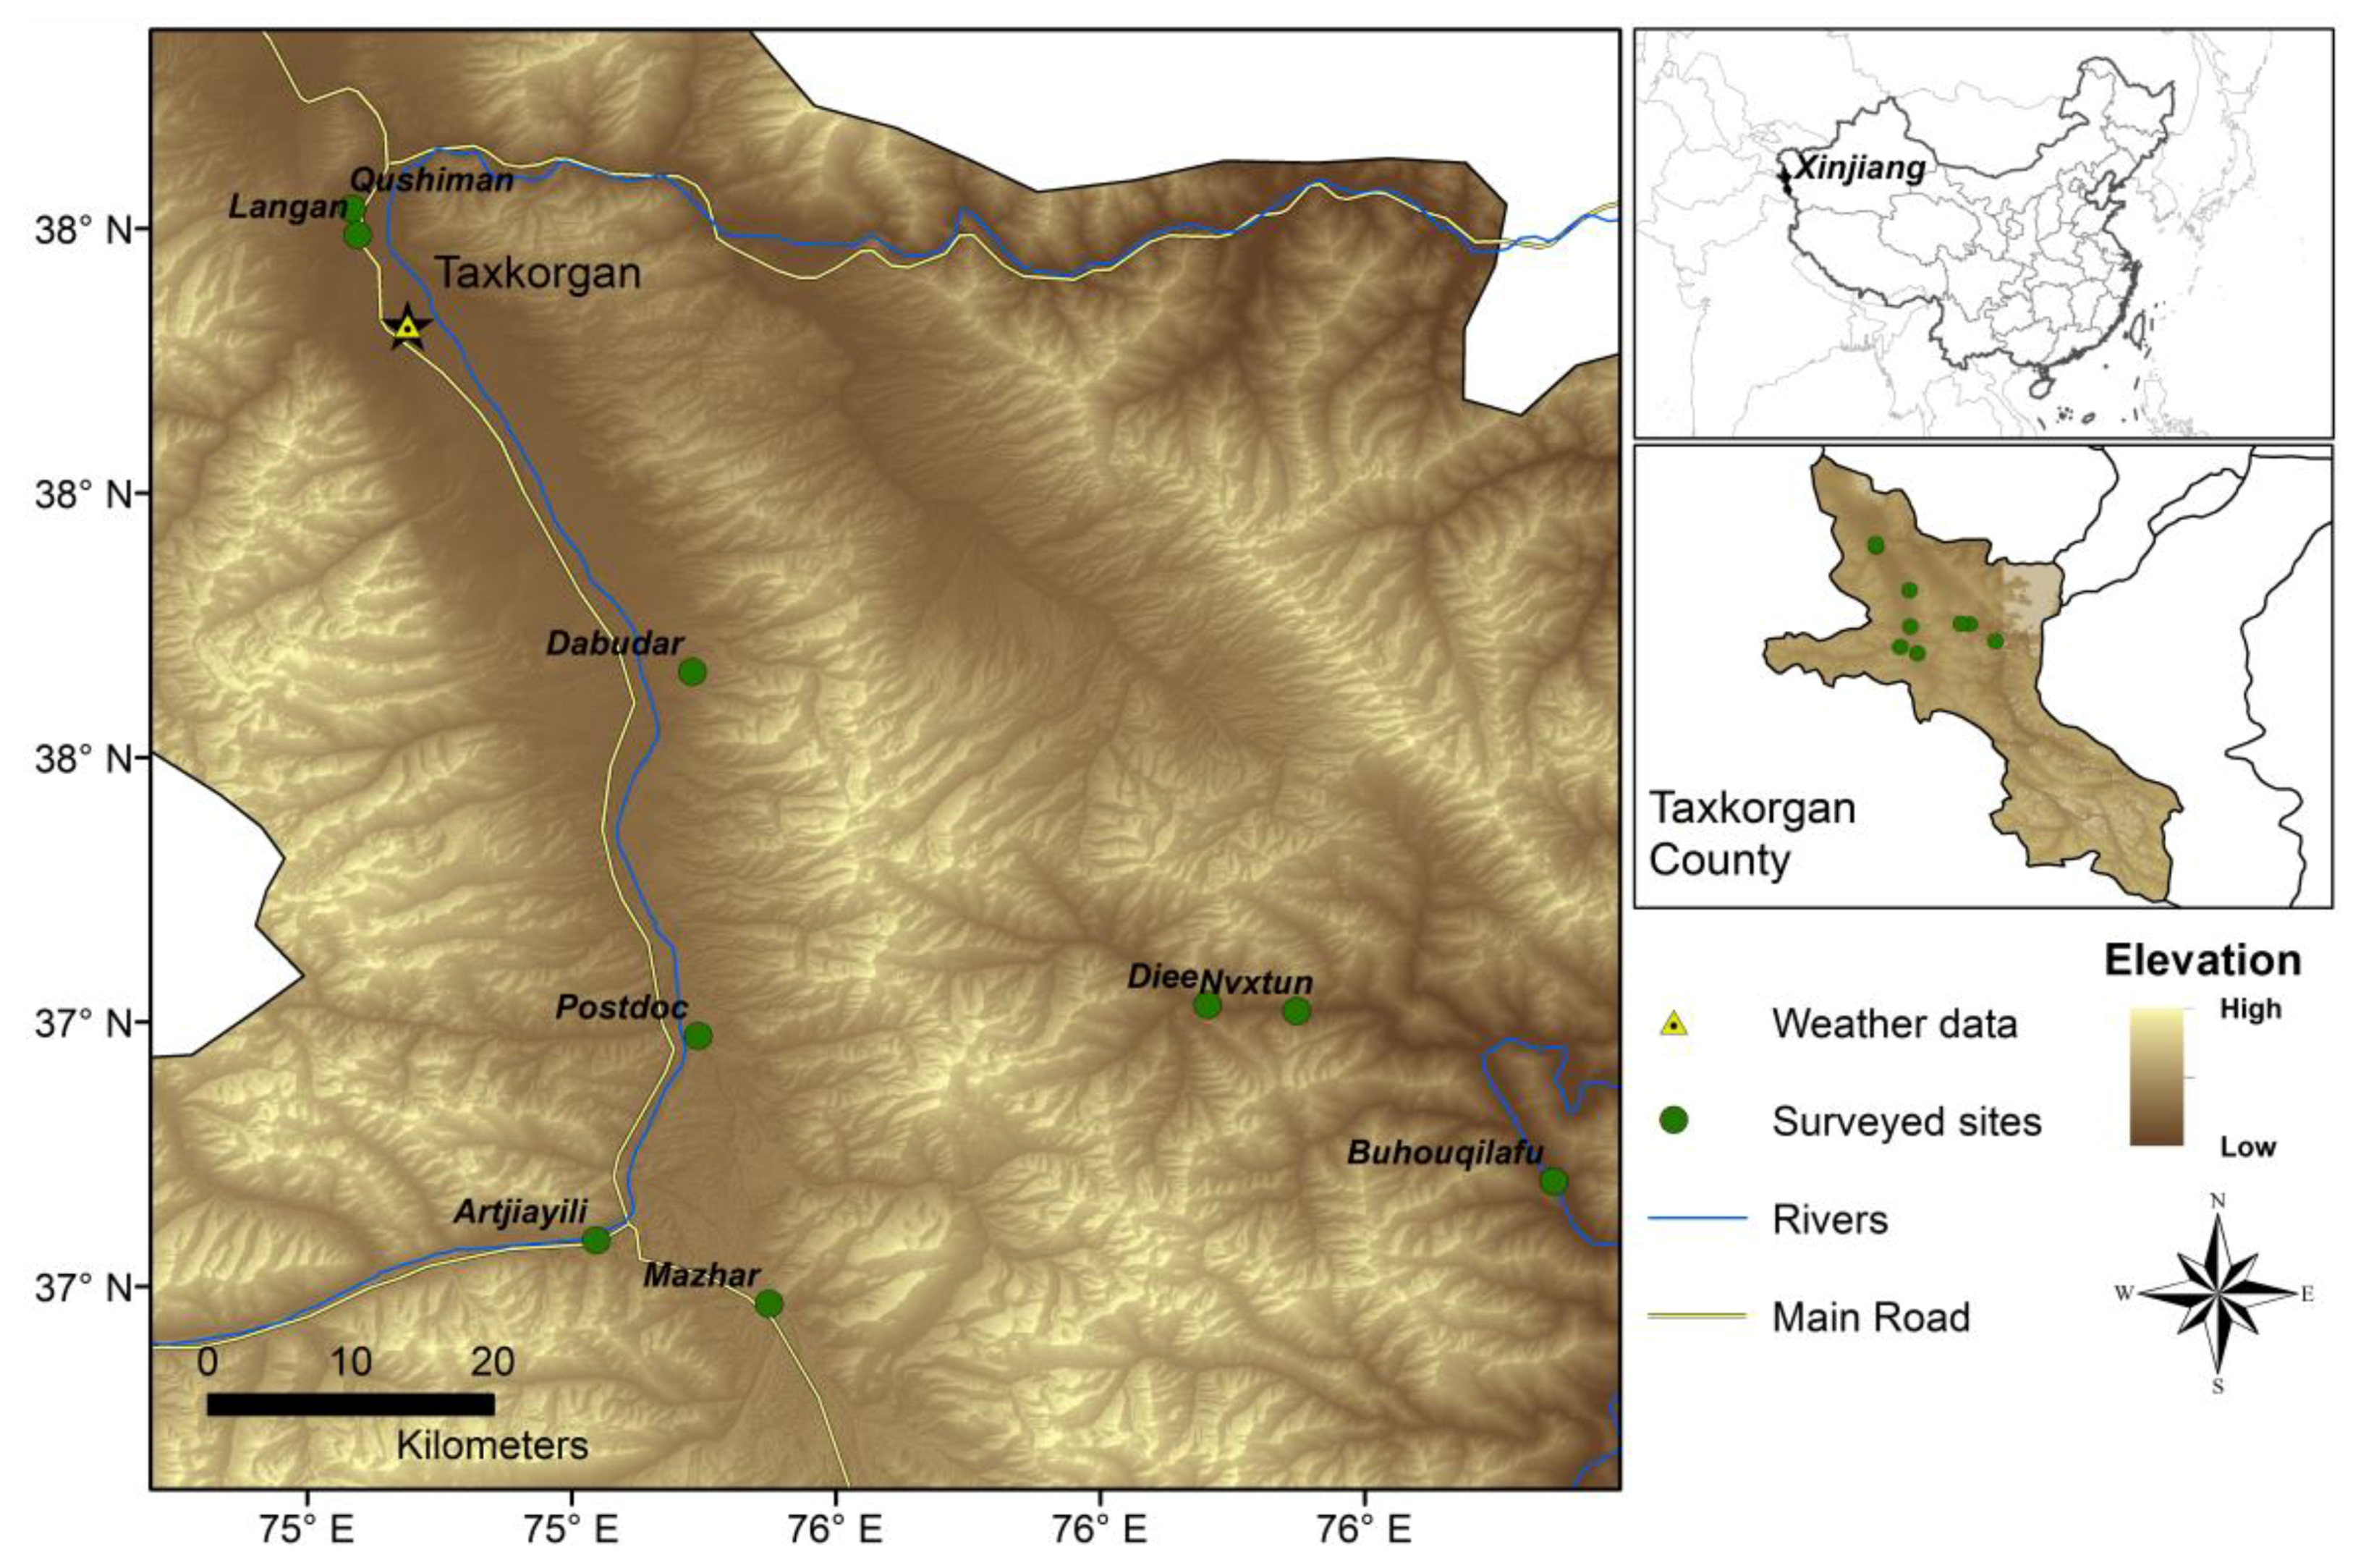
Figure 1. Surveyed areas in Taxkorgan.
Sustainability 11 03243 g001
Figure 2. Seasonal weather patterns of Taxkorgan County from 1957 to 2015, (a) mean seasonal temperature variation, and (b) seasonal total precipitation variation.
Sustainability 11 03243 g002
Figure 3. Elders from the indigenous community describing the height of grass that had been used in the area to estimate the time of movement from to spring pasture (a) and summer pasture (b).
Sustainability 11 03243 g003
Figure 4. (a) Diagram of pastures and farmlands; (b) seasonal calendar developed based on information provided by informants regarding average timing of movement to pastures and crop plantation/harvest in the last five years.
Sustainability 11 03243 g004
Figure 5. (a) Growing degree days (GDD) based calculation estimated number of days spent to accumulate minimum heat requirement for barley and wheat during years 2011 to 2015; (b) estimated change in number of days requirement to attain 1810 °C (heat accumulation) for maturity of wheat at different time intervals within a span of 54 years, from 1960 to 2014.
Sustainability 11 03243 g005
Figure 6. Change in standard precipitation index (SPI) value in the three month timescale from 1957 to 2015.
Sustainability 11 03243 g006
Table 1. The total number of administrative locations and main ethnic minorities of the nine communities in Taxkorgan, Xinjiang, China.
Community (Village)Municipality (Township)Elevation (m)Longitude (E)Latitude (N)Main Ethnic Minority
BuhouqilafuMaryoung246775.952537.2328Tajik
NvxtunMaryoung288275.790437.34Tajik
DieeMaryoung306675.734337.3439Tajik
LanganTizinafu303475.198537.8293Tajik
QushimanTizinafu309275.194937.846Tajik
PostdocDabudar339575.413137.3244Tajik
DabudarDabudar343675.409637.5539Tajik
ArtjiayiliDabudar358275.348937.1956Kirgiz
Mazhar-367075.457937.1557Tajik
Footnote: The above-mentioned names of all villages are romanized from Chinese pronunciations based on the local language. Original pronunciations with the tone of Chinese character are as follows: Buhouqilafu—bù hòu qí lā fǔ; Nvxtun—nǔ shí dūn; Diee—dié; Langan—lán gān; Qushiman—qǔ shí màn; Postdoc—bō sī tè duō kè tè; Dabudar—dá bù dá ěr; Artjiayili—ā tè jiā yī lǐ; Mazhar—mǎ zhá ěr. The names of townships are as follows: Maryoung—mǎ ěr yáng; Tizinafu—tí zī nà fǔ; Dabudar—dá bù dá ěr.
Table 2. Drought categories defined by standard precipitation index (SPI) values.
SPI ValuesWetSPI ValuesDrought
2.0 or moreExtremely wet−2.0 or lessExtreme drought
1.5 to1.99Severely wet−1.5 to −1.99Severe drought
1.0 to 1.49Moderately wet−1.0 to −1.49Moderate drought
0 to 0.99Mildly wet0 to −0.99Mild drought
Table 3. Seasonal changes and general activities within the local community.
SeasonObservationsIndicatorSpecific ActivitiesLinked-CategoryPurposeRemarks
Early-SpringSnow begin melting from low elevation sitesGeo: Snow Season-identificationPreparations
Early-SpringFrozen rivers begin to meltHydro: water
Early-SpringGrass near hot springs first begin to growBio: Grass
Early-SpringLeaf buds turn to green and unfold Bio:
Populus alba,
Elaeagnus,
Angustifolia,
Prunus armeniaca L.,
Tamarix ramosissima,
Juglans regia
Early-SpringLands turns softGeo: # LandsForce a spade into the land to check the suitability for tilling the land.Farming Food
Early-SpringFestival (~21 March)Socio: # YinshuiJieRepair and dig canals FarmingFood Different timing at lower and higher sites
Mid-SpringPrunus armeniaca L. bloomsBio:Prunus armeniaca L. at lower elevation sites
Mid-SpringArriving: Motacilla albaBio: # Motacilla albaTilling and prepare for cultivation and sowingFarmingFood
Mid-SpringMarmota wake up from hibernationBio: # Marmota
Mid-SpringArriving: Motacilla albaBio: # Motacilla albaBegin with yoghourt-making Food
Mid-SpringSnowmelt to thin layerGeo: # SnowMove and station in spring pasturesLivestockFodder If there is heavy snowfall in winter, the rangeland will be in good condition
Mid-SpringQuantity and height of grass (1–2 knuckle width)Bio: # Grass
Late-SpringPerception of weather: Warming condition# Atmospheric
Late-SpringTaraxacum flowering, the earliest flowering plantBio: # TaraxacumPreparation for moving to summer pasturesLivestock Fodder
Early-SummerPerception of weather: Becomes hot graduallyAtmospheric Season-identificationPreparationsMore flood and rainfall in recent years
Early-SummerSnow area on top of the mountain decreasesGeo: Snow
Early-SummerPerception of weather: Hot # AtmosphericMove and station in summer pasturesLivestock Fodder Move ahead of time if no snowfall in winter in their villages
Early-SummerSnow melts completely in summer pasturesGeo: # Snow
Early-SummerWater volume increase in rivers and seasonal rivulets reappearedHydro: # Water
Early-SummerGood conditions and height of grass (3–5 fingers)Bio: # Grass
Early-SummerWater level rise and turbid in major riversGeo: # Water
Mid-SummerPrunus armeniaca L ripen Bio: Prunus armeniaca Season-identification at lower elevation sites
Mid-SummerArriving: Motacilla citreolaBio: # Motacilla citreolaBegin with butter-making Food
Mid-SummerGreening and flowering: SeriphidiumBio: # Seriphidium (* Kalabaduo)Collect plants and make oil for protecting from UV when grazing. Livestock CosmeticUse of it is declining.
Mid-SummerTiming of flowering and dropping: CeratoidescompactaBio: # CeratoidescompactaCollect Ceratoidescompacta and dry in the sun as in to fuelLivestock Firewood
Late-SummerTiming of flowering and dropping: Oxytropis DC and Astragalus L.Bio:
# Oxytropis DC;
# Astragalus L.
Guide livestock when flowering to gain weight; protect livestock from where these two species grow when dropping to avoid abdominal distension.LivestockFodder
Late-SummerTiming of flowering and fruit: Medicinal plantsBio:
# Saussurea glacialis Herd. (* Xuelian),
# Pleurospermum Hoffm. (* Kulumuti)
Collect materials of medicinal plants from high elevation sitesLivestock MedicineAfter collecting, they move down
Early-AutumnLeaves on the tree turn to yellow and orange (e.g., Populus alba L), dropping leaves Bio: Populus alba L Season-identificationPreparation
Early-AutumnConditions of grass: Maximum height attained, and begin weathering Bio: # GrassFodder collectionLivestock Fodder
Early-AutumnGrass at the summer pasture is completely consumed;Bio: # GrassPrepare and move to autumn pastureLivestock Fodder
Early-AutumnPerception of weather: Getting cool# Atmospheric
Early-AutumnSnowfall begins on summer pasture Geo: # Snow
Early-AutumnWater in valleys gradually disappear and water volume in the river decreases graduallyHydro: # Water
Early-AutumnVarious birds appear in croplandsBio: Motacilla alba
Motacilla citreola
Upupa epops
Tetraogallus
Prepare and begin with harvestFarming Food
Early-AutumnCrops get ripeBio: Crops
Late-AutumnMigratory birds have emigrated Bio: # Migratory birdsMove back to villages or winter pastures
Keep livestock in livestock-shed
Livestock Fodder Wild-animal (Panthera uncial, Ursidae, Canislupus) attack occur frequently in settlements and routes at higher elevations
Late-AutumnUrsidae and Marmota start hibernationBio: # Ursidae, # Marmota
Early-WinterPerception of weather: Getting cold# Atmospheric
Early-WinterSeasonal rivulets disappear; Water canals freeze Hydro: Water Season-identificationPreparation Winter season has gotten warmer in recent years.
Late-WinterOvis aries and Capra aegagrus hircus give birth in FebruaryBio: Ovis aries, Capra aegagrus hircusTake care of newborn livestockLivestock
#—indicators that were used by locals; *—local name; Italic type—Latin name; Geo—geological, Bio—biological, Hydro—hydrological, Socio—socio-cultural.