1. Introduction
Rapid global economic growth has led to an increasing concern for energy security and sustainable development. The transport sector accounts for about a quarter (23%) of global energy-related greenhouse gas (GHG) emissions [
1]. China’s energy demand is growing rapidly. China’s imports of oil have increased nearly 2% each year, and the country has overtaken the United States as the largest importer of crude oil since 2015 [
2]. In addition to the energy crisis, the problem of carbon dioxide emission caused by vehicles has become more severe. According to a survey by the Intergovernmental Panel on Climate Change (IPCC), 14% of GHG emissions come from transportation. Almost 95% of petroleum fuels, mainly gasoline and diesel, are used for transportation globally [
3], and the atmosphere is suffering from the increasing number of vehicles. At the end of 2016, global car ownership had reached 194 million, an increase of 113% since 2010 [
4]. China ranks first in the world for carbon dioxide emissions, which are roughly 30% [
5].
In order to deal with the severe challenges from the environment and energy issues, China, as the world’s largest vehicle producer and consumer, began in 2009 to develop a new energy vehicle industry. By improving energy efficiency and reducing environmental pollution, the Chinese government aims to contribute to an economically sustainable development. The Chinese government has included the new energy vehicle industry as one of the seven emerging industries in the 12th five-year plan, to achieve a green, scientific and sustainable low-carbon economy.
Since 2001, China’s central government has promulgated a number of policies to promote the development of the new energy vehicle industry. These policies cover various aspects of strategy and investment, subsidies, tax and incentives, regulations and standards, etc., and they have jointly accelerated industrial development. With the encouragement of policies and the effort of enterprises, China has become the world’s largest electric vehicle market since 2015, reaching more than 100,000 units of exports in the global market [
6], maintaining a continuous high-speed growth. According to the market data, total sales in 2017 reached 777,000, up 53.3% over the same period of the previous year [
7].
Despite many notable achievements, China’s new energy vehicle industry still faces some challenges: high prices, short mileage, inadequate driving experience, and a weak charging infrastructure compared with traditional vehicles. In the future, with the planned cancellation of the subsidy policy for new energy vehicles in 2020, the policy-driven market is gradually disappearing. At the same time, the long-term and high-input characteristics of technology will slow down the progress of commercialization, which will bring fresh challenges for the new energy vehicle industry. As an effective means to promote commercialization, the business model plays an increasingly important role in the operation of new energy vehicles. Under the same technical conditions, exploring different business models could help to promote the market.
The business models in China’s new energy vehicle industry have contributed to many practical results. According to research, China’s new energy vehicle industry is divided into four stages: market germination (2001–2008), market launch (2009–2012), market acceleration (2013–2015), and market deepening (2016–present). In the first stage, new energy vehicle enterprises explored the market but did not form a competitive market. The business model is a demonstration of large-scale event projects. For example, Chery, Changan, FAW Group, BAIC Foton, Shanghai Volkswagen, Jinghua Bus and Dongfeng Motor provided 500 energy-saving and new energy vehicles for the Beijing Olympic Games. In the startup phase, new energy vehicle enterprises adopted cost leadership strategies to complete the “Ten Cities and Thousand Vehicles” demonstration project, producing at lower cost and promoting a large number of public transportation vehicles. At the end of 2012, 27,432 vehicles were produced, of which 23,032 were promoted in the public sector in 25 demonstration cities. During the acceleration stage, models such as Hangzhou Micro-Bus, Potevio Mode, and Hefei Targeted Purchase emerged. Whereas most enterprises focused on the low-end market, some enterprises that have foundations in the public sector adopted a differentiated strategy. For example, SAIC Group’s EVCARD uses high-end models to improve consumer travel services. In the deepening stage, new energy vehicle technology has developed rapidly, charging infrastructure construction has gradually improved, and innovative business models have gained more support in the private purchase field. The strategy of new energy vehicle enterprises is diversified. State-owned enterprises such as Dongfeng and Changan mainly market low-cost and low-end models. Private enterprises represented by BYD use the advantages of battery technology to select mid- to high-end market routes [
8].
The emergence of new business models has received much attention from the academic community. Scholars have studied the elements of business models and the bases for business model innovation. The business model links combinations of assets to value creation [
9]. The ultimate success of each enterprise depends not on its ability to make the most of just one or two assets, but on its skill in optimizing all assets that make up its business model.
In fact, firms must acquire resources concomitantly to the implementation of a new business model [
10]. According to the classical resource-based view (RBV) theory, firms are fundamentally heterogeneous regarding their resources and internal competencies [
11]. The heterogeneous resources of a firm contribute to its strengths and weaknesses [
12]. To secure sustainable competitiveness, a firm’s resources must have four attributes: value, rareness, imperfect imitability, and substitutability. Firm resources can be imperfectly imitable for one, or a combination of three reasons: history-dependent, causally ambiguous, and socially complex [
11]. The resource-based view theory explains that the firms that are acquiring and exploiting certain resources depend upon their position in time and space. Because each firm’s history is unique, their resources are imperfectly imitable. In China, state-owned enterprises (SOEs) are more dependent on historical resources than other ownership enterprises. Most resources are in the hands of SOEs because externalities will affect the allocation and efficiency of resources [
13].
Recently, the increasing influence of China’s SOEs at home and abroad has caused heated discussions about the ownership of these enterprises. China is the second largest economy in the world, and SOEs have contributed substantially. According to Szamosszegi and Kyle’s report, SOEs and state-owned holding enterprises account for more than 40% of GDP in secondary and tertiary industries. In other important pillar industries, SOEs are still major players [
14]. With the reform of China’s state-owned system and the transformation of its economic structure, the business models of state-owned enterprises and other ownership categories will have a big impact on industry dynamics and competition.
Business model choices and how they evolve are usually researched from different perspectives. However, the research seldom relates to the factors that affect the heterogeneity of business models, especially in relation to China’s new energy vehicle enterprises. Barquet et al. analyzed five factors influencing business model heterogeneity from the perspective of sustainability: apply design for environment, identify economic value, promote behavioral change, act towards social well-being, and innovate at different levels [
15]. The present article highlights how business models differ depending on ownership of resources. We address this topic by exploring the following question: Does ownership determine the business model? Based on a qualitative analysis of 30 enterprises in China’s new energy vehicle (NEV) industry, we aim to establish the main determinants of business model choices and to present an overview that integrates the main types of business model into the new energy vehicle industry.
Section 2 reviews the business model literature and analyses how resources and strategy influence it. Data and methods are presented in
Section 3.
Section 4 first uses quantitative analysis to show that ownership has a differential impact on business models. Then, according to visible resources and strategic positioning, we construct a classification framework of China’s new energy enterprises. Heterogeneous resources and market positioning strategy appear to be key variables to split the sample of enterprises into four clusters. The differential impact of resources and strategies on business models is analyzed. Finally, the reasons for this differentiation, that is, the influence of ownership on resources and strategies, are discussed in depth. Thus the dynamic transitioning of business models are shown in the end. New challenges from ownership will also be discussed in
Section 5.
Section 6 presents the conclusions.
4. Results
4.1. Ownership Affects Business Model
Based on the hypotheses, using analysis of variance (ANOVA), the characteristics of the three ownership categories in this article are tested. The sample is divided into three ownership groups—SOEs, PEs, and JVs. Then, we compare the differences between the components of the business models, such as product value, supply channel, operating channel, research and development capability, finance, and shareholder structure, of these three types of enterprise (see
Table 2).
There is a partly significant effect of ownership on business models in terms of core resources and value capture structure. Other dimensions are not obviously significant due to incomplete data. Sample size of product, suppliers, and dealers are all less than 20. The significance shows that the business models of SOEs, PEs, and JVs are linked to different types of assets. Hypothesis 5 is thus established.
First, the impact of ownership on the product dimension is not obvious. This is due to the fact that only mass-produced EV data are available in the samples. At present, traditional vehicle enterprises sell cars that are mainly economical and low-cost models. Those enterprises still in the research and development stage, test stage or operational stage do not count. They do not exert any particularly large market effect yet. Therefore, the results show that the differences are not obvious. It is necessary to analyze the differences in the value of electric vehicles using qualitative analysis.
Second, the differences between ownership categories are not significant among suppliers, dealers, or partners either, but the gap in supplier strength will have an impact on the business model of EV enterprises. Through further comparisons, we established that there are some differences between SOEs (P = 0.042) and PEs (P = 0.030) in terms of the dealers. At present, JVs such as DENZA, SOUEAST, and NEVS, which manufacture electric vehicles, have not made breakthroughs in their commercial applications. The sales channels are monotonous. SOEs and PEs are more active in the commercial market.
Third, in terms of core resources and core technical capabilities, there are significant differences between EV enterprises with different ownerships. The enterprises’ total assets accumulated through history are significant because of the influence of ownership [F (2, 25) = 5.809, P = 0.008]. In addition, the differences of assets between SOEs and PEs are significant (P = 0.011), and the differences of assets between SOEs and JVs are also significant (P = 0.006), but when comparing PEs and JVs, there is no significant difference (P = 0.369) according to the quantitative analysis. Without support from the government, the resources of PEs and JVs are both limited.
Technological capability is one of the core resources. As an important indicator of technological capabilities, the number of research and development personnel accounts for a large proportion of the total number. There are significant differences among three ownership classes [F (2, 26) = 6.258, P = 0.006]. By comparison, the numbers of patents owned by SOEs and PEs tend to be close to each other (P = 0.112). Among resource-rich enterprises, BYD, GEELY, and other powerful PEs are leading the development of China’s electric vehicle industry, similar to SOEs. Except for the above two indicators, the proportion of research and development investment is not significant. In fact, research and development is of great importance to every enterprise nowadays. Because the new energy vehicle industry urgently requires technological innovation and breakthroughs at this stage, all enterprises are trying their best to invest in research and development.
Finally, the revenues of SOEs, PEs, and JVs show a significant difference [F (2, 20) = 8.731, P = 0.002]. Besides, there is a significant difference in equity among different ownerships [F (2, 18) = 18.007, P < 0.05], although they have different shareholder structures, and the number of shareholders has little effect on the business model (P = 0.204).
4.2. The Impact of Strategy and Resources on the Business Model
Just like the above results for ANOVA, the core resources and value revenue structure of the business model demonstrate significant differences affected by ownership. Combining the literature review and research hypotheses, business model differences are determined by different resource capabilities and different competitive strategies which aim to establish a competitive revenue structure. The business model consists of visible strategies: we use visible resources—asset [
48] and visible strategies—strategic positioning as classification standards. All thirty firms are shown in
Table 3. Total assets of more than 2000 million (EUR) are seen as resource-rich; below that are defined as resource-poor. Strategic positioning is classified as with global strategy or local strategy.
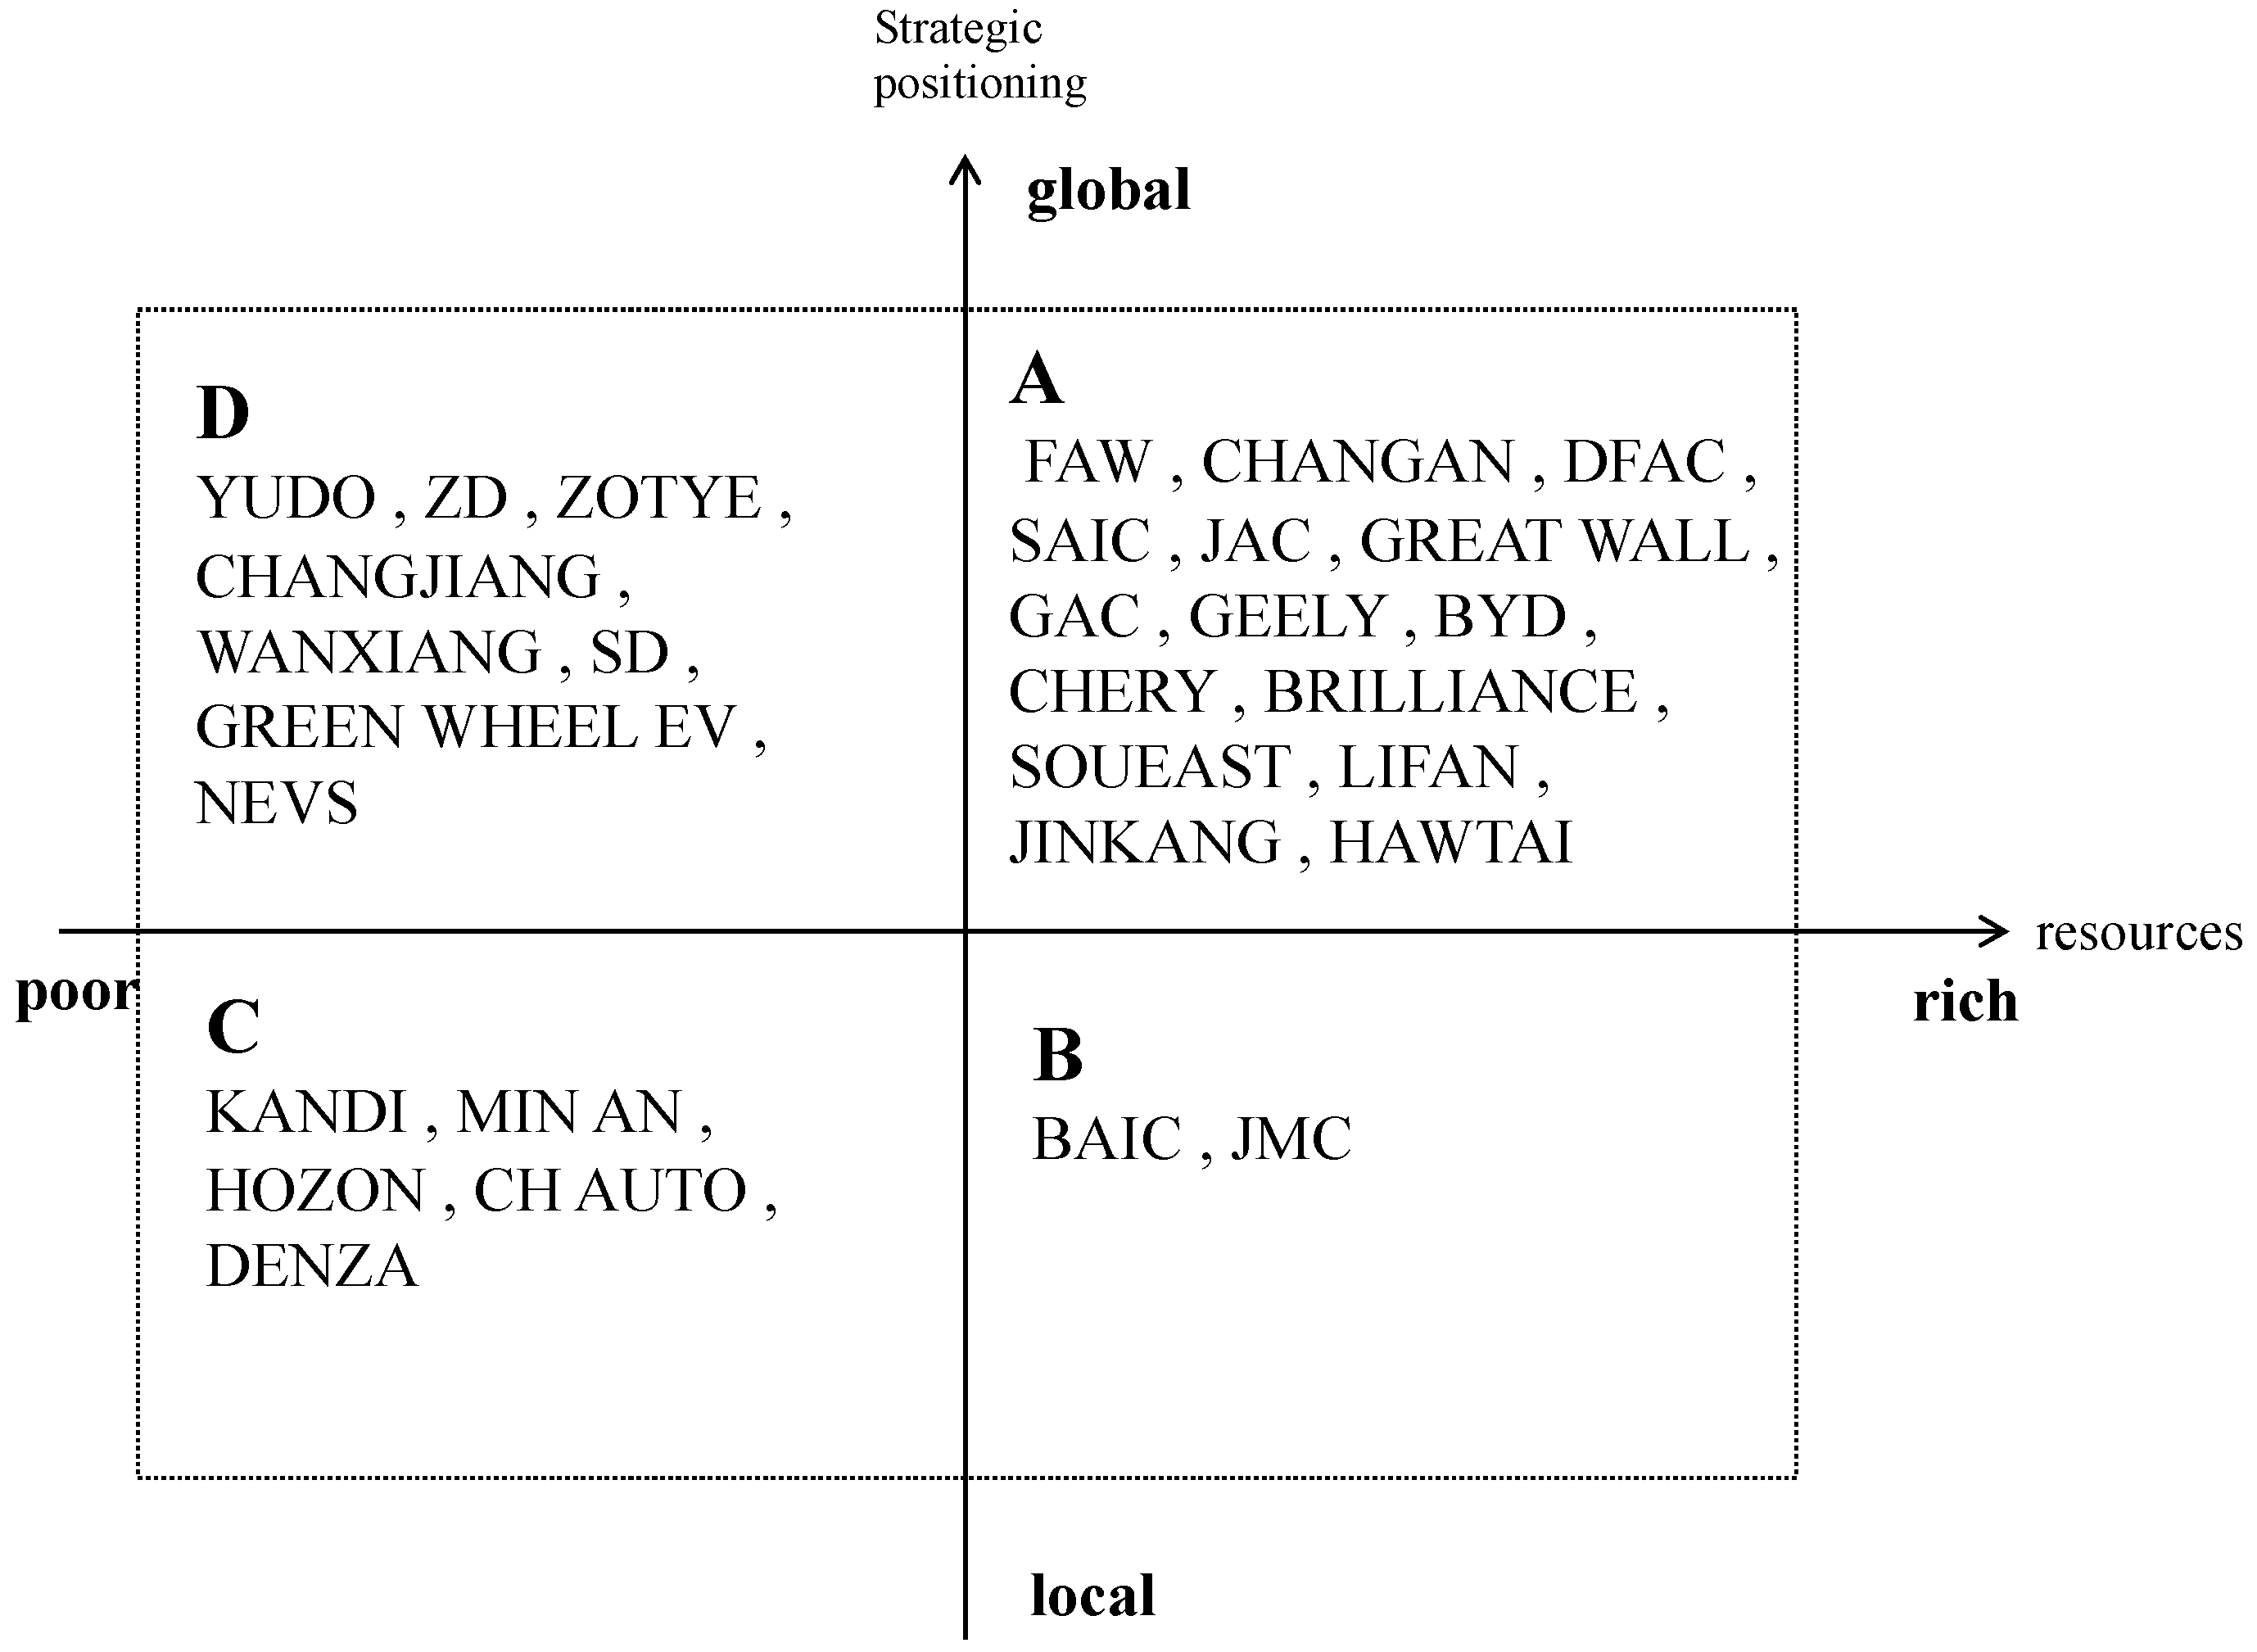
Using these data, this article divides China’s new energy vehicle enterprise into four categories according to visible resources and strategic positioning (
Figure 2). The first category of enterprises (Type A) consists of eight state-owned enterprises, six powerful private enterprises and a joint venture with total assets of more than 2000 million (EUR), adopting a global strategy. The second category of enterprises (Type B) consists of two state-owned enterprises, with total assets of more than 2000 million (EUR), but adopting a local strategy. The third category of enterprises (Type C) consists of three private enterprises and two joint ventures with total assets below 2000 million (EUR), adopting a local strategy. The fourth category of enterprises (Type D) consists of one newly state-owned enterprises, six private enterprises and a joint venture with total assets below 2000 million (EUR), adopting a global strategy. In this way, a classification framework based on the characteristics of enterprise ownership, resources, and strategic positioning are coordinated and constrained.
Table 4 shows the general characteristics representing a business model from every enterprise block. By comparing and analyzing the indicators, which constitute a weighted average, the four types will reveal their industry history and strategy choice.
(1) Business model characteristics of Type A
Type A enterprises have rich resources that target the global market. In terms of output, the sales of Type A contribute 3.32%. Compared to gasoline vehicles, new energy vehicles are still not dominant. The sales volume of new energy vehicles and the average unit price of products are the same as the averages of the industry. The product positioning of Type A is mainly economy/low-cost. The main business revenue is higher than the industry average, developing steadily. The number of suppliers in Type A is significantly higher than in the other types, with a strong group of partners, which reflects its good resource base. The number of dealers is equal to the industry average. In terms of research capacity, the number of employees is large, but the number of researchers is at the average level. The research and development investment is below the average of 8.97%, which is insufficient. Although patents are twice the industry average, the per capita patent ratio is not high. At the same time, business revenue and equity are above average.
(2) Business model characteristics of Type B
Type B firms have rich resources that target the local market. The products they launched are also economy models, which match the development needs of the local market. For example, BAIC and JMC have a series of ecological chain systems, such as leasing, public transportation, and car-sharing in the local market. These enterprises have a variety of product-promotion methods and occupy a large market share. The number of suppliers and dealers is relatively small compared to Type A. This may be due to the limitation of regional development. Overall, the research capacity of this cluster is relatively higher, with a proportion of 16.50%. The ratio of research and development to revenue is 4.84%, which is higher than Type A. The shareholder structure of solely state-owned enterprises is simple: there is only one owner. Both enterprises are dominated by the local State-owned Assets Supervision and Administration Commission (SASAC). Main business revenue and equity are lower than Type A, but they are equal to the industry average.
(3) Business model characteristics of Type C
Type C have relatively poor resources that target the local market. Most enterprises in Type C are small and medium-sized enterprises that are newly qualified in the EV industry. As emerging enterprises, they are still in their infancy. Products are not mass produced, so this cluster has fewer models. However, the proportion of new energy products is 100%. The enterprises DENZA, KANDI, HOZON, MIN AN, and CH AUTO only produce and sell electric vehicles. Except for KANDI’s urban micro-bus positioning, the rest aim at luxury models. For example, CH AUTO aims to produce luxury electric sports vehicles. Further, DENZA’s positioning is high end and, apart from traditional 4S shop sales, it uses its parent enterprises’ sales channels, BYD and Daimler. In terms of suppliers, relying on its parent company, DENZA has gained support from BYD’s battery technology and Daimler’s advanced design. Compared to A and B, the number of shareholders in Type C is higher. The startup enterprises have invested heavily in research and development while sales are limited so the research and development investment ratio is 94.6% of total revenue.
(4) Business model characteristics of Type D
Type D have poor resources that target the global market. The average product value in Type D is far lower than the average price. However, the value propositions of Type D are diversified. The enterprises ZD and ZOTYE are more inclined to low-end electric vehicles, whereas NEVS aims at the market segment of mid-size commercial cars. Type D are active in sales, logistics, rental, public transportation, and leasing. The number of dealers is the largest of the four types. The number of research and development personnel is huge; however, the research and development itself seems slightly insufficient. It is still higher than the average level of A and B. From the perspective of shareholder structure, the majority of shareholders of PEs are natural person shareholders and related investment institutions. Total assets, revenue, and equity are better than Type C.
Above are descriptions that illustrate the differences in business model characteristics defined by strategy and resources. It is shown that hypotheses 3 and 4 are valid. The following sections using the classification framework will analyze why ownership determines strategy and resources.
4.3. Ownership Determines Resources and Strategy
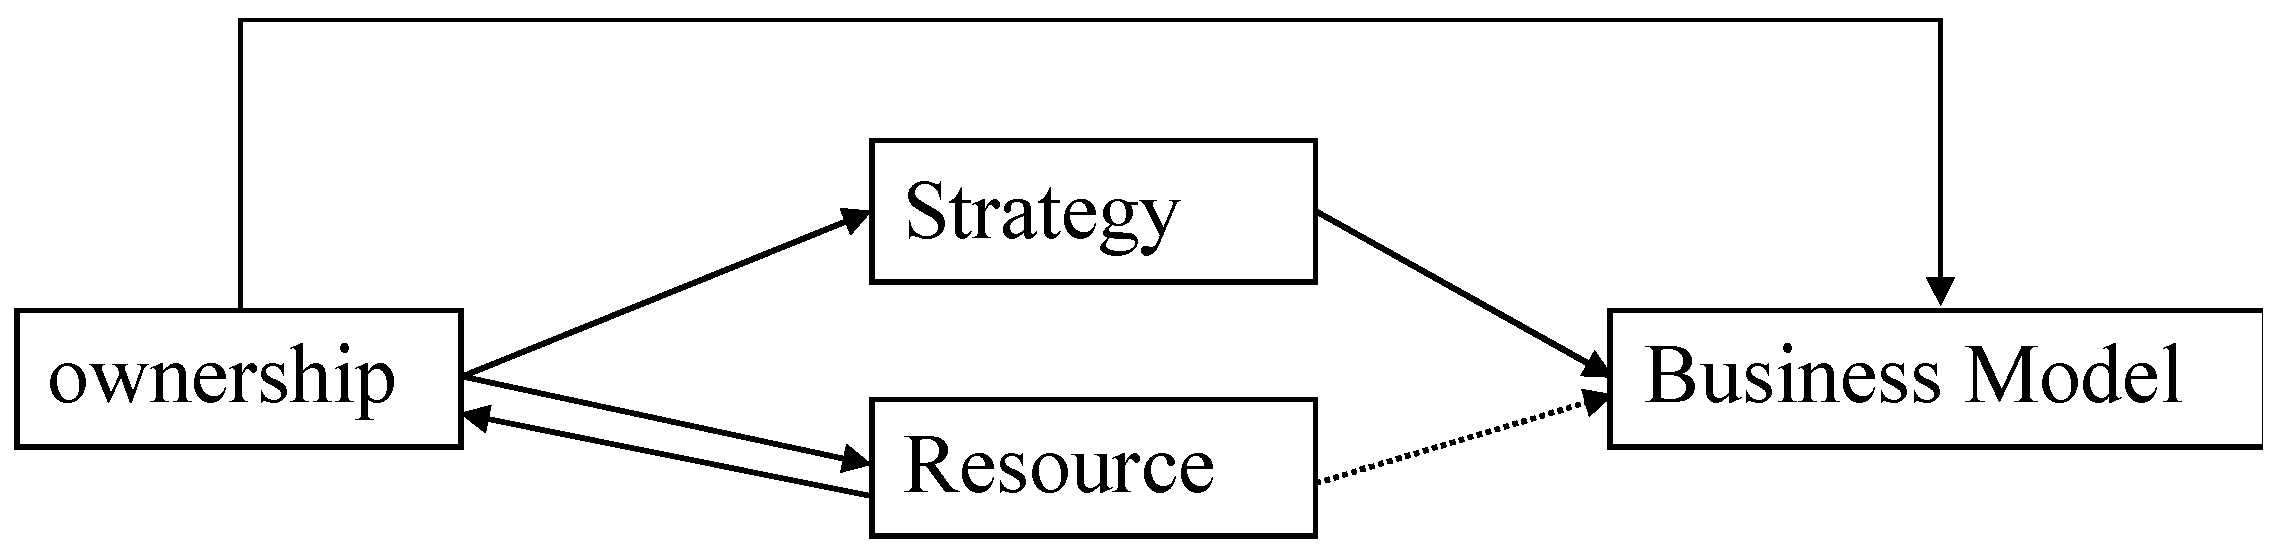
Based on the classification framework of China’s NEV enterprises, invisible resources and strategy contribute to their business model. This section further explores the reasons for business model differentiation, considering the historical background of enterprise resources and the enterprise’s competitive strategy as part of a discussion about strategic choice.
4.3.1. The Source of Resources with the Business Model
Given the unique history of every company, the amount and quality of assets are dependent on historical resources. Among all firms, there are three kinds of resource acquisition forms. Firstly, existing traditional vehicle manufacturing enterprises have rich human resources, technology, and equipment for accumulating further resources. Secondly, joint venture provide opportunities to acquire substantial resources in the form of capital, social networks, and auto-manufacturing experience from partners. Thirdly, emerging enterprises acquire resources from shareholders and the market, but often with slightly weaker results.
For expressing the effect of historic resources, this article divides the approach of resource acquisition into “only” and “both”. “Only” means enterprises that only produce new energy vehicles. “Both” refers to enterprises that rely on strong resources and produce both new energy vehicles and traditional vehicles. Then, the different enterprises are categorized into groups as shown in
Table 5.
According to the statistics, the enterprises that only produce electric vehicles have not accumulated rich asset yet. Enterprises that both produce traditional vehicles and new energy vehicles are still the mainstay. Resource-rich enterprises include SOEs in Type A and B, and PEs and JVs in Type A. These enterprises have the necessary production resources, such as factories, equipment, talent, and technology, and also have invisible assets in the form of sales chains, product markets, brand reputations etc. Therefore, these enterprises have played an important role in opening up the field of new energy vehicles.
In terms of ownership, we can compare the resources from an input–output perspective. According to the RBV theory, enterprises with resource advantages will have better market performance. If it is assumed that the resource investment of new energy vehicle producers is linked to their sales volumes, computing the input–output ratio of enterprises in different ownership categories will help us understand the important relationship between resource acquisition and enterprise ownership.
Table 6 shows the proportion of new energy vehicle investment to total sales at the enterprise level and represents the relative value of investment. We assume that how many EVs a company sells meaning that how much resources it invests. Therefore, the proportion is used to represent how much resources an enterprise invests in a same group. We compare the effect of different ownership on resources in each group. The major contributors of SOEA (SOEs in Type A) and PEA (PEs in Type A) invested 1.86% and 9.60%, respectively.
In
Table 7, which reflects the relative value of total output that is market shares at the industry level, it can be seen that sales of SOEA accounted for 13.75% and PEA accounted for 34.35% of total industry sales. According to the input–output results, the ratio of SOEA is 7.39, whereas the ratio of PEA is 3.58. That means that SOEA spent relatively less resources to achieve stronger market sales. Therefore, SOEs have more resources than PEs. Compared to JVs and PEs, JVC (joint ventures in Type C) invested 100% resources, with a market share of 1.78%. PEC (private enterprises in Type C) also invested 100% resources but gained a market share of 8.89%. The ratio of PEC is 8.89, whereas the ratio of JVC is 1.78. Thus, among China’s new energy vehicle enterprises, PEs have more resources than JVs. SOEs have more resources than PEs. Most SOEs have been able to obtain more and better resources. The externalities of SOEs are embodied in the system which has the greatest resource priority [
13].
A(%) represents the market share of SOEA, computed through the sales of SOEA divided by the total sales of new energy vehicles. B(%), C(%), D(%) are the same as A(%), albeit corresponding to different types.
Although Type A and Type B are both resource rich, the ratio of SOEA is higher than SOEB. According to input–output results, the ratio of SOEA is 7.39, whereas the ratio of SOEB is 6.93. The remaining small difference comes from corporate strategic differences. Resource priorities trigger negative externalities, which are lack of entrepreneurship and fairness [
49]; these will further affect strategic selection and market positioning, which are top priorities in the design of business model.
In summary, the first hypothesis that the business model is based on resources is proved. Ownership provides resource priorities for some enterprises. We have also discovered that enterprise resources are the foundation of enterprise strategy.
4.3.2. Competitive Strategies with the Business Model
The new energy vehicle industry has gradually shifted from policy-pull to market-push. The strategy of enterprise on the one side depends on the outside market; on the other side, it is decided by shareholders. Porter has put forward three major competition strategies: cost-leadership strategies, differentiation strategies, and centralized strategies [
50]. In this article, enterprises with high-profit margins are defined as cost-leadership enterprises. Enterprises that adopt differentiated strategies and specialized strategies are classified as other strategic choices. Based on the above comparative analysis, as shown in
Table 8, and according to the visible strategy of enterprises in the classification framework, the invisible competitive strategy is analyzed.
Overall, most enterprises choose cost-leadership competitive strategies, and a few enterprises choose other strategies. SOEs (A and B) with resource advantages have chosen cost-leadership strategies. Only one startup enterprise, YUNDO Vehicle, adopts a focused strategy on SUV products. SOEs of Type A have a vast global market, large-scale production, relatively mature technology, and abundant resources to maintain their long-term low-cost advantages.
As far as PEs are concerned, resource-rich PEs have diversified competition strategies, whereas PEs with weak resources are still dominated by cost-leadership strategies. PEs of Type C have a low cost, but low-cost products that are suitable for local development. Due to the lower product cost, the enterprise has a higher market share in the local market, resisting the entry of other competitors within the controllable range and improving the bargaining ability between suppliers and dealers. Thus, they can obtain a regional cost advantage.
Differentiated strategies in a joint venture are obvious. Only SOUEAST, a joint venture with stronger resources, has chosen a cost-leadership strategy, whereas emerging JVs with more limited resources regard luxury electric vehicles as their main products, such as NEVS and DENZA. Joint ventures often rely on the good reputation of the cooperating enterprises and foreign advanced technologies to join the rank of cost leaders.
According to the reasons for the choice of strategic positioning, competitive strategy leads the business model. We have confirmed the second hypothesis: the business model is driven by different strategic goals.
4.4. Business Model of Different Ownership
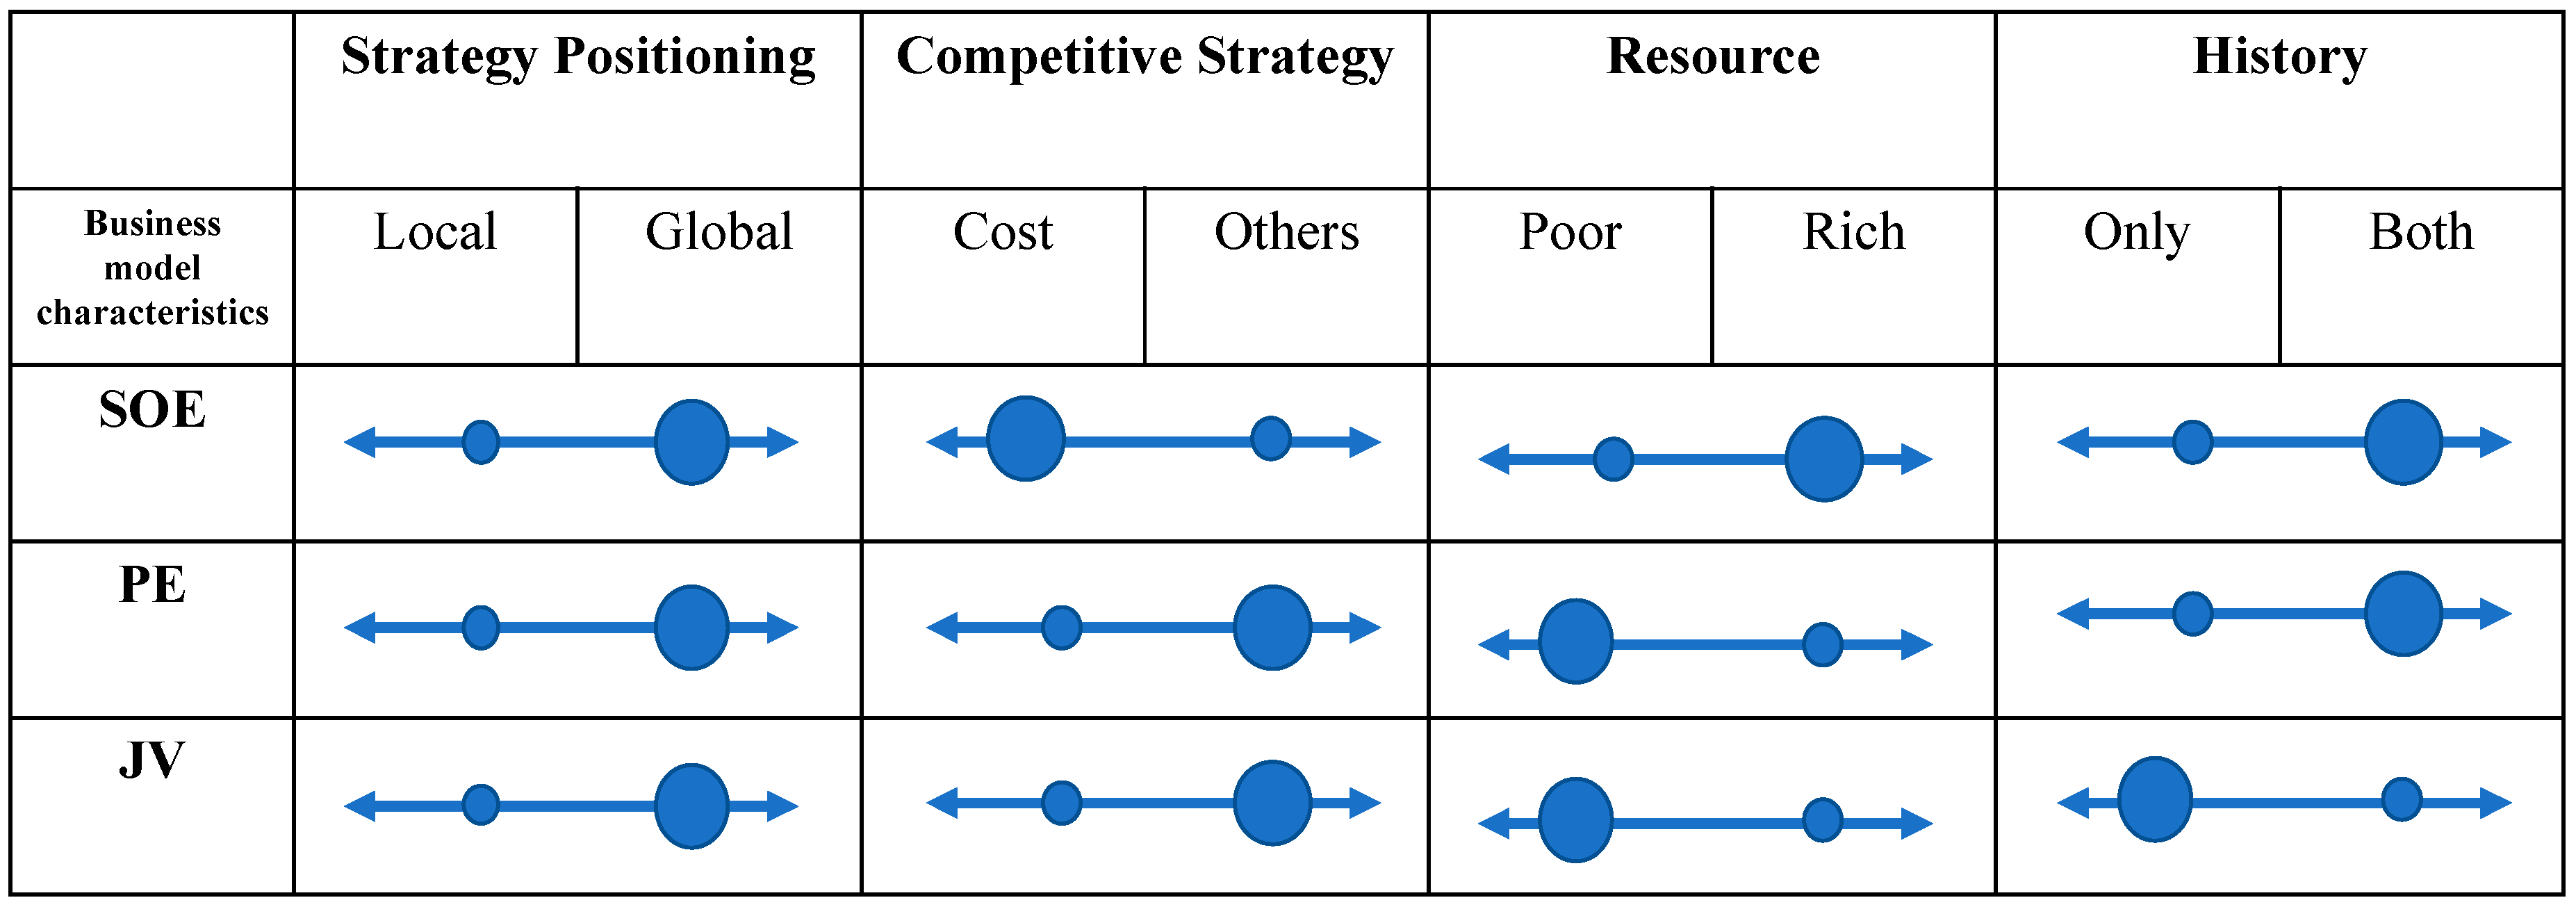
Business model differences are based on resources and linked to competitive strategy. The reasons for the differences between companies are mainly influenced by the company’s strategy and resources. This part will summarize the pattern of business models used by firms under different ownerships (see
Figure 3).
First, China’s state-owned enterprises are the mainstay of China’s new energy vehicle industry. Most SOEs are traditional vehicle-manufacturing enterprises. They have rich resources and adopt cost-leading competitive strategies to produce economical new energy vehicles. They occupy a low-cost, first-mover advantage in China and rely on continuous innovation to maintain their positions. It is difficult for other competitors to break the monopoly of SOEs in the low-end market. Guided by this strategy, most enterprises implement global strategic positioning.
Second, China’s private enterprises have made positive contributions to the sustainable development of EVs. Few PEs have developed from traditional vehicles to EVs, and hold stronger resources. The development of PEs is not balanced. Private enterprises design more aggressive business models, such as developing new consumer groups and producing more popular low-speed electric vehicles. However, in order to avoid competing with SOEs, most PEs have chosen other competitive strategies than cost-leadership. They actively expand in the international market with the guidance of other strategies.
Third, China’s joint venture will be an integral part of the future new energy vehicle field. The resources owned by the joint venture are still limited, despite the fact that JVs have drawn resources from both domestic and foreign sources. With traditional vehicles gradually disappearing, the business models of JVs will in the future accommodate more enterprises that want to enter the new energy vehicle field.
In summary,
Figure 3 in further supports the hypothesis that enterprise ownership affects enterprises’ business models.
4.5. Dynamic Transition of Business Model
Business models allow us to understand the internal coherence of strategy in a company and to characterize their resources. We have obtained the business model types represented by resource history, competitive strategy, and ownership, as shown in
Figure 4. This representation helps to explain the links between ownership, business model, strategy, and resources. At the same time, it can be seen that, under the influence of various factors, the business model may shift dynamically.
As shown in
Figure 4, there are 3 types of business model formed by the collocation of different strategies and resources based on SOEs, PEs, and JVs. Strategies refer to cost-leadership and other strategies that differentiate the firm from industry/cost leaders. Resources refer to the historical resources of the enterprise, whether they produce traditional vehicles or new energy vehicles (or both). The closer to the base point, the more unstable the business model is. The types of business model will change with changes in strategies and resources.
For the SOEs, BM1 will gradually move toward other strategies, such as differentiation strategy and centralization strategy. When the strategy is changed, the business model will also change. For example, in the early stages, the products made by SOEs were inexpensive and occupied the market with cost-leadership strategies. With the increase of consumer demand, the low-quality problem is hidden by the enterprise’s market expansion. Therefore, the incumbents choose to develop new high-end brands or choose to cooperate with other high-end brands to get rid of the impediments of low brand value. One enterprise undergoing such a change is BAIC, which focuses on the local market. It began to invest in the global market from 2014 and officially took a 25% stake in the American firm Atieva. It is trying to push its products from the local market to the global market, which means that its business model will also be reformed in the future.
For the PEs, strategic positioning has a greater impact on the business model. Why can they produce traditional vehicles but cannot accumulate more resources to support their new energy vehicles? Some PEs benefit from their technology-based differentiation strategies. Those with global positioning have more dealers, stronger research and development capabilities, and stronger suppliers, On the basis of these strategies, they vigorously expand overseas markets, establish overseas research and development centers, and merge with foreign automobile enterprises. However, PEs with a local strategy have smaller research and development staff and poorer revenues despite relying on the historical foundations of the owning enterprise. Maybe global strategic positioning improves resource acquisition. The enterprise BM2 should be analyzed according to specific business conditions.
Of the JVs, BM3 may not evolve to “both” resources. Due to a lack of sufficient resources, JVs face difficulties at the development stage [
51], and they are subject to competition from the SOE market and PE products. As traditional vehicles gradually disappear, and the double-credit policy is launched, the difference in resources will gradually diminish and the advantages of traditional vehicles will start to fade. Other elements such as technology and partnerships will dominate future business models.
6. Conclusions
The business model is tool for organizations to use resources to create, deliver and capture value for their partners and consumers and thus realize their strategic goals. Based on the resource-based view theory, this article analyzes the impact of ownership on business models in China’s new energy vehicle enterprises and obtains the following results.
The ownership of China’s new energy vehicle enterprises has an impact on the business model. By collecting data from 30 new energy vehicle enterprises, using ANOVA to analyze elements of the business models, this article shows that the business model elements differ between ownership categories in resources (asset, patent, R and D personnel) and value capture (revenue and equity).
The business model is the result of matching the competitive strategy with historical resources. Based on differences in business model dimensions, this article constructs a classification framework of new energy vehicle enterprises, which takes the resources as the X-axis and the strategic positioning as the Y-axis. Descriptive statistics are presented for different enterprise classifications, showing that elements of the business model are different because combinations of different strategies and resources have an impact on the business model. It provides a basis for further exploring the reasons behind differences in business models.
By the method of generalization and summarization, all enterprises are included in an analytical framework focusing on resources, including intangible resources, so as to get a distribution map of resource acquisition under different ownerships. Using a similar qualitative method, a distribution map for strategic positioning is determined. This shows that ownership plays a decisive role in strategic choice and resource acquisition.
Based on the study of the relationship between ownership, resources, strategy, and business models, this article identifies a stylized leading business model for state-owned enterprises, private enterprises, and joint ventures, respectively. Most state-owned enterprises employ a business model based on cost leadership and production of both EVs and traditional vehicles. The private enterprises’ business model favors product differentiation and production of both EVS and traditional vehicles, whereas the main joint ventures have selected a strategy based on differentiation and full focus on EVs. The difference between state-owned enterprises and private enterprises arises from the fact that enterprises choose different competitive strategies based on ownership (decisions of shareholders) and long-term history. The difference between private enterprises and joint ventures lies in the historical background. Private enterprises usually have experience in traditional vehicles, while JVs are newcomers without car manufacturing experience in China (but often with the necessary competence and technology through foreign partners).
The dynamic migration of business models of China’s new energy vehicle enterprises will be interesting to follow. The business model of China’s new energy vehicle enterprises is not static and will change over time. The business model of state-owned enterprises are likely to gradually move from cost leadership in the economy segment toward other strategies, such as the differentiation strategy or centralization strategy. The business model of joint ventures private enterprises are also likely to change, and the overall market environment changes as a result of technological development and strategic transitions in the SOE sector. The likely direction is more differentiation and stronger focus on specific market segments. However, resource acquisition will remain a challenge both for JVs and private enterprises, and a subject for further in-depth study.


