Article

Testing of the Integrated Energy Behavior of Sustainable Improved Mortar Panels with Recycled Additives by Means of Energy Simulation

by
Raúl Briones-Llorente
1,
Verónica Calderón
2,
Sara Gutiérrez-González
2,
Eduardo Montero
1 and
Ángel Rodríguez
2,*
1
Department of Electromechanical Engineering, University of Burgos, Avenida de Cantabria s/n, 09006 Burgos, Spain
2
Department of Construction, University of Burgos, Calle Villadiego s/n, 09001 Burgos, Spain
*
Author to whom correspondence should be addressed.
Sustainability 2019, 11(11), 3117; https://doi.org/10.3390/su11113117
Submission received: 11 May 2019 / Revised: 29 May 2019 / Accepted: 30 May 2019 / Published: 3 June 2019
(This article belongs to the Special Issue Sustainable Management of Waste Materials in Construction)

Abstract

:
Present waste management policies aim to reduce waste environmental impacts and improve resources’ efficiency. The use of waste and recycled materials to develop green construction materials are attracting researchers worldwide to develop new solutions addressed to increase the sustainability of buildings. This work presents a study of a new recycled mortar panel from the point of view of its contribution to the sustainability of buildings. Materials from industrial waste, as rigid polyurethane foam and electric arc furnace slags, are used as an additive of prefabricated mortar panels. The new proposed panels must have good thermal behavior with respect to the heat transfer interactions with the outside temperature and relative humidity, when compared to traditional brick or concrete. A test building with two kinds of representative uses, which are both residential and tertiary, and located in three cities of Spain with different climates, will be energy simulated in order to assess the thermal behavior of new construction or refurbished opaque ventilated façades with the new mortar panel. The thermal behavior of the new mortar panels would be studied by means of two energy assessments: (i) the evaluation of the influence of the new mortar panel in the energy demand of the whole building when compared to traditional materials, and (ii) the detailed analysis of the transient inner surface temperature of the space walls when using the new mortar panel. Based on the results obtained from the energy simulations performed, it follows that the thermal behavior of the mortar panel is, at least, equivalent to those of the other two materials, and even better in some aspects.

1. Introduction

At present, waste management policies aim to reduce waste environmental impacts and improve resources’ efficiency. The use of wastes and recycled materials to develop green construction materials are attracting researchers worldwide to develop new solutions addressed to increase the sustainability of buildings. Many waste materials coming from industry and demolition of buildings are now considered as potential substitutes of natural aggregates, even including e-waste [1]. Most research papers are devoted to the characterization of mechanical properties of such new additives when integrated in pieces of construction materials, using both experimentally or simulated tests. Only a few of them deal with evaluating properties as thermal transmittance [2,3], but always consider a small piece of material. When those new materials are integrated into a whole building, studies regarding the evaluation of its influence are scarcely found. For instance, a study on the environmental behavior of the building by means of Life Cycle Analysis is reported in Reference [4]. Although some researchers have studied the use of waste on facades, references are scarce and almost none are reported on the energy assessment of those recyclable additives and materials when integrated in a building [5,6,7,8].
From the point of view of the construction process, the use of prefabricated components for building construction is currently receiving increased attention. Its advantage consists of its industrial production and easiness of assembly at the work site. Therefore, this means more efficiency in construction comparing with façades executed in situ. The purpose of this work is to develop new prefabricated panels for the covering layer of façades with an added value from the point of view of the sustainability, but maintaining the thermal behavior of traditional materials like brick or concrete, and a good behavior against external agents. The target is to test the thermal behavior of a new mortar panel made of recycled materials in order to boost the sustainability of the façade.
The new proposed mortar panels include the addition of rigid polyurethane foam waste. Recycled polyurethane has been proposed as an additive to construction materials due to some advantageous characteristics, such as its excellent adhesion to substrates of various natures and extreme speed of installation. The behavior of polyurethane foams, used as adhesives for the construction of thin joints brick masonry walls, has been investigated in Reference [9]. Concerning prefabricated panels, Reference [10] investigates the structural behavior of a prefabricated wall system made up of glass fiber-reinforced rigid polyurethane foam and magnesium oxide. Moreover, the addition of polyurethane waste leads to a decrease of the thermal conductivity and the specific weight of plasters and mortars, which contributes to the sustainability of buildings [11,12]. Previous studies of our group on the durability and mechanical properties of lightweight mortar made of cement-based mixtures with rigid polyurethane foam wastes show the influence of the amount of polyurethane on the density, mechanical properties, workability, permeability, and occluded air content, by comparison with traditional mortars [13,14,15], while Reference [16] reports the same for plaster and polyurethane mixtures. Additionally, slags coming from steelmaking furnaces have been also investigated by our group as mortar additives [17,18,19,20,21,22,23], which contributes to the revalorization of industrial waste materials.
The aim of this work is to study a new recycled mortar panel from the point of view of its contribution to the sustainability of buildings. Materials from industrial waste, as rigid polyurethane foam and electric arc furnace slags, are used as additives of prefabricated mortar panels. The new proposed panels must have not only a resistance purpose, but they should have good thermal behavior with respect to the heat transfer interactions with the outside temperature and relative humidity, when compared to traditional brick or concrete. Based on the results obtained from the energy simulations performed, it follows that the thermal behavior of the mortar panel is, at least, equivalent to those of the other two materials, and even better in some aspects. Meanwhile, sustainability is enhanced because of the reuse of waste material, which contributes to promoting “the circular economy.”

2. Materials and Methods

A test building with two kinds of representative uses, which are residential and tertiary, and located in three cities of Spain with different climates, will be energy simulated in order to assess the thermal behavior of the ventilated façades with the new mortar panel. The thermal behavior of the new mortar panels would be studied by means of two energy assessments: (i) the evaluation of the influence of the new mortar panel in the energy demand of the whole building when compared to traditional materials, and (ii) the detailed analysis of the transient inner surface temperature of the space walls when using the new mortar panel. Approaches combined, including total cumulated energy demand and transient surface temperatures, will give a true energy evaluation of the new material when integrated in a building. In this study, a representative two story-building with a rectangular shape has been energy simulated. Several operational conditions, building’s use and climatic data will be used for comparison. The simulations have been made by means of Transient System Simulation package (TRNSYS).

2.1. New Mortar Panel

A new mortar panel with the shape of an orthogonal parallelepiped, with 1.000 m × 0.400 m × 0.115 m dimensions, has been designed for this research, using cement mortar dosed with rigid polyurethane foam valued waste and electric arc furnace slags valued waste.
A prototype made in the laboratory of the Department of Construction of the University of Burgos is shown in Figure 1.

2.1.1. Materials and Dosing Mortar

For the research, a cement mortar manufactured with natural silicic aggregate and rigid polyurethane foams was designed. The composition of the mortar is as follows.
  • Cement: Ordinary Portland cement Type CEM I 42.5 R, with a density of 3.150 kg/m3 and a Blaine Specific Surface Area of 4.100 cm2/g, determined by laser diffraction. The equipment is a Mastersizer X Malvern Panalytical, with a focal length lens of 300 mm, in order to capture the range of sizes of a dry sample of material in a single test, as per the specifications of Reference [24]. The majority of its particles (>85%) were less than 90 µ in size.
  • Natural Aggregates (NA): Washed silica sand, 0/4 mm extracted from a sedimentary bed in an open-air quarry located at Montorio (Burgos, Spain), with actual density of 2.600 kg/m3 and fineness modulus (FM) of 3.5. It was analyzed by X-ray Fluorescence equipment, ARL ADVAT XP Sequential XRF Thermo Electron Corporation. The silica content was found to be greater than 97% in mass.
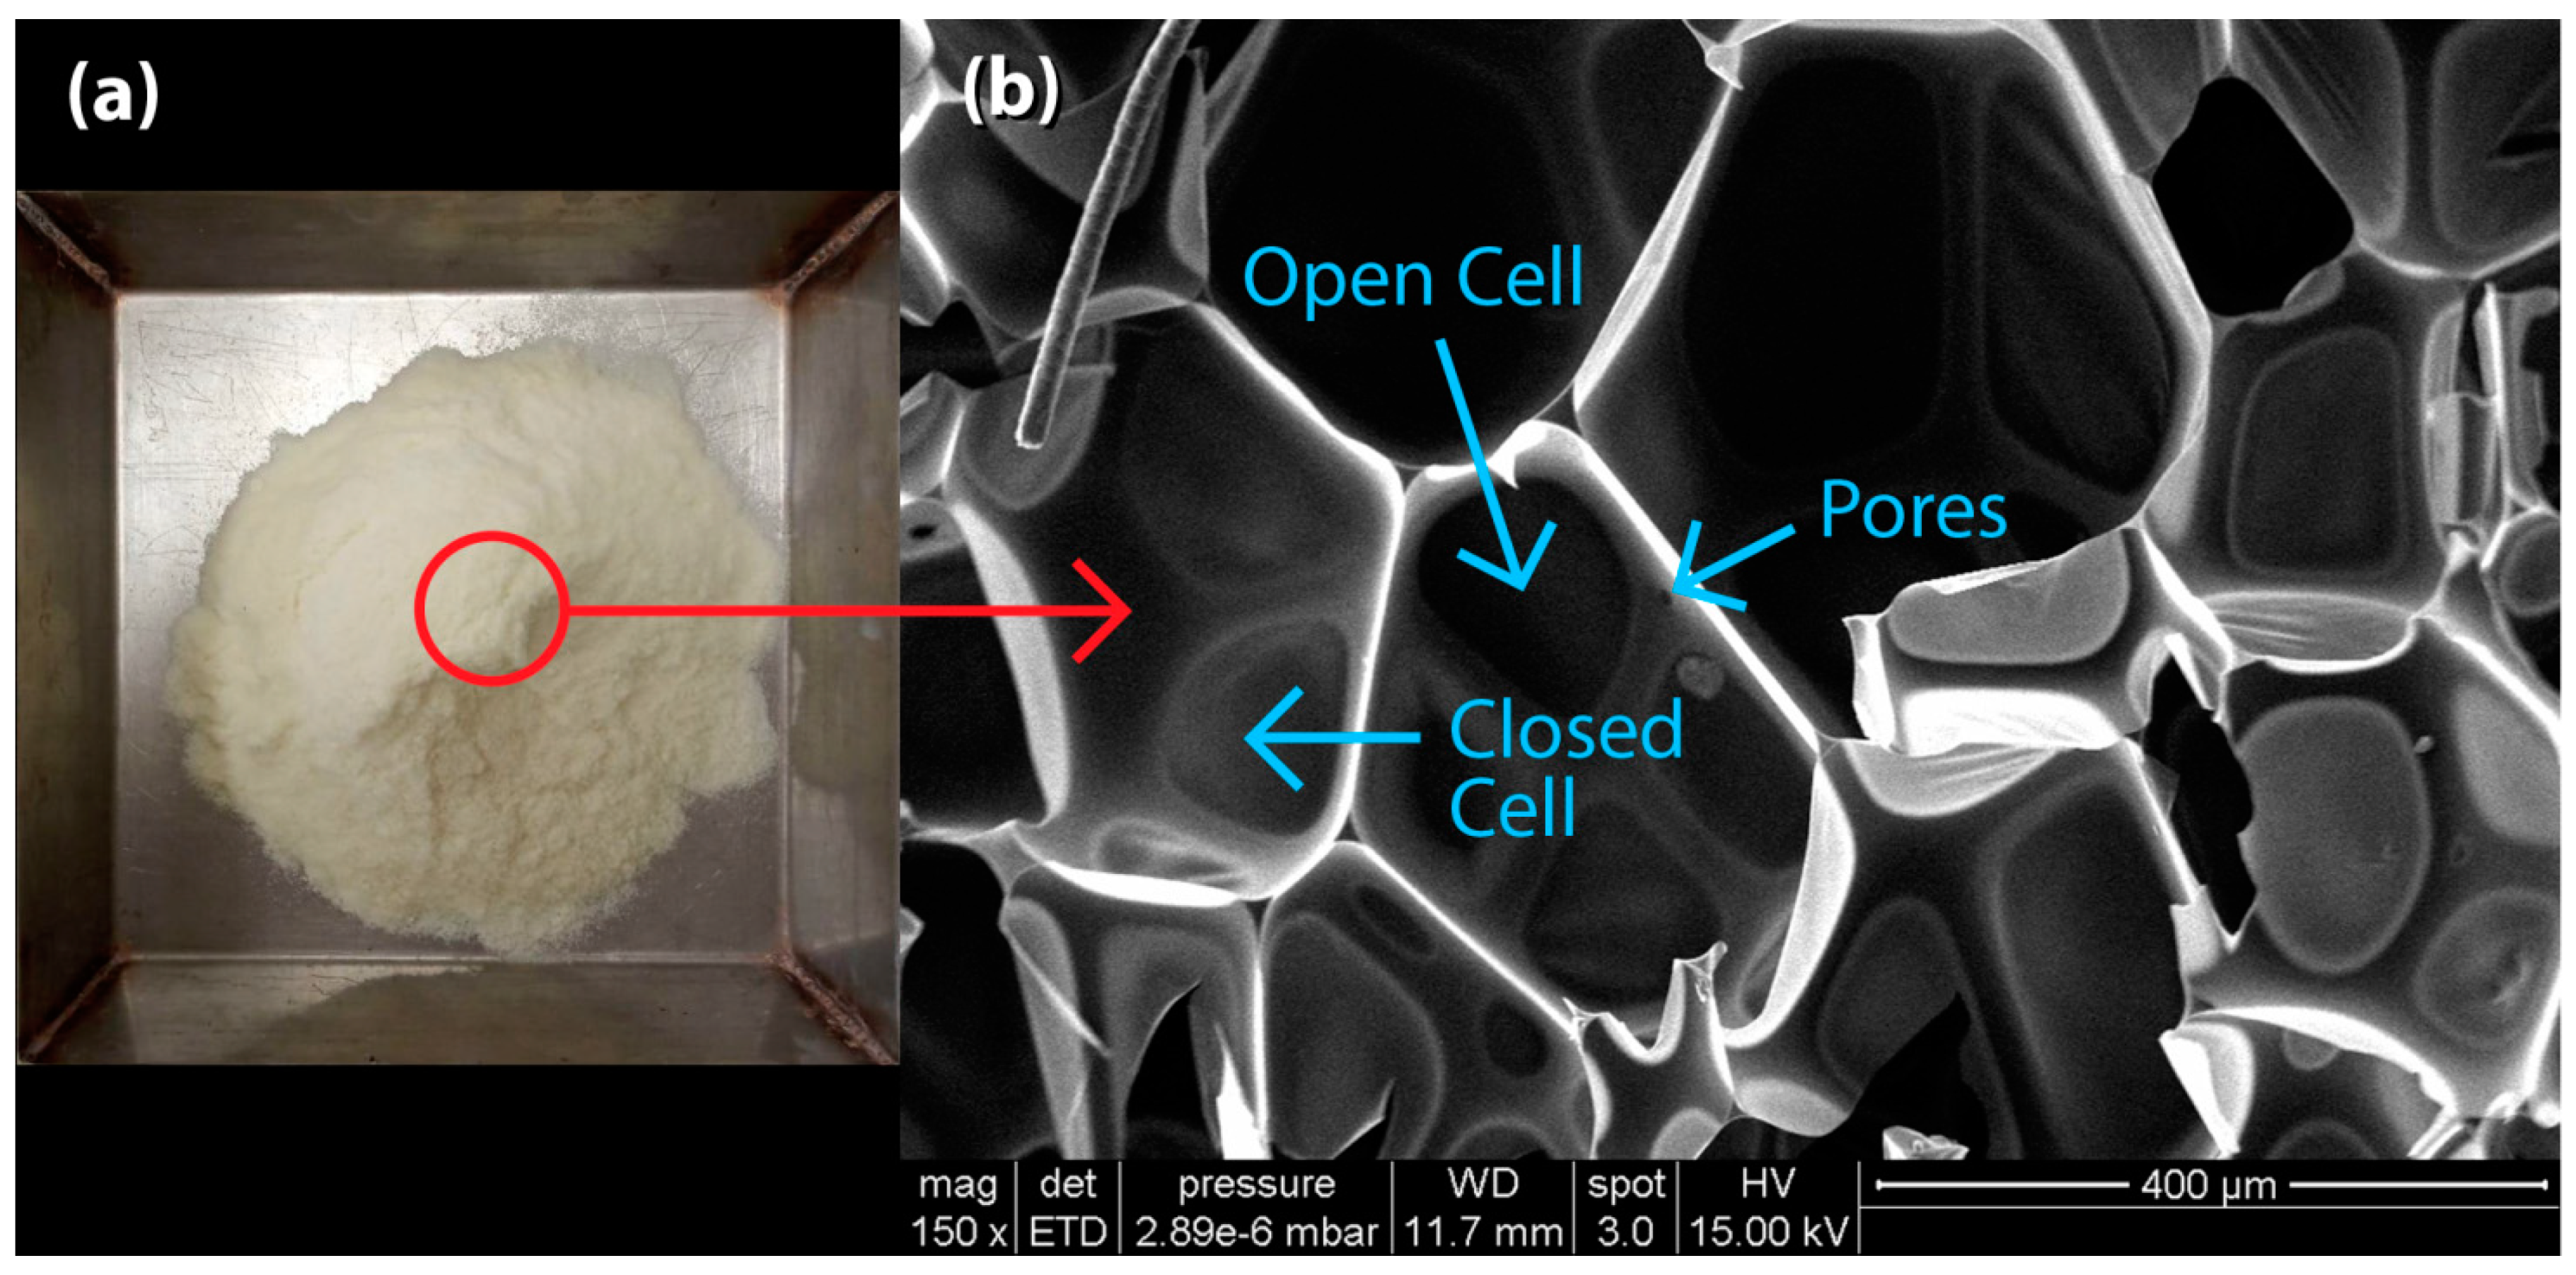
  • Rigid Polyurethane Foam Waste (PFW), obtained from the destruction of panel waste used in the industry, using a RETSCH SM 100 laboratory blade mill with helical rotor and sieves. The apparent density of the PFW was measured on three cubic test specimens, which obtained an average apparent density of 26 ± 2 kg/m3. This is due to the mixture of open cells, closed cells, and pores. Figure 2 shows this cellular structure obtained by means of a scanning electron microscope (SEM) FEI Quanta 600. PFW was ground to obtain a uniform granularity with 75% of particles sized between 0.25 mm and 1.00 mm, before being blended with the other components of the mortar.
The chemical composition of PFW obtained by the elemental analysis CHNS with an analyzer LECO CHNS-932 and with X-ray diffraction is shown in Table 1.
  • Electric Arc Furnace Slag (EAFS) obtained in the steelmaking process (primary metallurgy). The slag is washed and sieved. The slag selects sizes smaller than 4 mm. Later, the slag stabilizes to avoid the volume variations produced by the expansion of the calcium oxide (CaO) and magnesium oxide (MgO).
    Once stabilized, the slag is analyzed by the X-ray Fluorescence Spectroscopic technique, with a Thermo Electron Corporation ARL ADVAT XP Sequential XRF with Claisse Fluxy. The results of the most significant components of the EAFS are shown in Table 2.
  • Water: obtained from urban supply with good features for manufacturing conglomerates. The mortars have been manufactured and dosed with a mass water/cement ratio (w/c) = 1.16. The amount of added water was the amount needed to achieve mortars of plastic consistency. A slump on the flow table of 175 ± 10 mm is in accordance with Reference [25].
The raw materials used in the manufacture of mortar by weight kneading are shown inTable 3.

2.1.2. Mortar Characterization

Some mortar features required for the proposed research have been characterized by using the same techniques as in previous research articles [15,17,18].
  • Dry bulk density of hardened mortar (δ): it has been determined according to the procedure established in Reference [25], by the relation between the material mass and the apparent volume that it takes up, by using the hydrostatic weighing scale methodology. It has been calculated by determining the average mass and the dimensions of the test specimen. Previously, the specimens were conditioned in an oven to a constant mass at 40 °C. Then, each specimen was weighed to a precision of ± 0.1 g, and its length and width recorded, measuring at three points along the length of the board and at three points along the width of the board. The thickness of the board should be measured at six points located close to one of the transversal edges.
  • Thermal conductivity of hardened mortar (λ): it has been determined according to Reference [26], by means of a guarded hot plate and heat flow meter method, which establish a constant and uniform relationship between the heat flow density in the inside of the homogeneous samples and a set of plane parallel faces. Two mortar square samples with 0.150 m edge length and 0.015 m thickness have been developed and placed at both sides of the hot plate, which is perfectly fitted and insulated. The specimens were analyzed by means of a Laser Comp FOX 304 heat flow meter. In order to verify the results obtained by means of the guarded hot plate and heat flow meter method described, a new thermal conductivity test is performed with the C-THERM TCI equipment that uses the patented Modified Transient Plane Source (MTPS) technique. The average value obtained by both test procedures is shown in Table 4.
  • Water vapor diffusion resistance factor (μ): Water Vapor Permeance (Wp) and Water Vapor Permeability (δp) should be known previously, according to Reference [27]. This Standard specifies that, to find the permeability value, it is first necessary to calculate the permeance, which is the water vapor flow that passes through one area unit under equilibrium conditions for each unit of the vapor pressure difference on both sides of the mortar. Subsequently, water vapor permeability is calculated as the result of multiplying the permeability by the thickness of the test specimen. Five test specimens have been prepared and tested, in order to establish the permeability in all of them, and then we used the average value for each of the different grades mortar. The water vapor diffusion resistance factor is calculated by the relation between the air vapor permeability and the one obtained for the mortar.
  • Specific heat (Cp): The specific heat of the mortar with foams was determined, according to the analytical procedure method of mixtures described in Reference [28].
The main features of the new mortar panel are shown in Table 4.

2.2. Building Energy Simulation

Once the new mortar with recycled additives has been characterized, its energy behavior when integrated into a case study building should be assessed. The aim is to check if the new mortar panel behaves at least as well as the traditional materials, from the point of view of the energy analysis. The study will be performed by means of the energy simulation results of two sets of properties. The first one is evaluating the influence of the new mortar panel in the energy demand of the whole building when compared to traditional materials. Yearly heating demands and cooling demands are assessed for three different locations and climates. The second set of results is a detailed analysis of the transient inner surface temperature of the space walls when using the new mortar panel. When both approaches are combined, total cumulated energy demand, and transient surface temperatures will give a truly energy evaluation of the new material when integrated in a building.
In this study, a representative two-story building with a rectangular shape has been energy simulated. Several operational conditions, building’s use, and climatic data will be used for comparison. The simulations have been made by means of the Transient System Simulation package (TRNSYS v.17, Thermal Energy System Specialists, LLC, Madison, WI, USA) [29], which is an extremely flexible, graphically-based software environment used to simulate the behavior of transient systems, such as buildings. TRNSYS is made up of two parts. The first one reads and processes the input file, iteratively solves the system, determines convergence, and plots system variables. The second part is an extensive library of components, which models the performance of one part of the system.

2.2.1. Building Geometry

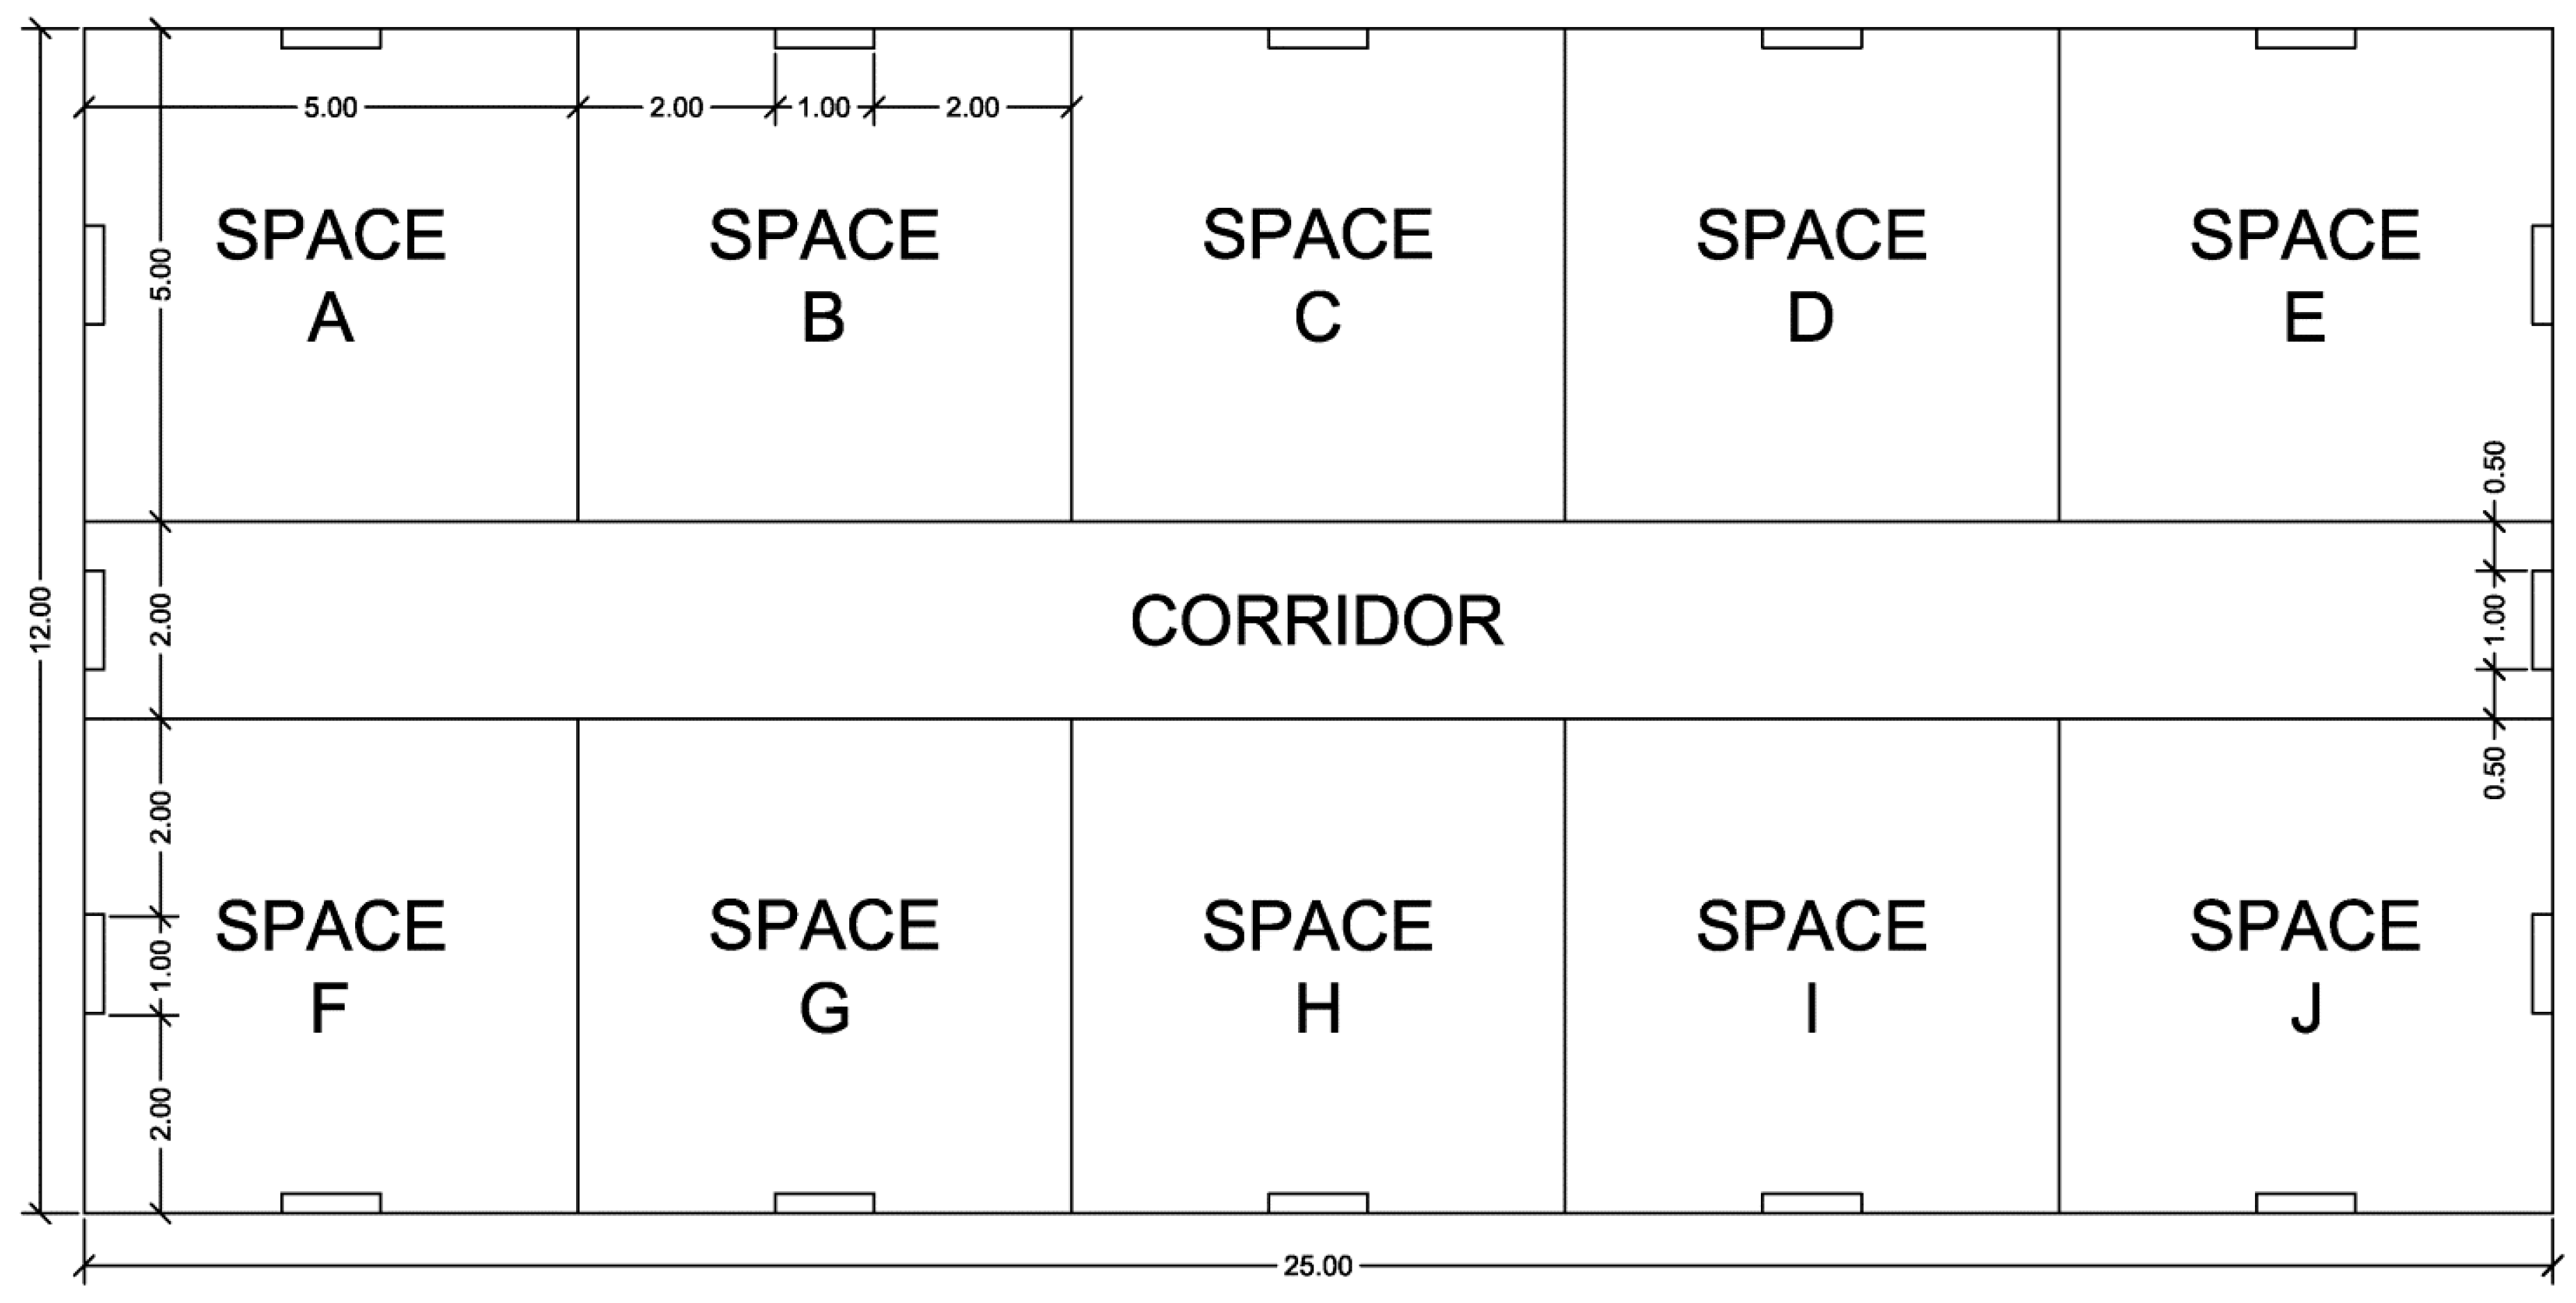
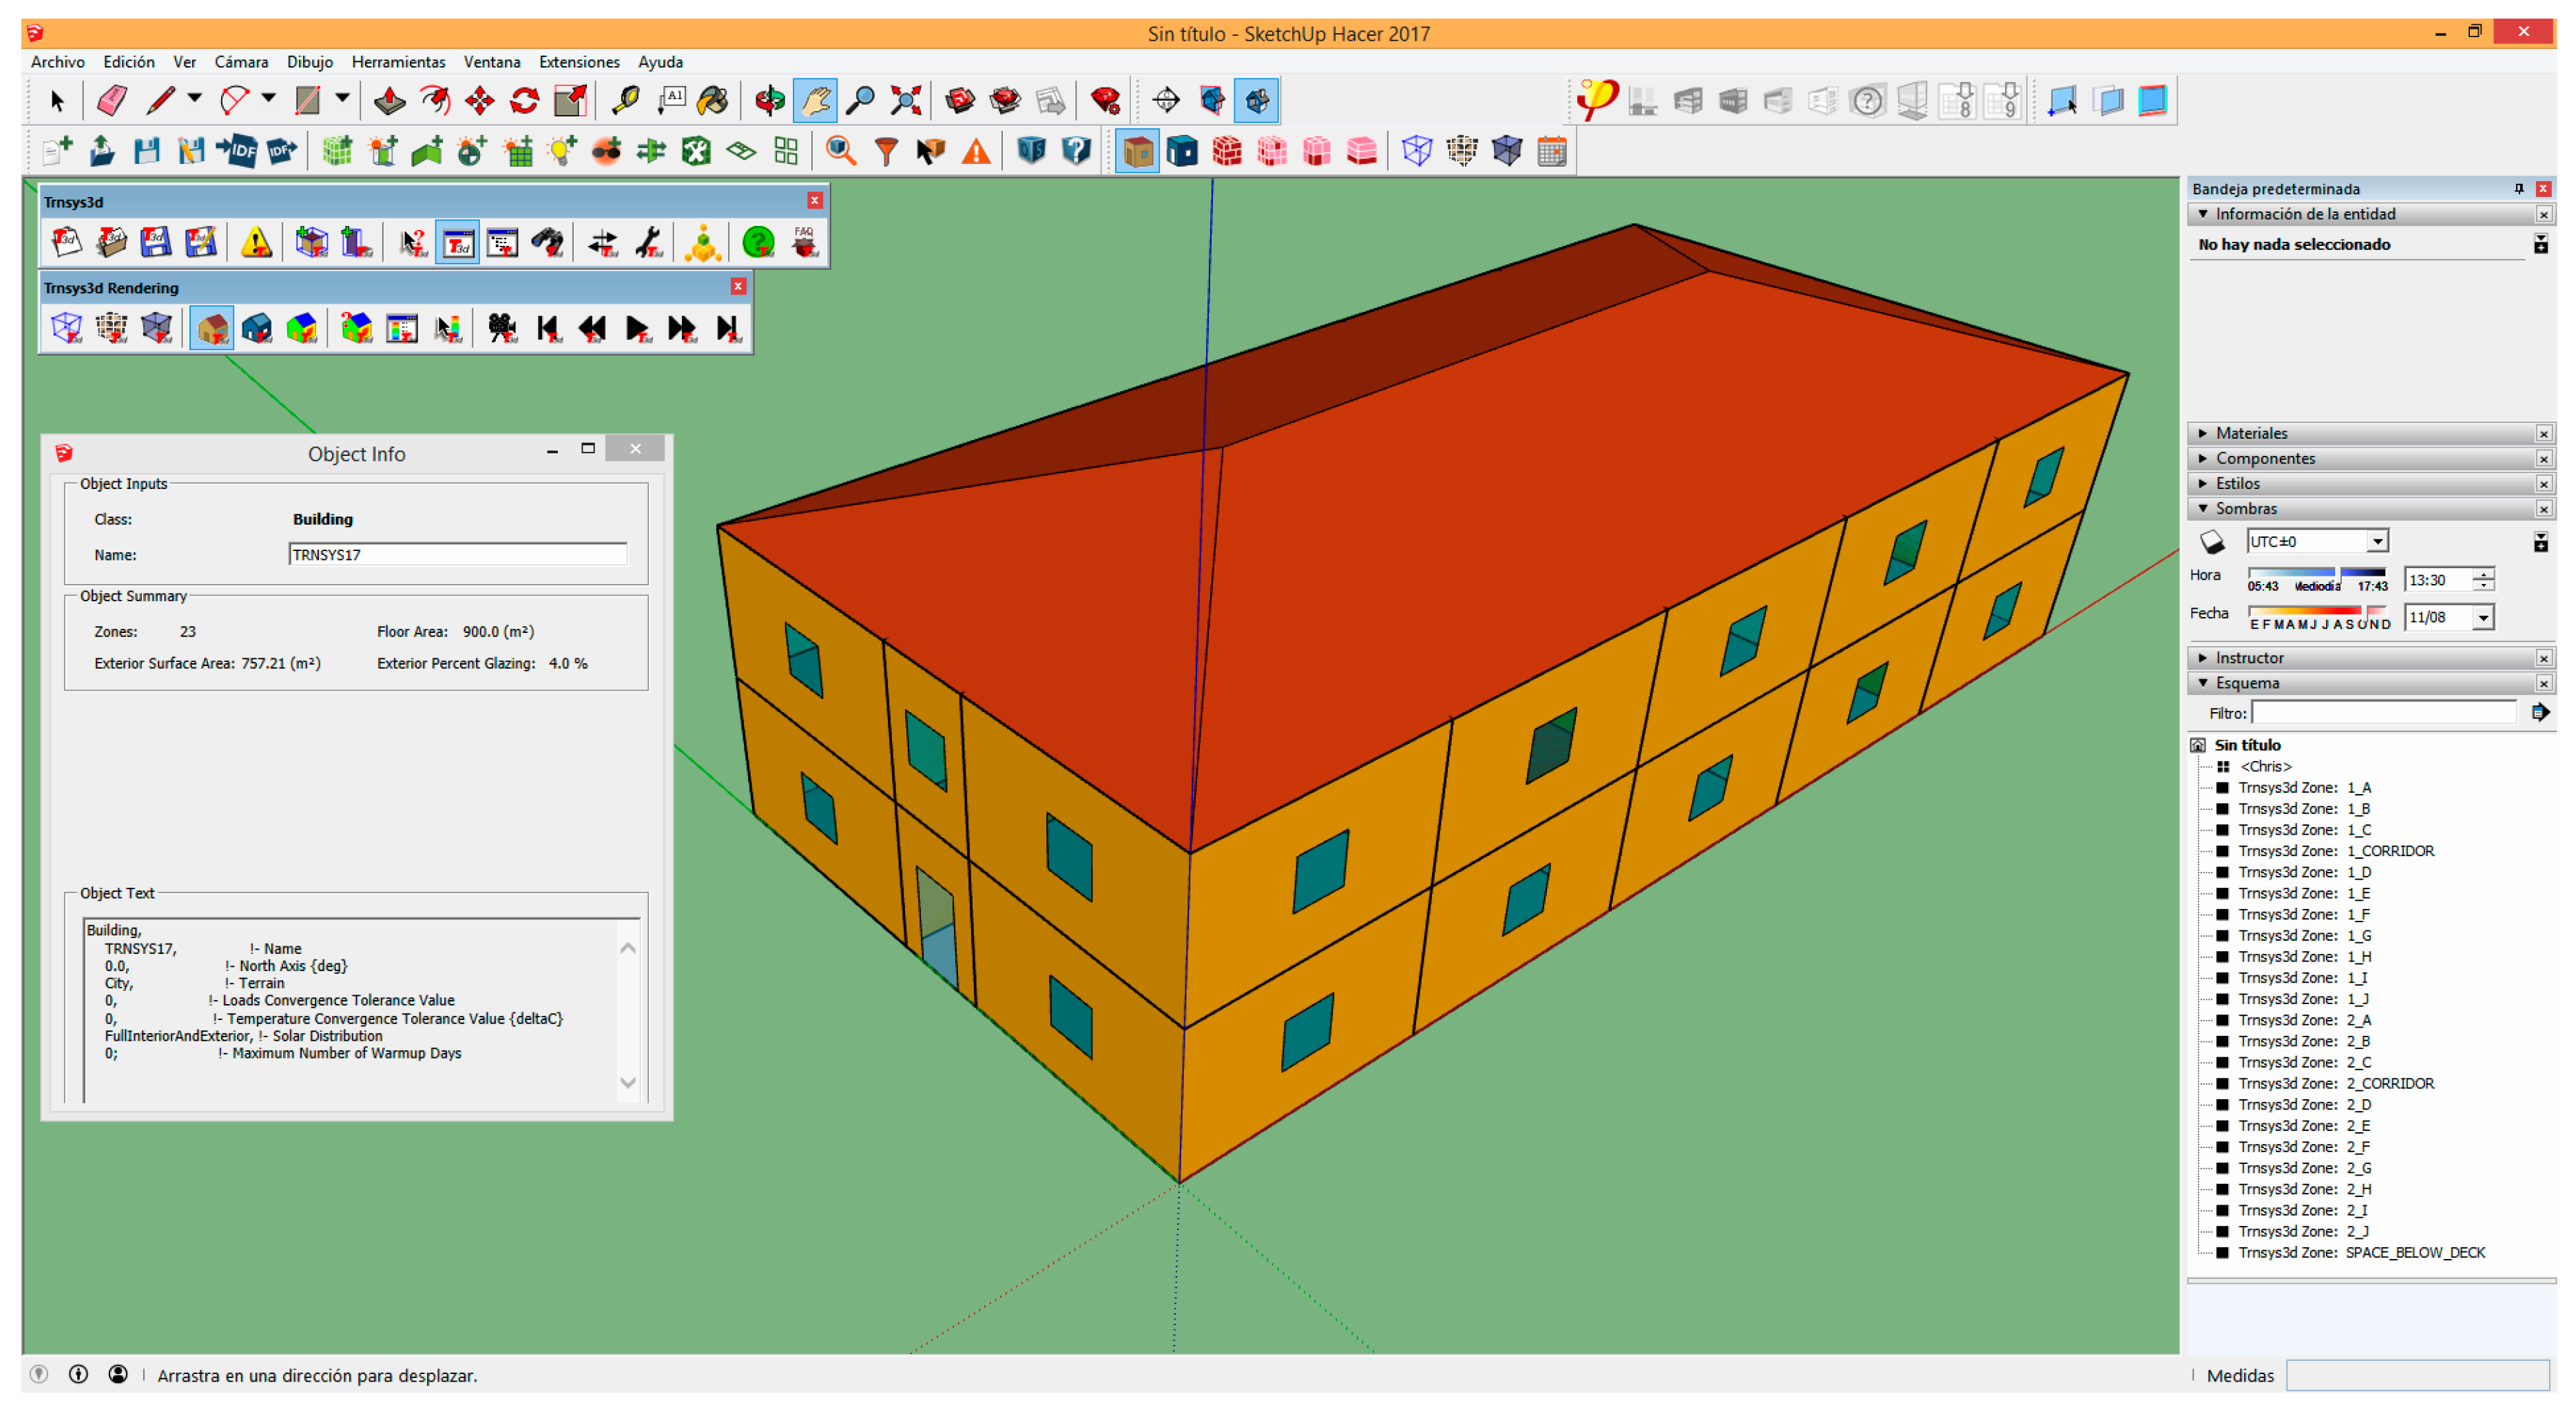
The building has two equal storys with a rectangular shape, with floor dimensions 25.00 m × 12.00 m, and a height of 3.00 m (inside measurement). There is also a third story with a non-habitable space under the sloping roof. The first and second stories have an equal distribution. They have 10 habitable spaces divided in two groups of five spaces along the longest façades. Between these two groups, there is a corridor.
The living spaces are squares with a 5-m edge length. The six intermediate ones have a square window with a 1-m edge length. The four corner spaces have two façades, with one square window at each one. The corridors have a rectangular shape with dimensions of 25 m × 2 m. They have two façades, with a door on each one, with dimensions of 1 m × 2 m.
The shape and dimensions of the building are shown in Figure 3 and Figure 4.

2.2.2. Building Constructive Features

Building enclosures and inner partitions have been generated by layers with TRNSYS, ordered from inside to outside, according with the constructive features of the materials of each layer. The thermal transmittance of all of them and the windows are always under the limits allowed by the Spanish Building Code [30], which are different depending on the climate of the three Spanish cities chosen for the energy simulations: Burgos, Barcelona, and Almería. That means three different values of thermal insulation, with each corresponding to the respective location.
Three types of façades have been assessed with different outer covering layers: (i) face brick masonry, (ii) new mortar panel, and (iii) concrete panel. All of the façades simulated have the minimum insulation thickness in order to not exceed the limits of the Spanish Building Code [30]. Now, all of the constructive features of the façades are shown in Table 5 and Table 6 (in layers from the inside to the outside). In addition, constructive sections of the façades are shown in Figure 5.
Linear thermal bridges have not been considered to force the thermal gains and losses through the façades for obtaining clearer results. A medium solar absorptance value (α = 0.5) has been estimated for all of the building enclosures.

2.2.3. Building Operational Conditions

Two user profiles based both on the “residential” and on the “not residential conditions with medium intensity during the 12-h use profile,” from Reference [30], have been generated for TRNSYS. The occupation ratio for residential use is 1 person/20 m2, and, for tertiary use, is 1 person/10 m2, respectively. The considered equipment for the residential use is the usual electrical households, and, for the tertiary use, is the usual office equipment, like computers, printers, or photocopiers.
For the second user profile, lighting internal gains have been calculated based on the use of compact fluorescent lamps with an energy performance of 80 lm/W. The average horizontal illuminance is 500 lux. The considered space ventilation ratios are 0.63 renovations/hour for residential use and 0.80 for tertiary use. The values are detailed in Table 7, Table 8, Table 9, Table 10, Table 11 and Table 12. The HVAC systems description is not the purpose of this research work.

2.2.4. Climatic Conditions

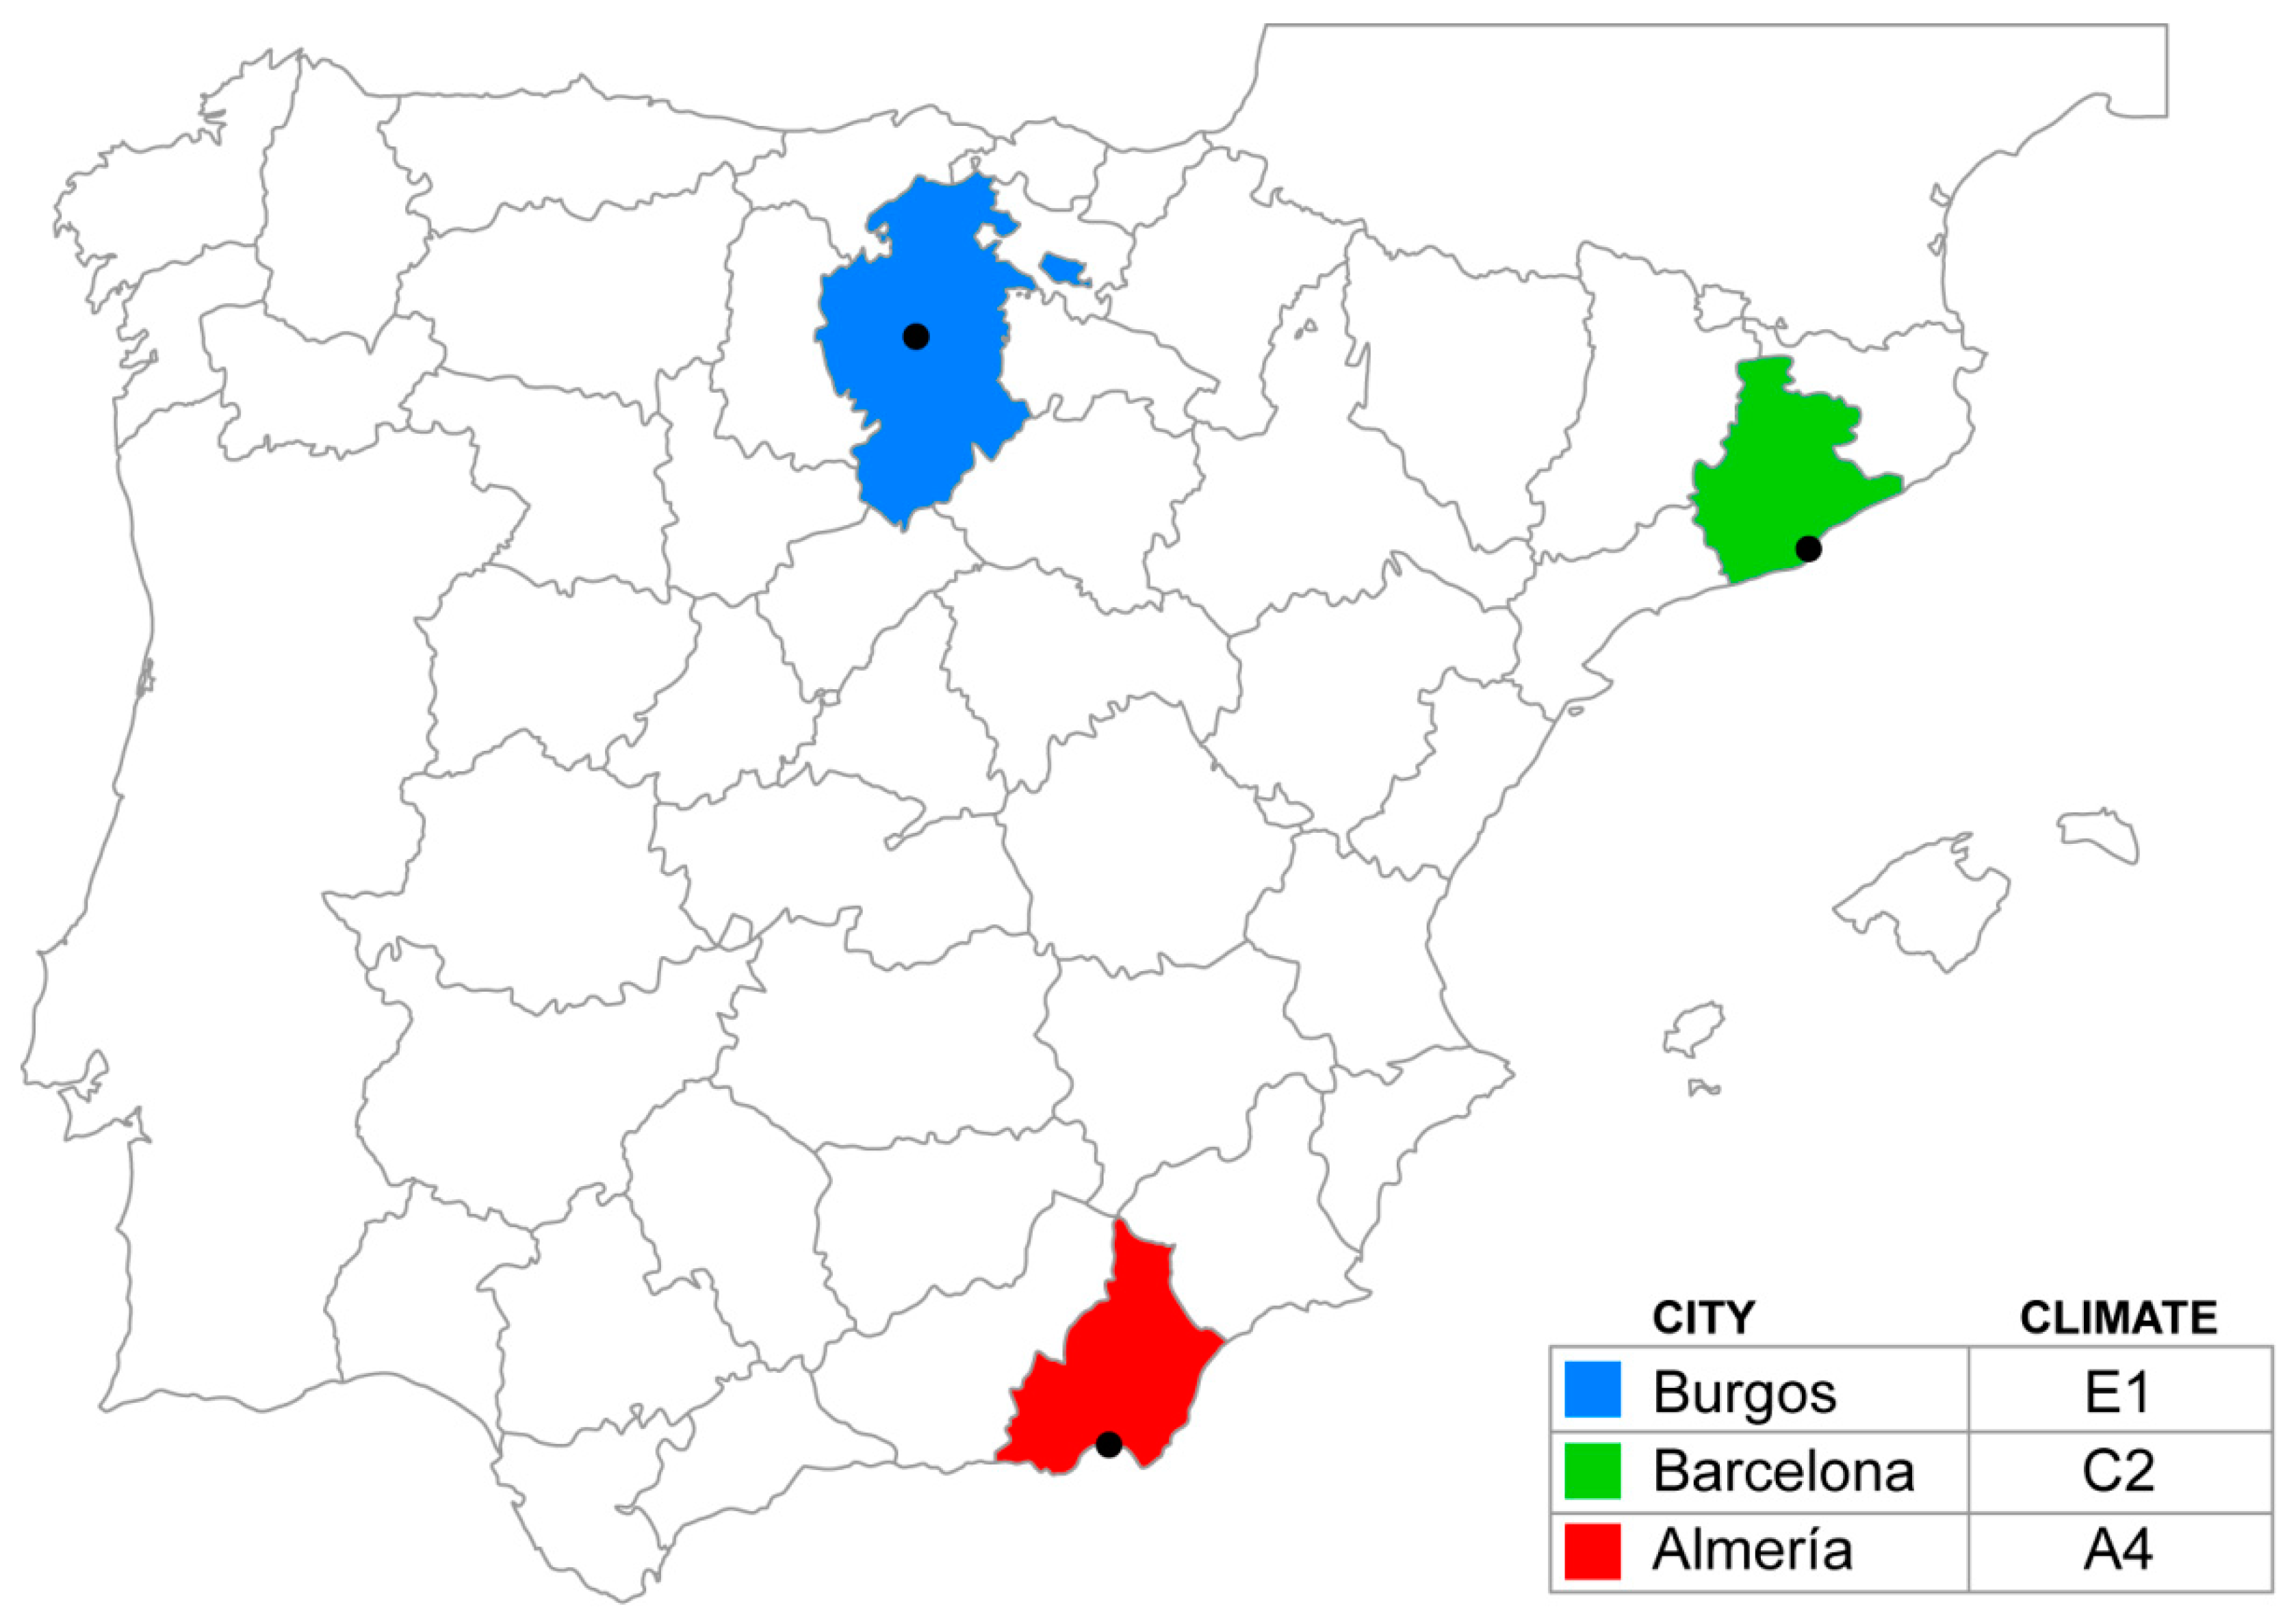
Energy simulations have been performed locating the office in three Spanish cities: Burgos, Almería, and Barcelona, which are representative of the most severe climate in Winter (E1), the most severe climate in Summer (A4), and an average climate (C2), respectively, according to Reference [30]. They are shown in Figure 6 and Table 13 and Table 14.

3. Results and Discussion

3.1. Energy Demand

Eighteen energy simulations of the building have been developed by means of the TRNSYS package, with the purpose of assessing the heating and cooling demands. The simulations have been performed considering all the possible combinations of:
  • City location: Burgos, Barcelona, or Almería.
  • Use: residential or tertiary.
  • Outer covering layers: face brick masonry, new mortar panel, or concrete panel.
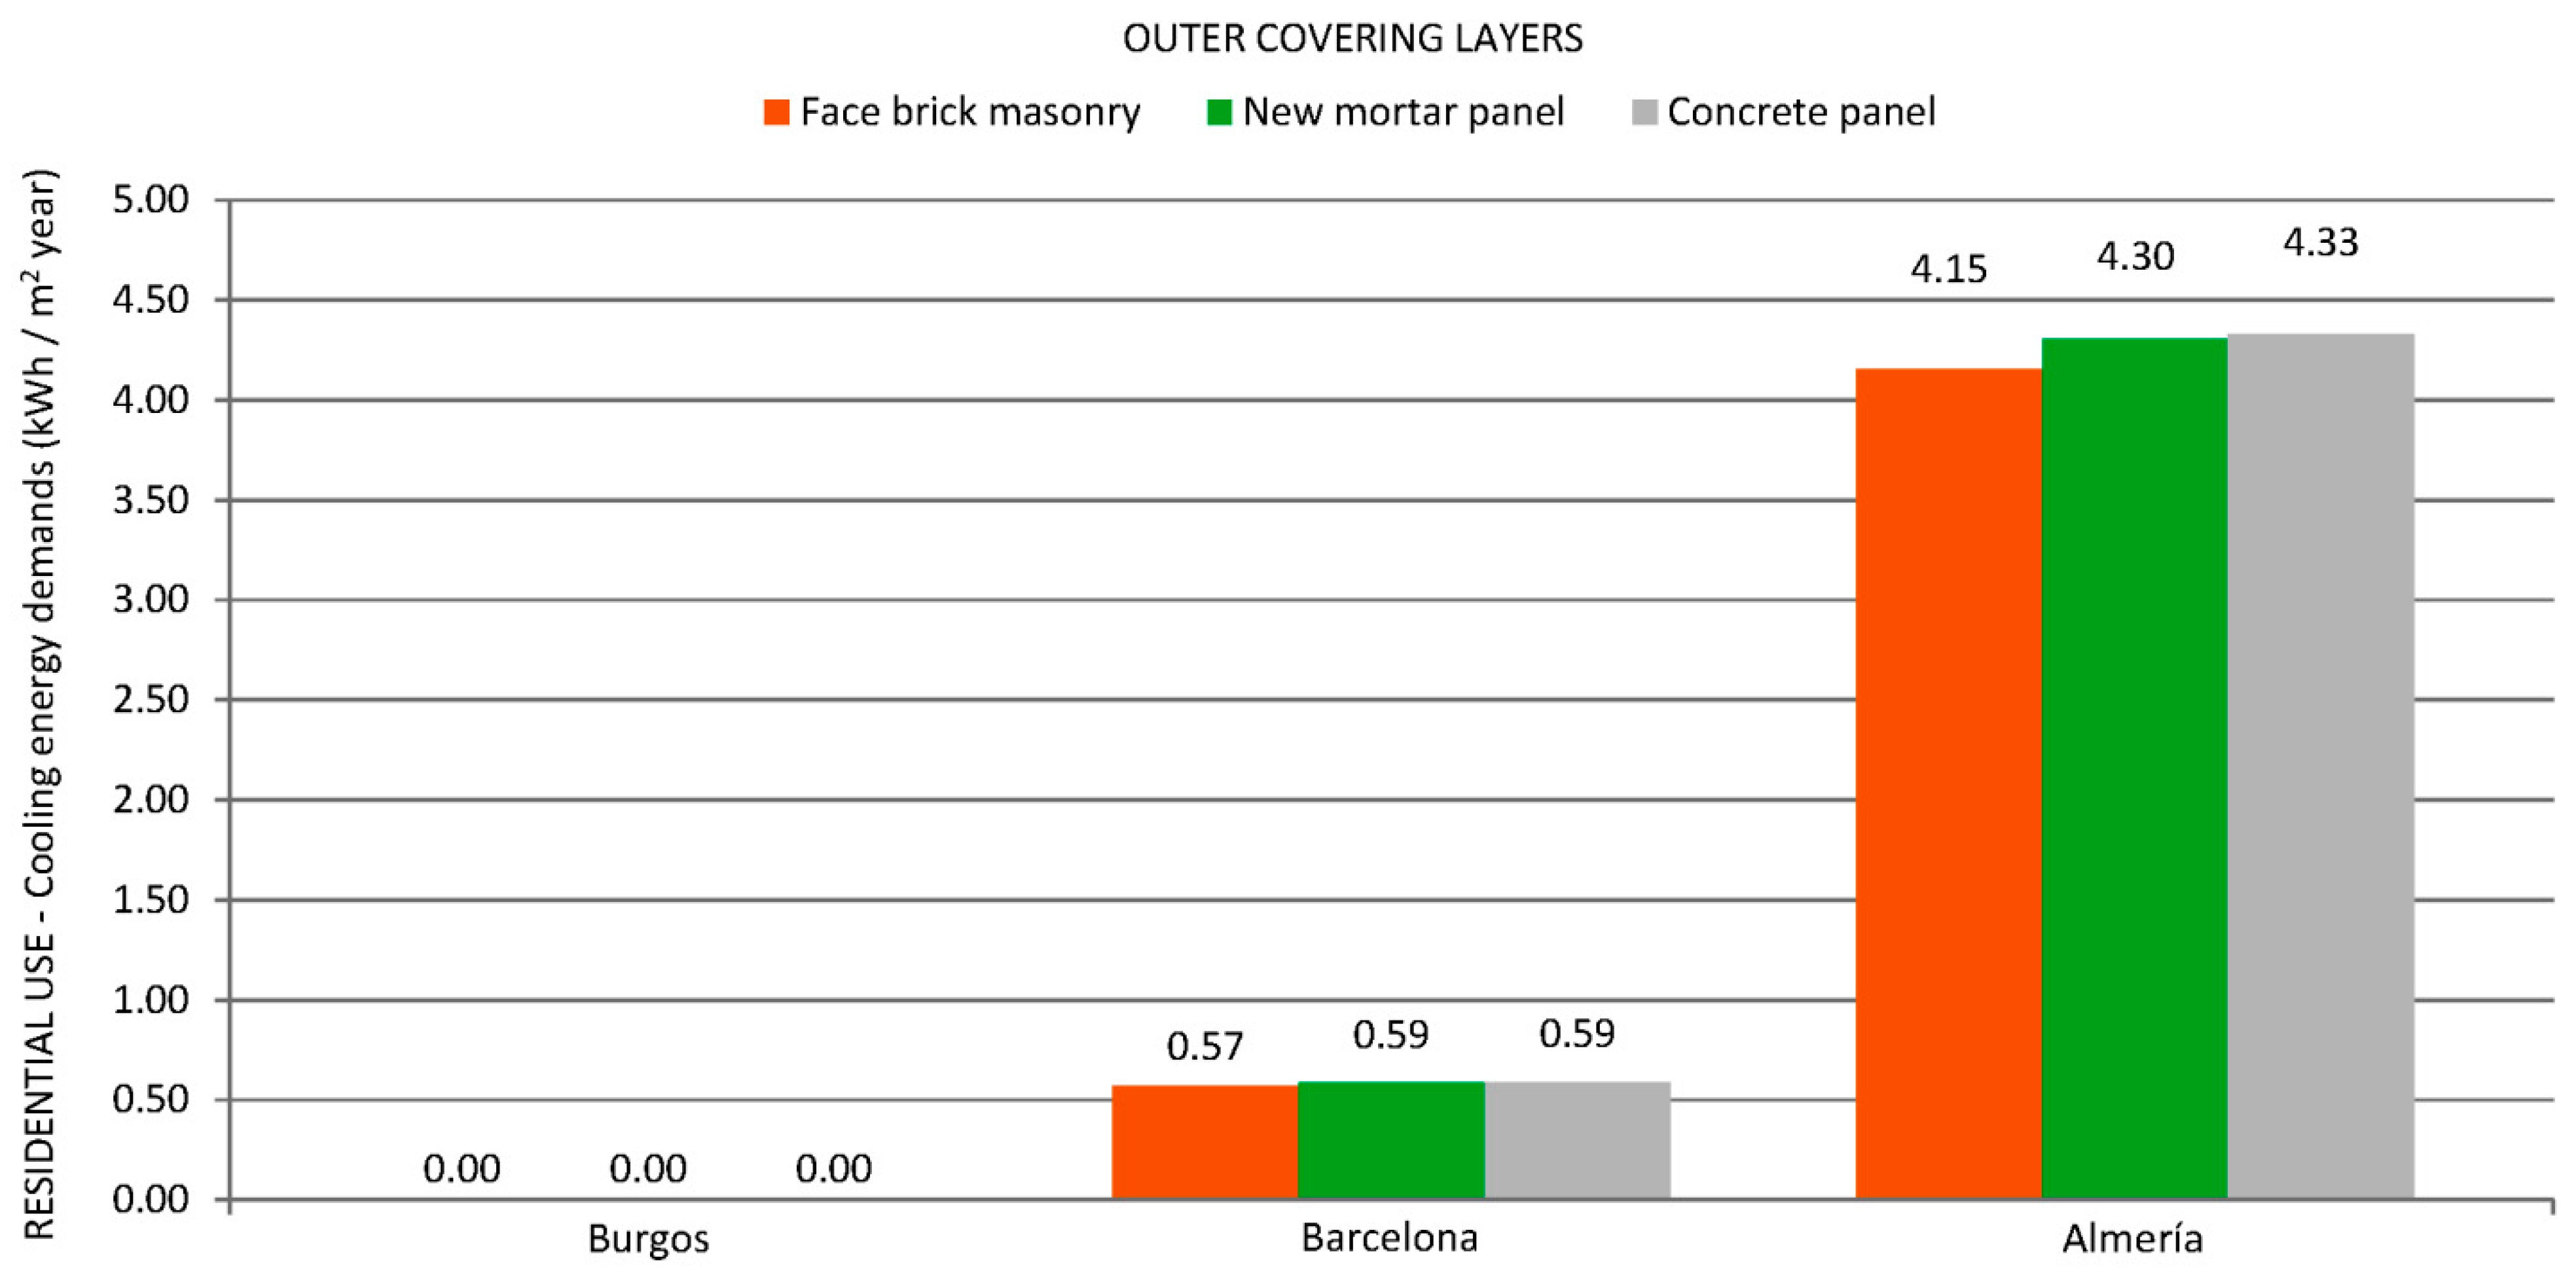
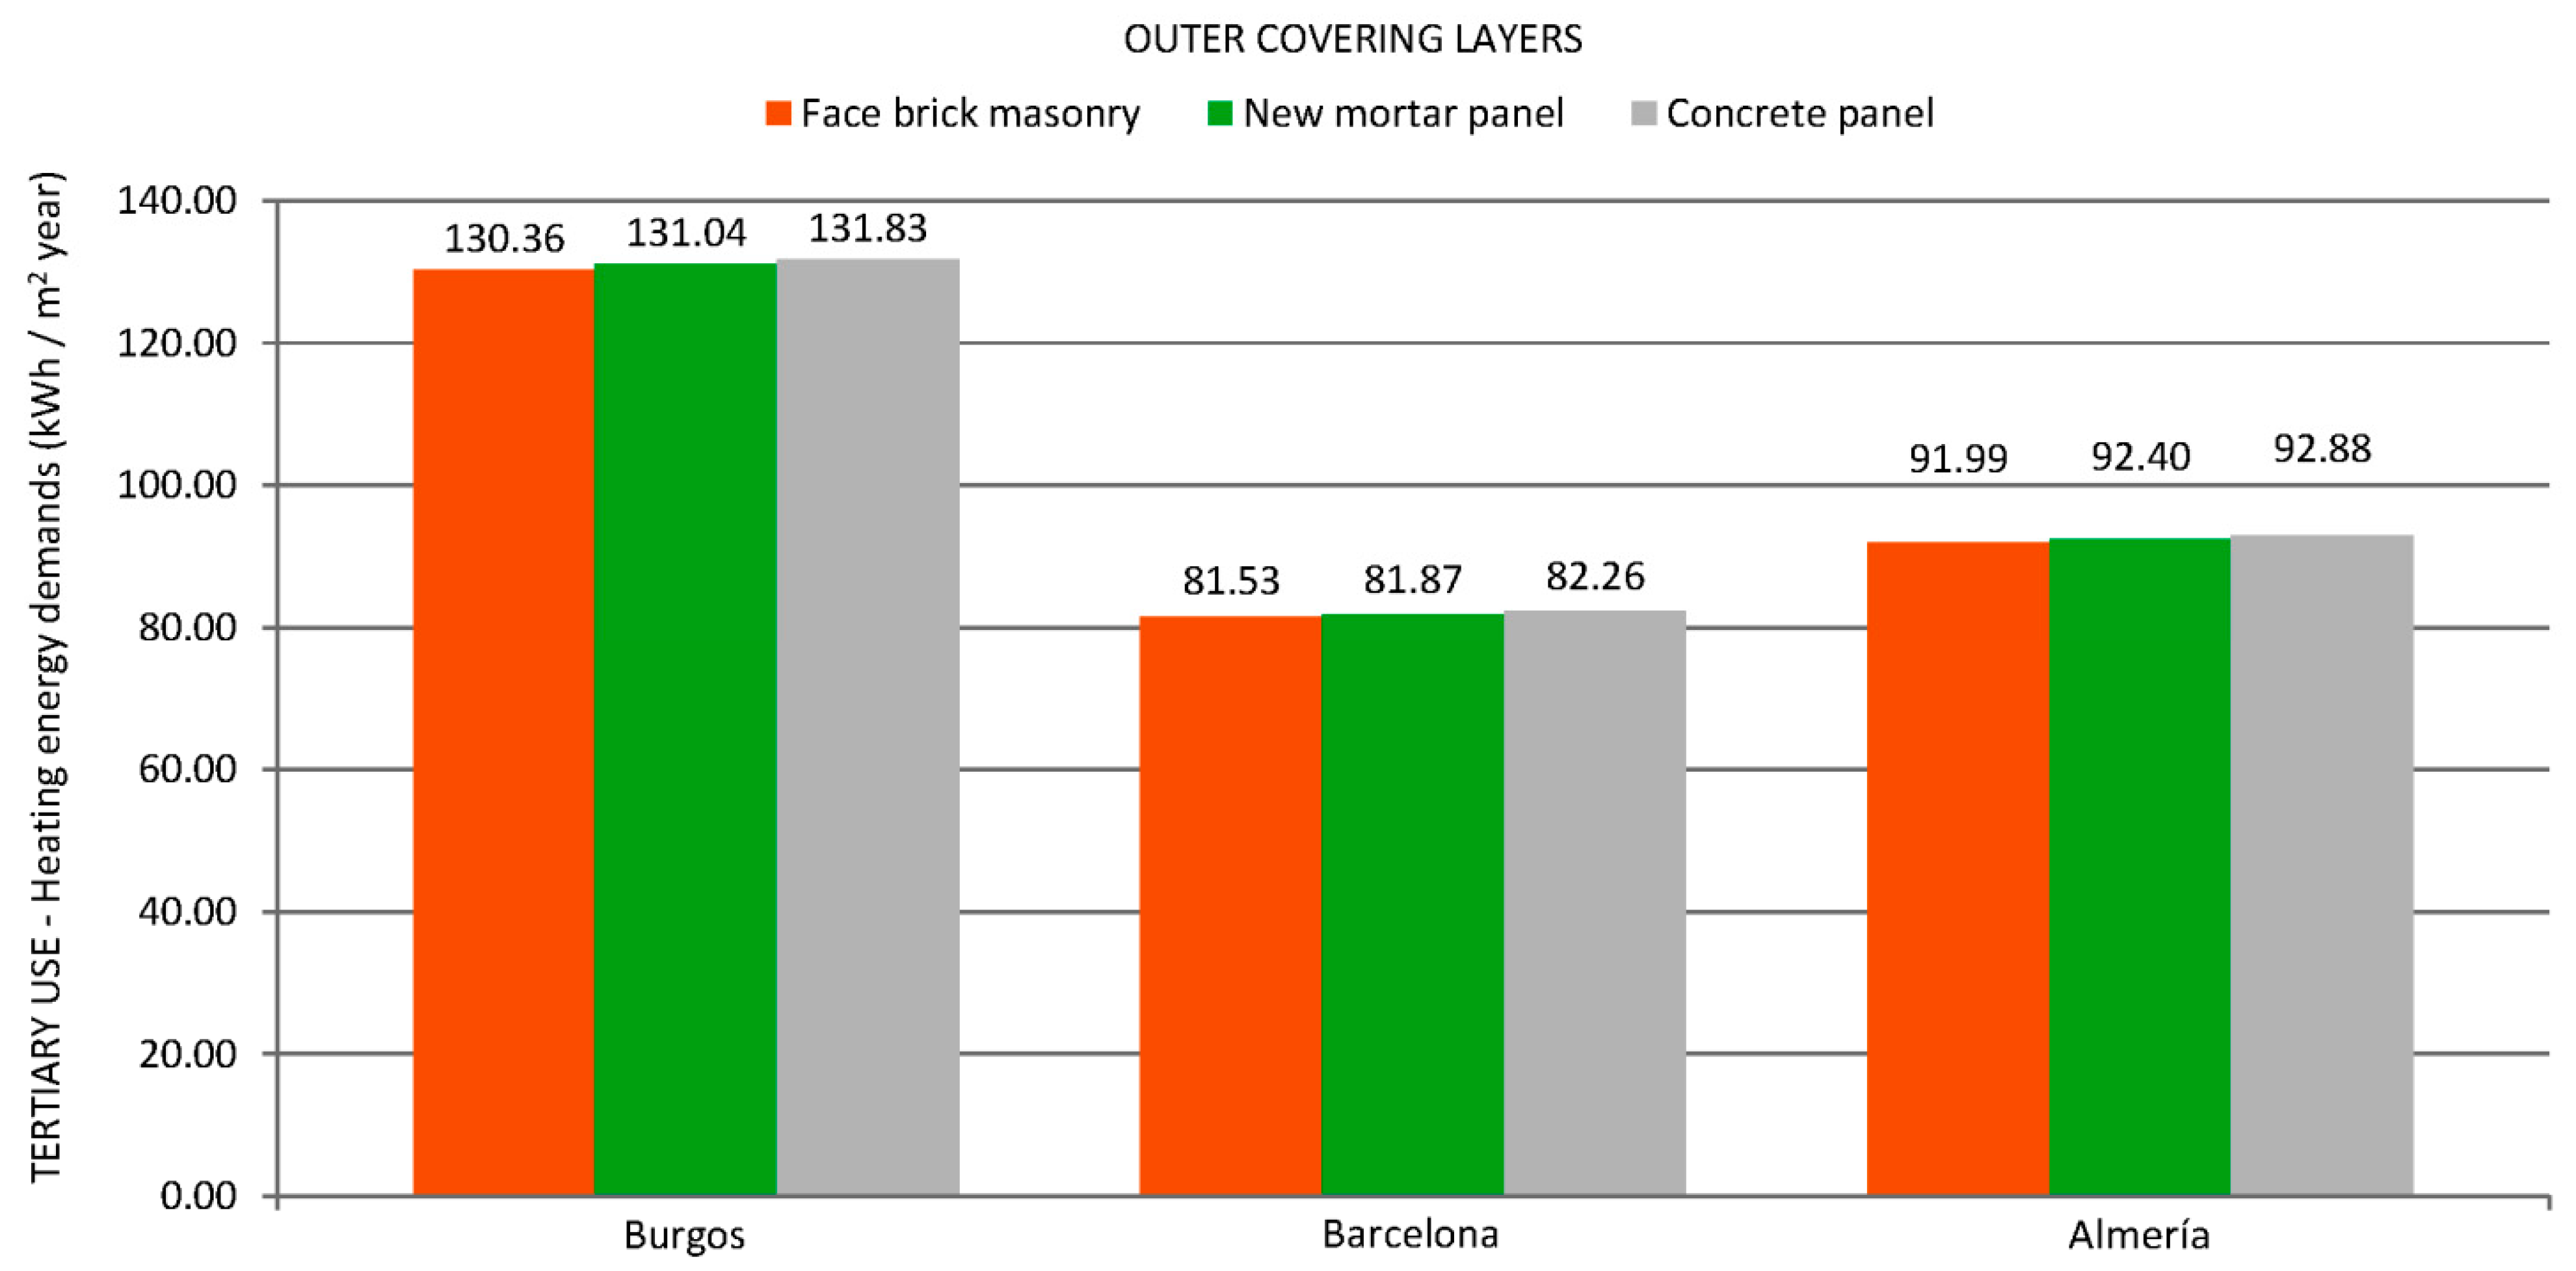
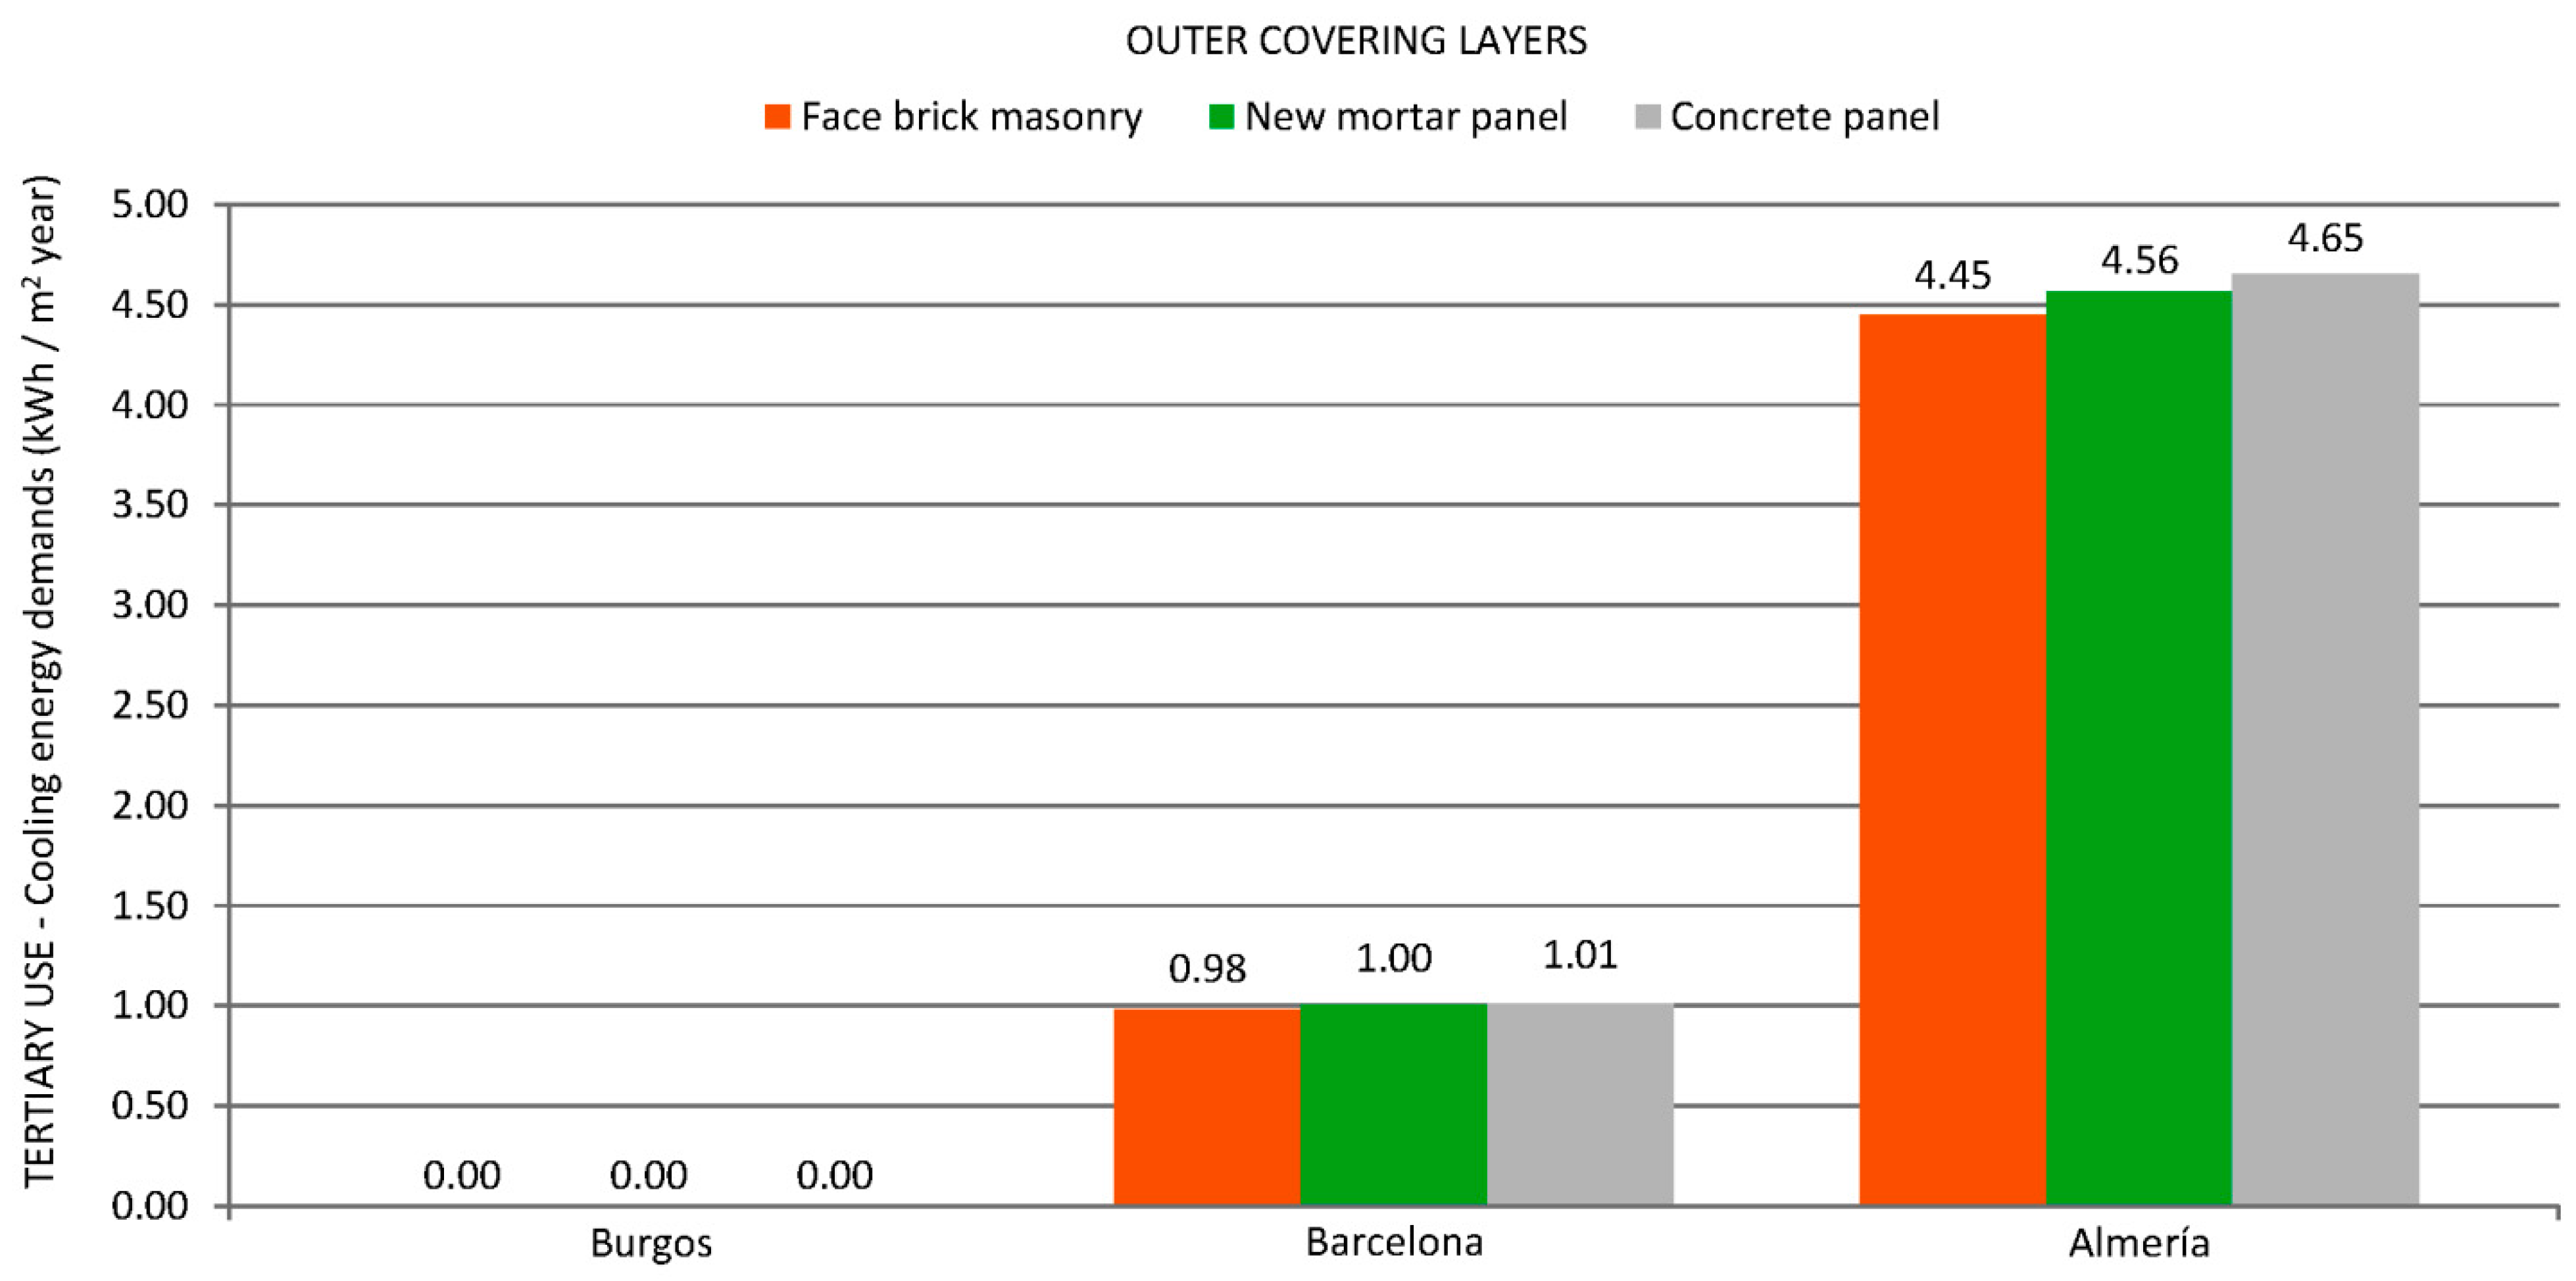
The results of the energy demands for the three cities with each of the three possible outer covering layers are shown in Figure 7, Figure 8, Figure 9 and Figure 10, for comparing the results. Figure 7 and Figure 8 correspond to the residential use, while Figure 9 and Figure 10 correspond to tertiary use. On the top of each bar of the diagrams, the exact value of each energy demand is shown, in kWh/(m2 year), in order to make both the understanding and the comparison easier.
It can be observed in these figures that the maximum heating energy demand and the minimum cooling energy demand are obtained by using the concrete panel as the outer covering layer, for both residential and tertiary use, and in all of the three cities where the building is located for this study. In contrast, the minimum heating energy demand and the maximum cooling energy demand is obtained using the face brick masonry as the outer covering layer. Using the new mortar panel, intermediate energy demands are obtained for heating and for cooling.
It means that the new proposed mortar panel shows thermal behavior in accordance with its thermal transmittance, as reported in Table 6, and can be considered an alternative to traditional materials to accomplish with the present building technical codes.
As expected, the influence of the user profile shows that the heating energy demands are always higher in residential use, and, in contrast, the cooling energy demands are always higher in tertiary use, due to the presence of internal gains. In a similar manner, the maximum heating demand corresponds to the location with the most severe winter conditions (Burgos, E1) while, in the opposite, the maximum cooling demand corresponds to the most severe summer conditions (Almería A4).

3.2. Temperature Profile of Inner Walls

A second step of this simulation study is to evaluate the transient inner surface temperature of the different external walls. Inner wall temperature is of the utmost importance when evaluating the radiation exchanges between walls and persons due to temperature differences. Thus, it will be possible to assess the influence of using each of the three outer covering layers proposed in this temperature, which is important for the comfort of the users of the building, and also for reducing the risk of surface condensations.
A set of 24 energy simulations have been developed by means of TRNSYS package, considering all the possible combinations of:
  • City location: Burgos or Almería, because they have the extreme values of low and high temperatures, respectively.
  • Building use: residential or tertiary.
  • Outer covering layers: face brick masonry, new mortar panel, or concrete panel.
  • Orientation of the two main façades: North and South, or East and West. For obtaining these last orientations, the building has been rotated 90° with TRNSYS.
The external walls of the two central spaces C and H of the second floor have been assessed for all the orientations: space C, pointed both to North and West, and space H, pointed both to South and East.
Yearly simulations have been carried out, obtaining 8760 hourly values for the inner surface temperature of the respective external wall in each case. Concerning the influence of the outer covering layers, there is no significant influence in the inner wall temperature, with independence of the building use, climate, or orientation. The maximum temperature difference among cases is 0.5 °C, which has a negligible influence on radiant or convective heat exchange inside the space.
Sixty-four cases have been simulated. In each case, the transient evolution of the inner surface temperature, concerning the three outer covering layers, has been assessed. In addition, they include both the influences of the two different climates and the two user profiles previously explained in Table 7, Table 8, Table 9, Table 10, Table 11 and Table 12.
Four representative working days have been selected to show below.
  • 02/February: the middle day of winter.
  • 04/May: the middle day of spring.
  • 06/August: the middle day of summer.
  • 06/November: the middle day of autumn.
Table 15 presents the minimum and maximum inner surface temperatures for residential and tertiary uses in Almería and Burgos, as obtained from the simulation. As expected, the influence of the respective climate location leads to higher wall minimum and maximum temperatures for Almería than for Burgos, for any building use and façade orientation, and in correspondence with the monthly average temperatures given in Table 14.
For both locations, and both residential and tertiary use, the minimum temperatures always correspond to the North façade and the maximum to the West one. Some daily profile temperatures are presented in Figure 11, Figure 12, Figure 13, Figure 14 and Figure 15.
Figure 11 shows the temperature profile for the selected middle day of winter, for residential use in Almería. The minimum inner surface temperature appears at 7 h, which is just before the dawn, reflecting the decrease of ambient temperature during the night. Between 7.00 h and 8 h, there occurs a slight increase in temperature due to the incoming daylight radiation. The heating schedule starts at 8 h and then the temperature of the inner wall increases, which reaches 19.50 °C by 23 h due to the heating and internal gain schedule, following the set point of 20 °C for ambient temperature. When changing to tertiary use (Figure 12), the minimum wall temperature also appears at 7 h in the middle of the day in autumn. The difference in the temperature profile with respect to the residential use (slope, pikes) is only due to the respective heating schedule. Since ambient temperature at 7 h would be lower than the set-point of 20.0 °C, the heating starts at 14 h, and then a local peak is reached at 15 h. The temperature decreases along two hours, since the heating schedule began again at 17 h until 20 h. The maximum temperature of 19.50 °C of the inner wall is reached at 21 h due to the thermal inertia of internal gains. As shown in the figures, no significant differences can be appreciated in the temperature profiles due to the change of the outer layers (face brick masonry, new mortar panel, or concrete panel).
When performing analysis for the minimum wall temperatures for the location in Burgos, the temperature profiles are very similar to the case of Almería, but the difference is that the minimum value appears in the summer for residential use (instead of the winter) and, in winter, for tertiary use (instead of autumn). Though it could be striking to find a minimum temperature in the summer, the results are coherent as, for residential use, no heating is active in the summer (Table 7) and the average temperatures of August in Burgos are not as high as in Almería (Table 14).
For the purpose of comparison with Almería (Figure 11), Figure 13 represents the temperature profile for the same winter day in Burgos, in residential use. The shape of the inner wall temperature for residential use exhibits the same pattern as the one of Almería, which reaches almost the same temperatures due to the activation of heating in both locations and the use of the same set point. Meanwhile, when looking at the summer conditions (Figure 14), the minimum temperature reached at 7 h is slightly lower than the one in winter, and the same occurs with the maximum temperature of the day (18.20 °C) due to the absence of heating.
When considering the tertiary use in Burgos, Figure 15 shows the corresponding temperature profile, in accordance with the schedule in Table 10, which presents the local peak at 15 h. In any case, due to climate differences, the temperature reached are always lower than those of Almería.
Further simulations varying the building use, the façade orientation, and the average day have been performed, with up to 64 cases. The differences in inner wall temperatures and daily temperature profiles present results similar to those analyzed in this scenario.
From the information summarized in Table 15 and Figure 9, Figure 10, Figure 11, Figure 12 and Figure 13, we can conclude that the new mortar panel made with recycled additives behaves at least as well as the traditional materials (concrete, brick masonry). Both approaches used, macro-analysis and micro-analysis on a yearly or daily basis, show no significant differences among the previously mentioned materials when evaluating the total energy demand of the building and some transient surface temperatures. From the point of view of sustainability, the new mortar panel provides great benefits in comparison to the two other traditional materials, because it contains rigid polyurethane foam and electric arc furnace slag obtained from industrial valued waste. The energy that would be used both for processing this waste and for making an equivalent volume of concrete or brick masonry is saved.

4. Conclusions

A new mortar has been designed for manufacturing panels for building façades, using rigid polyurethane foam and electric arc furnace slag obtained from industrial valued waste. Thus, both the waste and the raw material produced, and the energy used in both processes are reduced.
A systematic procedure has been developed based on the energy simulation of a sample building, in order to assess the influence of the use of the new mortar panel in comparison with the other two traditional materials, which take into account the user profile, the climatic conditions, and the outer covering layers. The objective was to test if the new mortar panel behaves at least as well as the traditional materials, from the point of view of the energy analysis. First, the evaluation of the influence of the new mortar panel in the energy demand of the whole building when compared to traditional materials has been performed. Second, a detailed analysis of the transient inner surface temperature of the space walls when using the new mortar panel has been carried out. When both approaches are combined, the total cumulated energy demand and transient surface temperatures, give us a true energy evaluation of the new material, when integrated in a building. Based on the results obtained both from the new mortar panel features and from the energy simulations performed, it follows that the thermal behavior of the mortar panel is, at least, equivalent to those of the other two materials, and even better in some aspects.

Author Contributions

R.B.-L., E.M., and A.R. Methodology, R.B.-L., E.M., and A.R. Software, R.B.-L. Formal analysis, V.C. and S.G.-G. Investigation, R.B.-L., V.C., and S.G.-G. Data curation, R.B.-L. and A.R. Writing—original draft preparation, review, and editing, R.B.-L. and E.M. Supervision, A.R.

Funding

This research received no external funding.

Acknowledgments

This work is part of the Doctoral Thesis of Raúl Briones-Llorente, and it has been funded by the Consejería de Educación de la Junta de Castilla y León (Spain) and co-funded by the Operational Programme European Social Fund.

Conflicts of Interest

The authors declare no conflict of interest.

References

  1. Krausmann, F.; Gingrich, S.; Eisenmenger, N.; Erb, K.-H.; Haberl, H.; Fischer-Kowalski, M. Growth in global materials use, GDP and population during the 20th century. Ecol. Econ. 2009, 68, 2696–2705. [Google Scholar] [CrossRef]
  2. Zheng, J.L.; Zhang, H.Z. Thermal performance study of self-thermal insulation & recycled concrete hollow block. Eng. Mech. 2015, 32, 51–56. [Google Scholar]
  3. Li, J.; Chen, W. Heat Transfer Dynamic Analyses for Recycled-Concrete Wall Combined with Expanded Polystyrene Template. Adv. Mater. Sci. Eng. 2018, 9692806. [Google Scholar] [CrossRef]
  4. Cuenca-Moyano, G.M.; Martín-Morales, M.; Bonoli, A.; Valverde-Palacios, I. Environmental assessment of masonry mortars made with natural and recycled aggregates. Int. J. Life Cycle Assess. 2019, 24, 191–210. [Google Scholar] [CrossRef]
  5. Cetiner, I.; Shea, A.D. Wood waste as an alternative thermal insulation for buildings. Energy Build. 2018, 168, 374–384. [Google Scholar] [CrossRef]
  6. Zhu, M.; Ji, R.; Li, Z.; Wang, H.; Liu, L.; Zhang, Z. Preparation of glass ceramic foams for thermal insulation applications from coal fly ash and waste glass. Constr. Build. Mater. 2016, 112, 398–405. [Google Scholar] [CrossRef]
  7. Moussa, T.; Maalouf, C.; Ingrao, C.; Scrucca, F.; Costantine, G.; Asdrubali, F. Bio-based and recycled-waste materials in buildings: A study of energy performance of hemp-lime concrete and recycled-polyethylene terephthalate façades for office facilities in France and Italy. Sci. Technol. Built Environ. 2018, 24, 492–501. [Google Scholar] [CrossRef]
  8. Patnaik, A.; Mvubu, M.; Muniyasamy, S.; Botha, A.; Anandjiwala, R.D. Thermal and sound insulation materials from waste wool and recycled polyester fibers and their biodegradation studies. Energy Build. 2015, 92, 161–169. [Google Scholar] [CrossRef]
  9. Foti, D.; Lerna, M.; Vacca, V. Experimental characterization of traditional mortars and polyurethane foams in masonry wall. Adv. Mater. Sci. Eng. 2018, 8640351. [Google Scholar] [CrossRef]
  10. Manalo, A. Structural behaviour of a prefabricated composite wall system made from rigid polyurethane foam and Magnesium Oxide board. Constr. Build. Mater. 2013, 41, 642–653. [Google Scholar] [CrossRef]
  11. Václavík, V.; Daxner, J.; Valícek, J.; Dvorský, T.; Kusnerová, M.; Harnicárová, M.; Bendová, M.; Brenek, A. The use of industrial waste as a secondary raw material in restoration plaster with thermal insulating effect. Adv. Mater. Res. 2014, 897, 204–214. [Google Scholar] [CrossRef]
  12. Crinaldesi, V.; Nardinocchi, A.; Jacopo, D. Lightweight aggregate mortars for sustainable and energy-efficient building. Adv. Mater. Res. 2014, 980, 142–146. [Google Scholar] [CrossRef]
  13. Gadea, J.; Rodríguez, A.; Campos, P.L.; Garabito, J.; Calderón, V. Lightweight mortar made with recycled polyurethane foam. Cem. Concr. Compos. 2010, 32, 672–677. [Google Scholar] [CrossRef]
  14. Junco, C.; Gadea, J.; Rodríguez, A.; Gutiérrez-González, S.; Calderón, V. Durability of lightweight masonry mortars made with white recycled polyurethane foam. Cem. Concr. Compos. 2012, 34, 1174–1179. [Google Scholar] [CrossRef]
  15. Junco, C.; Rodríguez, A.; Calderón, V.; Muñoz-Rupérez, C.; Gutiérrez-González, S. Fatigue durability test of mortars incorporating polyurethane foam wastes. Constr. Build. Mater. 2018, 190, 373–381. [Google Scholar] [CrossRef]
  16. Gutiérrez-González, S.; Gadea, J.; Rodríguez, A.; Junco, C.; Calderón, V. Lightweight plaster materials with enhanced thermal properties made with polyurethane foam waste. Constr. Build. Mater. 2012, 28, 653–658. [Google Scholar] [CrossRef]
  17. Rodríguez, A.; Manso, J.M.; Aragón, A.; González, J.J. Strength and workability of masonry mortars manufactured with ladle furnace slag. Resour. Conserv. Recycl. 2009, 53, 645–651. [Google Scholar] [CrossRef]
  18. Manso, J.M.; Rodríguez, A.; Aragón, A.; González, J.J. The durability of masonry mortars made with ladle furnace slag. Constr. Build. Mater. 2011, 25, 3508–3519. [Google Scholar] [CrossRef]
  19. Prieto, M.I.; Cobo, A.; Rodríguez, A.; Calderón, V. Corrosion behavior of reinforcement bars embedded in mortar specimens containing ladle furnace slag in partial substitution of aggregate and cement. Constr. Build. Mater. 2013, 38, 188–194. [Google Scholar] [CrossRef]
  20. Prieto, M.I.; Cobo, A.; Rodríguez, A.; González, M.N. The efficiency of surface-applied corrosion inhibitors as a method for the repassivation of corroded reinforcement bars embedded in ladle furnace slag mortars. Constr. Build. Mater. 2014, 54, 70–77. [Google Scholar] [CrossRef] [Green Version]
  21. Santamaría-Vicario, I.; Rodríguez, A.; Gutiérrez-González, S.; Calderón, V. Design of masonry mortars fabricated concurrently with different Steel slag aggregates. Constr. Build. Mater. 2015, 95, 197–206. [Google Scholar] [CrossRef]
  22. Santamaría-Vicario, I.; Rodríguez, A.; Junco, C.; Gutiérrez-González, S.; Calderón, V. Durability behavior of steelmaking slag masonry mortars. Mater. Des. 2016, 97, 307–315. [Google Scholar] [CrossRef]
  23. García-Cuadrado, J.; Rodríguez, A.; Cuesta, I.I.; Calderón, V.; Gutiérrez-González, S. Study and analysis by means of surface response to fracture behavior in lime-cement mortars fabricated with steelmaking slags. Constr. Build. Mater. 2017, 138, 204–213. [Google Scholar] [CrossRef]
  24. EN 197-1:2011: Cement—Part 1: Composition, Specifications and Conformity Criteria for Common Cements; European Committee for Standardization: Brussels, Belgium, 2011.
  25. EN 1015-10:2000: Methods of Test for Mortar for Masonry. Part 10: Determination of Dry Bulk Density of Hardened Mortar; European Committee for Standardization: Brussels, Belgium, 2000.
  26. EN 12664:2002: Thermal Performance of Building Materials and Products. Determination of Thermal Resistance by Means of Guarded Hot Plate and Heat Flow Meter Methods; Dry and Moist Products of Medium and Low Thermal Resistance; European Committee for Standardization: Brussels, Belgium, 2002.
  27. EN 1015-19:1999: Methods of Test for Mortar for Masonry. Part 19: Determination of Water Vapour Permeability of Hardened Rendering and Plastering Mortars; European Committee for Standardization: Brussels, Belgium, 1999.
  28. Serway, R.A.; Jewett, J.W. Physics for Scientists and Engineers, 6th ed.; Thomson: Scotland, UK, 2004. [Google Scholar]
  29. TRNSYS. Available online: http://www.trnsys.com/ (accessed on 8 May 2019).
  30. Código Técnico de la Edificación. Ministerio de Fomento.Gobierno de España. Available online: http://www.codigotecnico.org/ (accessed on 8 May 2019).
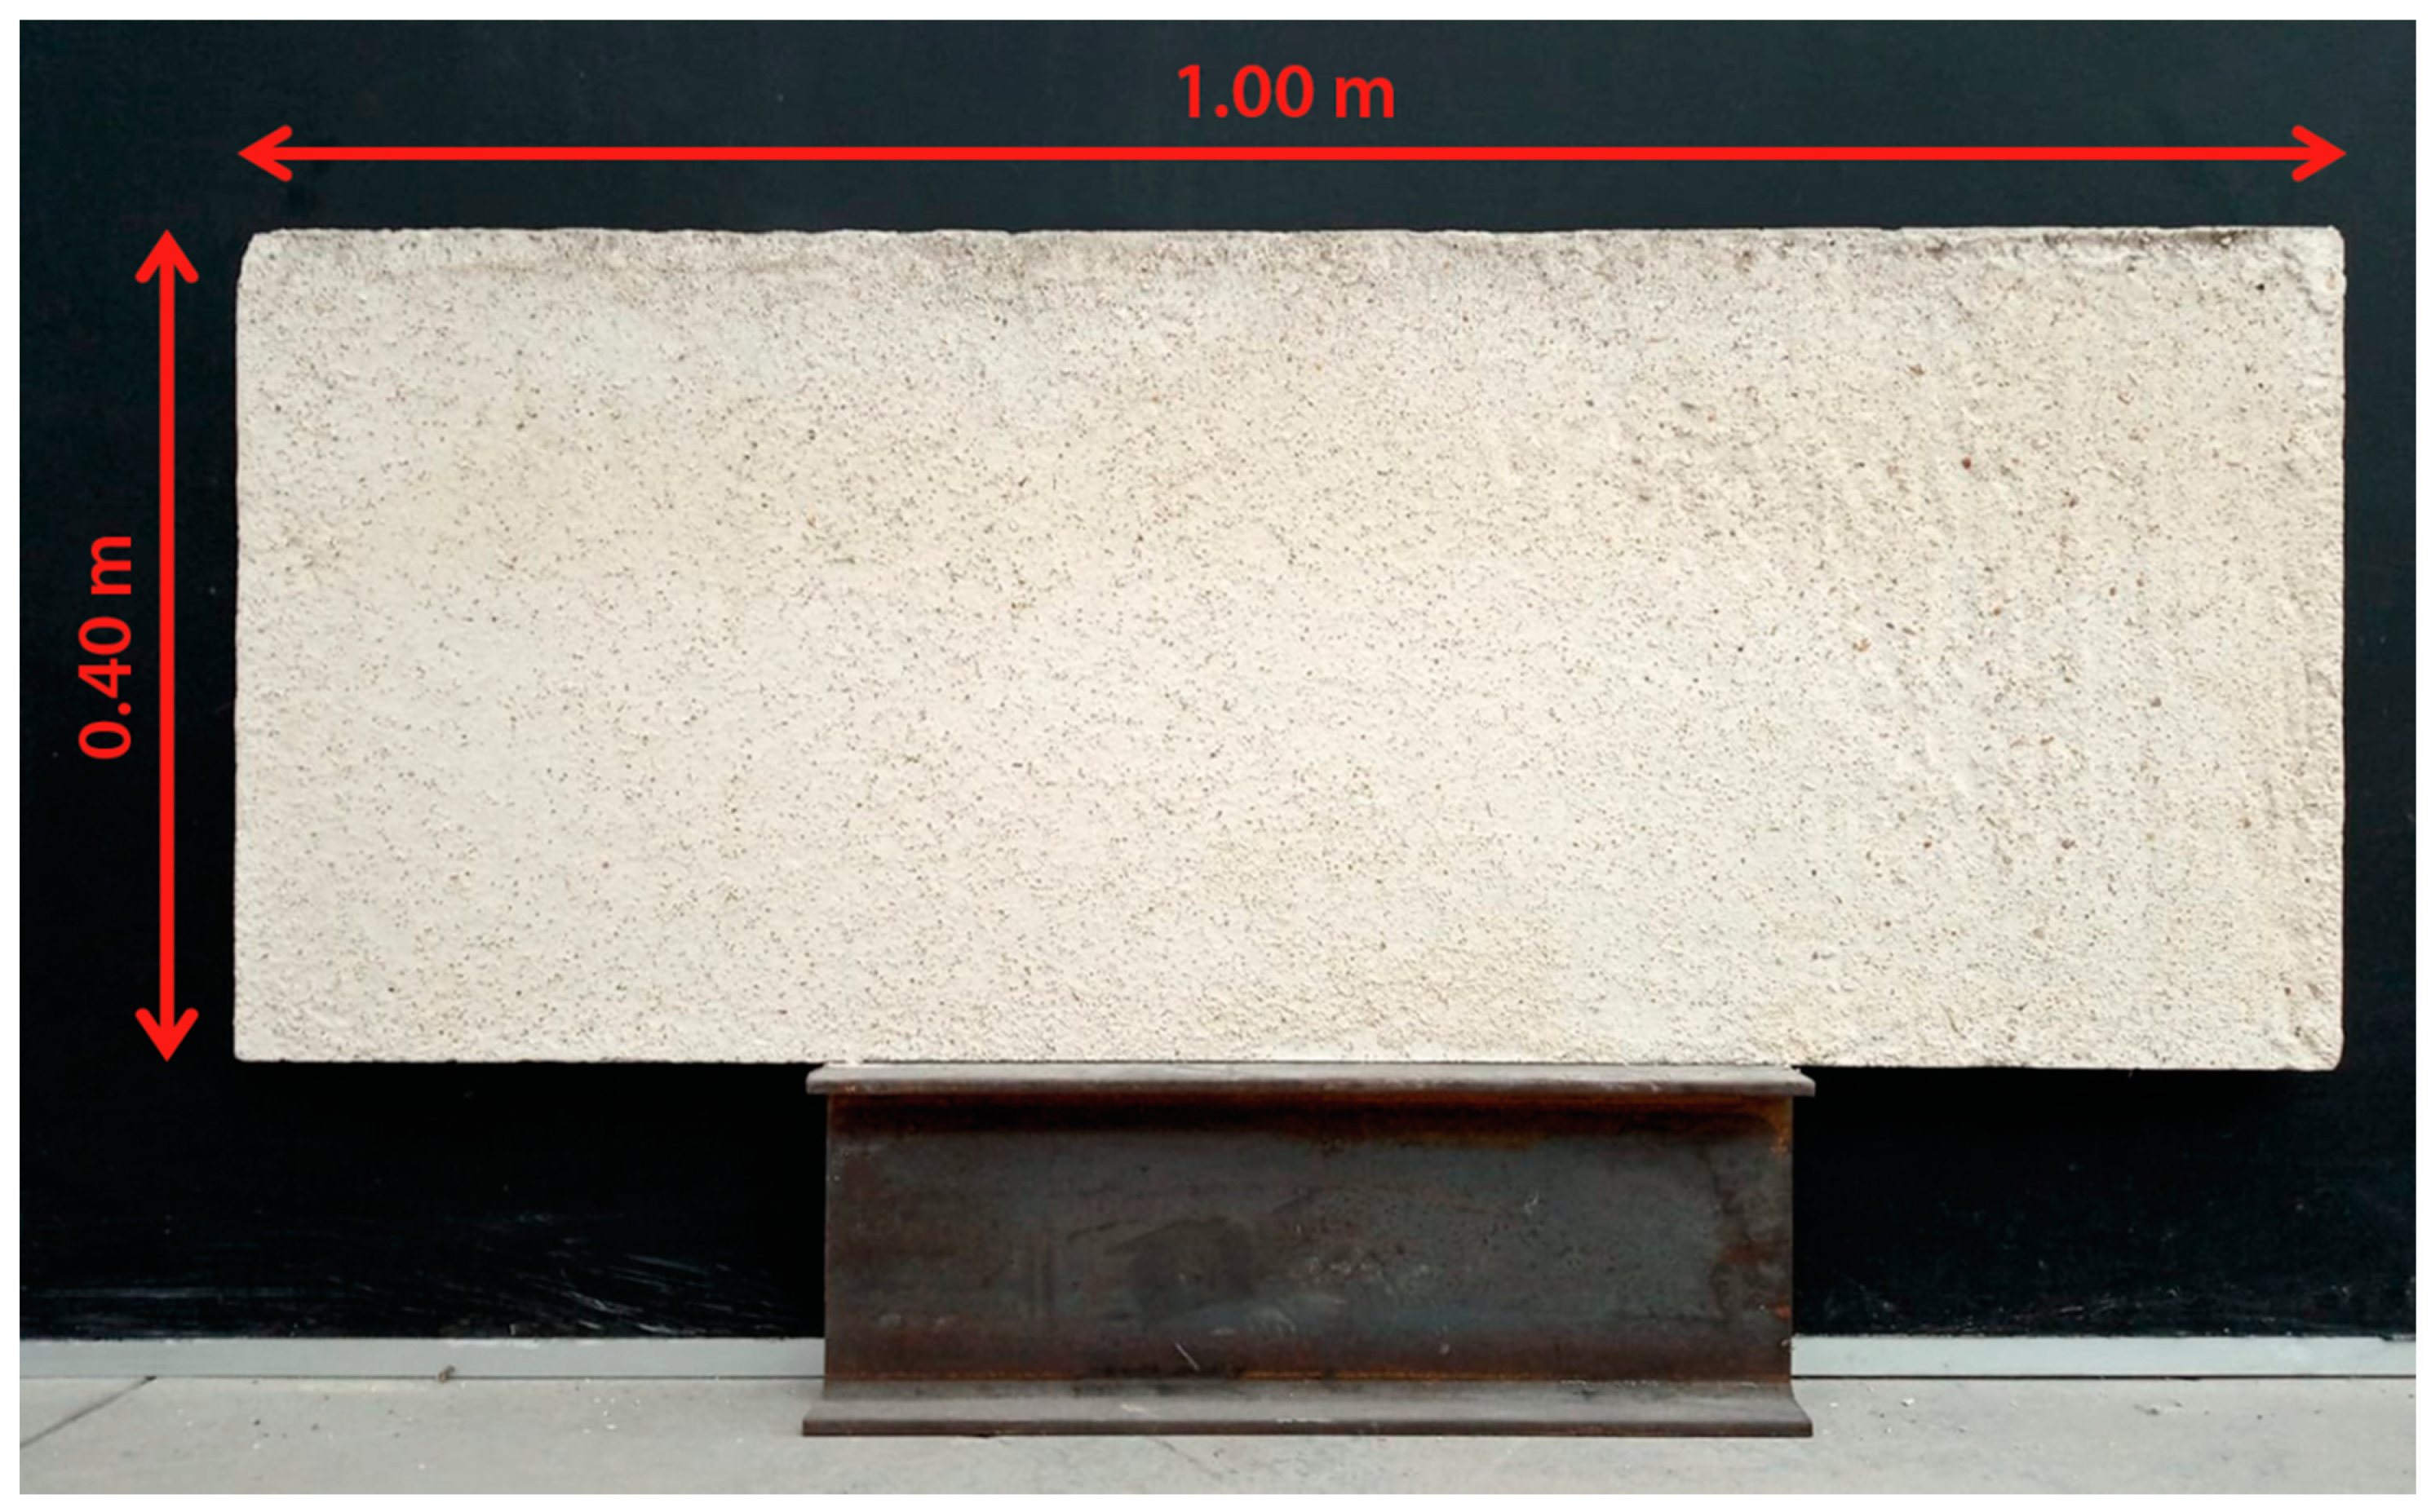
Figure 1. Prototype of the new mortar panel.
Sustainability 11 03117 g001
Figure 2. PFW (a) Ground polyurethane foam. (b) Cellular microstructure of rigid polyurethane, scale 400 μm.
Sustainability 11 03117 g002
Figure 3. Basement and first stories.
Sustainability 11 03117 g003
Figure 4. 3D building simulation.
Sustainability 11 03117 g004
Figure 5. Constructive sections of the façades. (a) Face brick masonry. (b) New mortar panel. (c) Concrete panel.
Sustainability 11 03117 g005
Figure 6. Climate conditions.
Sustainability 11 03117 g006
Figure 7. Residential use. Heating energy demands.
Sustainability 11 03117 g007
Figure 8. Residential use. Cooling energy demands.
Sustainability 11 03117 g008
Figure 9. Tertiary use. Heating energy demands.
Sustainability 11 03117 g009
Figure 10. Tertiary use. Cooling energy demands.
Sustainability 11 03117 g010
Figure 11. Almería. Residential use. North façade. Winter.
Sustainability 11 03117 g011
Figure 12. Almería. Tertiary use. North façade. Autumn.
Sustainability 11 03117 g012
Figure 13. Burgos. Residential use. North façade. Winter.
Sustainability 11 03117 g013
Figure 14. Burgos. Residential use. North façade. Summer.
Sustainability 11 03117 g014
Figure 15. Burgos. Tertiary use. North façade. Winter.
Sustainability 11 03117 g015
Table 1. Elemental analysis of polyurethane foam waste.
ElementCONHCaOthersTotal
Mass, %62.25.67.212.10.013.1100.0
Table 2. Chemical composition of Electric Arc Furnace Slag EAFS.
ValuesCaOSiO2Fe2O3Al2O3MgOCr2O3TiO2MnOP2O5OthersTotal
%25.7814.0834.358.547.731.550.520.830.436.19100.00
Table 3. Quantities of each of the raw materials for a mortar mix.
WeightCementN. AggregatesEAFSPFWWater
g600670448129940
Table 4. New mortar panel.
Materialt, mλ, W/m × KCp, J/kg × Kδ, kg/m3μ, dimensionless
Mortar panel0.1150.980969.0001,150.00011.450
Table 5. Geometrical and thermophysical properties of the façades.
Materialt, mλ, W/(m K)Cp, J/(kg K)δ, kg/m3Rn, (m2 K)/W
Gypsum plaster0.0150.4001000.000900.000---
Hollow brick masonry0.0900.4321000.000930.000---
Thickness of insulation in decreasing order, for the cities of Burgos, Barcelona, and Almería
MW isolation (Burgos)0.0400.0311000.00040.000---
MW isolation (Barcelona)0.0300.0311000.00040.000---
MW isolation (Almería)0.0100.0311000.00040.000---
Closed joints ventilated air chamber0.050---------0.090
Three different outer covering layers
Face brick masonry0.1150.6671000.0001140.000---
New mortar panel0.1150.980969.0001150.000---
Concrete panel0.1152.3002400.0001000.000---
Table 6. Thermal transmittance of the façades U [W/(m2 K)].
CityOuter Covering Layer
Face Brick MasonryNew Mortar PanelConcrete Panel
Burgos0.5090.5240.543
Barcelona0.6090.6300.658
Almería1.0001.0591.140
Table 7. Set point temperatures and mechanical ventilation in residential use.
Days of the YearSchedule—Set Point Heating Temperature (low)T, °C
Every day in January to May0h00–7h0017.00
8h00–23h0020.00
Every day in June to September0h00–23h00---
Every day in October to December0h00–7h0017.00
8h00–23h0020.00
Days of the YearSchedule—Set Point Cooling Temperature (High)T, °C
Every day in January to May0h00–23h00---
Every day in June to September0h00–7h0027.00
8h00–15h00---
16h00–23h0025.00
Every day in October to December0h00–23h00---
Days of the YearSchedule—Mechanical Ventilationren/h
Every day in Summer1h00–8h004.00
9h00–0h000.63
Every day in Winter0h00–23h000.63
Table 8. Internal gains in residential use.
Due toDays of the WeekScheduleW/m2
Sensible occupationWorking days0h00–7h002.15
8h00–15h000.54
16h00–23h001.08
Sundays and Holidays0h00–23h002.15
Latent occupationWorking days0h00–7h001.36
8h00–15h000.34
16h00–23h000.68
Sundays and Holidays0h00–23h001.36
LightingEveryday0h002.20
1h00–7h000.44
8h00–18h001.32
19h002.20
20h00–23h004.40
EquipmentEveryday0h002.20
1h00–7h000.44
8h00–18h001.32
19h002.20
20h00–23h004.40
Table 9. Total internal gains in residential use.
Hours0h001h00–7h008h00–15h0016h00–19h0020h00–23h00
W/m27.914.393.524.8410.56
Table 10. Set point temperatures and mechanical ventilation in tertiary use.
Days of the YearSchedule—Set Point Heating Temperature (low)T, °C
Working days and Saturdays0h00–6h00, 15h00–16h00 and 21h00–23h00---
7h00–14h00 and 17h00–20h0020.00
Sundays and Holidays0h00–23h00---
Days of the WeekSchedule—Set Point Cooling Temperature (High)T, °C
Working days and Saturdays0h00–6h00, 15h00–16h00 and 21h00–23h00---
7h00–14h00 and 17h00–20h0025.00
Sundays and Holidays0h00–23h00---
Days of the WeekSchedule—Mechanical Ventilationren/h
Working days0h00–6h00, 15h00–16h00 and 21h00–23h00---
7h00–14h00 and 17h00–20h000.80
Saturdays0h00–6h00 and 15h00–23h00---
7h00–14h000.80
Sundays and holidays0h00–23h00---
Table 11. Internal gains in tertiary use.
Due toDays of the WeekScheduleW/m2
Sensible occupationWorking days0h00–6h00, 15h00–16h00 and 21h00–23h00---
7h00–14h00 and 17h00–20h006.00
Saturdays0h00–6h00 and 15h00–23h00---
7h00–14h006.00
Sundays and holidays0h00–23h00---
Latent occupationWorking days0h00–6h00, 15h00–16h00 and 21h00–23h00---
7h00–14h00 and 17h00–20h003.79
Saturdays0h00–6h00 and 15h00–24h00---
7h00–14h003.79
Sundays and holidays0h00–23h00---
LightingWorking days0h00–6h00, 15h00–16h00 and 21h00–23h00---
7h00–14h00 and 17h00–20h006.25
Saturdays0h00–6h00 and 15h00–23h00---
7h00–14h006.25
Sundays and holidays0h00–23h00---
EquipmentWorking days0h00–6h00, 15h00–16h00 and 21h00–23h00---
7h00–14h00 and 17h00–20h004.50
Saturdays0h00–6h00 and 15h00–23h00---
7h00–14h004.50
Sundays and holidays0h00–23h00---
Table 12. Total internal gains in residential use.
Hours0h00–6h007h00–14h0015h00–16h0017h00–20h0021h00–23h00
W/m20.0020.540.0020.540.00
Table 13. Selected locations for the respective climatic zone.
CityClimatic ZoneLongitudeLatitudeHeight Above the Sea Level, m
BurgosE142°21′ N3°42′ O856
BarcelonaC241°23′ N2°11′ E13
AlmeríaA436°50′ N2°27′ O27
Table 14. Monthly average air temperature of the selected locations.
CityClimateMonthly Average Air Temperature, °C
JanFebMarAprMayJunJulAugSepOctNovDec
BurgosE13.14.17.08.612.216.519.519.516.111.56.63.9
BarcelonaC29.29.911.813.716.920.923.924.421.717.813.010.0
AlmeríaA412.613.315.117.019.723.526.126.724.220.416.413.8
Table 15. Simulation of temperatures with respect to the use of three outer covering layers. Results of minimum and maximum inner surface temperatures for residential and tertiary uses in Almería and Burgos.
CityUseFaçadeSeasonHourMinimum, °CMaximum, °C
AlmeríaResidentialNorthWinter7Concrete panel: 17.75
Face brick masonry: 17.85
New mortar panel: 17.77
---
WestSummer1---Concrete panel: 25.61
Face brick masonry: 25.52
New mortar panel: 25.57
TertiaryNorthAutumn7Concrete panel: 17.47
Face brick masonry: 17.57
New mortar panel: 17.48
---
WestSummer1---Concrete panel: 26.06
Face brick masonry: 25.96
New mortar panel: 26.04
BurgosResidentialNorthSummer8Concrete panel: 16.71
Face brick masonry: 16.69
New mortar panel: 16.67
---
WestSpring19---Concrete panel: 20.36
Face brick masonry: 20.38
New mortar panel: 20.43
TertiaryNorthWinter7Concrete panel: 16.94
Face brick masonry: 17.01
New mortar panel: 16.96
---
WestSummer20---Concrete panel: 21.90
Face brick masonry: 21.91
New mortar panel: 21.98