A System of Shared Autonomous Vehicles Combined with Park-And-Ride in Residential Areas


Abstract
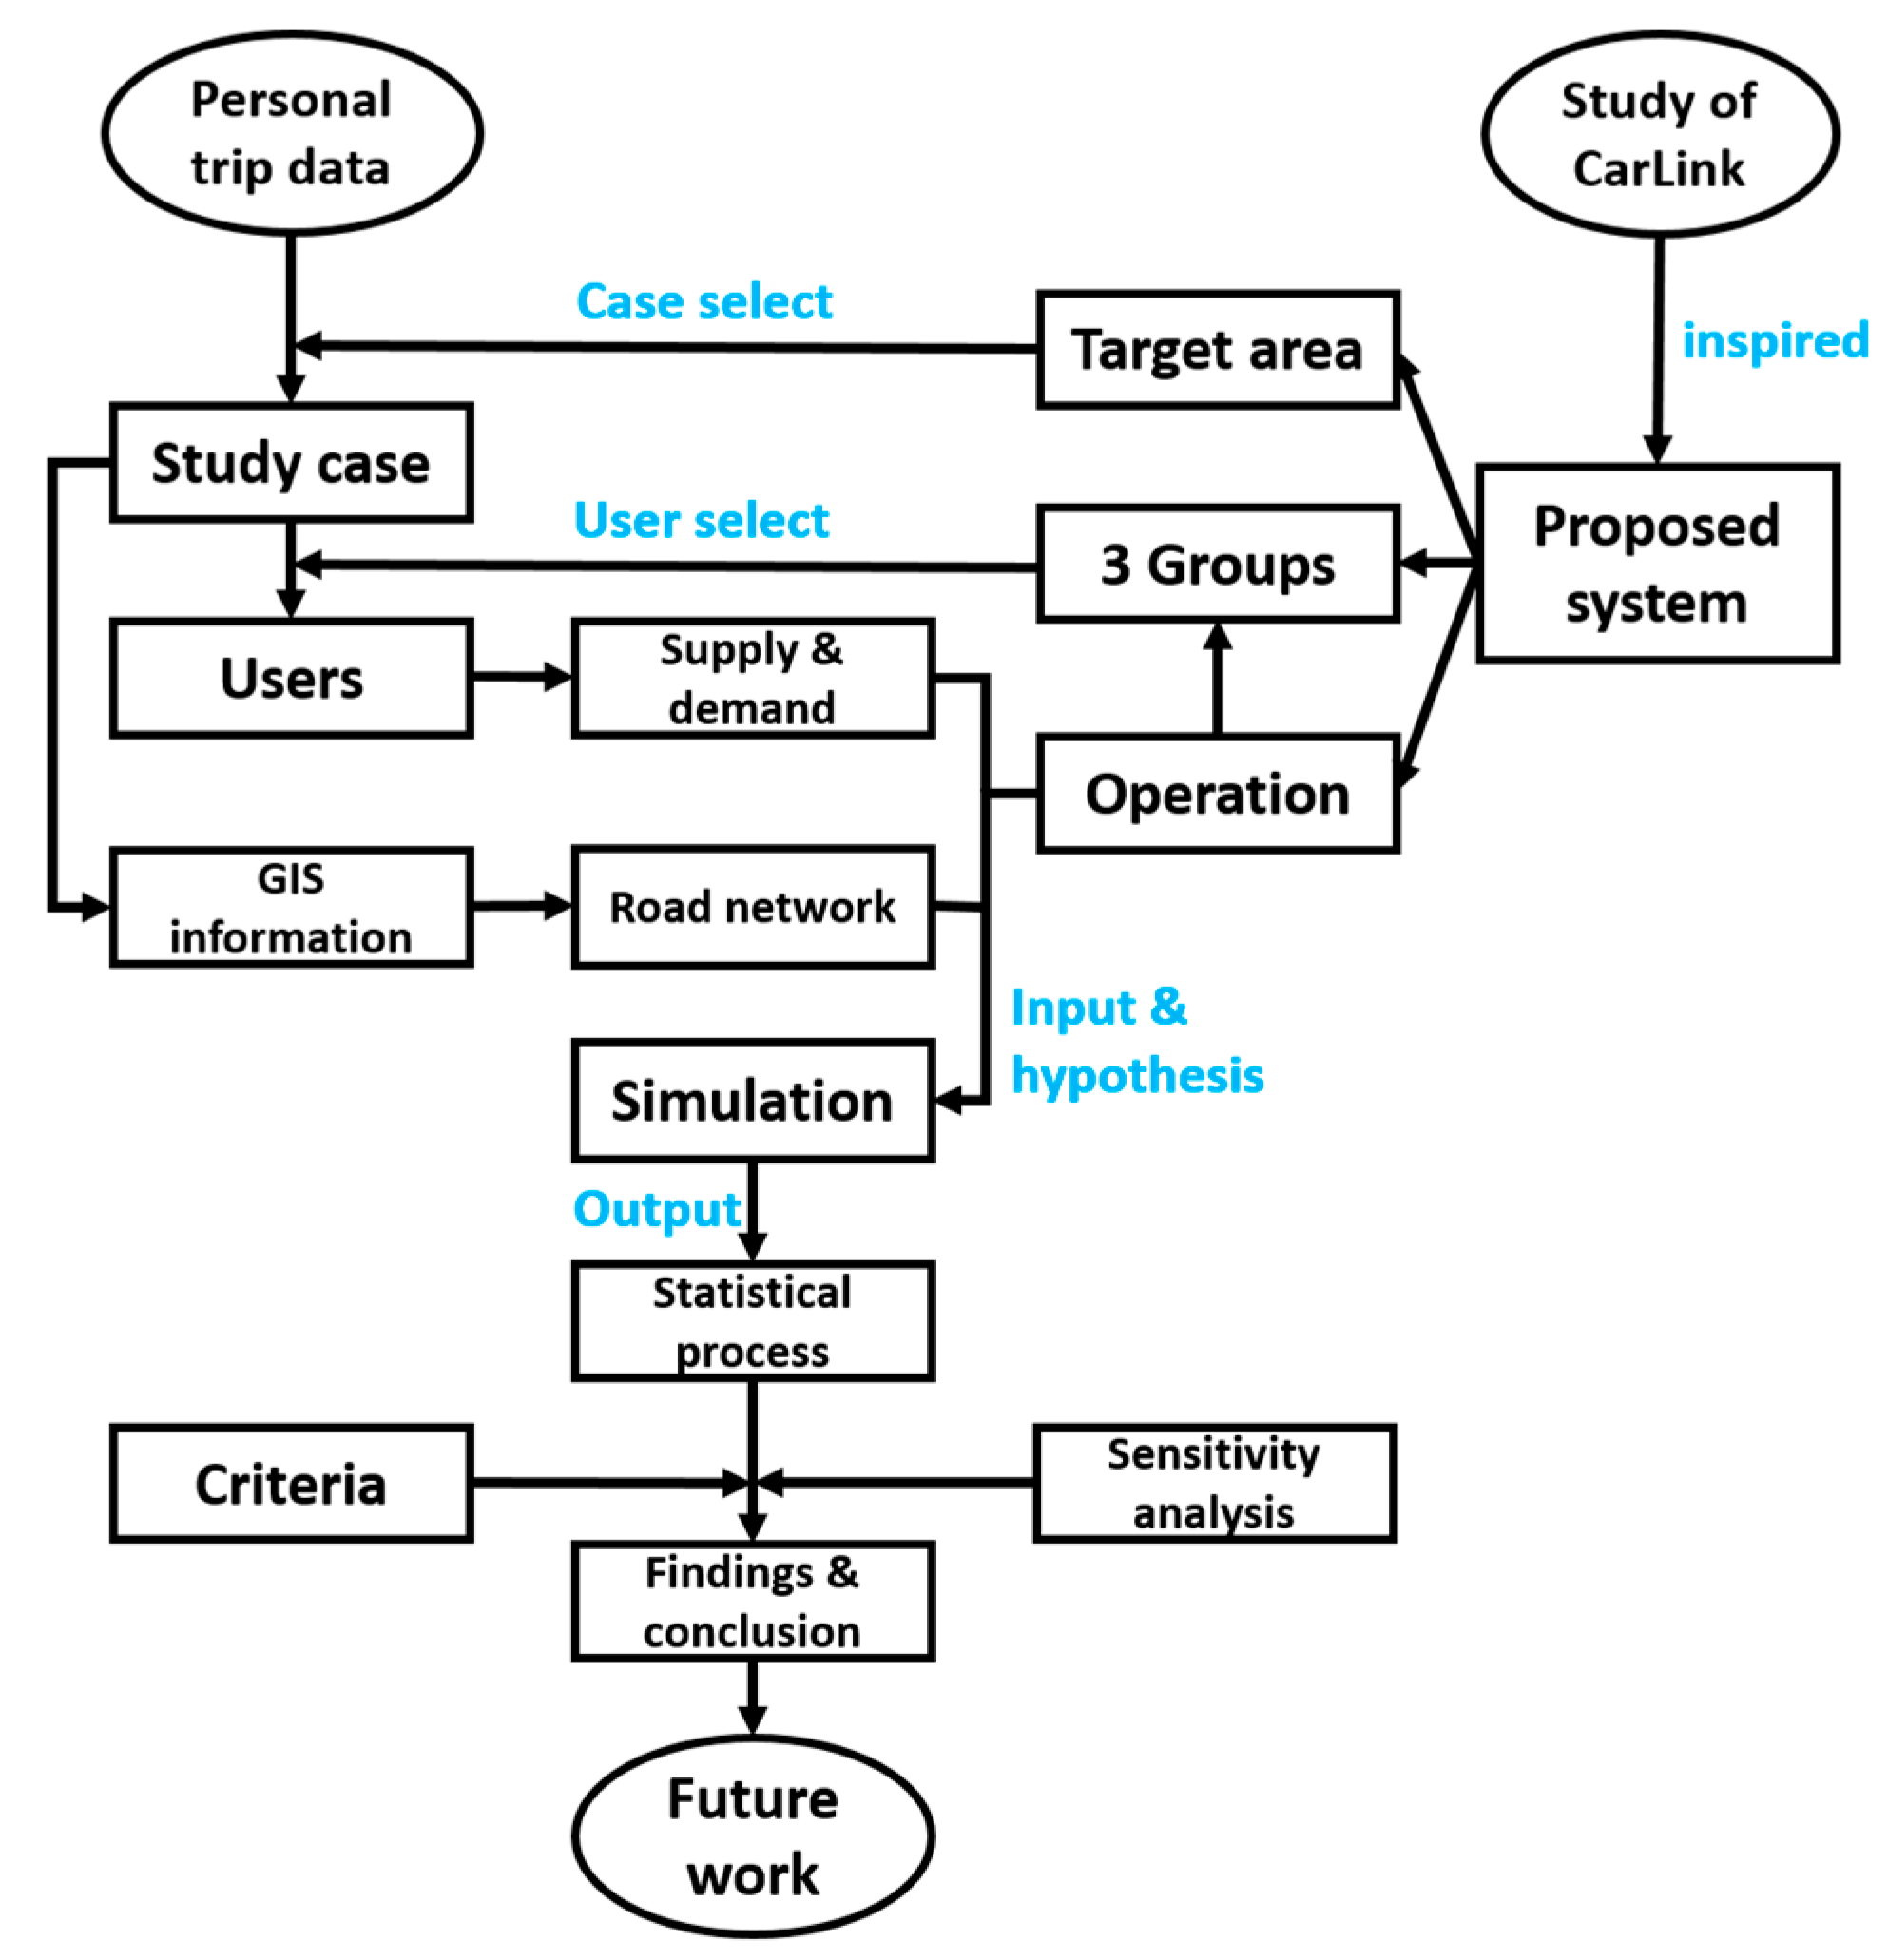
:1. Introduction
- To envision and analyze an AV-based public-transport combined shared system for suburban residential areas;
- To verify the effectiveness of the conceived system for suburban users in terms of the level of service (LOS) and system efficiency, as indicated by the minimum fleet size, wait times, etc.
2. System and Cases
2.1. System Design
- P&R commuters: These individuals use AVs between their origins and transfer station(s) on their morning and evening commutes, while using the train for the remaining portion of their commute. These users store the AVs at their origins in the evenings.
- Inbound commuters: These individuals debark from trains and transfer to the shared-use AVs previously deposited at the station by the P&R commuters. They then take the AVs to their workplaces in the target area.
- Elderly and disabled residents: These users are collected from their origins by a shared-use AV deposited earlier by a P&R commuter. The AV is then utilized until the elderly or disabled residents arrive at their destinations within the target area.
2.1.1. Fundamental Elements
- Target area: The area selected for analysis in a case study, typically a suburban region with a certain number of residents and at least one public station;
- Key transit station(s): The transfer public transport station(s) of a study case, usually a railway station within the target area;
- User: The service object of the AV system, who shares usage of the fleet under the given circumstances; users are typically categorized as commuters or the elderly:
- Commuter: Those who make trips as commutes with several purposes, i.e., attending their workplace/school, returning to their workplace/school, and returning home;
- The elderly and disabled: This category includes two kinds of people: residents in the target area with mobility difficulties and those aged over 70. Users with mobility difficulties may include the visually handicapped, hearing impaired, and some senior citizens.
2.1.2. Group Features
2.1.3. System Operation
- The AVs in the P&R-based system belong to a non-profit organization, are identical, and have no charging or maintenance needs during the daytime. Moreover, each vehicle accommodates only one passenger at a time, although they are shared among all users.
- In the evening peak hours, the same number of P&R commuters reverse their morning commuting trips by transferring at the same stations and returning to their origins. Furthermore, the same number of fleet vehicles are stored at these users’ origins (usually their homes).
2.1.4. Data
- P&R commuters: The residential-location (the middle and small zones for the Meito and Kozoji Newtown cases, respectively), origin, and destination distributions were obtained, along with the arrival distribution in the morning commuting period and details of the access mode sharing.
- Inbound commuters: Almost identical data to those for the P&R commuters were collected; however, as the destinations were fixed within the target area, the destination distribution was not required. Further, as these commuters debark trains at the key transit station(s), the access mode sharing data were replaced with egress mode sharing data.
- Elderly and disabled residents: The departure distributions by time of day and the number of persons and families were determined.
2.2. Study Case
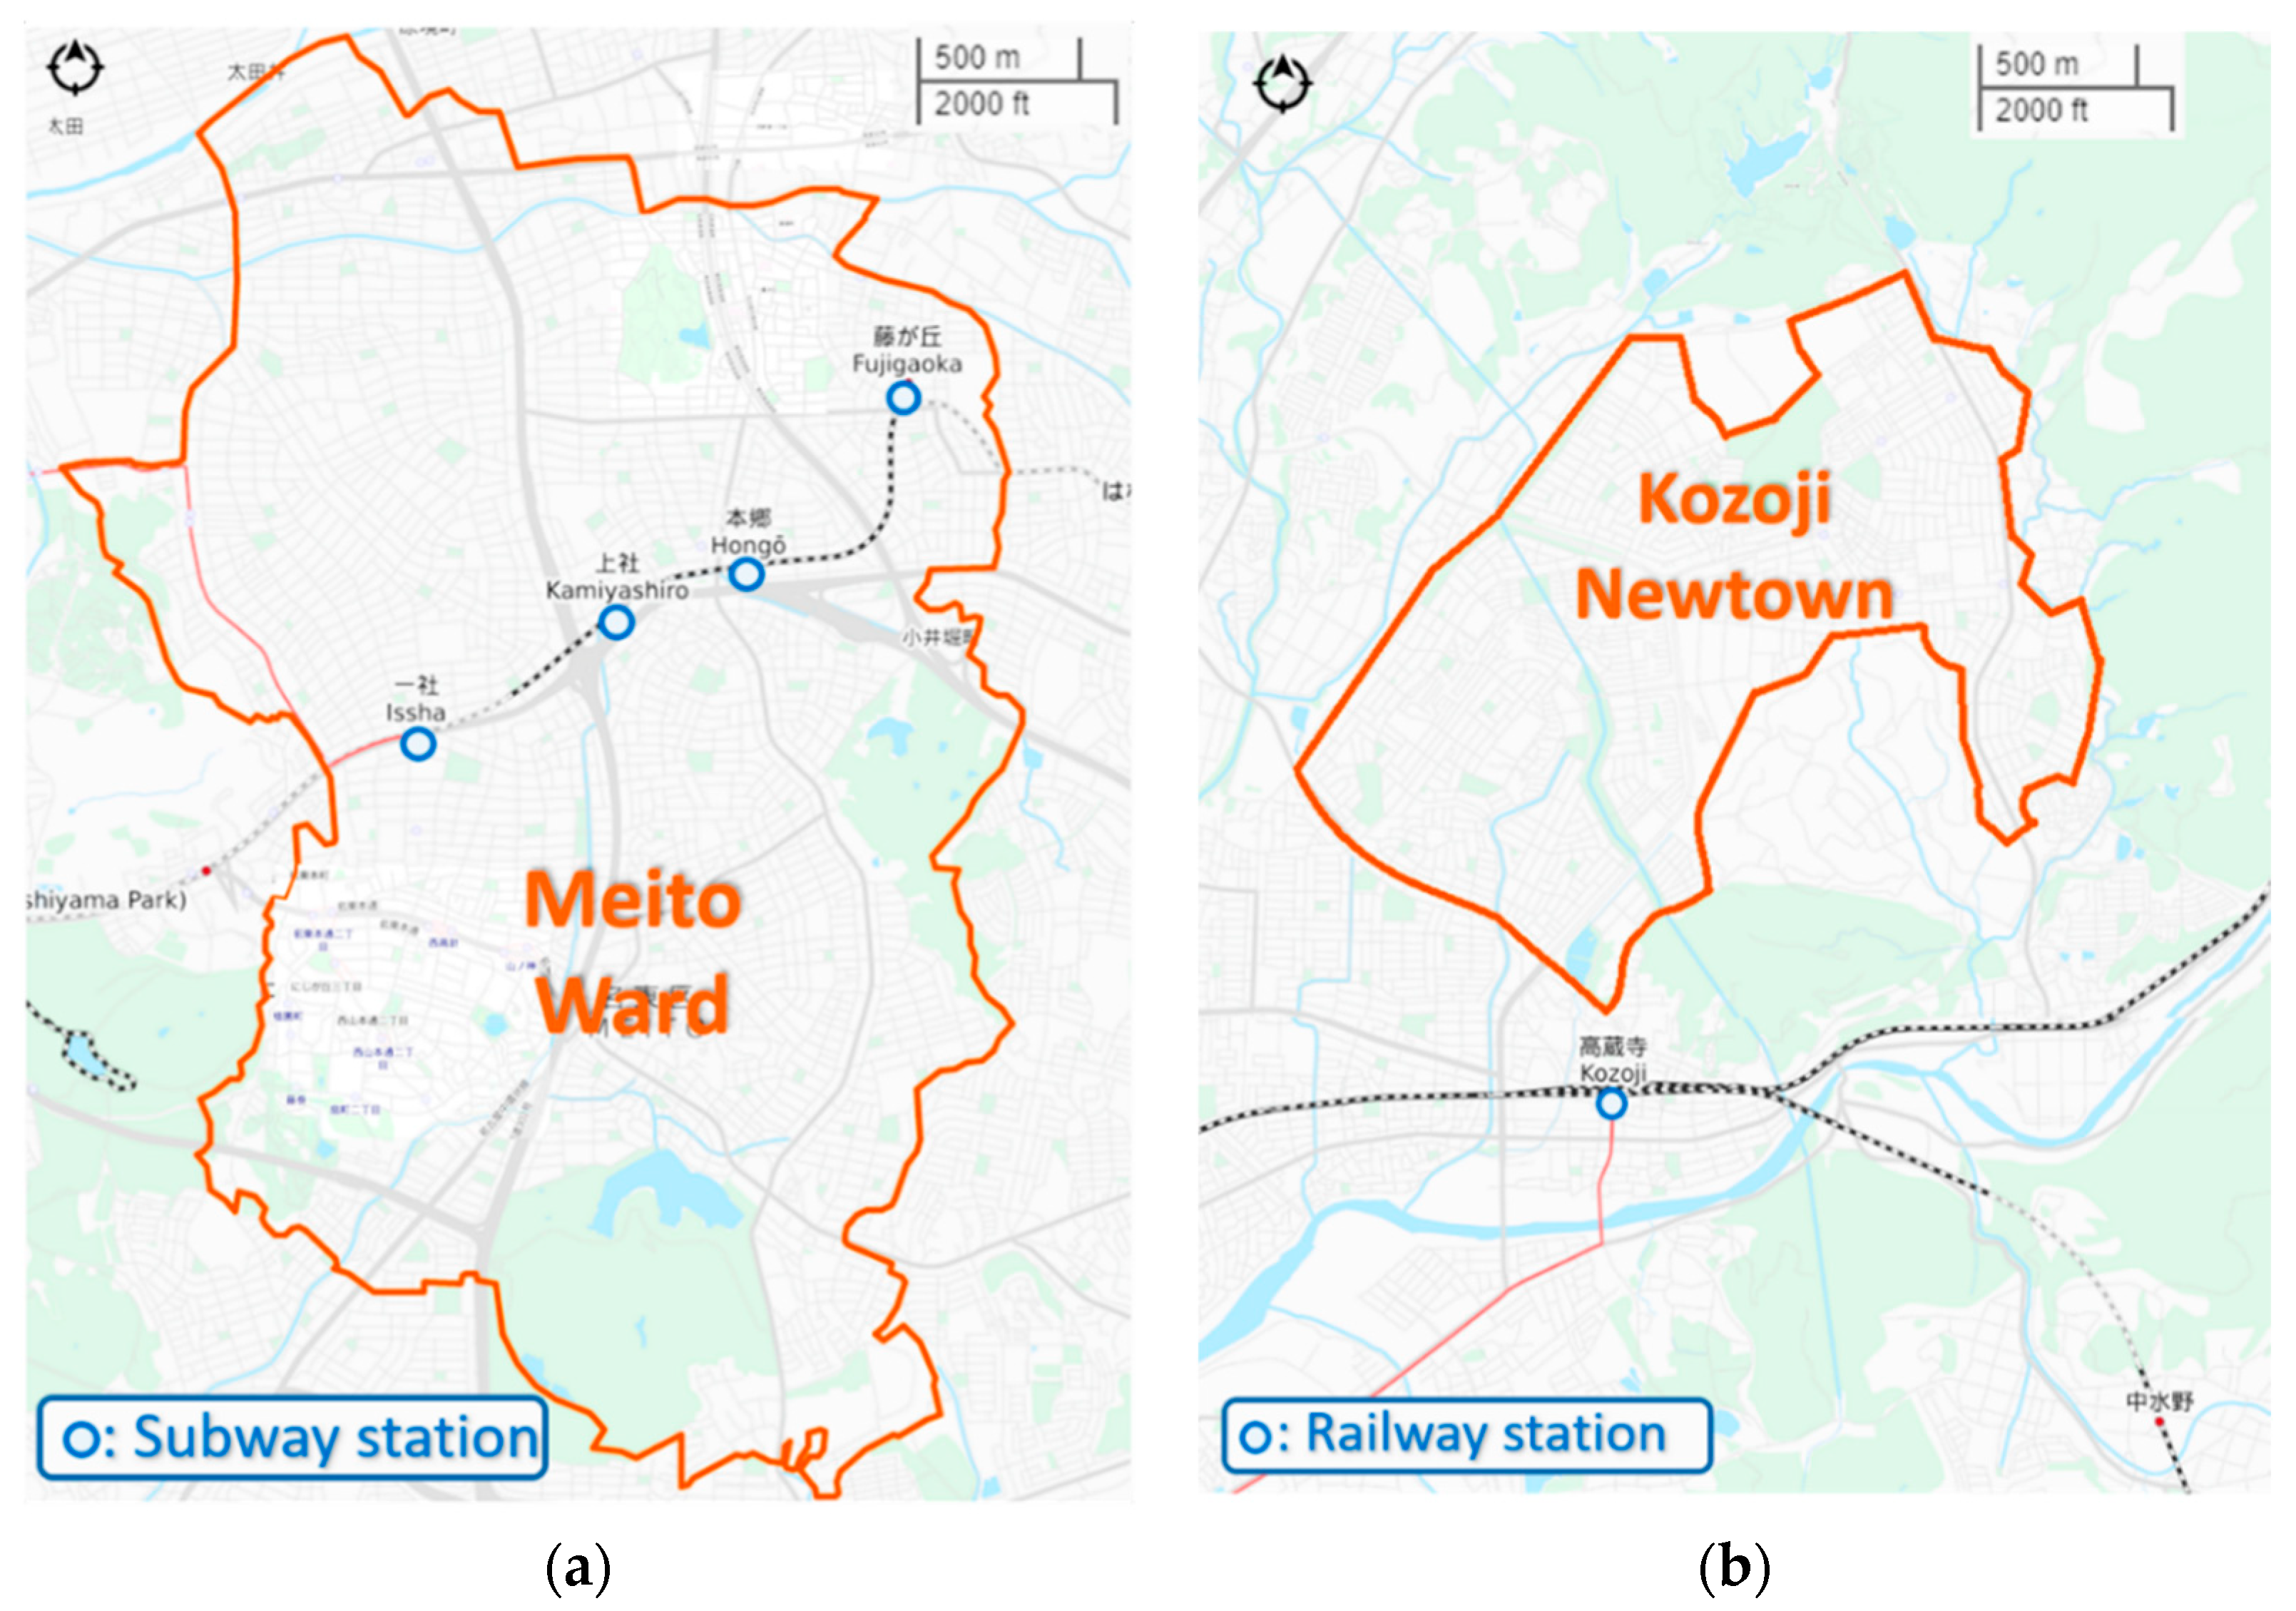
2.2.1. Edge Case, Meito Ward
2.2.2. Commuter Town Case, Kozoji Newtown
- Location: As one of the 16 wards of Nagoya City, Meito is within the boundary of Nagoya City; however, Kozoji Newtown is located in another nearby city, namely, Kasugai. The areas of both towns also differ: The total area of Meito Ward is 19.45 km2 [17], almost three times that of Kozoji Newtown, at 7.02 km2 [18].
- Key transit station: Usually, the transfer stations in the target area are taken as the key transit stations, as for the stations in Meito Ward. However, Kozoji railway station, which is the nearest railway station, is located outside of Kozoji Newtown. This station is 16 km from Nagoya City Center (Sakae station), but Nagoya City Center is accessible via the two railway lines that pass through Kozoji station (Kozoji station has two “station codes” in the data source, though the station is not separated into two lines when been discussed). Therefore, because of its nearness and accessibility, Kozoji station is most suitable for the proposed P&R scheme. Thus, it was selected as the key transit station of this case.
- P&R commuters: The most distinctive feature of Kozoji Newtown is that it was developed as a Nagoya-City commuter town. Thus, the commuters residing in Kozoji Newtown are likely to be potential P&R commuters. Differing from the edge case, the commuters residing in Kozoji Newtown who boarded the railway line at Kozoji station were categorized as P&R commuters for the Kozoji Newtown case considered in this study.
3. Simulation
3.1. Range and Period
- The simulation range was limited to the target area only;
- Some input information, such as the available fleet, could be manually changed for each hour.
- Morning commuting hours: This period extended from 05:00 to 10:59, based on the peak commuting hours in the morning. As the arriving P&R commuters accumulated, the autonomous fleet in the target area also increased in size.
- Evening commuting hours: This period was from 17:00 to 23:59, based on the evening peak hours. As the number of returning P&R commuters increased, more AVs were removed from the target area.
- Off-peak hours: This sub-period was located between the two commuting sub-periods and endured for 6 h, from 11:00 to 16:59. During this sub-period, the size of the fleet in the target area remained constant.
3.2. Fleet Setting
3.3. Input Factors
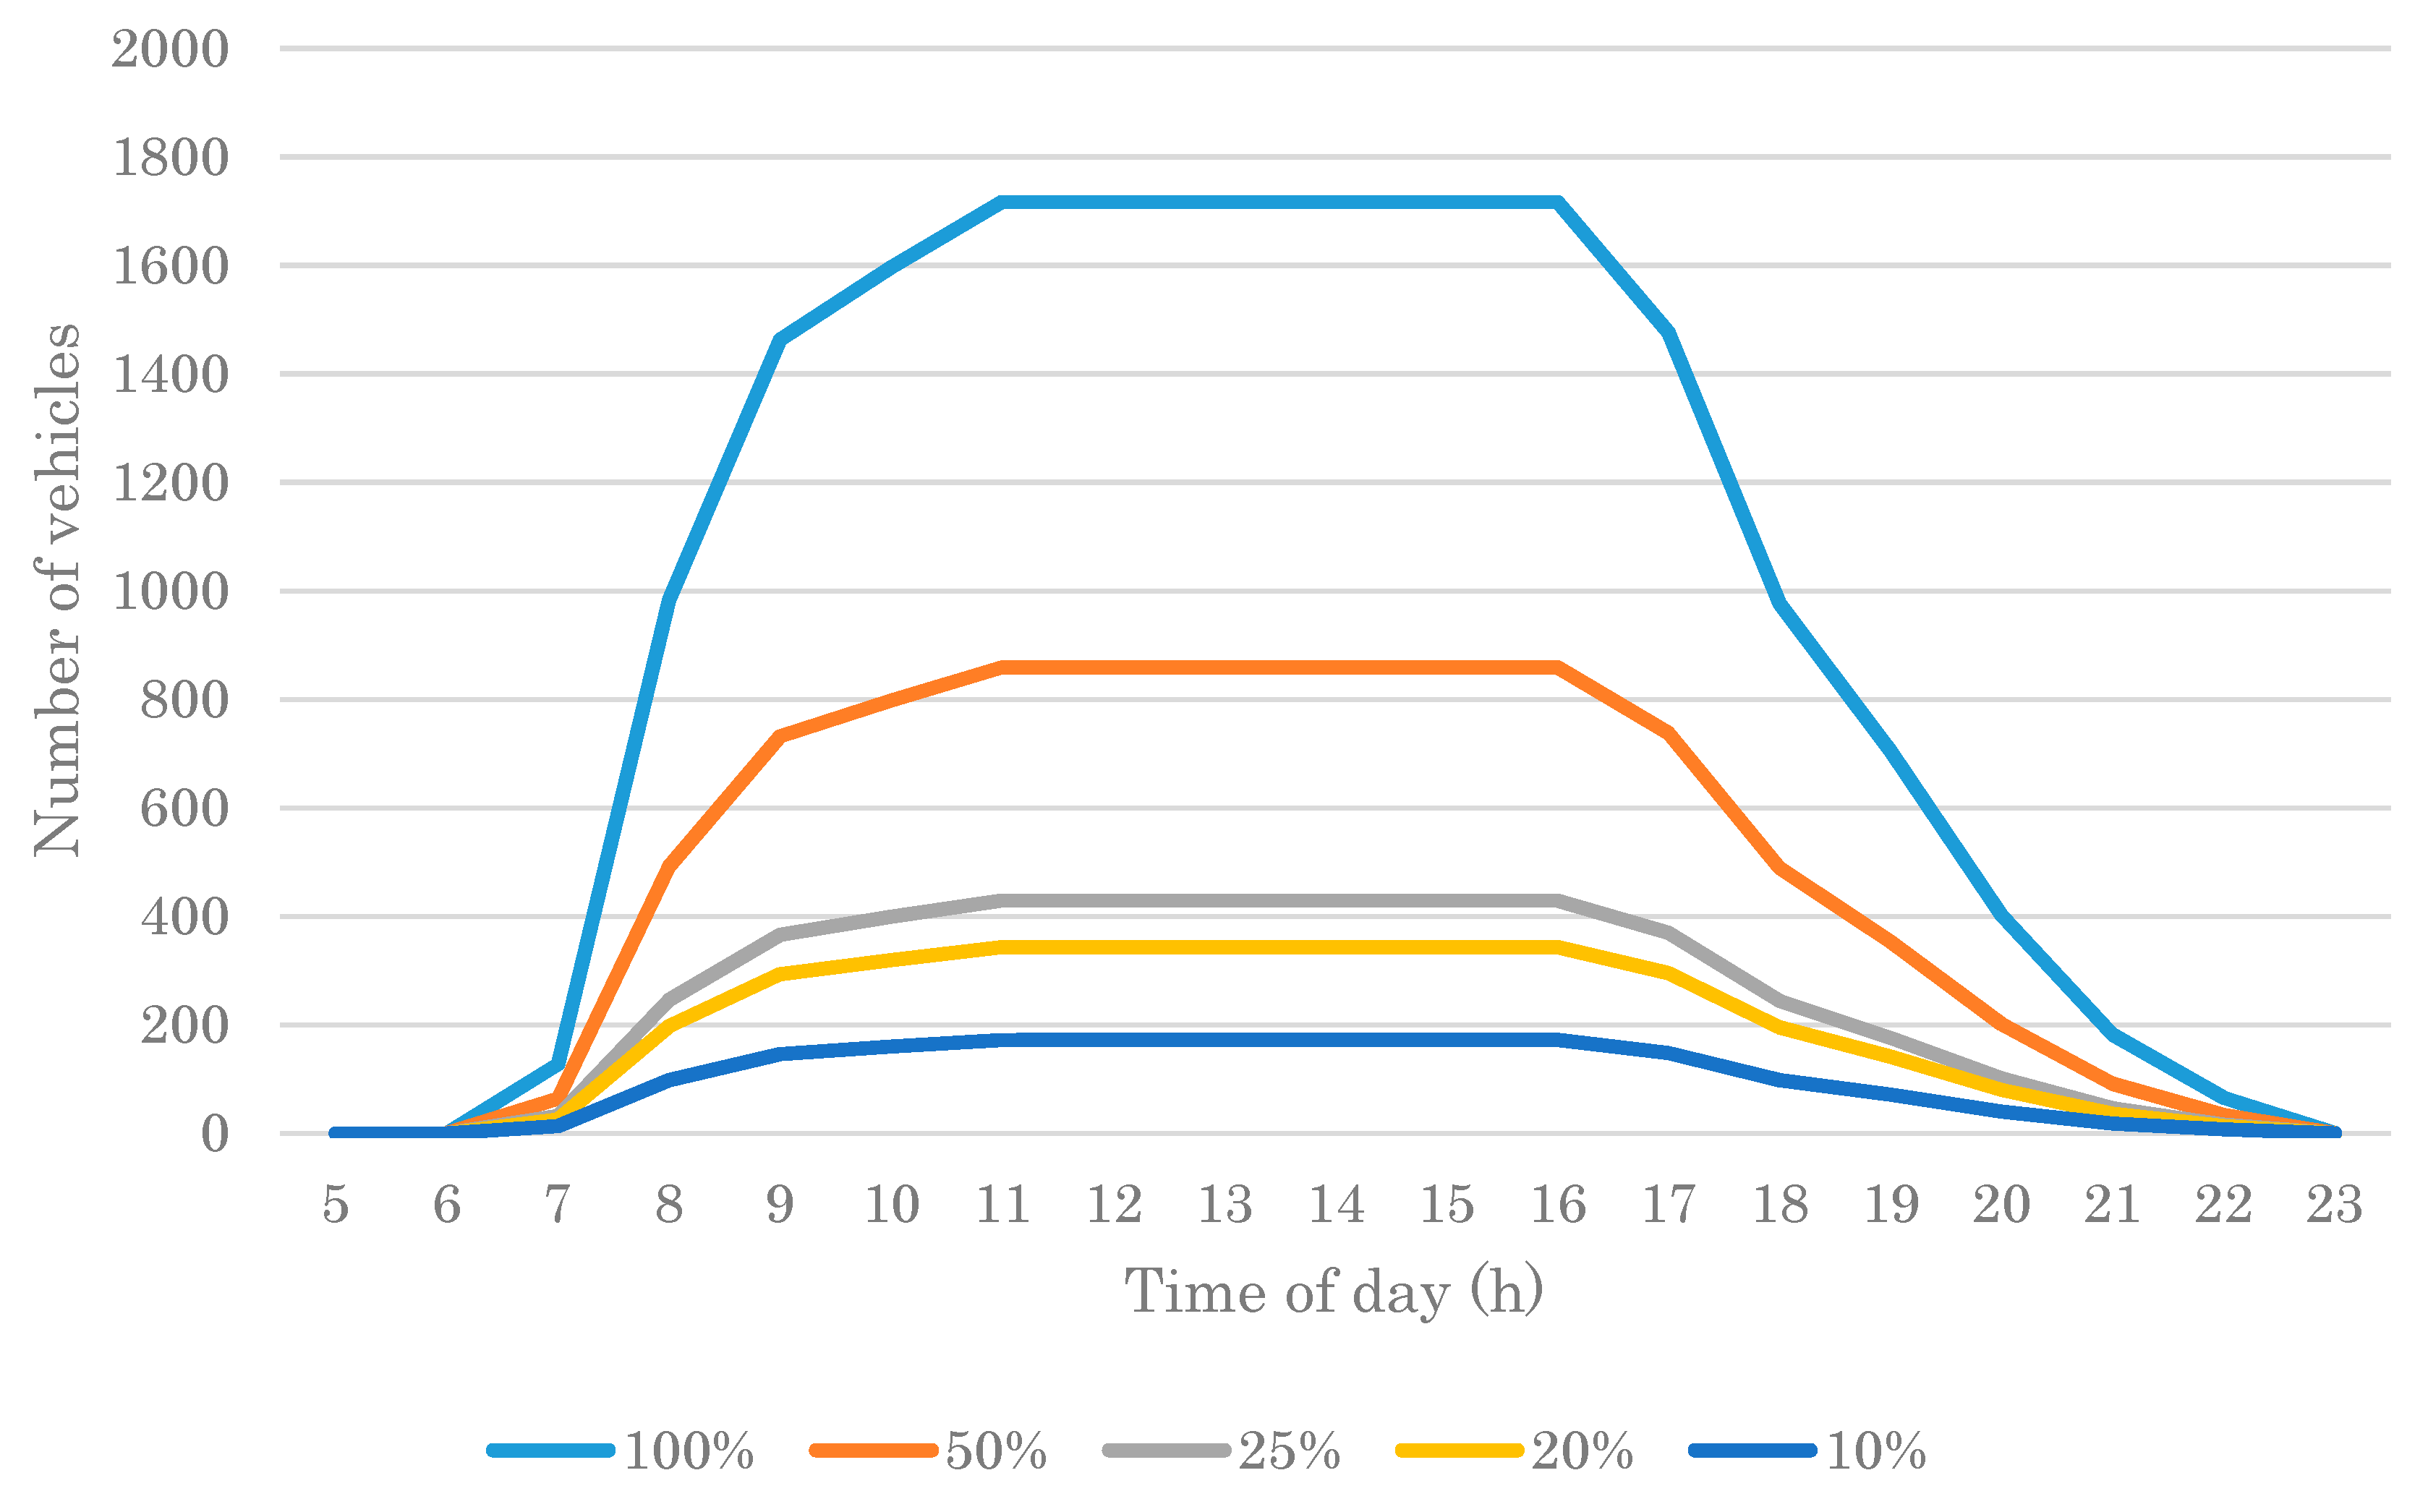
- Available fleet size: The fleet size is the supply in the system. As explained under the heading “Generation” in Section 3.2, the fleet size fluctuated during the commuting peak hours; therefore, the available fleet size was reset hourly as a key decision variable. Furthermore, the fleet size at the beginning and end of the simulation period was zero.
- Time interval: One-hour simulations were performed for the initial and end hours of the two commuting hour periods. But for the off-peak hours the simulation was executed only once, for the constant fleet and speed.
- Speed: Generally, as described under the “Speed” heading in Section 3.2, the speed settings were as given in Table 1.
- Maximum wait time: The wait time of every trip was from the request until pick-up or cancellation. In the simulation, users did not cancel requests unless the wait time equaled the maximum wait time. This condition limited the wait time in the output. In fact, the maximum wait time was longer than the longest time interval in the simulation; thus, the trip wait time results were collected without loss of information.
4. Results and Discussion
4.1. Criteria
4.2. Scenario Results
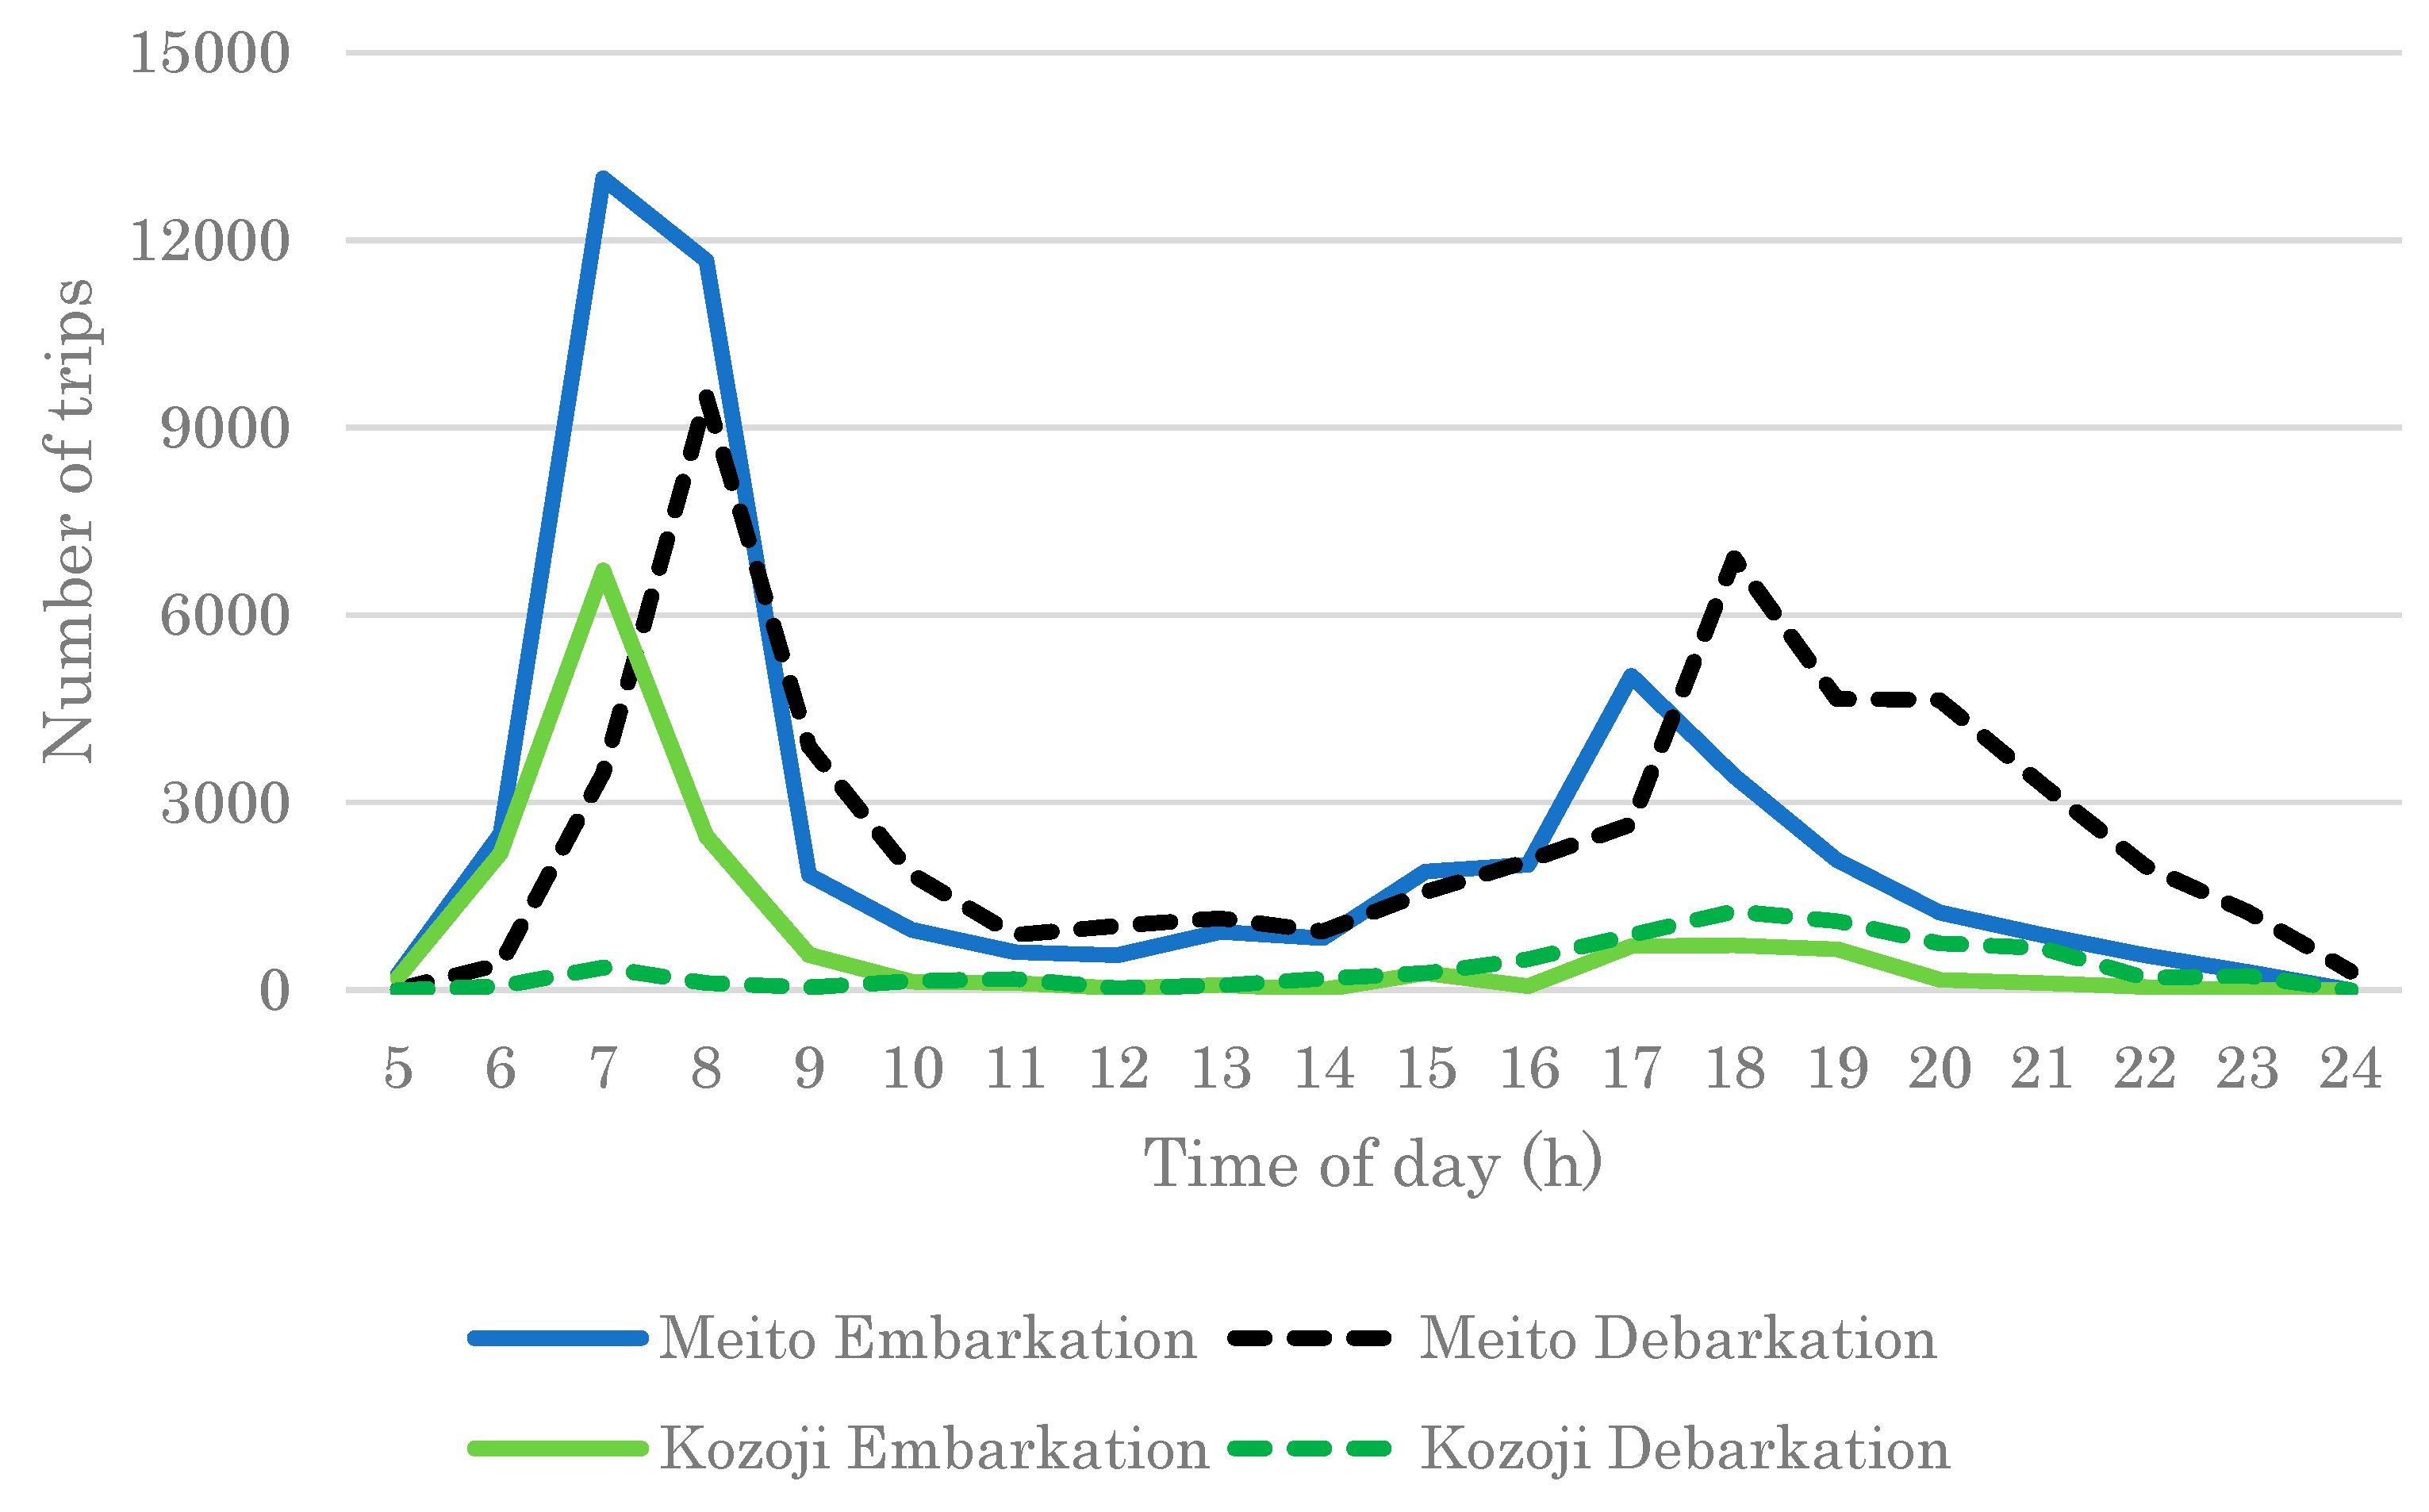
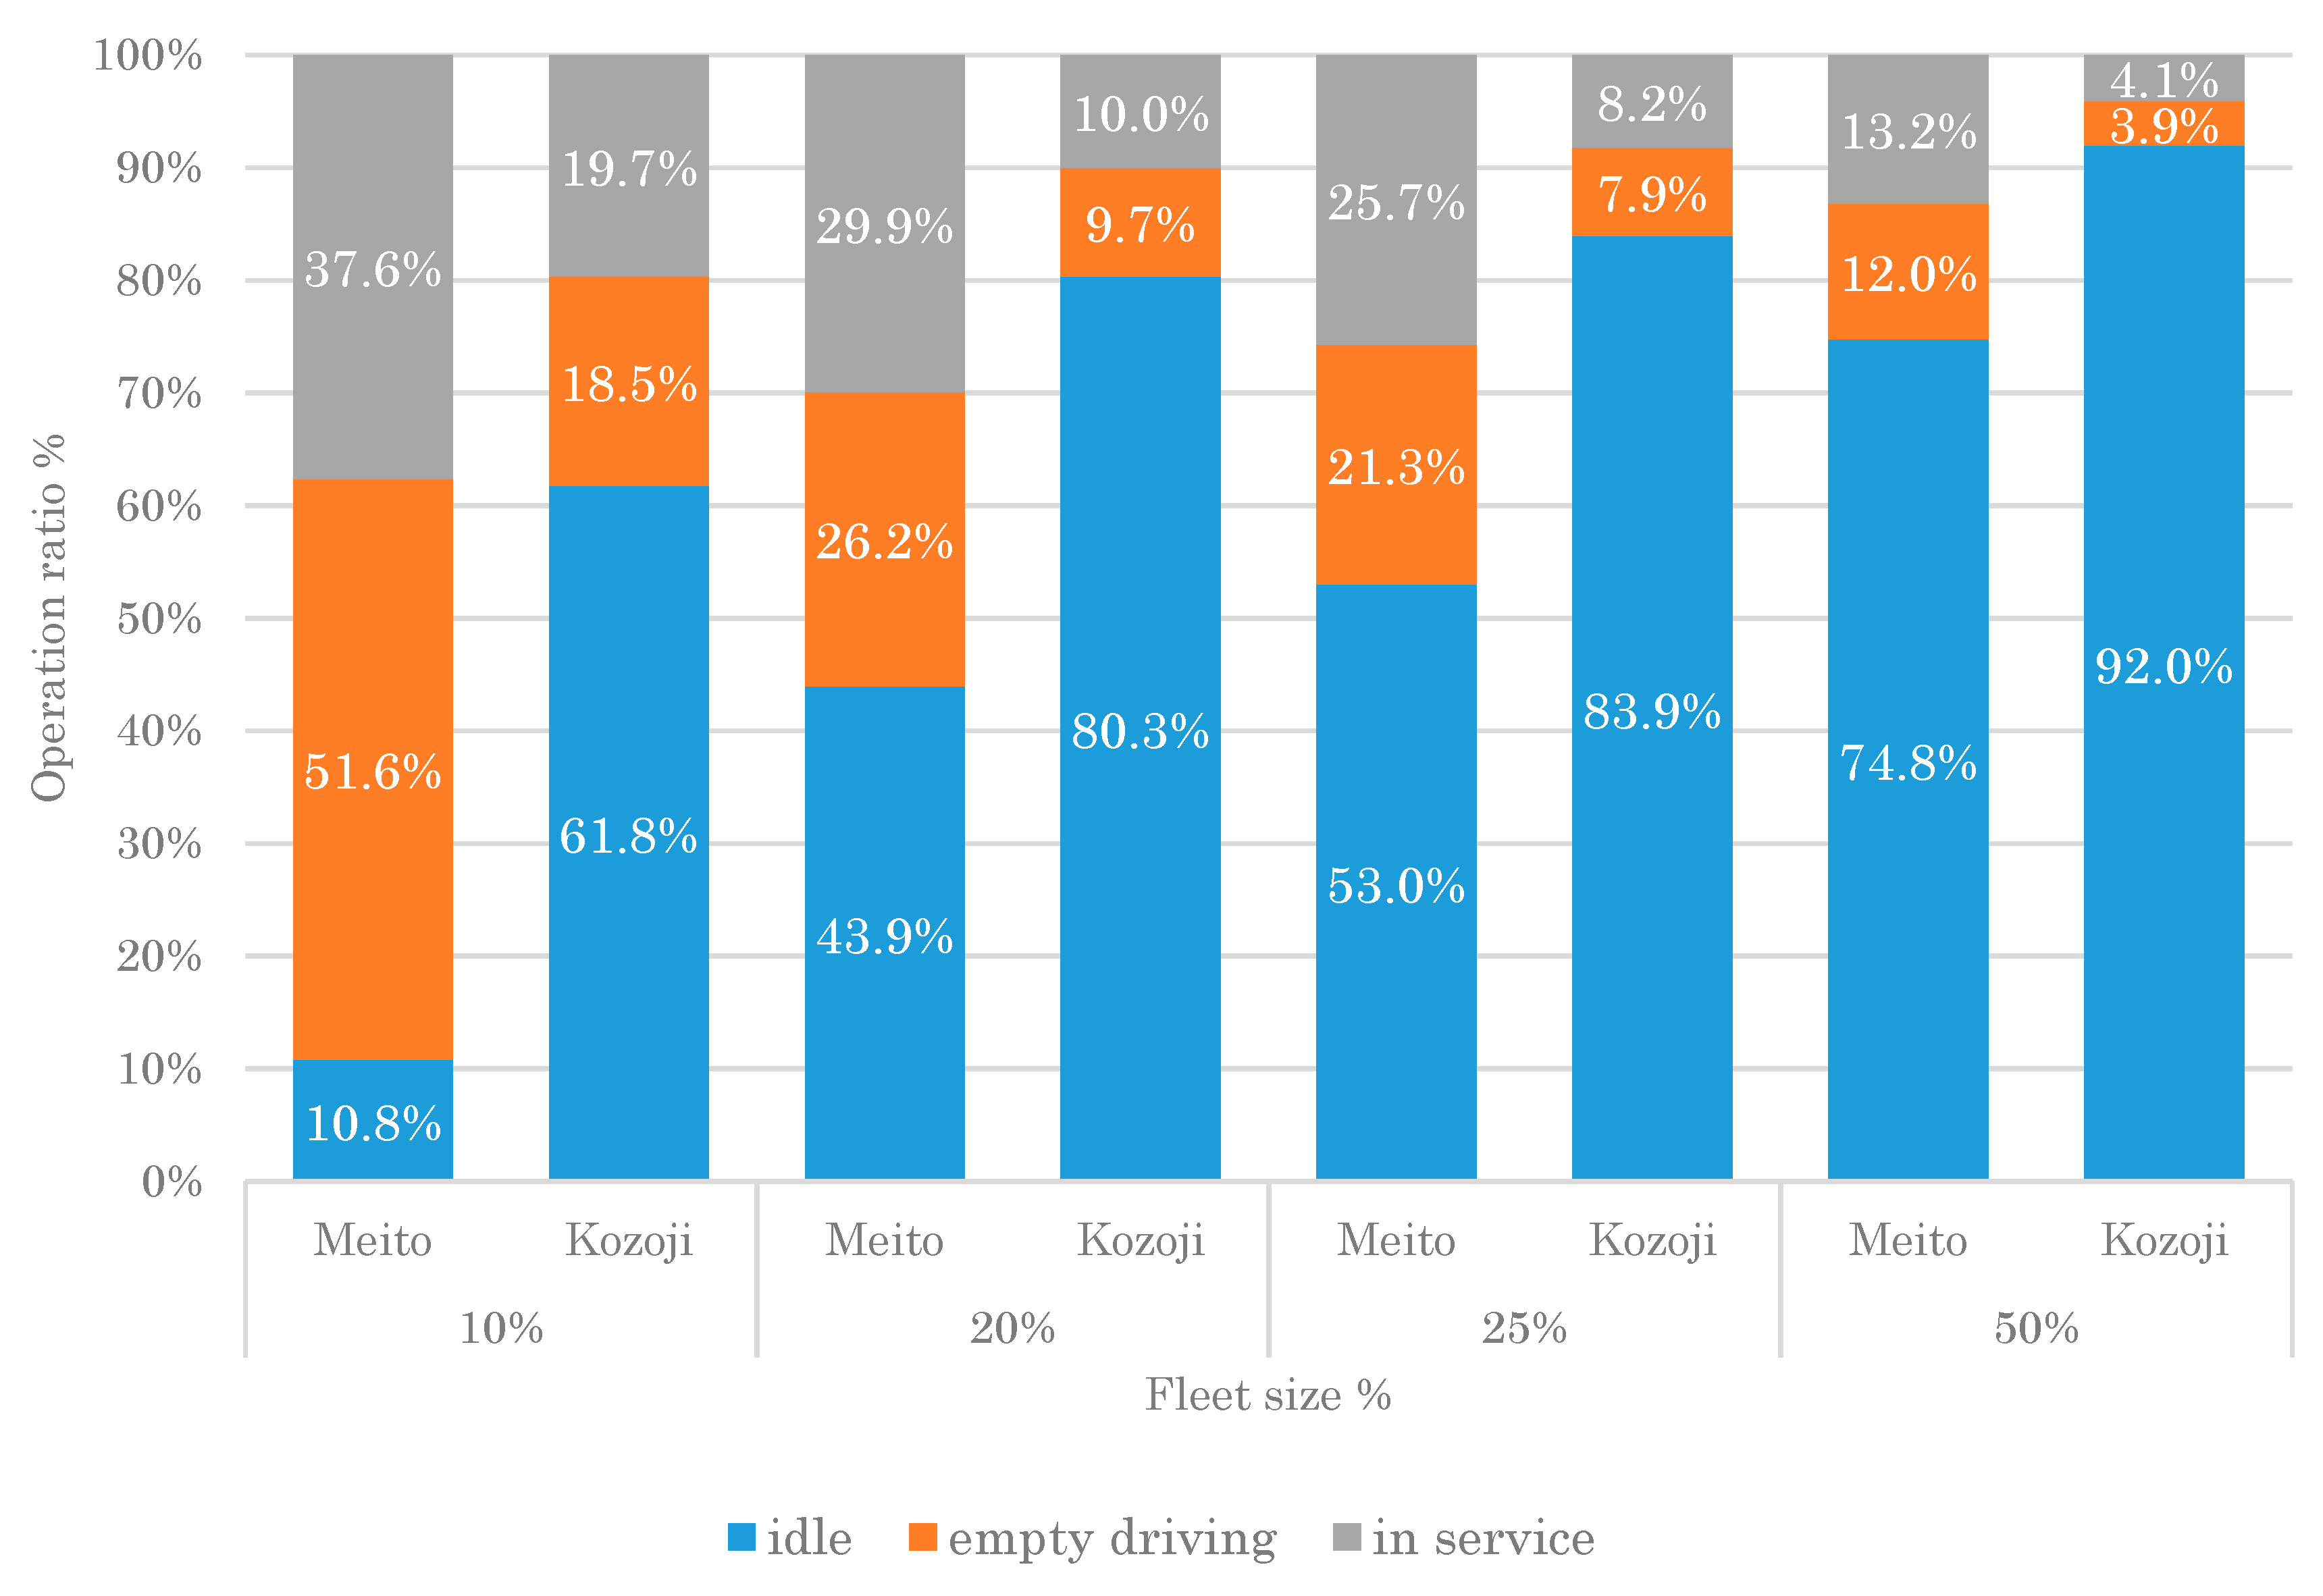
4.2.1. Meito Ward Results
4.2.2. Kozoji Newtown Results
4.2.3. Sensitivity Analysis of Kozoji Newtown
4.3. Major Findings
- A halved fleet of vehicles transferred by the P&R commuters can satisfy the demands of the inbound commuters and the elderly and disabled residents traveling in the target area; however, the corresponding efficiency is not desirable.
- In the case of Meito Ward, when approximately 20% to 25% of the full fleet is used (approximately 400 vehicles), the shared AVs can provide a quick response service for the inbound commuters and the elderly and disabled residents with an average wait time of less than 2 min.
- In the case of Kozoji Newtown, fewer than 400 shared AVs can perform more than 6000 trips for the inbound commuters and the elderly and disabled residents travelling within the target suburban area from the beginning of the morning peak hour period until 22:59. For approximately 95% of trips, the wait time is less than approximately 5 min and the average wait time of all trips is approximately 1 min.
4.4. Future Work
- As hourly constant speeds were set for the AVs, the simulation output may have included distortions due to insensitive reflections of the changing traffic volumes of the road network. Thus, to reflect detailed speed variations, use of simulation software such as MATSim should be considered for future work on this topic.
- The external trips of the P&R commuters were not reflected in the simulation, although this factor indirectly affects the internal trips of the inbound commuters or elderly and disabled residents. To incorporate the external trips of the P&R commuters in the simulation, road network enlargement or other solutions are required.
- In reality, the AV mileage factor is one of the most significant obstacles affecting the fleet performance, and lack of consideration of this aspect is a limitation of this study. First, charging stations (e.g., for electric AVs) must be incorporated in the simulation. Afterwards, the associated challenges may be determined.
- The FCFS strategy may not be the most advanced solution for AV dispatch. Use of the demand-supply balancing taxi dispatch strategy or another more reasonable frame could provide new research directions.
- To evaluate how the proposed system improves on the current transport systems in the target areas in detail, possible applications and evaluation criteria are required.
Author Contributions
Funding
Acknowledgments
Conflicts of Interest
References
- Burian, J.; Voženílek, V. Identification and analysis of urbanization and suburbanization in Olomouc region—Possibilities of GIS analytical tools. In Advances in Spatial Planning; Burian, J., Ed.; InTech: London, UK, 2012; pp. 143–164. [Google Scholar]
- Department of Economic and Social Affairs United Nations. World Population Ageing; The United Nations: New York, NY, USA, 2002; pp. 1950–2050. [Google Scholar]
- Meyer, J.; Becker, H.; Bösch, P.M.; Axhausen, K.W. Autonomous vehicles: The next jump in accessibilities? Res. Transp. Econ. 2017, 62, 80–91. [Google Scholar] [CrossRef] [Green Version]
- Song, Z.; He, Y.; Zhang, L. Integrated planning of park-and-ride facilities and transit service. Transp. Res. Part C 2017, 74, 182–195. [Google Scholar] [CrossRef]
- Parkhurst, G. Park and ride: Could it lead to an increase in car traffic? Transp. Policy 1995, 2, 15–23. [Google Scholar] [CrossRef]
- Shen, Y.; Zhang, H.; Zhao, J. Integrating shared autonomous vehicle in public transportation system: A supply-side simulation of the first-mile service in Singapore. Transp. Res. Part A 2018, 113, 125–136. [Google Scholar] [CrossRef]
- Zhang, W.; Guhathakurta, S.; Fang, J.; Zhang, G. Exploring the impact of shared autonomous vehicles on urban parking demand: An agent-based simulation approach. Sustain. Cities Soc. 2015, 19, 34–45. [Google Scholar] [CrossRef]
- Kang, N.; Feinberg, F.M.; Papalambros, P.Y. Autonomous electric vehicle sharing system design. J. Mech. Des. 2016, 139, 011402. [Google Scholar] [CrossRef]
- Zakharenko, R. Self-driving cars will change cities. Reg. Sci. Urban Econ. 2016, 61, 26–37. [Google Scholar] [CrossRef]
- Litman, T. Autonomous Vehicle Implementation Predictions; Victoria Transport Policy Institute: Victoria, BC, Canada, 2017. [Google Scholar]
- Bischoff, J.; Maciejewski, M. Autonomous taxicabs in Berlin—A spatiotemporal analysis of service performance. Transp. Res. Procedia 2016, 19, 176–186. [Google Scholar] [CrossRef]
- Bischoff, J.; Maciejewski, M. Simulation of city-wide replacement of private cars with autonomous taxis in Berlin. Procedia Comput. Sci. 2016, 83, 237–244. [Google Scholar] [CrossRef]
- Liu, Z.; Miwa, T.; Zeng, W.; Morikawa, T. An agent-based simulation model for shared autonomous taxi system. Asian Transp. Stud. 2018, 5, 1–13. [Google Scholar]
- Shaheen, S.A.; Rodier, C. Travel effects of a suburban commuter carsharing service: CarLink case study. Transp. Res. Rec. 2005, 1927, 182–188. [Google Scholar] [CrossRef]
- Shaheen, S.A.; Novick, L. Framework for testing innovative transportation solutions: Case study of CarLink, a commuter carsharing program. Transp. Res. Rec. 2005, 1927, 149–157. [Google Scholar] [CrossRef]
- Preston, J.P. Community involvement in school: Social relationships in a bedroom community. Can. J. Educ. 2013, 36, 413–437. [Google Scholar]
- Official Nagoya City Website. Available online: http://www.city.nagoya.jp/kids/page/0000007521.html (accessed on 22 April 2019).
- Official Kozoji Newtown Website. Available online: http://kozoji-nt.com/introduce#history (accessed on 22 April 2019).
- Ministry of Land, Infrastructure and Transport. Heisei 22nd National Road Traffic Survey (Road Traffic Census) General Traffic Survey Total List; Ministry of Land, Infrastructure and Transport: Tokyo, Japan, 2011. (In Japanese)
- Yamamoto, M.; Kaji, D.; Hattori, Y.; Yamamoto, T.; Tamada, M.; Fujigaki, Y. Study on spread of shared autonomous vehicles. Proc. Infrastruct. Plan. 2016, 53, 28–29. (In Japanese) [Google Scholar]


| Peak Hours | Off-Peak Hours | ||
|---|---|---|---|
| Time of day | 07:00–09:59 17:00–19:59 | 05:00–06:59 10:00–16:59 20:00–22:59 | |
| Speed (km/h) | Meito | 18.9 | 24.0 |
| Kozoji | 27.6 | 31.8 | |
| Meito Ward | Fleet size | Vehicle | 172 | 343 | 429 | 859 |
| Percentage | 10% | 20% | 25% | 50% | ||
| Average wait time | 41 m 39 s | 1 m 47 s | 1 m 4 s | 32 s | ||
| 95th percentile of wait time | 1 h 35 m 14 s | 7 m 9 s | 3 m 12 s | 1 m 39 s | ||
| Completed trips (%) | 55.3% | 87.2% | 92.1% | 94.1% | ||
| Kozoji Newtown | Fleet size | Vehicle | 185 | 370 | 462 | 924 |
| Percentage | 10% | 20% | 25% | 50% | ||
| Average wait time | 1 m 28 s | 1 m 2 s | 58 s | 43 s | ||
| 95th percentile of wait time | 6 m 55 s | 5 m 6 s | 4 m 46 s | 3 m 39 s | ||
| Completed trips (%) | 92.5% | 94.0% | 95.1% | 95.0% | ||
| Scenario | Base | Lower Speed | Higher Speed | Higher Demand (125% Inbound & 125% Elderly) | Higher Demand (125% Inbound & 100% Elderly) | Higher Demand (100% Inbound & 125% Elderly) | Taxi | |
|---|---|---|---|---|---|---|---|---|
| Speed | 100% | 90% | 110% | 100% | 100% | 100% | 100% | |
| Demand | 100% | 100% | 100% | 125% inbound & 125% elderly | 125% inbound & 100% elderly | 100% inbound & 125% elderly | 100% | |
| Waiting time | Average | 1 m 2 s | 1 m 11 s | 57 s | 1 m 11 s | 1 m 7 s | 52 s | 52 s |
| 95th percentile | 5 m 6 s | 5 m 53 s | 4 m 36 s | 5 m 45 s | 5 m 30 s | 4 m 24 s | 3 m 48 s | |
| Completed trips | 94.0% | 93.3% | 94.8% | 90.0% | 91.2% | 93.6% | 98.3% | |
| Operation mode | Idle rate | 80.3% | 78.6% | 81.7% | 75.4% | 79.5% | 77.8% | 85.7% |
| Empty ride rate | 9.7% | 10.4% | 9.0% | 11.9% | 10.1% | 10.8% | 7.0% | |
| In service rate | 10.0% | 11.0% | 9.3% | 12.6% | 10.4% | 11.4% | 7.2% | |
| Kilometer traveled per vehicle (km) | Empty ride | 31.9 | 30.9 | 32.8 | 39.4 | 33.5 | 35.9 | 33.9 |
| In service | 33.1 | 32.8 | 33.7 | 41.8 | 34.3 | 38.0 | 34.9 | |
| Empty ride + In service | 65.0 | 63.7 | 66.5 | 81.2 | 67.8 | 73.9 | 68.8 | |
© 2019 by the authors. Licensee MDPI, Basel, Switzerland. This article is an open access article distributed under the terms and conditions of the Creative Commons Attribution (CC BY) license (http://creativecommons.org/licenses/by/4.0/).
Share and Cite
Zhou, Y.; Li, Y.; Hao, M.; Yamamoto, T. A System of Shared Autonomous Vehicles Combined with Park-And-Ride in Residential Areas. Sustainability 2019, 11, 3113. https://doi.org/10.3390/su11113113
Zhou Y, Li Y, Hao M, Yamamoto T. A System of Shared Autonomous Vehicles Combined with Park-And-Ride in Residential Areas. Sustainability. 2019; 11(11):3113. https://doi.org/10.3390/su11113113
Chicago/Turabian StyleZhou, Yefang, Yanyan Li, Mingyang Hao, and Toshiyuki Yamamoto. 2019. "A System of Shared Autonomous Vehicles Combined with Park-And-Ride in Residential Areas" Sustainability 11, no. 11: 3113. https://doi.org/10.3390/su11113113