Article

Hempseed Oil Quality Parameters: Optimization of Sustainable Methods by Miniaturization

1
Department of Management, “Sapienza” University, via del Castro Laurenziano 9, 00161 Rome, Italy
2
Department of Communication and Social Research, “Sapienza” University, Via Salaria, 113, 00198 Rome, Italy
*
Author to whom correspondence should be addressed.
Sustainability 2019, 11(11), 3104; https://doi.org/10.3390/su11113104
Submission received: 3 May 2019 / Revised: 22 May 2019 / Accepted: 31 May 2019 / Published: 1 June 2019
(This article belongs to the Section Sustainable Chemical Engineering and Technology)

Abstract

:
Industrial Hemp, Cannabis sativa L., is characterized by low content of THC (<0.2%). An edible oil with excellent nutritional proprieties is obtained from cold pressing of hempseed. Since Hempseed oil is not reported in a Regulation yet, in order to ensure quality parameters, it is necessary to optimize standard methods (taken from the Regulation for EVOO). In this work, the standard method of quality parameters (free fatty acidity, peroxide number, and anisidine number) were miniaturized and optimized for Hempseed oil matrix. The miniaturized methods result in being sustainable, in environmental and economical perspectives, by using a smaller amount of chemicals (e.g., reagents, solvents), also reducing waste production and the sample needed in relation to the high cost of the Hempseed oil (60–70 €/L). The standard methods of miniaturization, carried out by using the Central Composite Design, allow for great saving of sample (5.35 g vs. 29 g) and reagents (up to 50%).

1. Introduction

Industrial hemp, Cannabis sativa L., is a herbaceous annual and its cultivation takes place in central Asia [1]. Hemp is probably one of the first plants to be cultivated and exploited by humans for centuries; its cultivation has been spread across all countries, including Italy [2]. Industrial hemp is a versatile plant that can be cultivated in order to obtain fibers, seeds, and oil, and consequently it can be used for food and nutraceutical purposes [3,4]. It is known that some cultivars, like Felina or Ferimon, contain less than 0.2% of Δ9-tetrahydrocannabinol in the whole plant [5]. These cultivars are mentioned in the EU Approved Common Catalogue of Cultivars [6] and can be planted in Europe. The former is legally regulated, and offers many advantages in the agricultural, economic, and ecological fields. The interest in hemp has risen during the last several years due to its multiple utilities and environmental adaptability [7]. The applications of hemp are different: paper, biodegradable plastics, construction sector, and biofuel [8]. The bast fiber from hemp stalk is still used for rope, paper, and weaving. Every part of some specific cultivars of Cannabis sativa L. [6] can be used in food, from its leaves (e.g., in cake, bread) to its seeds, used to extract an edible oil.
Hempseeds, coming from the inflorescence of the plant, are the main products of hemp and are usually transformed into hempseed oil and hempseed flour. Hempseeds are “akenes” and contain 22–25% proteins, 30–35% lipids and 35–37% carbohydrates (of which only 3% are sugar) [9]. The hempseed oil yield production is very high: the yield of extracted hempseed oil deriving from 1 kg of hempseeds can reach up to 300 mL (around 25–30%) [10].
Hempseed oil is a natural source of polyunsaturated fatty acids (PUFAs) and the main ones are the Linolenic acid (C18:2 ω-6) and α-linolenic acid (C18:3 ω-3) [11,12]. These two fatty acids are contained in hempseed oil respectively around 50–70% (linoleic acid) and 15–25% (α-linolenic acid), with a ratio of the two being 3:1, a value which is suggested as optimal for human nutrition [13]. These compounds are also known as essential fatty acids (EFAs) because they are essential for humans or other animals for good health, since they cannot synthesize them [14,15]. In addition to EFAs, hempseed oil also contains antioxidant, another category of important functional compounds. The hempseed phytochemicals with antioxidant activity belong to the class of phenolic compounds, including lignans, flavonoids, and phenolic acids [16]. Hempseed oil can be considered as functional food for the presence of antioxidant compounds (e.g., for rheumatoid arthritis) and nutraceutical for its fatty acid composition (e.g., hypercholesterolemy). For this reason, its assumption by diet is highly recommended [17,18].
In Europe, there is no quality regulation for oily products from seeds, but in the great organized distribution (G.D.O.) is possible to find seed oils labeled as “virgin”. In Italy there are some old norms (Law 35/68, MD 27/12/72, MD 18/12/75) that indicate the free fatty acidity (≤0.5% as oleic acid) as the only chemical parameter. Quality parameters of olive oils, on the contrary, are usually regulated by a set of rules, and specifically by the Regulation (UE) 2015/1830 (and its subsequent changes) [19]. In this Regulation are specified genuineness and quality parameters for olive oils. The maximum level of each parameter is defined in a table for each kind of oil, these levels defining the category of the exanimated oil (i.e. free fatty acidity ≤0.8% for extra virgin olive oil). The standard methods to determine these parameters are contained in the additional information of Regulation. These methods take into consideration the variety of each matrix and define the amount of sample and reagents that have to be used for the determination of the parameters.
To characterize Hempseed oil, quality and genuineness parameters of extra virgin olive oil (EVOO) were studied. Since Hempseed oil is not yet reported in the Regulation table, the optimization of the standard method for the hempseed oil matrix is required. In order to ensure quality of hempseed oil the parameters chosen were free fatty acidity, peroxide number, and anisidine number. Free fatty acidity and peroxide number are the first steps of the regulation decision tree to verify the olive oil category, while the anisidine number (or anisidine value) is an important quality parameter for animal and vegetable fats [20]. The methods involved to determine all these parameters required a great quantity of samples and reagents.
The aim of this work was to optimize the standard methods (reported in the Regulation) and make them environmentally and economically sustainable by using a smaller amount of chemicals (e.g., reagents, solvents), also reducing the production of waste and the sample required in relation to the high cost of the Hempseed oil [21].
Hempseed oil cost in Italy could be 60–70 € for 1 L of oil, almost ten times more expensive than extra virgin olive oil (EVOO), ranked as best-selling in Italy. Furthermore, the use of a great number of samples for the determination of the quality parameters is not economically sustainable. For this reason, in this work the standard methods were miniaturized and optimized by using a chemometrics approach [22].
With this approach, specifically the experimental design (DOE), all the parameters can be studied together and also information about the influence of the parameters between them can be obtained [23]. The DoE approach reduces the amount of experiments to optimize a method using a restricted number of analysis. Software could be used as a tool to identify the more significative experiment to carry out. Furthermore, the experiments chosen lead to predict the results of the other experiments on all the exanimated range.

2. Materials and Methods

2.1. Materials and Apparatus

Ethanol, Diethyl ether, Chloroform, Acetic acid, n-Hexane, i-Octane, p-Anisidine, acetic acid, potassium iodide, potassium hydroxide, and sodium thiosulfate were from Sigma Chemical Co. (St. Louis, MO, USA). Distilled water was purified using a Milli-Q system (Millipore, Bedford, MA, USA). A Lenway 6705 UV-Vis spectrophotometer was used for the Anisidine Number protocol.

2.2. Sampling

Ten samples of Hempseed oil (500 mL bottles) were collected, five of them coming from Italian GDO and the other five bought on e-marketplace, chosen as the best representatives of the consumers choices (most common hempseed oils from GDO and the ones with top customer reviews from e-marketplace). The year of production chosen for all the samples was 2017. The labels of all samples stated that the preparation was performed using cold extraction. Each bottle represents a sample of oil analyzed separately. The samples were kept in the dark at +4 °C before experiments. For each sample, once opened, the three parameters were determined in the same opening day.

2.3. Experimental Design

In this work, for the identification of the optimal parameters, a Central Composite Design (CCD) [24,25], with four factors and three levels for each factor, was chosen to explore and optimize the variables influence [26]. The variables and the levels chosen are reported in Table S1 for Free Fatty Acidity, Table S2 for Peroxides Number, and Table S3 for Anisidine Number. The upper levels were the values reported in the standard methods, despite of the lower levels were chosen to explore a limited range of the variables, in order to achieve robust results also with ordinary laboratory equipment. Since the methodologies used to determinate these quality parameters do not involve many variables, we did not perform a screening of relevant factors and preferred directly to go to the optimization.
From all the possible combinations, the experimental design was built with just 27 experiments (Table 1), previously chosen by the software and calculated by the following equation (Equation (4)):
N = 2 K ( K 1 ) +   n 0
where K is the number of variables (K = 4 in this study) and n0 is the number of central point (here n0 = 3). Table 1 recapitulates the different conditions for the design built for the three methods examined. Acidity value, Peroxides Number and Anisidine Number (Y) are selected as response. Results were fitted into the empirical second order polynomial model, as shown in the following equation (Equation (5)):
Y = Q 0 +   i = 1 k B i X i + i > j k B ij X i X j + i = 1 k B ii X i 2 + e i
where Y represents the response function; Q 0 is a constant coefficient; B i , B ij , and B ii are the coefficients of the linear, interactive terms, respectively, k is the number of the variables, and e i is the residual [27].
The optimized methods were tested on ten hempseed oil samples. At first, for each sample the reference value was found with the regulated methods. The optimized methods were carried out five times in a day and for five consecutive day. The repeatability intra-day and extra-day was evaluated with the standard deviation calculation. Moreover, the accuracy was tested as the degree of agreement between the reference values founded and the mean of the values founded with the optimized methods.

2.4. Free Fatty Acidity Determination—Regulated Method

An aliquot of 10 g of oil was dissolved in 100 mL of diethyl ether/ethanol (60/40) mixture. Then free fatty acids were titrated, by shaking, with KOH 0.1N until the color change of the indicator (pink phenolphthalein color dye for at least 10 s). Acidity expressed as a mass percentage is equal to:
Acidity   %   =   V × C × M 10 × m
where: V = is the volume of the titrated solution of KOH used; C = is the exact concentration of KOH; M = is the molar weight, of the acid used for the expression of the result (oleic acid = 282); and m = is the weight of the substance analyzed [19].

2.5. Peroxides Number Determination—Regulated Method

The peroxides number is the quantity of substances present in the sample expressed in milliequivalents of active oxygen per kg (O2 meq/kg), which oxidize potassium iodide under the conditions below described. Five g of oil and 10 mL of chloroform were introduced in a flask. The substance analyzed was dissolved quickly by shaking, then 15 mL of acetic acid and 1 mL of potassium iodide solution were added. The flask was shaken for 1 min and then left, protected from light, at room temperature. After 5 min, 75 mL of distilled water were added. The iodine released was titrated with a sodium thiosulfate solution (0.002 N) by vigorously shaking, using the starch solution as indicator. The Peroxides Number expressed in meqO2/kg can be calculated as follows:
P . N .   =   V T m × 1000
where: V is the volume of the standardized sodium thiosulfate solution used for the test, T is the exact normality of the sodium thiosulfate solution used, and m is the weight in g of the substance to be analyzed [19].

2.6. Anisidine Number Determination—Regulated Method

The standard method “ISO 6885: 2016” provides for the use of 4 g of sample for analysis, dissolved in iso-octane and then treated with p-anisidine (4-methoxy-anyline) in acetic acid solution. The carbonilic compounds present give a yellow color to the solution that was measured by spectrophotometric examination at λ = 350 nm. The main contributors for this reaction are the 2-alchenals and alcandienals that could be present in a bed storage condition of an oil. So, in a 25 mL flask was introduced 4 g of oil and dissolved in iso-octane (2,2,4-trimethylpentane) until the final volume (solution A). Then the extinction at 350 nm were determinate in a 10 mm quartz cuvette. A 2.5% (w/v) solution of p-anisidine was prepared in glacial acetic acid. An aliquot of 5.0 mL of solution A was added to 1 mL of p-anisidine (2.5% in glacial acetic acid). The mixture (solution B) was shaken and let it rest for 10 min. Then the extinction at 350 nm were measured. To obtain the p-anisidine Number, the following expression is required:
A . N . = 25   ×   ( 1.2   E a E b ) m
where E a is the extinction of solution A, E b is the extinction of the solution B, and m is the weight of the sample [20].

2.7. Statistical Analysis

For ANOVA analysis, in order to construct the central composite design, the JMP 13 (SAS, USA) software was used. All the experiments have been performed three times, with a RSD < 5%.

3. Results and Discussions

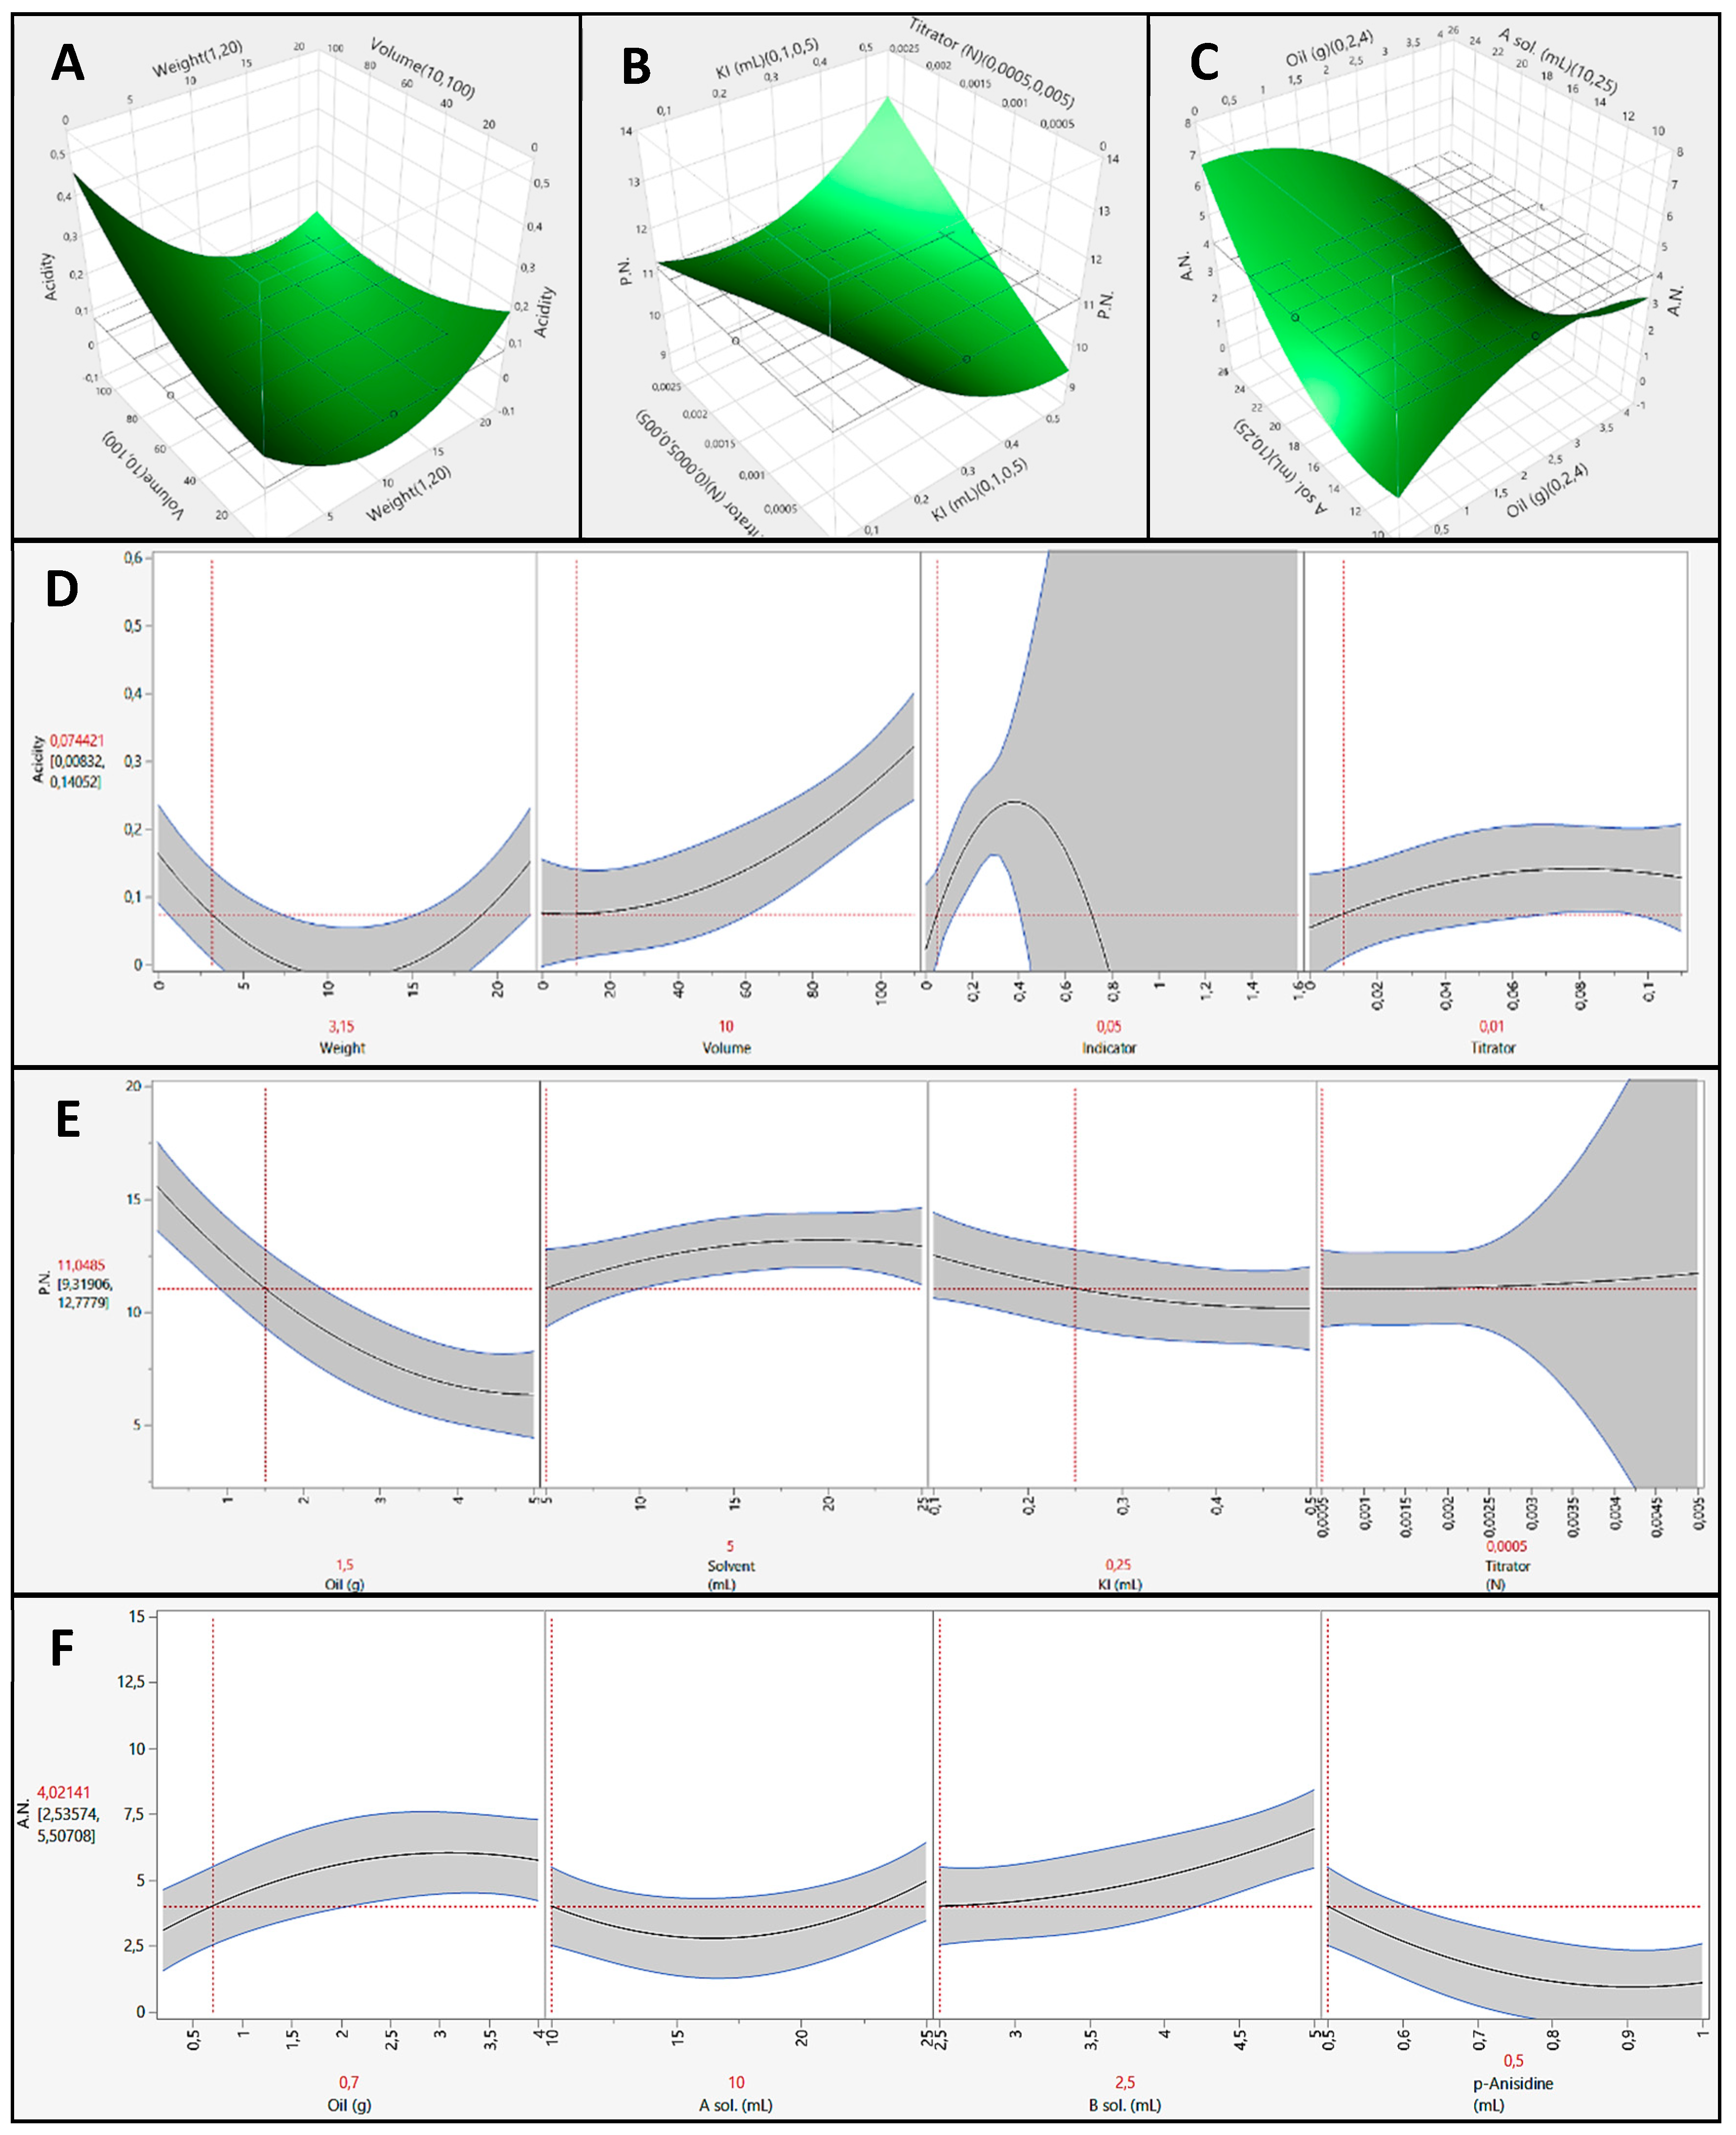
3.1. Free Fatty Acidity

The free organic acidity value (expressed in g% of oleic acid) is a degree marker of hydrolytic alteration of the oil glyceride component [28]. At first a portion of the substance to be analyzed was dissolved in a solvent mixture, then a titration of the free fatty acids was carried out with a potassium hydroxide solution. The organic free acidity parameter is the only included in the regulation of seed oils in Italy, which is also used to distinguish an extra-virgin olive oil from a non-extra virgin (Reg. EEC 2568/91). So, the acidity index was chosen to characterize hempseed oil. The legislation establishes an official method for determining this parameter.
For hempseed oil matrix, which has been found to have an acidity between 0–1% [29], a quantity of hempseed oil included by 10–20 g is required. At first a reference value was obtained by using the regulation method. The free fatty acidity found in the hempseed oil sample chosen to perform the experiments was 0.074 ± 0.002%. This value is determined three times on hemp oil using the standard method.
Subsequently, a miniaturization of the standard method was necessary, by using a chemometric approach, due to the high commercial value of this oil. The optimal miniaturized conditions were chosen by using a Central Composite Design (CCD).
To represent the response surface, a second polynomial equation was chosen, and the estimated coefficients are reported in Table 2.
Also, the other results were shown in Table 2. The linear regression coefficient of experimental vs predicted values was R2 = 0.97, this means that the 97% of variability was explained by the model. The adjusted coefficient (R2adj = 0.93) is very close to the R2, for this reason we can state that our model is a good statistical one [30]. Both the regression coefficients were close to 1 (R2 = 0.97 and R2adj = 0.93), this indicates a high degree of correlation between the observed and the predicted value. Also the low value of the coefficient of variation (CV = 2.14%) highlights the high degree of precision for the model and a good precision of the experimental values [26].
From this calculation were found high F-Test value (27.38) and low p-value (<0.0001), which indicates that the model is significant, and it can be used to optimize the variables of the process under observation.
Hence, the applied model is adequate for the prediction of the acidity value in the range of experimental variables [31]. The significance of each coefficient measured using p- and F-values is listed in Table 2. The combination of small p-value and great F-value means that the corresponding variables would be highly significant [32].
The variable that affects almost the totality of the model is the weight of the sample (p-value (X1) = 0.0005. p-value (X12) = 0.0001). The other variables considered (concentration of titrator and indicator volume) are therefore not significant for the system under consideration and then they will not be discussed. Moreover, the only exception was for the volume of solvent. Indeed, this variable alone does not affect the system, but its interaction with weight of sample had a great influence on the model (p-value (X1,2 < 0.0001). Figure 1 shows the three-dimensional response surface for the only significant interaction.
Since the concentration of the titrant and the volume of the indicator does not affect the system (as expressed by the high p-values in Table 2), these two variables were fixed at the minimum value (0.01 N titer and 0.05 mL indicator). This measure was taken in order to ensure greater environmental and economical sustainability. The grid, shown in the Figure 1A, is located at the acidity value of 0.074%.
The prediction profiler (Figure 1D) highlights that by selecting the minimum value of the variables with the best accuracy (solvent volume, titration concentration, and indicator volume). Moreover, for the indicator volume, the interval of confidence (grey area) suggests choosing a small amount of volume. Indeed, up to 0.2 mL this interval exceeded the 5% limit. The control acidity value can be obtained only by using about 3.15 g of hempseed oil. Instead, by selecting the minimum oil weight (1 g) and leaving the other variables free is not possible to obtain the reference acidity value. Nevertheless, the application at this method proved to be highly efficient, as it allowed the miniaturization of the system and reduce the oil sample needed.

3.2. Peroxides Number

The peroxides number (P.N.) defines the degree of oxidative alteration of an oil by determining the primary products of fatty acid oxidation [33]. The sample is dissolved in acetic acid and chloroform with a solution of potassium iodide, and then a titration of iodine released with standardized sodium thiosulfate solution was performed. To optimize the method for determination of P.N. in hempseed oil, the standard method provided by the rules for EVOO was followed. Annex III to Regulation (EEC) No 2568/91 provides for a necessary amount of oil. which varies according to the P.N. For the hemp, the matrix is reported in literature [29] a P.N. value of 0–12 meqO2/kg, which requires 5 g of oil for analysis.
At first, a reference value was obtained using the regulation method. The peroxides number found in the hempseed oil sample chosen to perform the experiments was 11.04 ± 0.86 meqO2/kg. This value is determined three times on hemp oil using the standard method.
In this case, DOE was also performed by Central Composite Design (CCD). All the statistical results were shown in Table 3. Also, in this case the model results in being statistically correct according to R2 and R2adj coefficients [30]. Low p-value and CV% of the model indicate that the model is significant and can be used to optimize the variables of the process under study and the model can be used for the prediction of P.N. [32]. From this calculation, high F-Test value (15.66) and low p-value (0.0002) were found, which indicates that the model is significant, and it can be used to optimize the variables of the process under observation.
The variables that affect almost the totality of the model are: weight of the sample (p-value (X1) < 0.0001. p-value (X12) = 0.0062), the volume of solvent involved (p-value (X2) = 0.0211), and interaction between KI volume and titrator concentration (p-value (X3,4) = 0.0128). The other variables considered are therefore not significant for the system under consideration and will not be discussed. Figure 1B shows the three-dimensional response surface for the only significant interaction, KI volume vs titrator concentration.
The grid, shown in the figure, is located at the P.N. of 11.04. This value is experimentally determined on hemp oil using the standard method (Figure 1B).
In order to ensure greater environmental and economical sustainability, the minimum value of the variables with the best accuracy was selected in the prediction profiler (Figure 1E). Moreover, for the titrator concentration, the interval of confidence (grey area) suggests choosing a low concentration. Indeed, up to 0.0025 N, this interval exceeded the 5% limit. The reference P.N. can be obtained by using only 1.5 g of hempseed oil. On the contrary, by selecting the minimum oil weight and leaving the other variables free, it is not possible to obtain a right P.N. Therefore, in this case the application of DOE also results in being highly efficient and allows for miniaturization of the method and the reduction of sample and reagents involved.

3.3. Anisidine Number

The p-anisidine number (A.N.) was determined for the evaluation of secondary oxidation compounds in hempseed oil [34].
At first a reference value was obtained by using the regulation method. The anisidine number found in the hempseed oil sample chosen to perform the experiments was 4.20 ± 0.26. This value is determined three times on hemp oil using the standard method.
Central Composite Design (CCD) was also herein applied to optimize the A.N. method. All the statistical results were showed in Table 4. The model results are statistically correct according to R2 and R2adj coefficients [30]. CV% was not very low, but this method involved a spectrophotometric analysis that result in being less accurate than the titration in a general way. From this calculation were found high F-Test value (17.71) and low p-value (<0.001), which indicates that the model is significant, and can be used to optimize the variables of the process under observation.
Almost all the variables studied affect the model. B solution volume and the interaction between weight of sample and A solution volume result in being highly significant for the method with a p-value (X3), (X1,2) < 0.0001. The other variables that affect the model are: weight of the sample (p-value (X1) = 0.0038, p-value (X12) = 0.0393), the A solution volume (p-value (X2) = 0.0020, p-value (X22) = 0.0002), and the Anisidine volume (p-value (X4) = 0.0021). Also, some interactions are significant: weight sample—B solution volume (p-value (X1,3) = 0.0002), A solution volume—B solution volume (p-value (X2,3) = 0.0005), and weight of the sample—Anisidine volume (p-value (X1,4)= 0.0113). The other variables considered are therefore not significant for the system under consideration and then they will not be discussed. Only the more significant interaction is shown in Figure 1C as three-dimensional response surface. The other ones are shown in Figures S1–S3. The grid is fixed and located at the standard A.N.
In order to ensure greater environmental and economical sustainability, the minimum value of the variables with the best accuracy was selected in the prediction profiler (Figure 1F). The reference A.N. can be obtained only by using about 0.7 g of hempseed oil. The miniaturized method results in efficiency and allows the reduction of sample and reagents involved.

3.4. Optimized Methods

The optimized methods were reported in Table 5. The optimized methods were evaluated for repeatability (intra/extra day) and the accuracy. The optimized methods were: for free fatty acidity 3.15 g of hempseed oil, 10 mL of solvent, 0.05 mL of indicator and KOH 0.01 N; for peroxides number 1.5 g of sample, 5 mL of solvent. 0.25 mL of KI, and sodium thiosulfate 0.0005 N; for anisidine number 0.7 g of sample, 10 mL of Solution A. 2.5 mL of Solution B, and 0.5 mL of p-anisidine. The method was tested on 10 sample of hempseed oil, founded on GDO.
To evaluate the repeatability for each method, the analysis was carried out 5 times in a day (intra-day) for 5 consecutive days (extra-day). To evaluate the accuracy each day, the optimized methods were applied 3 times on the same sample and the results are shown in Table S4. These results show good repeatability and accuracy, proving that highlighting these new methods could be used to determinate these parameters in Hempseed oil.
All kinds of optimization lead to a miniaturization of the system. It is noteworthy that the saving of sample results up to 70% (for P.N.) and reach also the 84% for Free Fatty Acidity. The Hempseed oil required in the all optimized methods are around 18% (5.35 g vs. 29 g) of the one of the standard methods. In addition, also a great saving of reagents was achieved (Table 5).
A remarkable saving was achieved for solvents and reagents involved in the methods, starting from 50% (KI volume in P.N. and Anisidine volume in A.N.) to 90% (solvent volume required for Free Fatty Acidity). The use of a chemometric approach give us the possibility to optimize the most representative parameters that ensure the good state of storage of edible oil and the discrimination of seed oils from EVOO.

4. Conclusions

This study provides an optimization of the standard methods to determinate Free Fatty Acidity, Peroxides Number, and Anisidine Number of Hempseed oil. According to European [19] and international regulation [20], these parameters highlight a lot of information on the origin and the good state of storage of the samples.
The standard methods required a great amount of sample and reagents. In relation to the high cost of Hempseed oil (60–70 €/L), a miniaturization of these methods was carried out by using a chemometric approach. The CCD was applied to optimize the variables involved in these methods. For all the parameters studied a good model was built, with high significance (p-value ≤ 0.001) and low variability.
The miniaturized methods had good repeatability and accuracy and result in environmental and economical sustainability by using a smaller amount of chemicals (e.g., reagents, solvents), also reducing the production of waste and the sample required. These optimizations could lead to a new quality Regulation for hempseed oil.

Supplementary Materials

The following are available online at https://www.mdpi.com/2071-1050/11/11/3104/s1, Table S1: Central composite design matrix for Free Fatty Acidity, Table S2: Central composite design matrix for Peroxides Number, Table S3: Central composite design matrix for Anisidine Number, Table S4. Precision and accuracy of the miniaturized methods developed, Figure S1: Response surfaces for the interaction weight of sample—B solution volume for A.N. method, Figure S2: Response surfaces for the interaction A solution volume—B solution volume for A.N. method, Figure S3: Response surfaces for the interaction weight of sample—Anisidine volume for A.N. method,

Author Contributions

Conceptualization, M.R., S.C., A.R., F.D., R.R. and G.V.; methodology, M.R., S.C., A.R., F.D., R.R. and G.V.; software, M.R., S.C., A.R., F.D., R.R. and G.V.; validation, M.R., S.C., A.R., F.D., R.R. and G.V.; formal analysis, M.R., S.C., A.R., F.D., R.R. and G.V.; investigation, M.R., S.C., A.R., F.D., R.R. and G.V.; resources, M.R., S.C., A.R., F.D., R.R. and G.V.; data curation, M.R., S.C., A.R., F.D., R.R. and G.V.; writing—original draft preparation, M.R., S.C., A.R., F.D., R.R. and G.V.; writing—review and editing, M.R., S.C., A.R., F.D., R.R. and G.V.; visualization, M.R., S.C., A.R., F.D., R.R. and G.V.; supervision, M.R., S.C., A.R., F.D., R.R. and G.V.; project administration, M.R., S.C., A.R., F.D., R.R. and G.V.; funding acquisition, M.R., S.C., A.R., F.D., R.R. and G.V.

Funding

This research was funded by Sapienza University of Rome (Ateneo Sapienza 2017).

Conflicts of Interest

The authors declare no conflict of interest.

References

  1. Rijavec, T.; Janjic, S.; Acko, D.K. Revitalization of Industrial Hemp Cannabis sativa L. var, sativa in Slovenia: A Study of Green Hemp Fibres. Text. Tilec 2017, 60, 36–48. [Google Scholar]
  2. Amaducci, S.; Gusovius, H.-J. Hemp—Cultivation, Extraction and Processing. Ind. Appl. Nat. Fibres 2010, 109–134. [Google Scholar] [CrossRef]
  3. Karus, M.; Vogt, D. European hemp industry: Cultivation, processing and product lines. Euphytica 2004, 140, 7–12. [Google Scholar] [CrossRef]
  4. Callaway, J.C. Hempseed as a nutritional resource: An overview. Euphytica 2004, 140, 65–72. [Google Scholar] [CrossRef]
  5. Amaducci, S.; Scordia, D.; Liu, F.H.; Zhang, Q.; Guo, H.; Testa, G.; Cosentino, S.L. Key cultivation techniques for hemp in Europe and China. Ind. Crops Prod. 2015, 68, 2–16. [Google Scholar] [CrossRef]
  6. EUR-Lex. European Communities Council Regulation (EC) No 1251/1999. 1999. Available online: https://eur-lex.europa.eu/legal-content/en/ALL/?uri=CELEX%3A31999R1251 (accessed on 31 May 2019).
  7. Finnan, J.; Styles, D. Hemp: A more sustainable annual energy crop for climate and energy policy. Energy Policy 2013, 58, 152–162. [Google Scholar] [CrossRef]
  8. Zanetti, F.; Monti, A.; Berti, M.T. Challenges and opportunities for new industrial oilseed crops in EU-27: A review. Ind. Crops Prod. 2013, 50, 580–595. [Google Scholar] [CrossRef]
  9. Korus, J.; Witczak, M.; Ziobro, R.; Juszczak, L. Hemp (Cannabis sativa subsp. sativa) flour and protein preparation as natural nutrients and structure forming agents in starch based gluten- free bread. LWT 2017, 84, 143–150. [Google Scholar] [CrossRef]
  10. Da Porto, C.; Decorti, D.; Natolino, A. Potential oil yield, fatty acid composition, and oxidation stability of the hempseed oil from four Cannabis sativa L. cultivars. J. Diet. Suppl. 2015, 12, 1–10. [Google Scholar] [CrossRef] [PubMed]
  11. Matthäus, B.; Brühl, L. Virgin hemp seed oil: An interesting niche product. Eur. J. Lipid Sci. Technol. 2008, 110, 655–661. [Google Scholar] [CrossRef]
  12. Vyviurska, O.; Jánošková, N.; Jakubík, T.; Špánik, I. Comprehensive Two-Dimensional Gas Chromatography–Mass Spectrometry Analysis of Different Types of Vegetable Oils. J. Am. Oil Chem. Soc. 2015, 92, 783–790. [Google Scholar] [CrossRef]
  13. Scorletti, E.; Byrne, C.D. Omega-3 Fatty Acids, Hepatic Lipid Metabolism, and Nonalcoholic Fatty Liver Disease. Annu. Rev. Nutr. 2013, 33, 231–248. [Google Scholar] [CrossRef] [PubMed]
  14. Simopoulos, A.P. The importance of the ratio of omega-6/omega-3 essential fatty acids. Biomed. Pharmacother. 2002, 56, 365–379. [Google Scholar] [CrossRef]
  15. Willett, W.C. Dietary fats and coronary heart disease. J. Intern. Med. 2012, 272, 13–24. [Google Scholar] [CrossRef]
  16. Frassinetti, S.; Moccia, E.; Caltavuturo, L.; Gabriele, M.; Longo, V.; Bellani, L.; Giorgi, G.; Giorgetti, L. Nutraceutical potential of hemp (Cannabis sativa L.) seeds and sprouts. Food Chem. 2018, 262, 56–66. [Google Scholar] [CrossRef] [PubMed]
  17. Yu, L.L.; Zhou, K.K.; Parry, J. Antioxidant properties of cold-pressed black caraway, carrot, cranberry, and hemp seed oils. Food Chem. 2005, 91, 723–729. [Google Scholar] [CrossRef]
  18. Smeriglio, A.; Galati, E.M.; Monforte, M.T.; Lanuzza, F.; D’Angelo, V.; Circosta, C. Polyphenolic Compounds and Antioxidant Activity of Cold-Pressed Seed Oil from Finola Cultivar of Cannabis sativa L. Phytother. Res. 2016, 1307, 1298–1307. [Google Scholar] [CrossRef] [PubMed]
  19. European Commission. Commission Delegated Regulation (EU) 2015/1830 of 8 July 2015 Amending Regulation (EEC) No 2568/91 on the Characteristics of Olive Oil and Olive-Residue Oil and on the Relevant Methods of Analysis. 2015. Vol. L266. pp. 9–13. Available online: https://eur-lex.europa.eu/legal-content/EN/TXT/?uri=celex:32015R1830 (accessed on 31 May 2019).
  20. British Standards Institution. Animal and Vegetable Fats and Oils. Determination of Anisidine Value. Int. Stand. 2006. Available online: https://www.iso.org/standard/40052.html (accessed on 31 May 2019).
  21. Armenta, S.; Garrigues, S.; de la Guardia, M. Green Analytical Chemistry. TrAC—Trends Anal. Chem. 2008, 27, 497–511. [Google Scholar] [CrossRef]
  22. Sanz-Landaluze, J.; Bocanegra-Salazar, M.; Ortiz-Pérez, D.; Cámara, C. Miniaturisated method for the analysis of polycyclic aromatic hydrocarbons in leaf samples. J. Chromatogr. A 2010, 1217, 3567–3574. [Google Scholar] [CrossRef]
  23. Daneshvand, B.; Ara, K.M.; Raofie, F. Comparison of supercritical fluid extraction and ultrasound-assisted extraction of fatty acids from quince (Cydonia oblonga Miller) seed using response surface methodology and central composite design. J. Chromatogr. A 2012, 1252, 1–7. [Google Scholar] [CrossRef]
  24. Ghaedi, M.; Mazaheri, H.; Khodadoust, S.; Hajati, S.; Purkait, M.K. Application of central composite design for simultaneous removal of methylene blue and Pb2+ ions by walnut wood activated carbon. Spectrochim. Acta—Part. A Mol. Biomol. Spectrosc. 2015, 135, 479–490. [Google Scholar] [CrossRef] [PubMed]
  25. Ahmadi, M.; Vahabzadeh, F.; Bonakdarpour, B.; Mofarrah, E.; Mehranian, M. Application of the central composite design and response surface methodology to the advanced treatment of olive oil processing wastewater using Fenton’s peroxidation. J. Hazard. Mater. 2005, 123, 187–195. [Google Scholar] [CrossRef] [PubMed]
  26. Lefsih, K.; Giacomazza, D.; Dahmoune, F.; Mangione, M.R.; Bulone, D.; San Biagio, P.L.; Passantino, R.; Costa, M.A.; Guarrasi, V.; Madani, K. Pectin from Opuntia ficus indica: Optimization of microwave-assisted extraction and preliminary characterization. Food Chem. 2017, 221, 91–99. [Google Scholar] [CrossRef] [PubMed]
  27. Fratoddi, I.; Rapa, M.; Testa, G.; Venditti, I.; Scaramuzzo, F.A.; Vinci, G. Response surface methodology for the optimization of phenolic compounds extraction from extra virgin olive oil with functionalized gold nanoparticles. Microchem. J. 2018, 138, 430–437. [Google Scholar] [CrossRef]
  28. Gerasimenko, E.O.; Tur, Y.I. Automated flow pH-method for the determination of total free fatty acids content in edible oils. Food Chem. 2012, 132, 1562–1565. [Google Scholar] [CrossRef] [PubMed]
  29. Teh, S.-S.; Birch, J. Physicochemical and quality characteristics of cold-pressed hemp, flax and canola seed oils. J. Food Compos. Anal. 2013, 30, 26–31. [Google Scholar] [CrossRef]
  30. Maria, V.; Marchand, S.; De Revel, G.; Bordignon-luiz, M.T. Development and validation of method for heterocyclic compounds in wine: Optimization of HS-SPME conditions applying a response surface methodology. Talanta 2013, 117, 87–93. [Google Scholar] [Green Version]
  31. Almeida, M.; Erthal, R.; Padua, E.; Silveira, L.; Am, L. Response surface methodology ( RSM ) as a tool for optimization in analytical chemistry. Talanta 2008, 76, 965–977. [Google Scholar]
  32. Dahmoune, F.; Spigno, G.; Moussi, K.; Remini, H.; Cherbal, A.; Madani, K. Pistacia lentiscus leaves as a source of phenolic compounds: Microwave-assisted extraction optimized and compared with ultrasound-assisted and conventional solvent extraction. Ind. Crops Prod. 2014, 61, 31–40. [Google Scholar] [CrossRef]
  33. Isnen, M.; Nasution, T.I.; Perangin-angin, B. Design of Edible Oil Degradation Tool by Using Electromagnetic Field Absorbtion Principle which was Characterized to Peroxide Number. J. Phys. Conf. Ser. 2016, 739, 012076. [Google Scholar] [CrossRef] [Green Version]
  34. Bannenberg, G.; Mallon, C.; Edwards, H.; Yeadon, D.; Yan, K. Omega-3 Long-Chain Polyunsaturated Fatty Acid Content and Oxidation State of Fish Oil Supplements in New Zealand. Sci. Rep. 2017, 7, 1–13. [Google Scholar] [CrossRef] [PubMed] [Green Version]
Figure 1. Response surfaces and prediction profiles of free fatty acidity (A,D), peroxides number (B,E), and anisidine number (C,F).
Sustainability 11 03104 g001
Table 1. Variables and levels chosen for the experimental design built (* values reported in the standard methods).
Quality ParametersVariablesLevels
Free Fatty AcidityHempseed oil1—10.5—20* g
Solvent Volume10—55—100* mL
Indicator Volume0.05—0.175—0.3* mL
KOH concentration0.01—0.055—0.1* N
Peroxides NumberHempseed oil0.1—2.55—5* g
Solvent Volume5—15—25* mL
KI Volume0.1—0.3—0.5* mL
Na2SO4 concentration0.0005—0.00275—0.005* N
Anisidine NumberHempseed oil0.1—2.05—4* g
A solution Volume10—17.5—25* mL
B solution Volume2.5—3.75—5* mL
p-Anisidine Volume0.5—0.75—1* mL
Table 2. Estimated regression coefficients for the quadratic polynomial model and the analysis of variance (ANOVA) for the experimental results for free fatty acidity method (* values reported in the standard methods).
ParameterEstimated CoefficientS.D.Sum of SquareLog of ValenceF-Valuep > F
MODEL--0.58-27.38<0.0001 *
Intercept
Q0−0.791.05----
Linear
Weight(1,20)−0.310.0650.0343.34122.750.0005 *
Volume(10,100)−0.030.0650.00030.1930.230.6415
Indicator(0,05,0,3)−1.161.280.00120.4170.820.3826
Titrator(0.01.0.1)−0.130.0650.00651.2204.300.0602
Interaction
Weight*Volume−0.060.00970.0124.66044.93<0.0001 *
Weight*Indicator−0.110.0390.0031.8288.070.0149
Volume*Indicator−0.010.0390.00371.4841.990.1828
Weight*Titrator−0.550.00970.00880.8402.430.1446
Volume*Titrator−0.020.00970.00870.7385.820.0328
Indicator*Titrator−0.090.0390.0121.4665.710.0342
Quadratic
Weight*Weight0.130.0240.0453.83429.750.0001 *
Volume*Volume0.050.0240.00591.1483.920.0711
Indicator*Indicator−0.370.390.00140.4530.940.3524
Titrator*Titrator−0.030.0240.00210.5771.370.2648
STATISTICS
R20.97-----
R2adj0.93-----
RMSE0.0039-----
CV %2.14-----
Table 3. Estimated regression coefficients for the quadratic polynomial model and the analysis of variance (ANOVA) for the experimental results for peroxides number method (* values reported in the standard methods).
ParameterEstimated CoefficientS.D.Sum of SquareLog of ValenceF-Valuep > F
Model--19.9526-15.660.0002*
Intercept
Q010.261.11----
Linear
Weight(1.20)−4.130.44113.224.88088.85<0.0001 *
Volume(5.25)1.250.4410.431.6758.180.0211 *
KI(0.1.0.5)0.730.443.540.8722.780.1342
Titrator(0.0005.0.005)−2.163.530.480.2540.370.5569
Interaction
Weight*Volume0.330.281.780.5671.390.2709
Weight*KI0.230.280.850.3590.670.4378
Volume*KI−0.0820.280.100.1070.0830.7811
Weight*Titrator−0.0630.590.0150.0380.0120.9166
Volume*Titrator0.210.580.160.1380.130.7284
KI*Titrator1.850.5812.981.89410.180.0128 *
Quadratic
Weight*Weight2.650.7217.312.21013.590.0062 *
Volume*Volume−1.130.723.160.8132.480.1537
Indicator*Indicator0.480.720.570.2840.450.5205
Titrator*Titrator−2.412.910.880.3650.690.4312
STATISTICS
R20.97-----
R2adj0.91-----
RMSE0.36-----
CV %3.02-----
Table 4. Estimated regression coefficients for the quadratic polynomial model and the analysis of variance (ANOVA) for the experimental results for anisidine number method (* values reported in the standard methods).
ParameterEstimated CoefficientS.D.Sum of SquareLog of ValenceF-Valuep > F
Model--118.36-17.71<0.0001 *
Intercept
Q02.370.32----
Linear
Weight(0.2.4)−0.730.209.682.41512.750.0038 *
A sol. (mL)(10.25)0.810.2011.782.70615.510.0020 *
B sol. (mL)(2.5.5)1.370.2033.674.63244.33<0.0001 *
p-Anisidine (mL)(0.5.1)−0.800.2011.582.68015.250.0021 *
Interaction
Weight (g)*A sol. (mL)−1.580.2239.934.99452.58<0.0001 *
Weight (g)*B sol. (mL)−1.130.2220.693.66827.250.0002 *
A sol. (mL)*B sol. (mL)1.040.2217.303.34322.780.0005 *
Weight (g)*Anisidine (mL)0.650.226.791.9488.940.0113 *
A sol. (mL)*Anisidine (mL)0.470.223.571.2924.700.0510
B sol. (mL)*Anisidine (mL)−0.290.221.400.7021.850.1985
Quadratic
Weight*Weight−1.250.544.061.4065.350.0393 *
A sol. (mL)*A sol. (mL)1.650.547.071.9989.310.0101 *
B sol. (mL)*B sol. (mL)0.660.541.110.6041.470.2491
Anisidine (mL)*Anisidine (mL)1.160.543.461.2674.560.0540
STATISTICS
R20.95-----
R2adj0.90-----
RMSE0.26-----
CV %6.86-----
Table 5. Comparison of standard and optimized methods and their relative saving.
ParameterVariablesStandard MethodOptimized MethodSaving
Free Fatty AcidityWeight (g)203.1584%
Solvent Volume (mL)1001090%
Titrator Concentration (N)0.10.0550%
Indicator Volume (mL)0.30.0197%
Peroxides NumberWeight (g)51.570%
Solvent Volume (mL)25580%
KI Volume (mL)0.50.2550%
Titrator Concentration (N)0.0020.000575%
Anisidine NumberWeight (g)40.782%
Isooctane Volume (mL)251060%
Solvent Volume (mL)52.550%
Anisidine Volume (mL)10.550%

