Identifying Human-Induced Spatial Differences of Soil Erosion Change in a Hilly Red Soil Region of Southern China


1
State Key Laboratory of Resources and Environmental Information System, Institute of Geographic Sciences and Natural Resources Research, Chinese Academy of Sciences, Beijing 100101, China
2
University of Chinese Academy of Sciences, Beijing 100049, China
3
School of Geography and Tourism, Chongqing Normal University, Chongqing 401331, China
*
Author to whom correspondence should be addressed.
Sustainability 2019, 11(11), 3103; https://doi.org/10.3390/su11113103
Submission received: 15 April 2019
/
Revised: 16 May 2019
/
Accepted: 25 May 2019
/
Published: 1 June 2019
(This article belongs to the Special Issue Soil Erosion and the Sustainable Management of the Landscape)
Abstract
:Soil erosion (SE) processes are closely related to natural conditions and human activities, posing a threat to environment and society. Identifying the human impact on regional SE changes is increasingly essential for pertinent SE management. Jiangxi province is studied here as a representative area of hilly-red-soil regions within southern China. The main objectives of this study were to investigate the changing trend of SE within Jiangxi and identify human impacts on regional SE change from the perspective of spatial differences, through a new approach based on a gravity-center model. Our results showed that SE status presented an overall amelioration from 1990 to 2015, while the average soil erosion modulus (SEM) declined from 864 to 281 Mg/(km2·a). Compared to the situation under human and natural impacts, human-induced spatial differences of SE change demonstrated that the western and northwest regions showed stronger negative effects; the southern region shifted towards negative effects; the northeast region presented a much weaker negative effect. Our results indicated that 4 cities with strong negative effects need more attention in further SE management suited to their local conditions and development, and also suggested that the approach based on a gravity-center has potential for identifying the human impact on regional SE change from the perspective of spatial patterns.
1. Introduction
Soil erosion (SE) is a universal environmental issue that directly leads to land degradation and grain reduction, threatening food and environmental security especially in developing countries [1,2]. China is one of the most vulnerable countries to soil erosion, as vulnerable areas cover more than 30 percent of China’s mainland area [3]. Soil erosion processes are closely related to not only natural factors (mainly rainfall, topography and soil types) but also to various human factors such as land-use change, deforestation and urban construction. With dramatic demographic and economic growth especially after the 20th century, human impacts are considered to be important drivers leading to drastic changes in soil erosion [1,4,5,6].
Within the last few decades, human impacts on SE change have become an increasingly serious issue for environment protection at the regional scale, and thus have drawn considerable concerns [6,7,8,9,10,11]. Due to complex interactions with natural conditions and multi-directional impacts on soil erosion, human factors are difficult to be identify comprehensively at the regional scale [1,12,13,14]. Research on identifying SE change driven by human activities has mainly focused on some specific perspectives such as land use change, socioeconomic progress and local practices [8,9,10,15,16]. However, studies were rarely devoted to identifying the human impact on SE change from the perspective of spatial differences. At the regional scale, SE changes were spatially different due to local geological constraints and socioeconomic development [17], leading to spatial pattern change. Identifying human-induced spatial differences of SE change can help us to further understand the formation of spatial patterns, and thus develop more efficient and useful measures on SE management at the regional scale.
The gravity-center model has been widely applied in the field of spatial analysis for areas such as population distribution, land use pattern and climate changes since the application of the gravity-center had been extended into the socioeconomic field from physics [18,19,20,21,22,23,24]. Jie Fan et al. (2010) detected the coupling mechanism of economic and population development in China by using the gravity-center model [21]. Ming Zhang et al. (2014) identified that Asia became the gravity-center of global CO2 emissions during the period of 1965 to 2011 [20]. Distance and orientation of gravity-center migration are helpful indicators of variation in spatial phenomena [22]. The vector is a basic concept of mathematics and physics, with properties of length as magnitude and orientation as direction in space that are suitable for measuring some spatial phenomena [25,26]. Aron Kincses and Ceza Toth (2014) investigated the impact of each of the sub-regions on the regional economic development of Hungary by characterizing economic features of sub-regions into vectors with attributes of size and orientation [25], which was also used to detect the economic spatial structure of Europe [26]. The combination of the gravity-center model and the vector model provide a new approach to distinguishing human impacts on regional SE change from the perspective of a spatial pattern.
Jiangxi province, one of the hilly-red-soil regions of southern China, has erosion-prone natural conditions [2]. Within Jiangxi there are many water systems, among which Poyang Lake is the largest fresh water lake in China, and Ganjiang river basin is the most important tributary of the Yangtze River. Meanwhile, as an important region in the rise of central China strategy proposed by the Chinese government, Jiangxi province has experienced rapid socioeconomic development during the period of 1990–2015, which has led to land-use change, urbanization and ecological reconstruction [27]. Our study aims to: (1) investigate the changing trend of SE within Jiangxi province over time; and (2) identify human-induced spatial differences of regional SE change from the perspective of spatial pattern through a new approach based on gravity-center. Our study is essential not only for an improved understanding of regional SE change, but also for supporting decision-making of soil erosion management, supervision and prevention. We stress that this is the first study effort to identify human-induced spatial differences of SE change in the hilly-red-soil regions of southern China, through models developed on the basis of the gravity-center.
2. Study Area and Materials
2.1. Study Area
Jiangxi province lies between 113°34′–118°29′E longitude and 24°29′–30°04′N latitude, located at the south bank of the middle and lower reaches of the Yangtze River (Figure 1). Jiangxi is characterized by a typical moist, subtropical climate, with a mean annual temperature of 17.7 °C and a rainfall of 1786 mm. The whole region covers 11 province-controlled cities with an area of 166,900 km2, including 30.40% mountainous area and 44.40% hilly area, which results in a fluctuant and complicated ground surface. Red soil, belonging to Ferralsols, is the dominant type of soil distributed widely in the region which accounts for 56% of the total, which was developed from quaternary sediments with a low infiltration rate of precipitation and a great possibility of erosion. Those types of soil make Jiangxi province one of the typical erosion-prone areas in China. In 2001, Jiangxi province suffered from the severest soil erosion among the hilly-red-soil regions of southern China. In 1985 the project of Mountain-River-Lake was launched in the province, and then a number of ecological reconstruction projects were implemented, such as Grain-for-Green and forest conservation projects. Since the strategy of the rise in central China proposed by the Chinese government in 2004, Jiangxi province entered an industrial transformation period along with a rapid development of modernization and urbanization.
2.2. Materials
Table 1 presents the details of required data in this study. To generate spatial distribution data of soil erosion in Jiangxi province during 1990–2015, the data of land use, rainfall, soil, DEM and Normalized Difference Vegetation Index (NDVI) were collected. Based on land use, land can be classified as arable land, woodland, grassland, water bodies, built-up land, and unused land, with 6 types of upper-level classifications and 25 s-tier classifications [28].
ArcGIS 10.2 was used for analysis of spatial features and generation of distribution maps. MATLAB R2015b was used to calculate all the gravity-centers in the present study.
3. Methods
3.1. RUSLE Model
RUSLE is one of the most widely adopted models to generate soil erosion spatial data in many regions at different scales [29,30,31,32,33,34]. It presents a clear perspective to understand the interaction of soil erosion and relative factors, as shown below:
where A is the average soil loss of one year (Mg/(km2·a)); R is rainfall erosivity (MJ·mm/(km2·h·a)); K is soil erodibility (Mg·km2·h/(km2·MJ·mm)); L and S refers to slope length and steepness (dimensionless); C represents vegetation coverage and management (dimensionless); P stands for erosion control practices (dimensionless).
ArcGIS 10.2 was chosen to prepare factors for the model and visualize the results. The final results of A and its influencing factors were unified at the spatial resolution of 1000 m. To simulate the spatial distribution of soil erosion suited to local conditions, some parameters were adjusted for factors that were calculated according to the regional characteristics of Jiangxi province [2].
R was calculated through the fitting model of rainfall built by Zhang et al. (2002), represented by the summation of 24 half-months’ rainfall erosivity of one year [35]. The equations of R are as follows:
where is the erosivity of the year (one year is divided into 24 half-months); is the erosivity of the half-month; is the daily average erosive rainfall (erosive rainfall is identified while the daily rainfall exceeds 12 mm); is the annual erosive rainfall; is the rainfall of the kth day; k is the number of erosive rainfall days during half-month.
K was simulated based on the soil database, soil texture data and soil carbon pool by using the method of William et al. [36], through the following equation:
where SIL is the silt fraction; SAN is the subsoil sand fraction; CLA is the clay fraction (%); C is the topsoil carbon content (%).
L and S was obtained by a revised formula suited to the hilly area of south China [34], based on the initial value of slope length and steepness extracted from DEM at the spatial resolution of 30 m of Jiangxi province. The equation of L and S are as follows:
where S is the steepness factor; L is the slope length factor; γ is the slope length of horizontal; θ is the slope of DEM (%); m is the constant.
C, ranging from 0–1, was acquired via the equation built by Cai et al. (2000) based on land use data and NDVI [37]. The equation of C is as follows:
where f is the vegetation coverage based on NDVI.
P, ranging from 0 to 1, was confirmed on basis of land use data referring to valuation method of Chen et al. (2014) [34]. In our study, P of dry land, paddy field, forest, open forest, shrub, other woodland, grass, construction land, water area and other land is set at 0.4, 0.15, 1, 1, 1, 0.7, 1, 0, 0 and 1 respectively.
Moreover, the temporal variation of K and LS was not considered, since soil type and terrain features were assumed to be stable in this study.
3.2. Gravity-Center Model of Soil Erosion
The gravity-center is the point of an object where its weight is balanced, which was a concept of physics originally [38]. The gravity-center of SE refers to its central location where the spatial forces of all pixels with soil erosion modulus (SEM) in a region are in balance. The SE gravity-center in the time T () can be measured by SEM and the geographic coordinate of each pixel, as expressed below [20]:
where are the X-coordinate and Y-coordinate of the SE gravity-center in time T respectively; is the SEM of pixel i in time T (ranging from 1 to n); n is the number of spatial pixels of the study area; are the X-coordinate and Y-coordinate of the ith pixel in the time T, respectively.
Similar to the SE gravity-center, that of rainfall erosivity is calculated as the following equations [20]:
where are the X-coordinate and Y-coordinate of gravity-center of rainfall erosivity in time T, respectively; is the rainfall erosivity of pixel i (ranging from 1 to n) in time T; n is the number of spatial pixels of the study area; are the X-coordinate and Y-coordinate of the ith pixel in the time T, respectively.
3.3. Gravity-Center’s Migration VECTOR model
According to the gravity-center’s migration of regional SE, the central location of spatial distribution is moving, then the spatial pattern is changing over time. The migration of gravity-center is determined by distance and orientation, hence being regarded as a vector. The migration vector model of the gravity-center can be built to measure the changing trend of the gravity-center of regional SE, and to lay a foundation for separating the contribution rate of natural and human impacts on migration.
The gravity-center’s migration was impacted by both natural and human factors. The former factors mainly include rainfall, topography and soil types, among which topography and soil types at the regional scale could be regarded as being temporally stable from the perspective of a spatial pattern. The temporal variations of vegetation cover during 1990–2015 in Jiangxi province were classified as human impacts since they experienced the remarkable effect of human activities such as Grain-for-Green and forest conservation projects [2]. Therefore, variation of rainfall erosivity became the dominant natural factor affecting the gravity-center migration of regional SE in our study. Hence the migration vector of the gravity-center could be separated into two sub-vectors influenced by rainfall and human factors respectively, just as shown in Figure 2.
According to the basic vector algorithm, the relationship between vector and sub-vectors can be expressed as the following equation:
where is gravity-center migration of regional SE; is human impact on gravity-center migration of regional SE; is gravity-center migration of regional rainfall erosivity.
To discuss spatial pattern change clearly from different spatial orientations, according to the algorithm, the vector could be divided into X and Y components, representing the orientation of longitude and latitude separately. Then, the contribution rate of human factors to the gravity-center’s migration of regional SE is calculated as the following equations:
where are the contribution rates of human impact on the gravity-center migration of regional SE, from longitude and latitude relatively; are contribution rates of rainfall erosivity on gravity-center migration of regional SE, from longitude and latitude respectively; () and () are the gravity-centers of regional SE in time T + 1 and T, respectively; () and () are the gravity-centers of regional rainfall erosivity in time T + 1 and T, respectively.
3.4. Contribution Rate Decomposition Model
In order to identify the spatial differences of SE change which led to the gravity-center’s migration of regional SE, we developed the contribution rate decomposition model. It was assumed that the region S was made up of a number of sub-regions, namely S = {1, 2, …, k, …, m − 1, m} [25], then gravity-center’s migration of region S was resulted from the impacts of all the sub-regions. The contribution rate of sub-region k on gravity-center’s migration of the whole regional SE can be obtained as:
where and are the contribution rates of sub-region k to the gravity-center migration of SE, from longitude and latitude respectively; are the impacts of region k on the gravity-center migration of SE, from longitude and latitude respectively; m is the number of sub-regions; k is one of the m sub-regions.
Based on the assumption of the whole region S and its m sub-regions, are calculated according to the following equations:
where are the sub-vectors of the gravity-center migration of SE in the whole region from longitude and latitude respectively; are the sub-vectors of the gravity-center migration of SE in the whole region without sub-region k (Figure 3), from longitude and latitude respectively.
Similarly, and can be obtained, representing contribution rates of sub-region k to the gravity-center migration of rainfall erosivity from longitude and latitude, respectively.
Lastly, the contribution rate of sub-region k to Gravity-center migration of the whole region under human influence is calculated as:
where and are contribution rates of sub-region k to gravity-C of the whole region under human influences from longitude and latitude respectively; and are contribution rates of sub-region k to the gravity-center migration of SE from longitude and latitude respectively; and are contribution rates of sub-region k to gravity-center migration of rainfall erosivity from longitude and latitude respectively; and are contribution rates of human influence to gravity-center migration of regional SE from longitude and latitude respectively; are contribution rates of rainfall erosivity on gravity-center migration of regional SE, from longitude and latitude respectively; and can be regarded as the weighting factor in the calculation.
In addition, to reveal the spatial differences of SE change, Jiangxi province was divided into 11 sub-regions based on the administrative regions (principle-controlled cities) in our study (Figure 1) for further analysis combined with their social and economic development.
4. Results
4.1. Regional SE Change
Referring to the classification standard of SEM established by Ministry of Water Resources of the People’s Republic of China, SEM calculated by RUSLE was classified into 6 grades (Table 2), which were valuated as 1 to 6 from tolerable to destructive. The spatial distribution of SE grade in Jiangxi province in 1990 and 2015, and the changes of SE grade are shown in Figure 4. From 1990 to 2015, the SE status of the whole region experienced an obvious amelioration, with average SEM of the whole region declining from 864 Mg/(km2·a) to 281 Mg/(km2·a).
From 1990 to 2015, among the influencing factors in RUSLE, K and LS were considered to be temporally stable. Among the influencing factors of RUSLE, R, which was the very foundation of further analysis through the gravity-center model, showed an overall increasing trend from an average value of 10,208 to 15,265 MJ·mm/(km2·h·a). The spatial distribution of R (Figure 5) demonstrated that northeast region had the most remarkable increasing trend. However, the changing trend of C and P factors could not be read as obviously as R from the maps of spatial distribution, while the average value of C and P were decreased 0.08 and 0.01 respectively during the period.
From 1990 to 2015, differences are found in SE change of sub-regions in Jiangxi province, divided by units of province-controlled city (Table 3). SEM of all the sub-regions is decreased, at different change ratios. Among the 11 cities, Yingtan has the highest ratio of 82.10%, while Jiujiang has the lowest ratio of 44.31%.
4.2. Spatial Pattern of Regional SE Change
With the changing trend of overall amelioration and localized deteriorations from 1990 to 2015 within Jiangxi province, the regional SE gravity-center was moving towards the northeast, while the human-induced migration direction of the SE gravity-center was northwest (Figure 6). Table 4 showed that the direction of human and rainfall impact on the gravity-center migration of regional SE were opposite from the longitude, while being consistent with the latitude. It could be inferred from the values of the contribution rate that the human impact on the gravity-center migration of regional SE was notable. In order to better understand the spatial pattern change deduced by gravity-center’s migration of regional SE, we generated the regional center of Jiangxi province as a reference point.
In Figure 7, GC represented the gravity center. Based on the longitude, the SE gravity-center moved toward the east, located to the east of the regional center (Figure 7a). Under human influence, the SE gravity-center moved toward the west and closer to regional center (Figure 7b). This indicated that SE condition of eastern Jiangxi was worse than its western part, and the spatial imbalance of SE distribution was aggravated during the period. However, the spatial pattern of balance was improved in 2015 under human influence.
From latitude, the SE gravity-center moved toward north, located to the south and north of regional center in 1990 and 2015 respectively, closer to the regional center in 2015 compared to 1990 (Figure 7a). Under human influence, the SE gravity-center moved toward the north, located to the south of the regional center, being closer to the regional center in 2015 than in 1990 (Figure 7b). The SE condition of southern Jiangxi was found to be worse than the western part in 1990, which shifted the opposite way in 2015 due to the spatial imbalance of SE distribution being alleviated. However, under human influence, the SE condition of southern Jiangxi was worse than the northern part both in 1990 and 2015, and the spatial imbalance of SE distribution was alleviated during the period.
4.3. Spatial Differences of SE Change
The gravity-center’s migration of regional SE was driven by all of the sub-regions, whose contribution rates could be identified under combined and human influence respectively, from the longitude and latitude. The contribution rate of the sub-regions measured the impacts of their SE changes on the gravity-center’s migration of regional SE. During the period, the SE status of 11 sub-regions showed an obvious ameliorating trend. However, the gravity-center of regional SE was moving, indicating a different ameliorating degree between the sub-regions, thus leading to a spatial pattern change of regional SE.
Based on the contribution rate and the relatively spatial location of 11 sub-regions, their differences of soil erosion changes could be identified as two types, namely positive and negative, to different extents. Positive ones represented that the SE status of the sub-regions had better ameliorating trends over time, by contrast, the negative ones indicated relatively worse amelioration trends. Moreover, the absolute values of the sub-regions’ contribution rates represented the extent of the positive or negative trend of the spatial differences.
4.3.1. Spatial Differences of SE Change under Natural and Human Influence
Spatial differences of SE change (Figure 8) showed that 5 sub-regions, namely Jiujiang, Pingxiang, Shangrao, Xinyu and Yichun showed negative trends, among which Shangrao had the most dramatic extent, followed by Jiujiang. The other 6 sub-regions displayed positive trends, among which Ganzhou had the most dramatic rate, followed by Fuzhou.
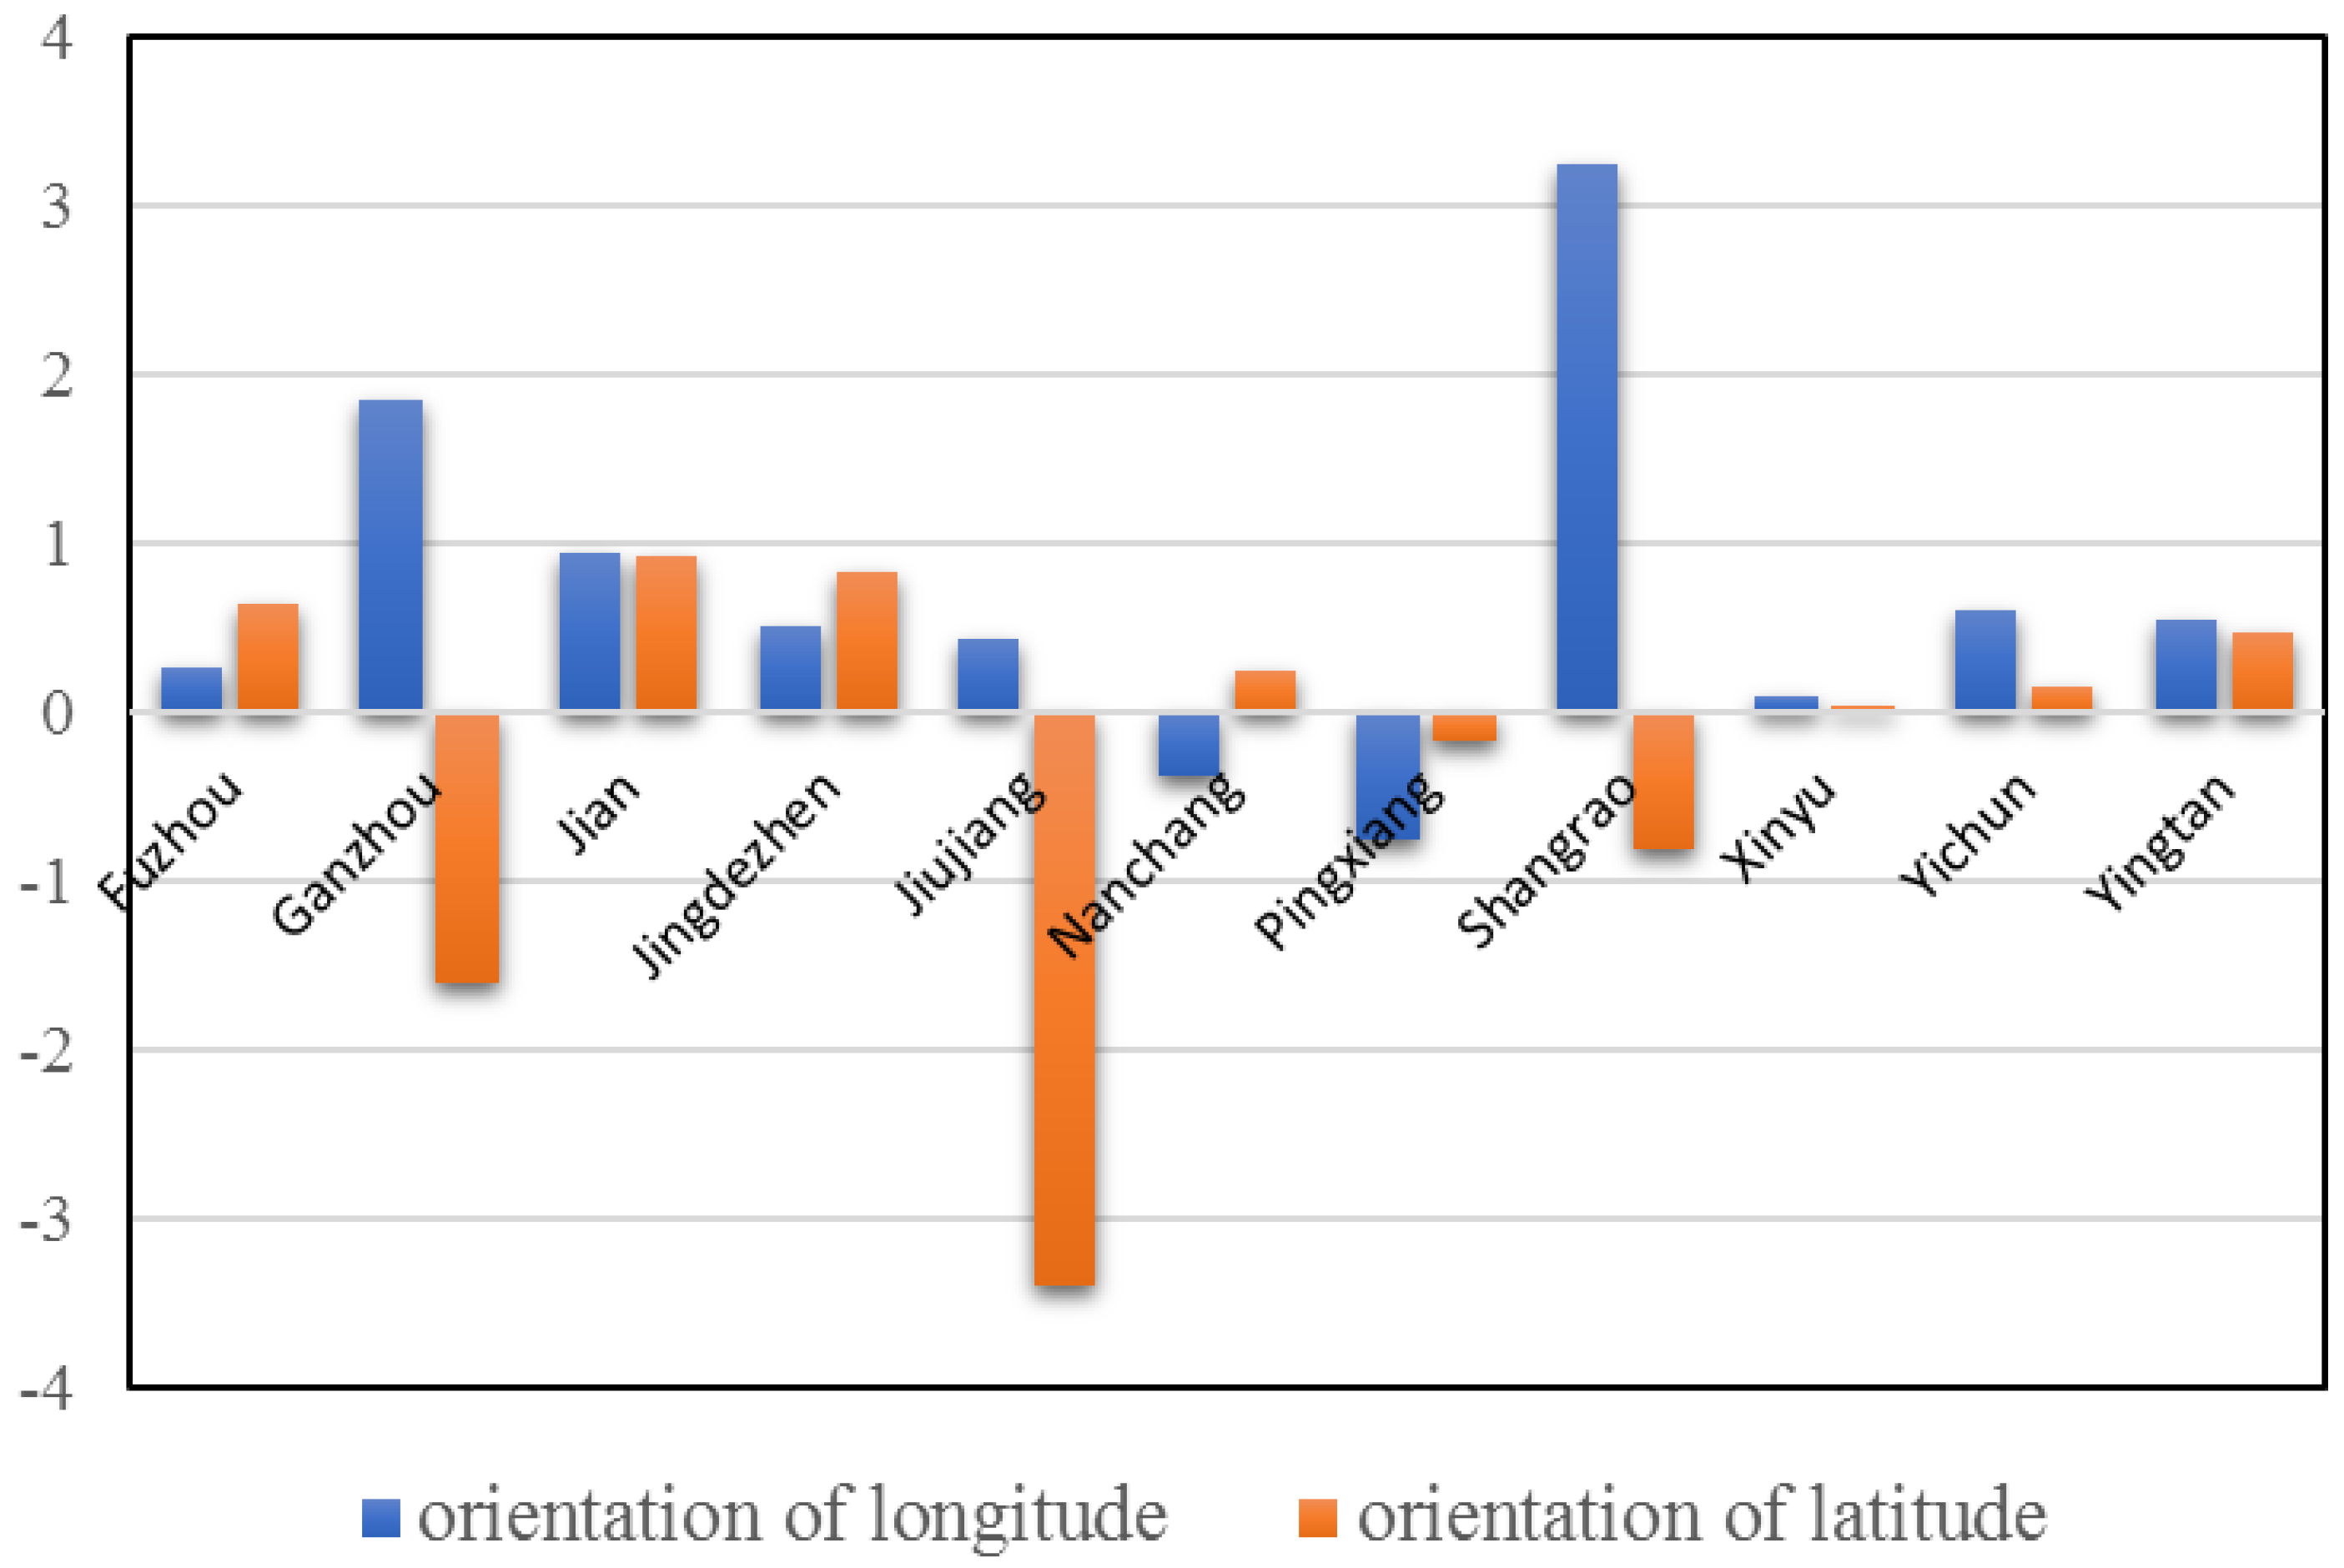
4.3.2. Human-Induced Spatial Differences of SE Change
Human-induced spatial differences of SE change (Figure 9) showed that Jiujiang, Pingxiang and Shangrao had negative trends, but Shangrao had an obviously lower trend as it did not face the combined influences of human and natural factors. Fuzhou, Jian, Jingdezhen and Yingtan exhibited positive trends under both combined and human influence, with no apparent difference in extent. Notably, Ganzhou had remarkable changes, showing a negative trend under human influence, but a positive trend under combined influences. Nanchang had a similar change to Ganzhou, but to a lesser extent. In addition, Xinyu and Yichun exerted positive trends under human influence, and negative effects under combined influences.
5. Discussion
Based on simulated spatial distribution of SE, from 1990 to 2015, there was an overall amelioration of the SE status in Jiangxi province, which could be attributed to human impacts. According to statistics of the Jiangxi Province Water Resources Bureau, land area subjected to SE has undergone a gradual decrease since 1987, specifically from 46,153km2 to 26,497km2 in 2011 [39,40]. The major explanations of this ameliorating trend are given below. (1) From the perspective of government, the issue of SE has been highly emphasized. A series of projects for SE control and prevention were launched, such as the Mountain-River-Lake project, the Grain-For-Green project and the Sloping-Farmland Treatment project, which have had positive impacts on soil conservation [2,41]. This was followed by the strengthening of law enforcement and supervision. (2) From the societal perspective, the adjusting of the industrial structure and forming of the market economy brought a great relief from the pressure from rural labor on natural resources, moreover, environmental awareness of the society was also largely improved, promoting the efficiency of SE control [27,39,42].
From 1990 to 2015, SE change in Jiangxi appeared to show spatial differences due to complicated natural factors and human activities. After removing the natural impact, human-induced spatial differences of regional SE change were identified from the perspective of a spatial pattern, which was detected through the approach based on the gravity-center model. During the study period, Jiangxi was at the stage of rapid industrialization and urbanization, especially since the development target of striving for the rise in central China was proposed in 2004 [27]. (1) Cities located at northern Jiangxi around Poyang lake, such as Nanchang, Jiujiang and Shangrao are important areas for the construction of the Poyang lake city group, however, SE control processes within such areas were lagging compared to trends of exploitation and construction [43]. (2) Pingxiang was a resource-exhausted city with concentrated development of a mining industry economy. Nevertheless, not enough attention was paid to ecological problems along with mining, and key projects of soil conservation were much less frequently launched [44]. (3) Ganzhou had an extremely severe SE status in the 1980s, which was improved after several decades of treatment. However, its ecological environment was still fragile, making it more prone to suffer from human-induced erosion [45]. Being the biggest city of Jiangxi, large numbers of exploitation and construction projections were implemented but with traditional methods. Weak soil-conservation awareness made the situation even worse [43,45]. According to the Jiangxi Bulletin of Soil and Water Conservation of 2015, under the supervision and inspection of SE control during the process of construction, there were 121 cases which violated laws and regulations related to soil and water conservation in Jiangxi province, among which 97 cases were found in Ganzhou [42]. As a result, Ganzhou showed an obvious negative effect under human influence, despite its advances under combined influences. (4) Shangrao is located at the area with the strongest rainfall erosivity in Jiangxi [2], making it more likely to suffer from rainfall-induced erosion.
Human-induced spatial differences of regional SE change in Jiangxi province were identified, which are helpful to further understand the formation of spatial patterns, then to support erosion management methods that are applicable to local conditions and development. Jiujiang and Pingxiang showed notably negative effects under both combined and human influence, indicating that more attention should be paid to SE control and prevention, especially erosion induced by exploitation and construction. SE change of Ganzhou and Nanchang presented negative effects under human influence while it still showed a positive trend under combined influences, which raised an alarm that SE control in these cities was prone to be ignored since the superficial amelioration of SE, and that erosion induced by construction and exploitation should be taken seriously. Shangrao had a much weaker negative effect under human influence compared to combined influences, demonstrating the vital role of rainfall in erosion, thus, measures aimed at strengthening the capability of anti-rainfall-erosivity, such as vegetation coverage improvement and sloping-farmland treatment, should be increasingly highlighted.
Overall, human influence was proved to have a concerning impact on spatial differences of SE change. With the economic growth dominated by industry, there will be more frequent exploitation and construction, as well as more intense human effects on SE. SE control of Jiangxi province based on local conditions should arouse more attention. In particular, SE prevention and supervision should not be overlooked, since processes of exploitation and construction may bring about drastic erosion.
6. Conclusions
Over the period studied, 1990–2015, the SE status within Jiangxi province presented an overall amelioration which could mainly be attributed to human impacts, with the average regional SEM having declined from 864 to 281 Mg/(km2·a). Human-induced spatial differences of SE change were identified through a new approach based on the gravity-center and vector models, from the perspective of spatial patterns.
Compared to the situation under natural and human influences, human-induced spatial differences of regional SE change indicated that SE change of Jiujiang and Pingxiang showed stronger negative effects, mainly caused by intense exploitation and construction along with insufficient protection; Ganzhou’s trend was transformed from a positive one into a negative one, indicating that it was more likely to be ignored in SE supervision; Shangrao presented a much weaker negative effect, as it was subjected to much stronger rainfall erosivity. More attention should be paid to cities with strong negative effects, namely Jiujiang, Ganzhou, Pingxiang and Shangrao. In further SE management of these cities with negative effects, measures need to be adjusted based on localized conditions and development.
Through the gravity-center migration vector model and the contribution rate decomposition model, human-induced spatial differences of SE change were explored from the perspective of spatial patterns, and sub-regions that need to be emphasized in further SE management were identified. The results were in accord with the actual development of Jiangxi province to a certain degree. The proposed method on the basis of the gravity-center model in this study has been proven as being feasible and effective, which grants it potential to provide a methodological reference for the identification of human impacts in other regions. However, to effectively use this method, the space and time scale of the study area should be selected based on the detection of spatial pattern change. Moreover, contributing factors for SE change should also be explicitly considered that are suited to regional conditions. In addition, human impacts on regional SE change have been regarded as an entirety at present, thus discriminating the specific human factors that affect regional SE change is worth studying further.
Author Contributions
Conceptualization, D.H. (Dong Huang) and X.Y.; Funding acquisition, X.Y.; Methodology, D.H. (Dong Huang) and Z.X.; Project administration, X.Y.; Software, D.H. (Dong Huang) and D.H. (Dongrui Han); Supervision, H.C.; Validation, D.H. (Dongrui Han); Visualization, D.H. (Dong Huang) and Z.X.; Writing—original draft, D.H. (Dong Huang); Writing—review & editing, D.H. (Dong Huang), X.Y. and H.C.
Funding
This research was funded by the Project of the National Natural Science Foundation of China (Grant No. 41771460), and the Strategic Priority Research Program of Chinese Academy of Sciences (Grant No. XDA20010203).
Conflicts of Interest
The authors declare no conflict of interest.
References
- He, X.; Jie, Z.; Zhang, X.; Tang, K. Soil erosion response to climatic change and human activity during the Quaternary on the Loess Plateau, China. Reg. Environ. Chang. 2006, 6, 62–70. [Google Scholar] [CrossRef]
- Xiao, L.; Yang, X.; Chen, S.; Cai, H. An assessment of erosivity distribution and its influence on the effectiveness of land use conversion for reducing soil erosion in Jiangxi, China. Catena 2015, 125, 50–60. [Google Scholar] [CrossRef]
- Zhang, H.; Cheng, J. Soil Erosion Theory, 3rd ed.; Science Press: Beijing, China, 2014. [Google Scholar]
- Lal, R. Soil erosion and the global carbon budget. Environ. Int. 2004, 29, 437–450. [Google Scholar] [CrossRef]
- Dotterweich, M. The history of human-induced soil erosion: Geomorphic legacies, early descriptions and research, and the development of soil conservation—A global synopsis. Geomorphology 2013, 201, 1–34. [Google Scholar] [CrossRef]
- García-Ruiz, J.M. The effects of land uses on soil erosion in Spain: A review. Catena 2010, 81, 1–11. [Google Scholar] [CrossRef]
- SooHoo, W.M.; Wang, C.; Li, H. Geospatial assessment of bioenergy land use and its impacts on soil erosion in the U.S. Midwest. J. Environ. Manag. 2017, 190, 188–196. [Google Scholar] [CrossRef] [Green Version]
- Li, Y.; Ni, J.; Yang, Q.; Li, R. Human Impacts on Soil Erosion Identified Using Land-Use Changes: A Case Study From The Loess Plateau, China. Phys. Geogr. 2006, 27, 109–126. [Google Scholar] [CrossRef]
- González-Arqueros, M.L.; Mendoza, M.E.; Vázquez-Selem, L. Human impact on natural systems modeled through soil erosion in GeoWEPP: A comparison between pre-Hispanic periods and modern times in the Teotihuacan Valley (Central Mexico). Catena 2017, 149, 505–513. [Google Scholar] [CrossRef]
- Schuler, J.; Sattler, C. The estimation of agricultural policy effects on soil erosion—An application for the bio-economic model MODAM. Land Use Policy 2010, 27, 61–69. [Google Scholar] [CrossRef]
- Shi, X.Z.; Wang, K.; Warner, E.D.; Yu, D.S.; Wang, H.J.; Yang, R.W.; Liang, Y.; Shi, D.M. Relationship between soil erosion and distance to roadways in undeveloped areas of China. Catena 2008, 72, 305–313. [Google Scholar] [CrossRef]
- Dotterweich, M.; Stankoviansky, M.; Minár, J.; Koco, Š.; Papčo, P. Human induced soil erosion and gully system development in the Late Holocene and future perspectives on landscape evolution: The Myjava Hill Land, Slovakia. Geomorphology 2013, 201, 227–245. [Google Scholar] [CrossRef]
- Xu, Y.; Xu, X.; Qing, T. Human activity intensity of land surface: Concept, methods and application in China. J. Geogr. Sci. 2016, 26, 1349–1361. [Google Scholar] [CrossRef]
- Balthazar, V.; Vanacker, V.; Girma, A.; Poesen, J.; Golla, S. Human impact on sediment fluxes within the Blue Nile and Atbara River basins. Geomorphology 2013, 180–181, 231–241. [Google Scholar] [CrossRef]
- Angima, S.D.; O’Neill, M.K.; Omwega, A.K.; Stott, D.E. Use of tree/grass hedges for soil erosion control in the Central Kenyan highlands. J. Soil Water Conserv. 2000, 55, 478–482. [Google Scholar]
- Didoné, E.J.; Minella, J.P.G.; Merten, G.H. Quantifying soil erosion and sediment yield in a catchment in southern Brazil and implications for land conservation. J. Soils Sediments 2015, 15, 2334–2346. [Google Scholar] [CrossRef]
- Sobral, A.C.; Peixoto, A.S.P.; Nascimento, V.F.; Rodgers, J.; da Silva, A.M. Natural and anthropogenic influence on soil erosion in a rural watershed in the Brazilian southeastern region. Reg. Environ. Chang. 2014, 15, 709–720. [Google Scholar] [CrossRef]
- He, Y.; Chen, Y.; Tang, H.; Yao, Y.; Yang, P.; Chen, Z. Exploring spatial change and gravity center movement for ecosystem services value using a spatially explicit ecosystem services value index and gravity model. Environ. Monit. Assess. 2011, 175, 563–571. [Google Scholar] [CrossRef]
- Shi, Y.-S.; Wu, J.; Wang, S.-Y. Spatio-temporal features and the dynamic mechanism of shopping center expansion in Shanghai. Appl. Geogr. 2015, 65, 93–108. [Google Scholar] [CrossRef]
- Zhang, M.; Wang, W. Analysis of spatial distribution of global energy-related CO2 emissions. Natl. Hazards 2014, 73, 165–171. [Google Scholar] [CrossRef]
- Fan, J.; Tao, A.; Lv, C. The Coupling Mechanism of the Centroids of Economic Gravity and Population Gravity and Its Effect on the Regional Gap in China. Prog. Geogr. 2010, 29, 87–95. [Google Scholar]
- Gao, Z.; Liu, J.; Zhuang, D. The dynamic changes of the gravity center of the farmland area and the quality of the farmland ecological background of China. J. Natl. Resour. 1998, 13, 92–96. [Google Scholar]
- Grether, J.M.; Mathys, N.A. Is the world's economic centre of gravity already in Asia? Area 2010, 42, 47–50. [Google Scholar] [CrossRef]
- Fan, J.; Wolfgang, T. An analysis of the economic features and regional difference of China’s rural industrialization. Acta Geogr. Sin. 1996, 51, 398–407. [Google Scholar]
- Áron Kincses, G.T. The Application of Gravity Model in the Investigation of Spatial Structure. Acta Polytech. Hung. 2014, 11, 5–19. [Google Scholar]
- Tóth, G.; Kincses, Á.; Nagy, Z. The changing economic spatial structure of Europe. Nor. Geogr. Tidsskr. Nor. J. Geogr. 2014, 68, 301–309. [Google Scholar] [CrossRef] [Green Version]
- Zhang, Q.; Hu, M.; Qi, S.; Zhang, F. Analysis of Land Use Change Driven by Policy in Jiangxi Province 1980–2005. Jiangxi Sci. 2011, 29, 597–602. [Google Scholar]
- Liu, J.Y.; Kuang, W.H.; Zhang, Z.X.; Xu, X.L.; Qin, Y.W. Spatiotemporal characteristics, patterns, and causes of land-use changes in China since the late 1980s. J. Geogr. Sci. 2014, 24, 195–210. [Google Scholar] [CrossRef]
- Diodato, N. Predicting RUSLE (Revised Universal Soil Loss Equation) Monthly Erosivity Index from Readily Available Rainfall Data in Mediterranean Area. Environmentalist 2006, 26, 63–70. [Google Scholar] [CrossRef]
- Prasannakumar, V.; Vijith, H.; Abinod, S.; Geetha, N. Estimation of soil erosion risk within a small mountainous sub-watershed in Kerala, India, using Revised Universal Soil Loss Equation(RUSLE) and geo-information technology. Geosci. Front. 2012, 3, 209–215. [Google Scholar] [CrossRef]
- Renard, K.G.; Foster, G.R.; Weesies, G.A.; Mccool, D.K.; Yoder, D.C. Predicting Soil Erosion by Water: A Guide to Conservation Planning with the Revised Universal Soil Loss Equation (RUSLE); Agricultural Handbook; Agricultural Research Service: Washington, DC, USA, 1997. [Google Scholar]
- Fu, B.J.; Zhao, W.W.; Chen, L.D.; Zhang, Q.J.; Lü, Y.H.; Gulinck, H.; Poesen, J.; Fu, B.J.; Zhao, W.W.; Chen, L.D.; et al. Assessment of soil erosion at large watershed scale using RUSLE and GIS: A case study in the loess plateau of China. Land Degradation & Development. Land Degrad. Dev. 2010, 16, 73–85. [Google Scholar]
- Zhou, Q.; Yang, S.; Zhao, C.; Cai, M.; Luo, Y. A Soil Erosion Assessment of the Upper Mekong River in Yunnan Province, China. Mt. Res. Dev. 2014, 34, 36–47. [Google Scholar] [CrossRef]
- Chen, S.; Yang, X.; Xiao, L.; Cai, H. Study of Soil Erosion in the Southern Hillside Area of China Based on RUSLE Model. Resour. Sci. 2014, 36, 1288–1297. [Google Scholar]
- Zhang, W.; Xie, Y.; Liu, B. Rainfall Erosivity Estimation Using Daily Rainfall Amounts. Sci. Geogr. Sin. 2002, 22, 705–711. [Google Scholar]
- Williams, J.R. The erosion-productivity impact calculator (EPIC) model: A case history. Philos. Trans. Biol. Sci. 1990, 329, 421–428. [Google Scholar]
- Cai, C.; Ding, S.; Shi, Z.; Huang, L. Study of Applying USLE and Geographical Information System IDRISI to Predict Soil Erosion in Small Watershed. J. Soil Water Conserv. 2000, 14, 19–24. [Google Scholar]
- Tan, J.; Zhang, P. Study on the space-time evolution feature of economic gravity center in northeast China with the strategy of revitalizing northeast China from 1994 to 2011. Geogr. Geo-Inf. Sci. 2013, 29, 68–72. [Google Scholar]
- Zuo, C.; Xie, S. Monitoring and Analysis of Soil and Water Loss in Jiangxi Province. Bull. Soil Water Conserv. 2006, 26, 55–58. [Google Scholar]
- Jiangxi Province Water Conservancy Bureau-Statistic Bureau of Jiangxi. Bulletin of the water conservancy first survey of Jiangxi Province. Jiangxi Hydraul. Sci. Technol. 2013, 39, 79–82. [Google Scholar]
- Deng, L.; Shangguan, Z.-P.; Li, R. Effects of the grain-for-green program on soil erosion in China. Int. J. Sedim. Res. 2012, 27, 120–127. [Google Scholar] [CrossRef]
- Jiangxi Province. Jiangxi Bulletin of Soil and water Conservation (2015). Available online: http://www.jxsl.gov.cn/slgb/stbcgb/index.html (accessed on 27 May 2019).
- Zhang, C.; Xie, S.; Zeng, J. Investigation on the state and prevention of artificial soil erosion in Jiangxi Province. Trans. CSAE 2008, 24, 54–57. [Google Scholar]
- Xia, M.; Zhang, K.; Wen, B.; Liu, Y.; Pan, Y. On simulation of changes in industrial land use and evaluation of ecological risks in a coal resource-exhausted city: A case study of Anyuan district, Pingxiang city. Geogr. Res. 2017, 36, 1773–1786. [Google Scholar]
- Wang, X.; Zeng, J.; Liu, D. Soil Erosion Caused by Local Development and Construction Projects in Ganzhou City. Jiangxi Hydraul. Sci. Technol. 2009, 35, 137–139. [Google Scholar]
Figure 1.
Geographic location of Jiangxi province: the detail shows Digital Elevation Model (DEM) shaded-relief and boundary of province-controlled cities of the study area.
Figure 1.
Geographic location of Jiangxi province: the detail shows Digital Elevation Model (DEM) shaded-relief and boundary of province-controlled cities of the study area.
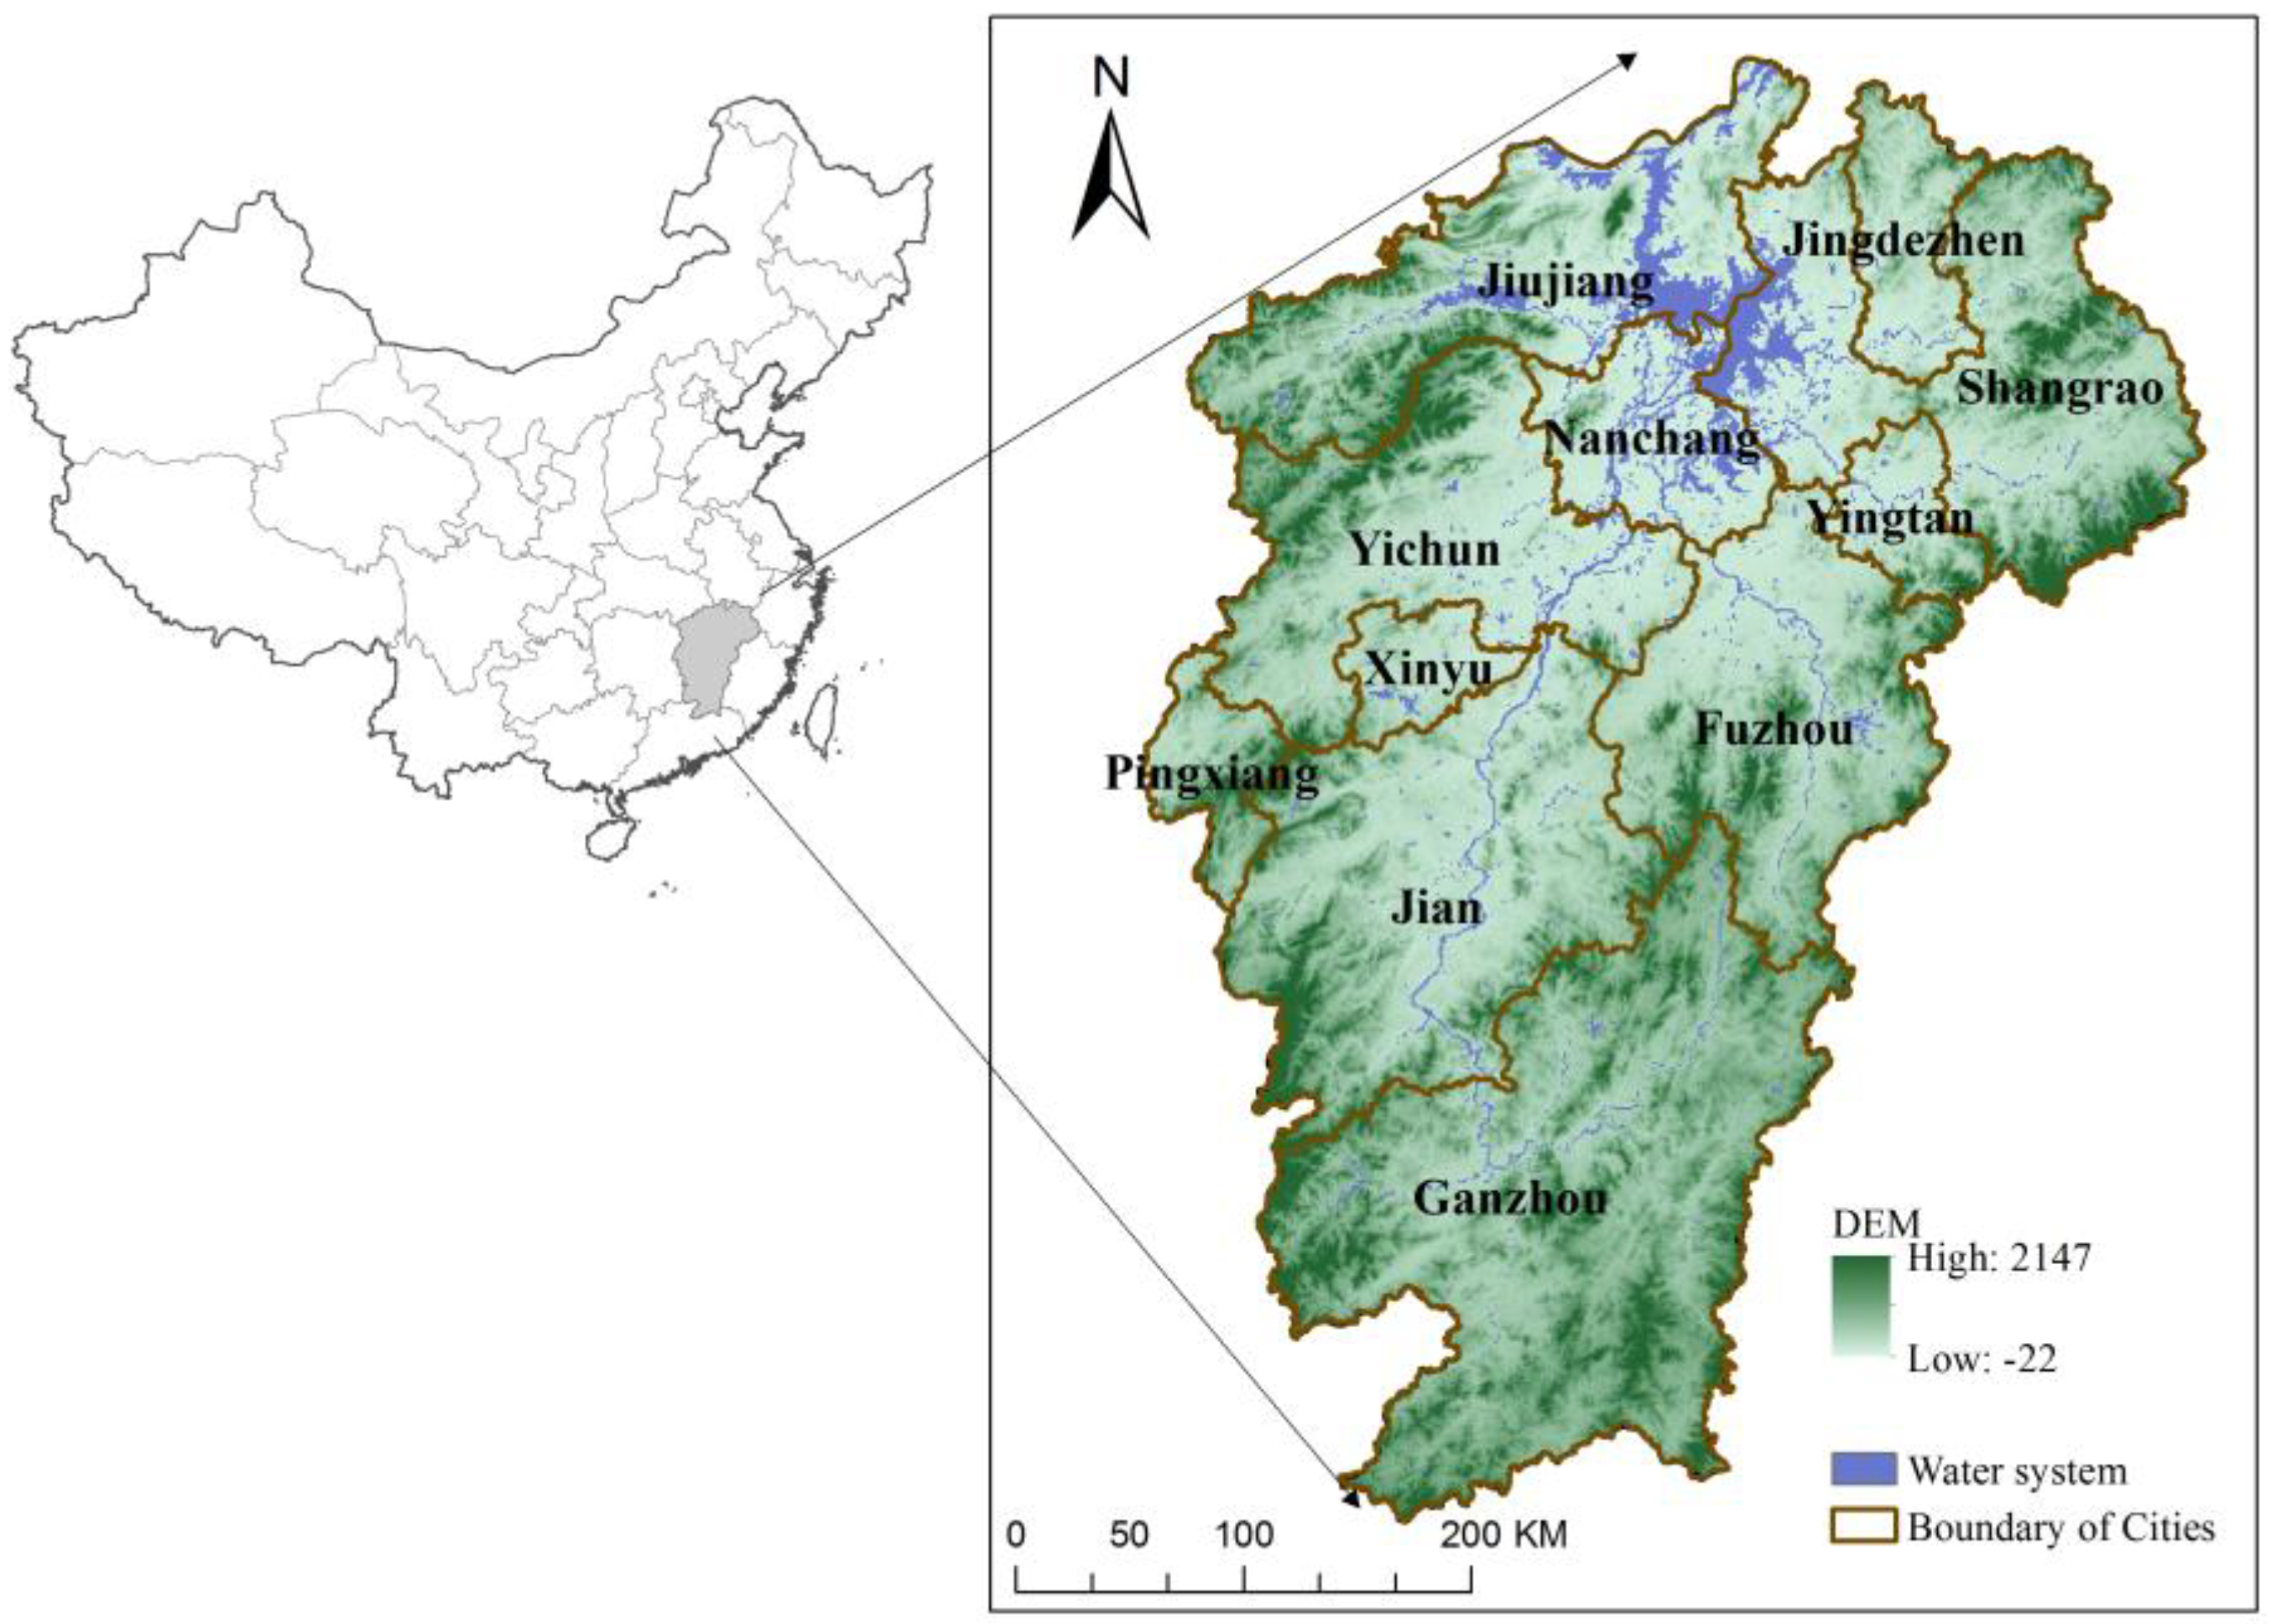
Figure 2.
The relationship between vector and sub-vectors.
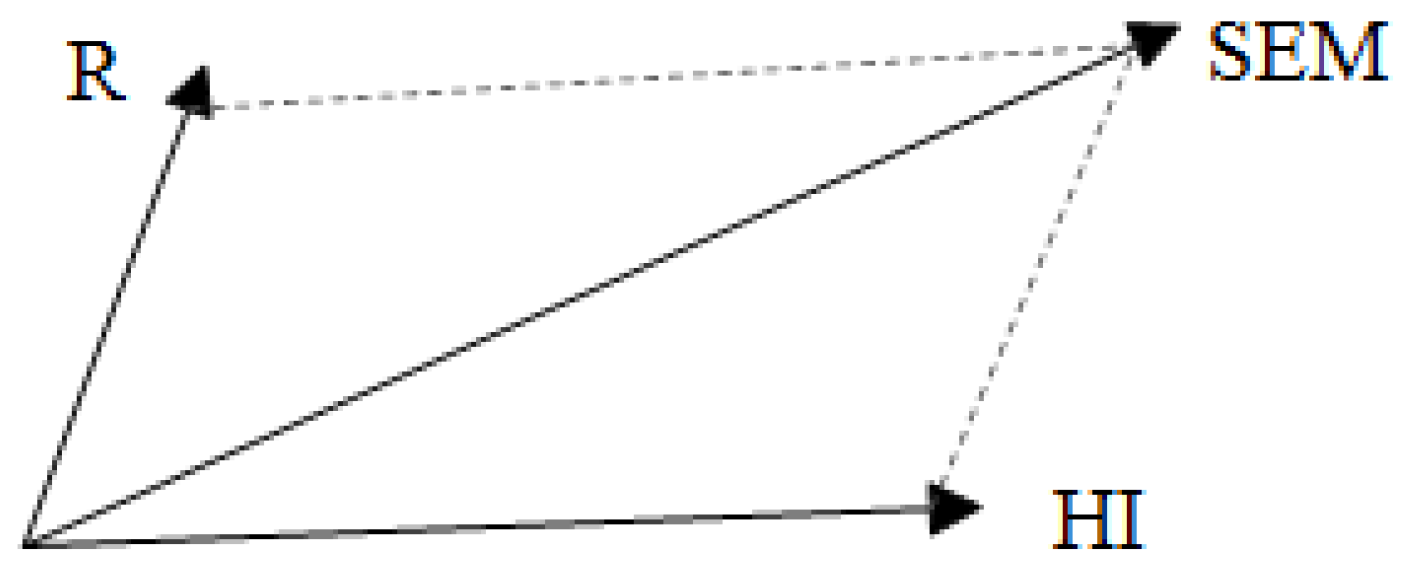
Figure 3.
The relationship between the whole region and sub-regions.
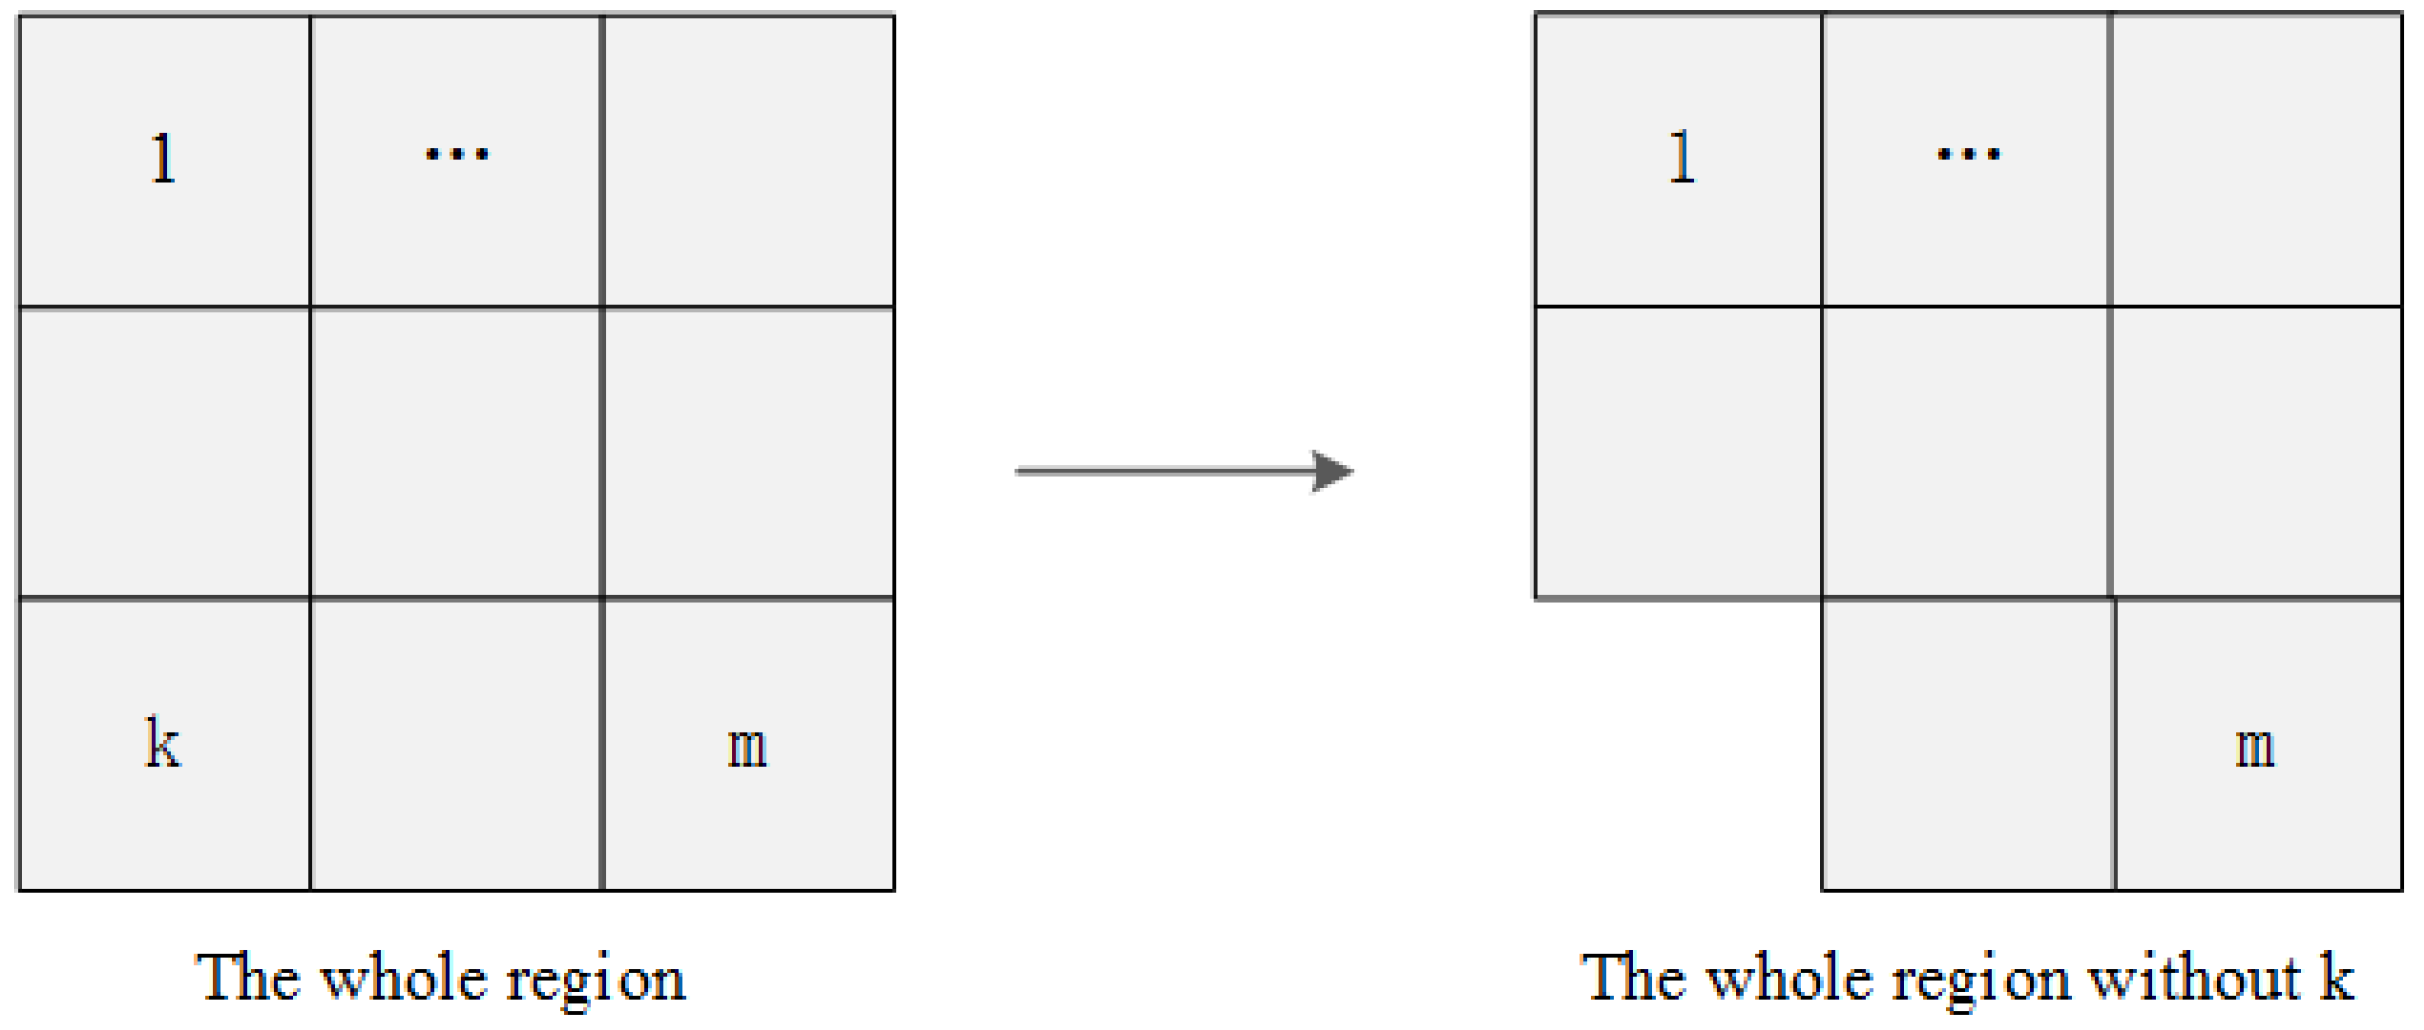
Figure 4.
Spatial distribution of SE grades in Jiangxi province: (a) 1990; (b) 2015; (c) changes of SE grades from 1990 to 2015.
Figure 4.
Spatial distribution of SE grades in Jiangxi province: (a) 1990; (b) 2015; (c) changes of SE grades from 1990 to 2015.
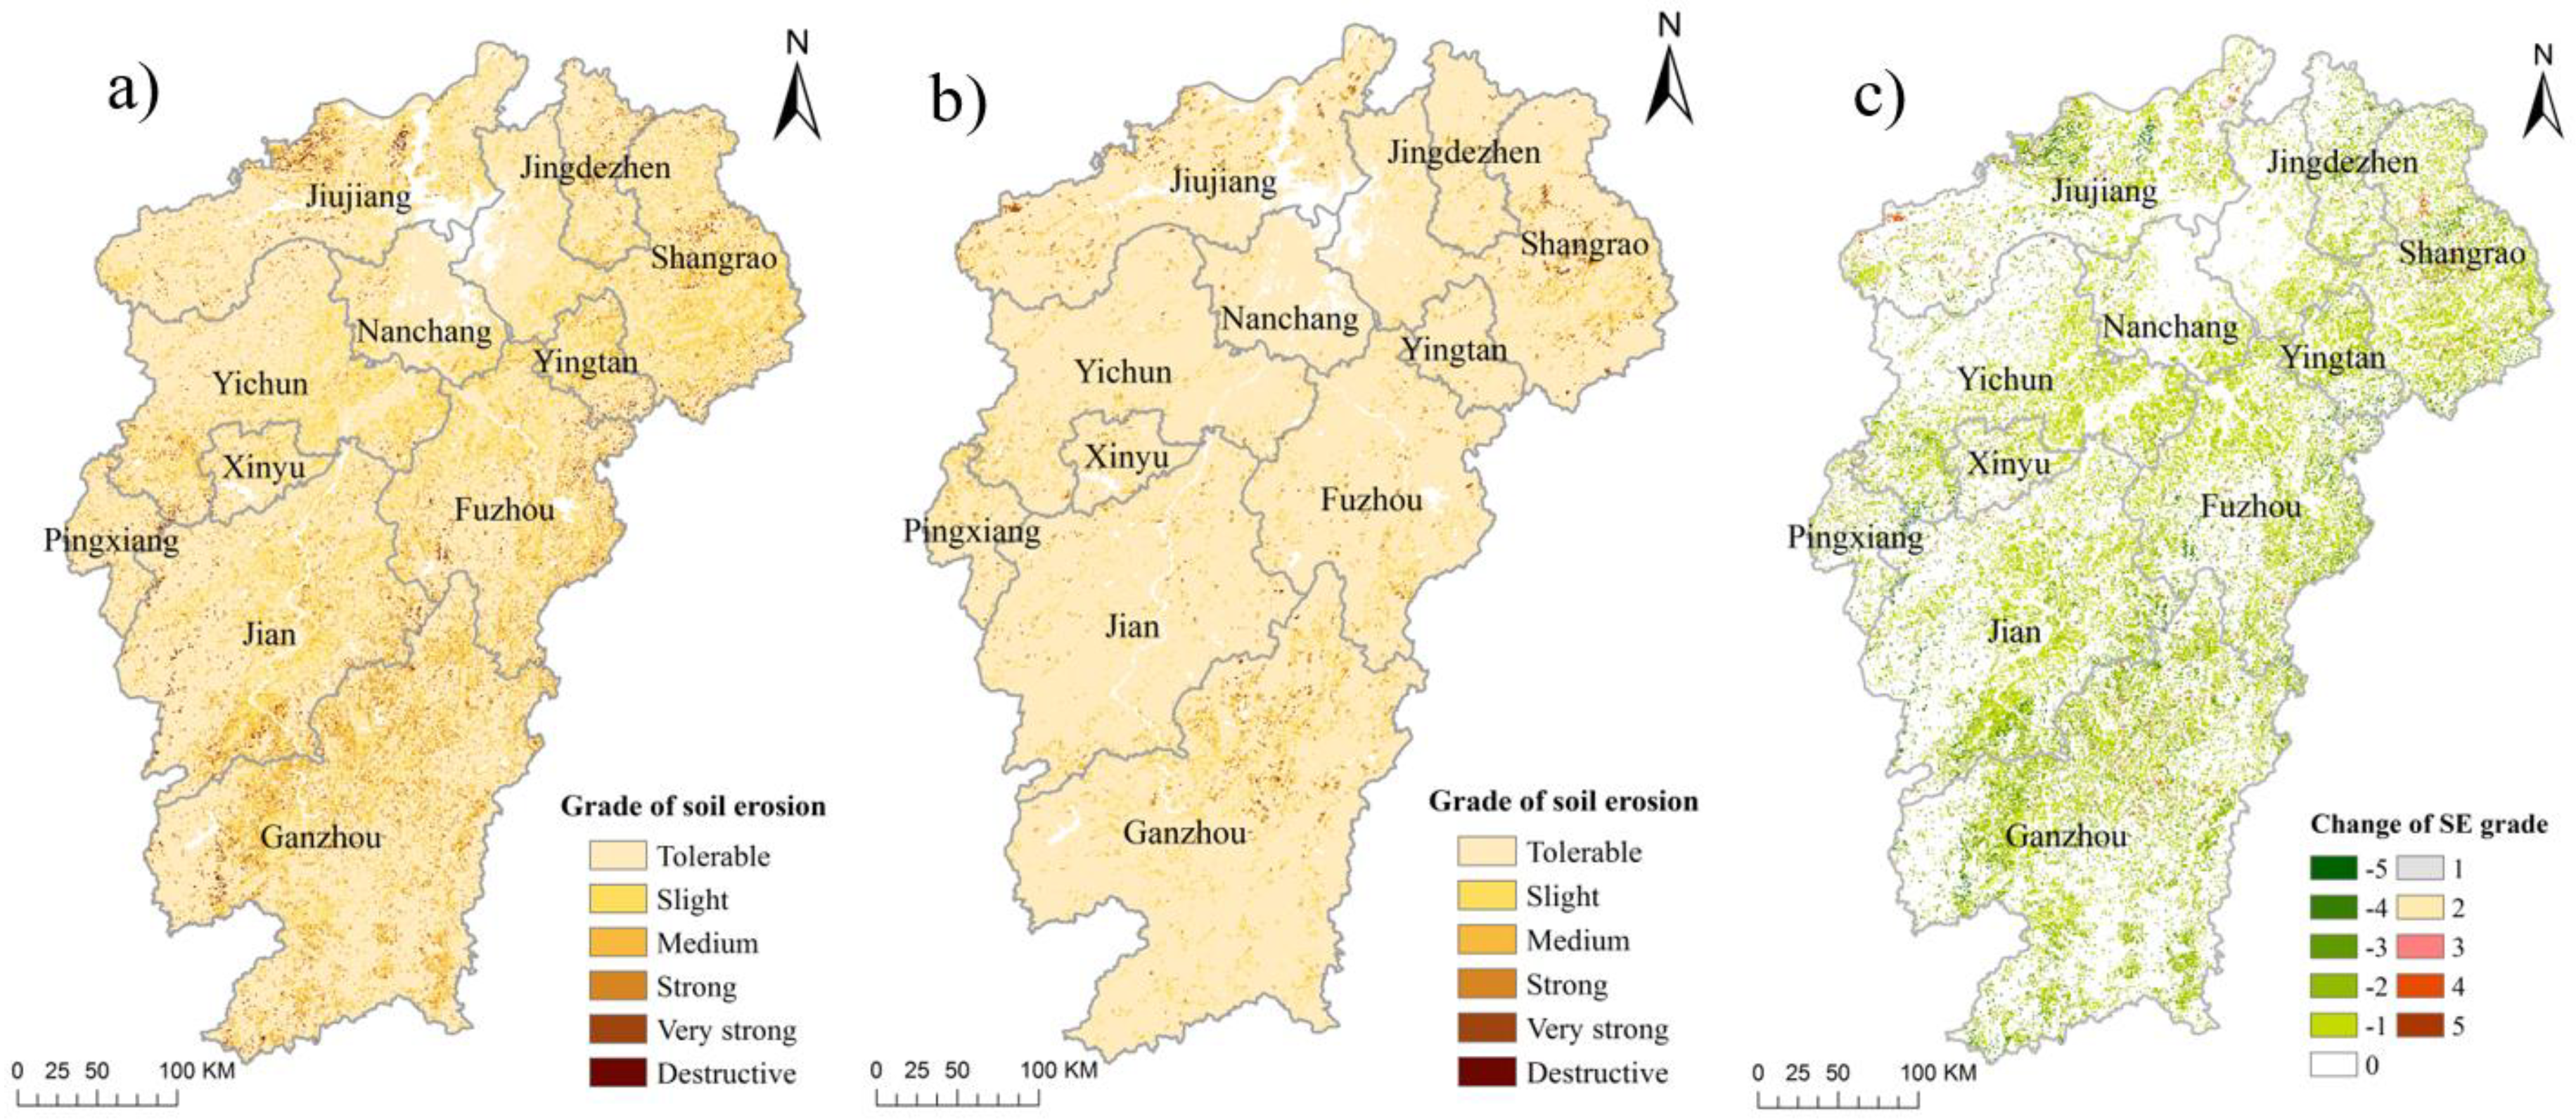
Figure 5.
Spatial distribution of R in Jiangxi province: (a) 1990; (b) 2015.
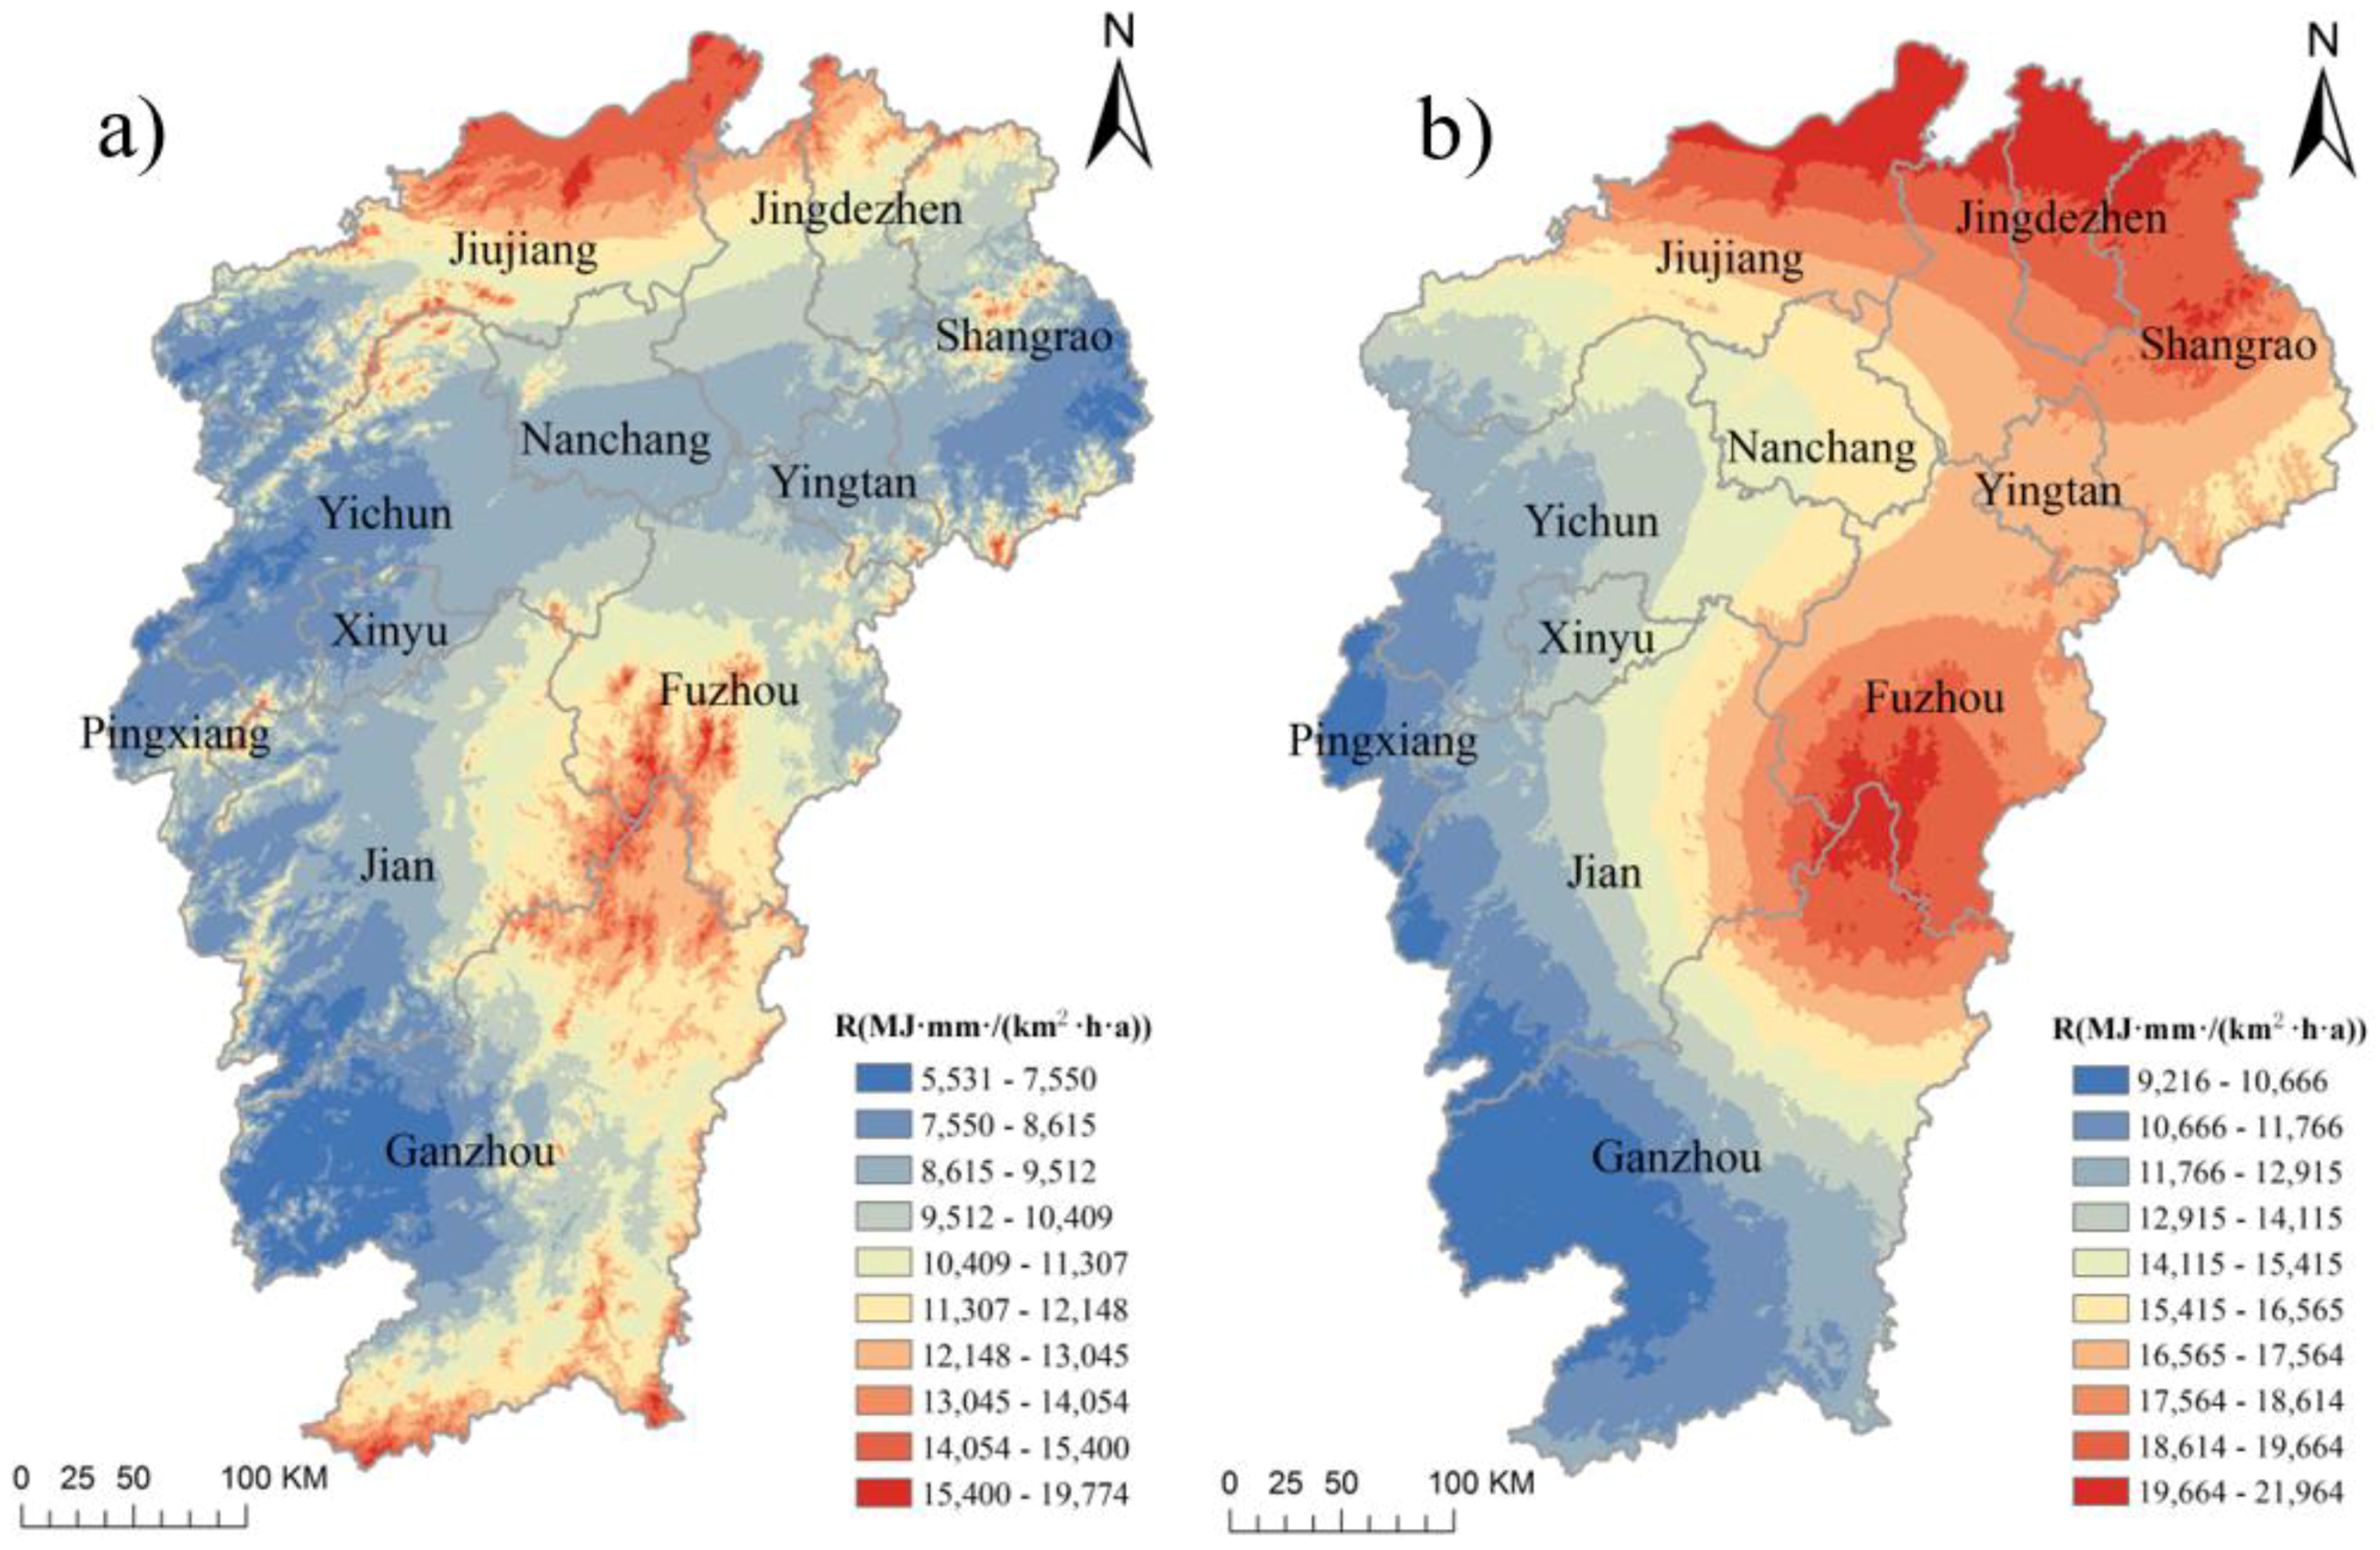
Figure 6.
Vector decomposition of gravity-center migration from 1990 to 2015.
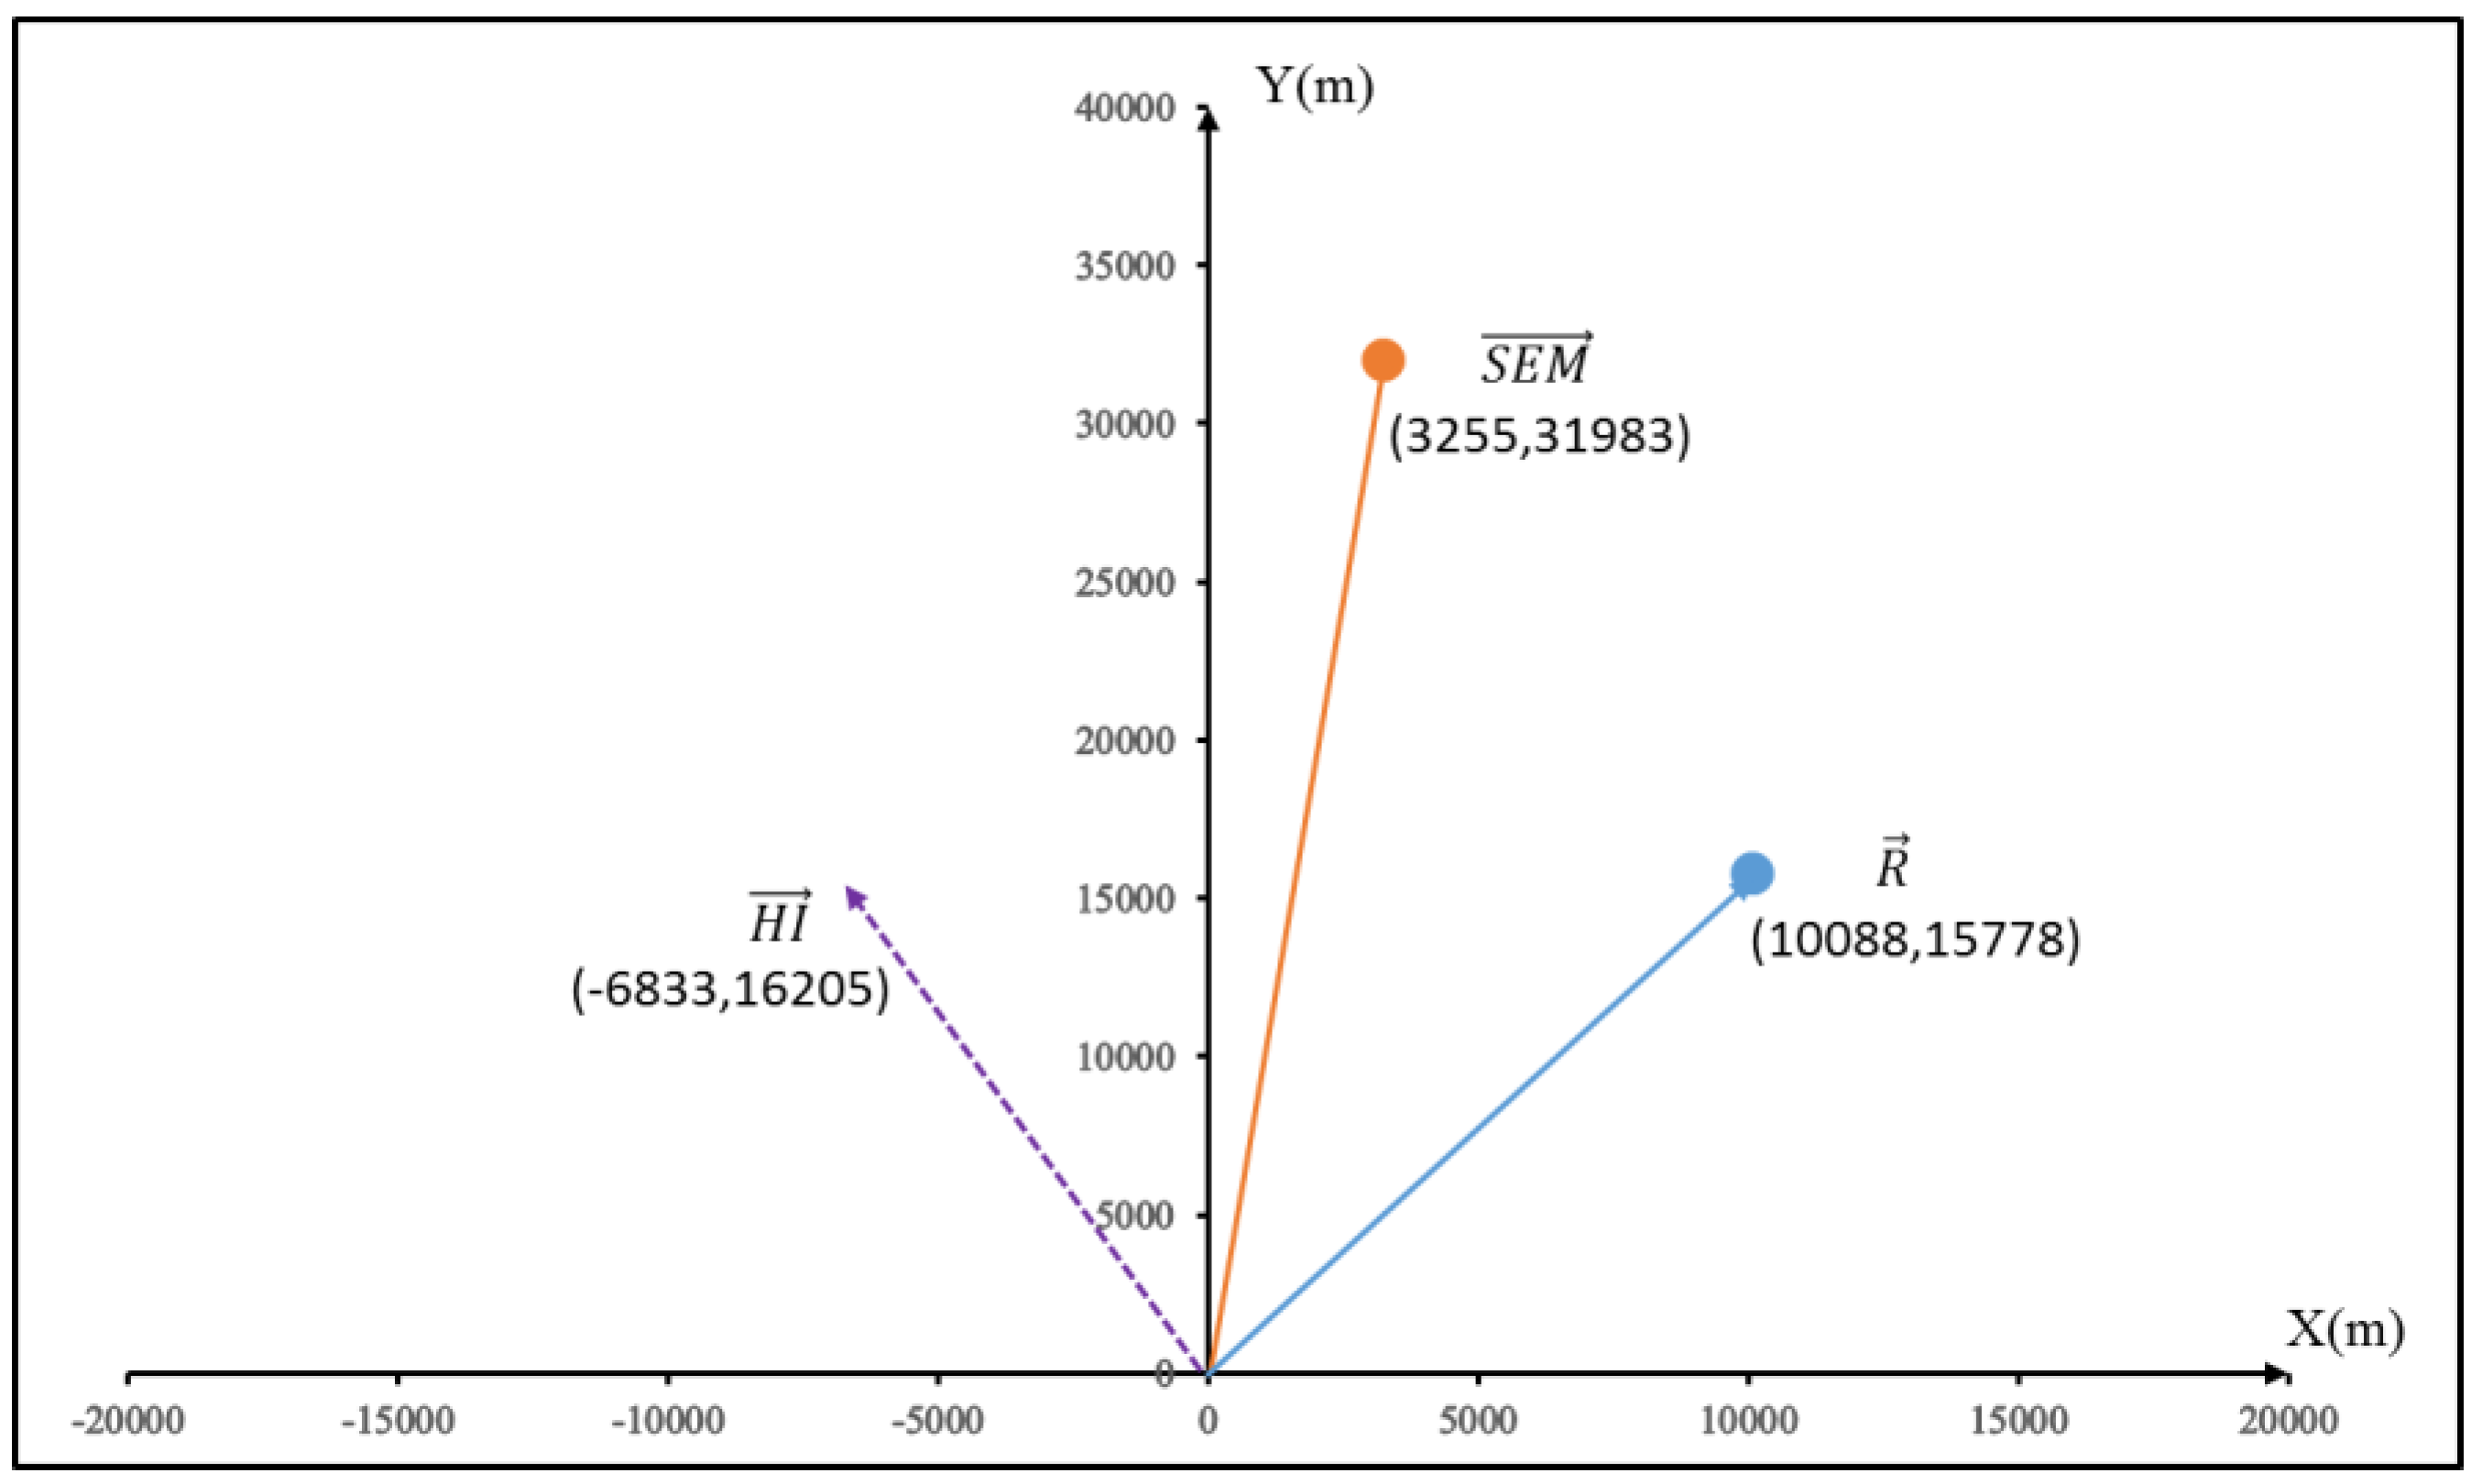
Figure 7.
Spatial distribution of SE gravity-center in 1990 and 2015 & regional center of Jiangxi: (a) under combined influences; (b) under human influence.
Figure 7.
Spatial distribution of SE gravity-center in 1990 and 2015 & regional center of Jiangxi: (a) under combined influences; (b) under human influence.
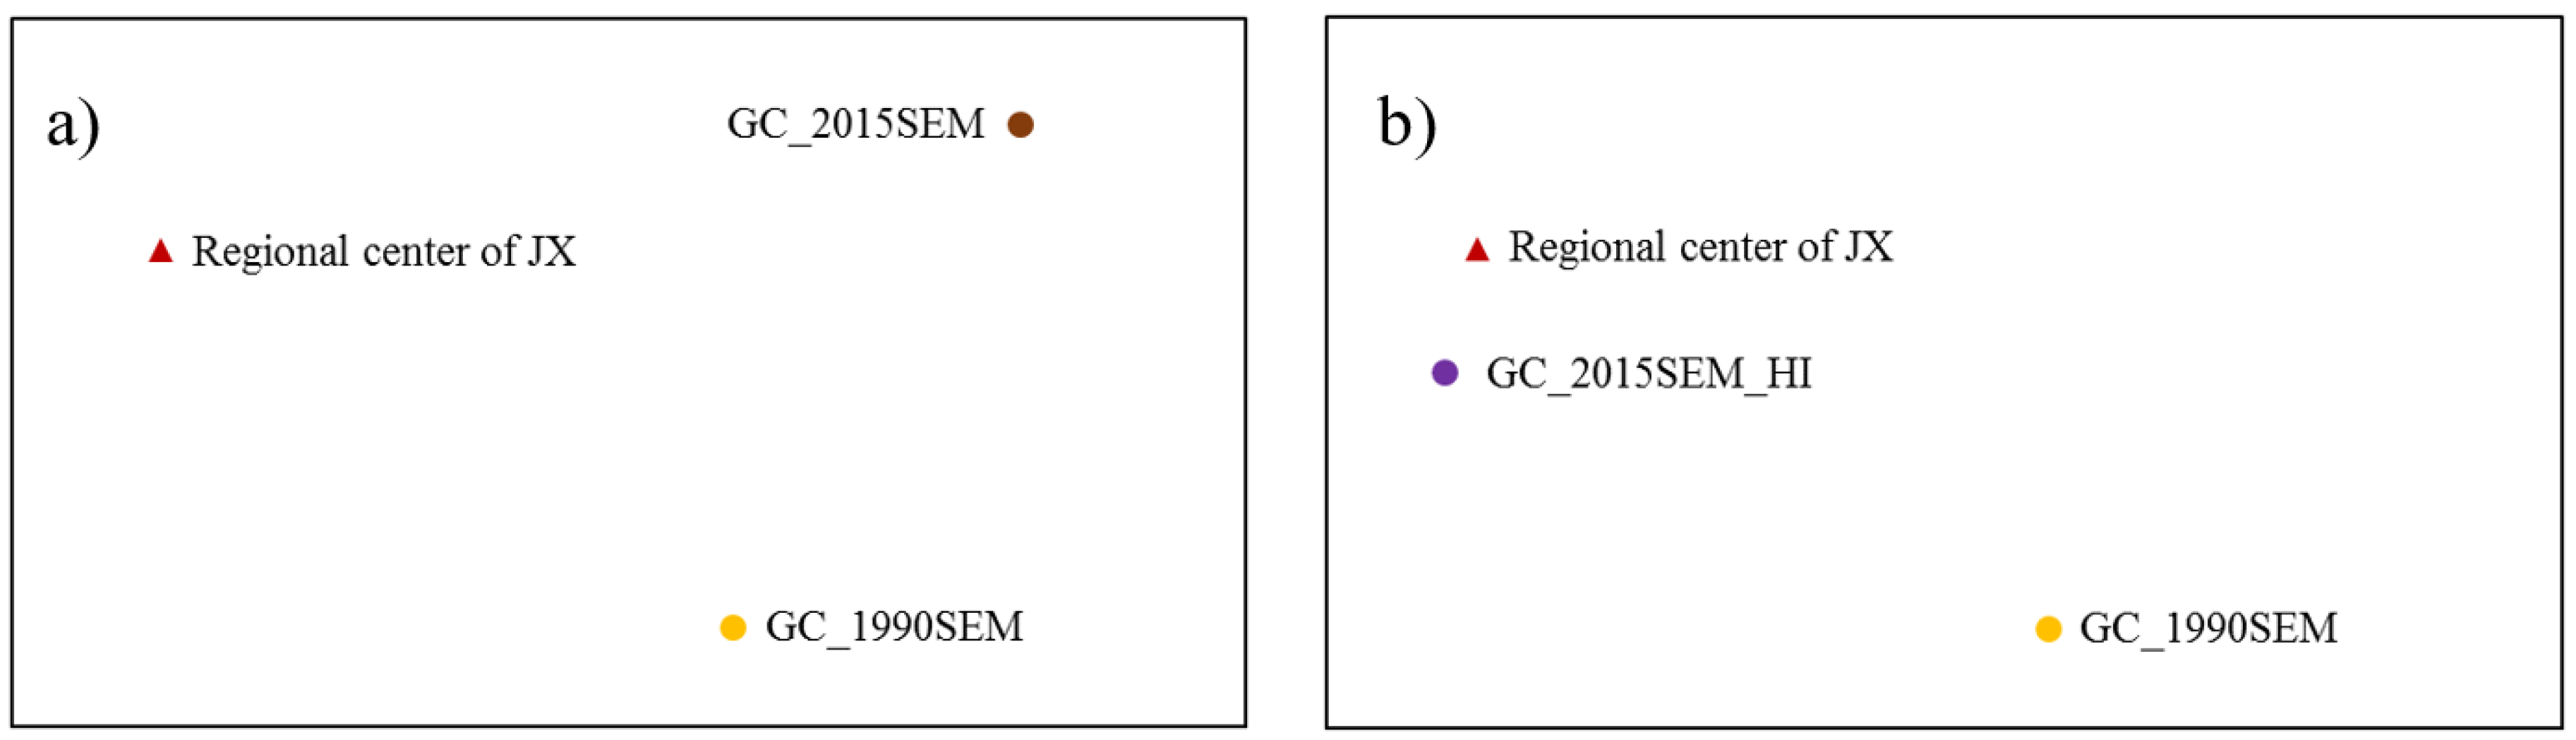
Figure 8.
Spatial differences of SE change under natural and human influence.
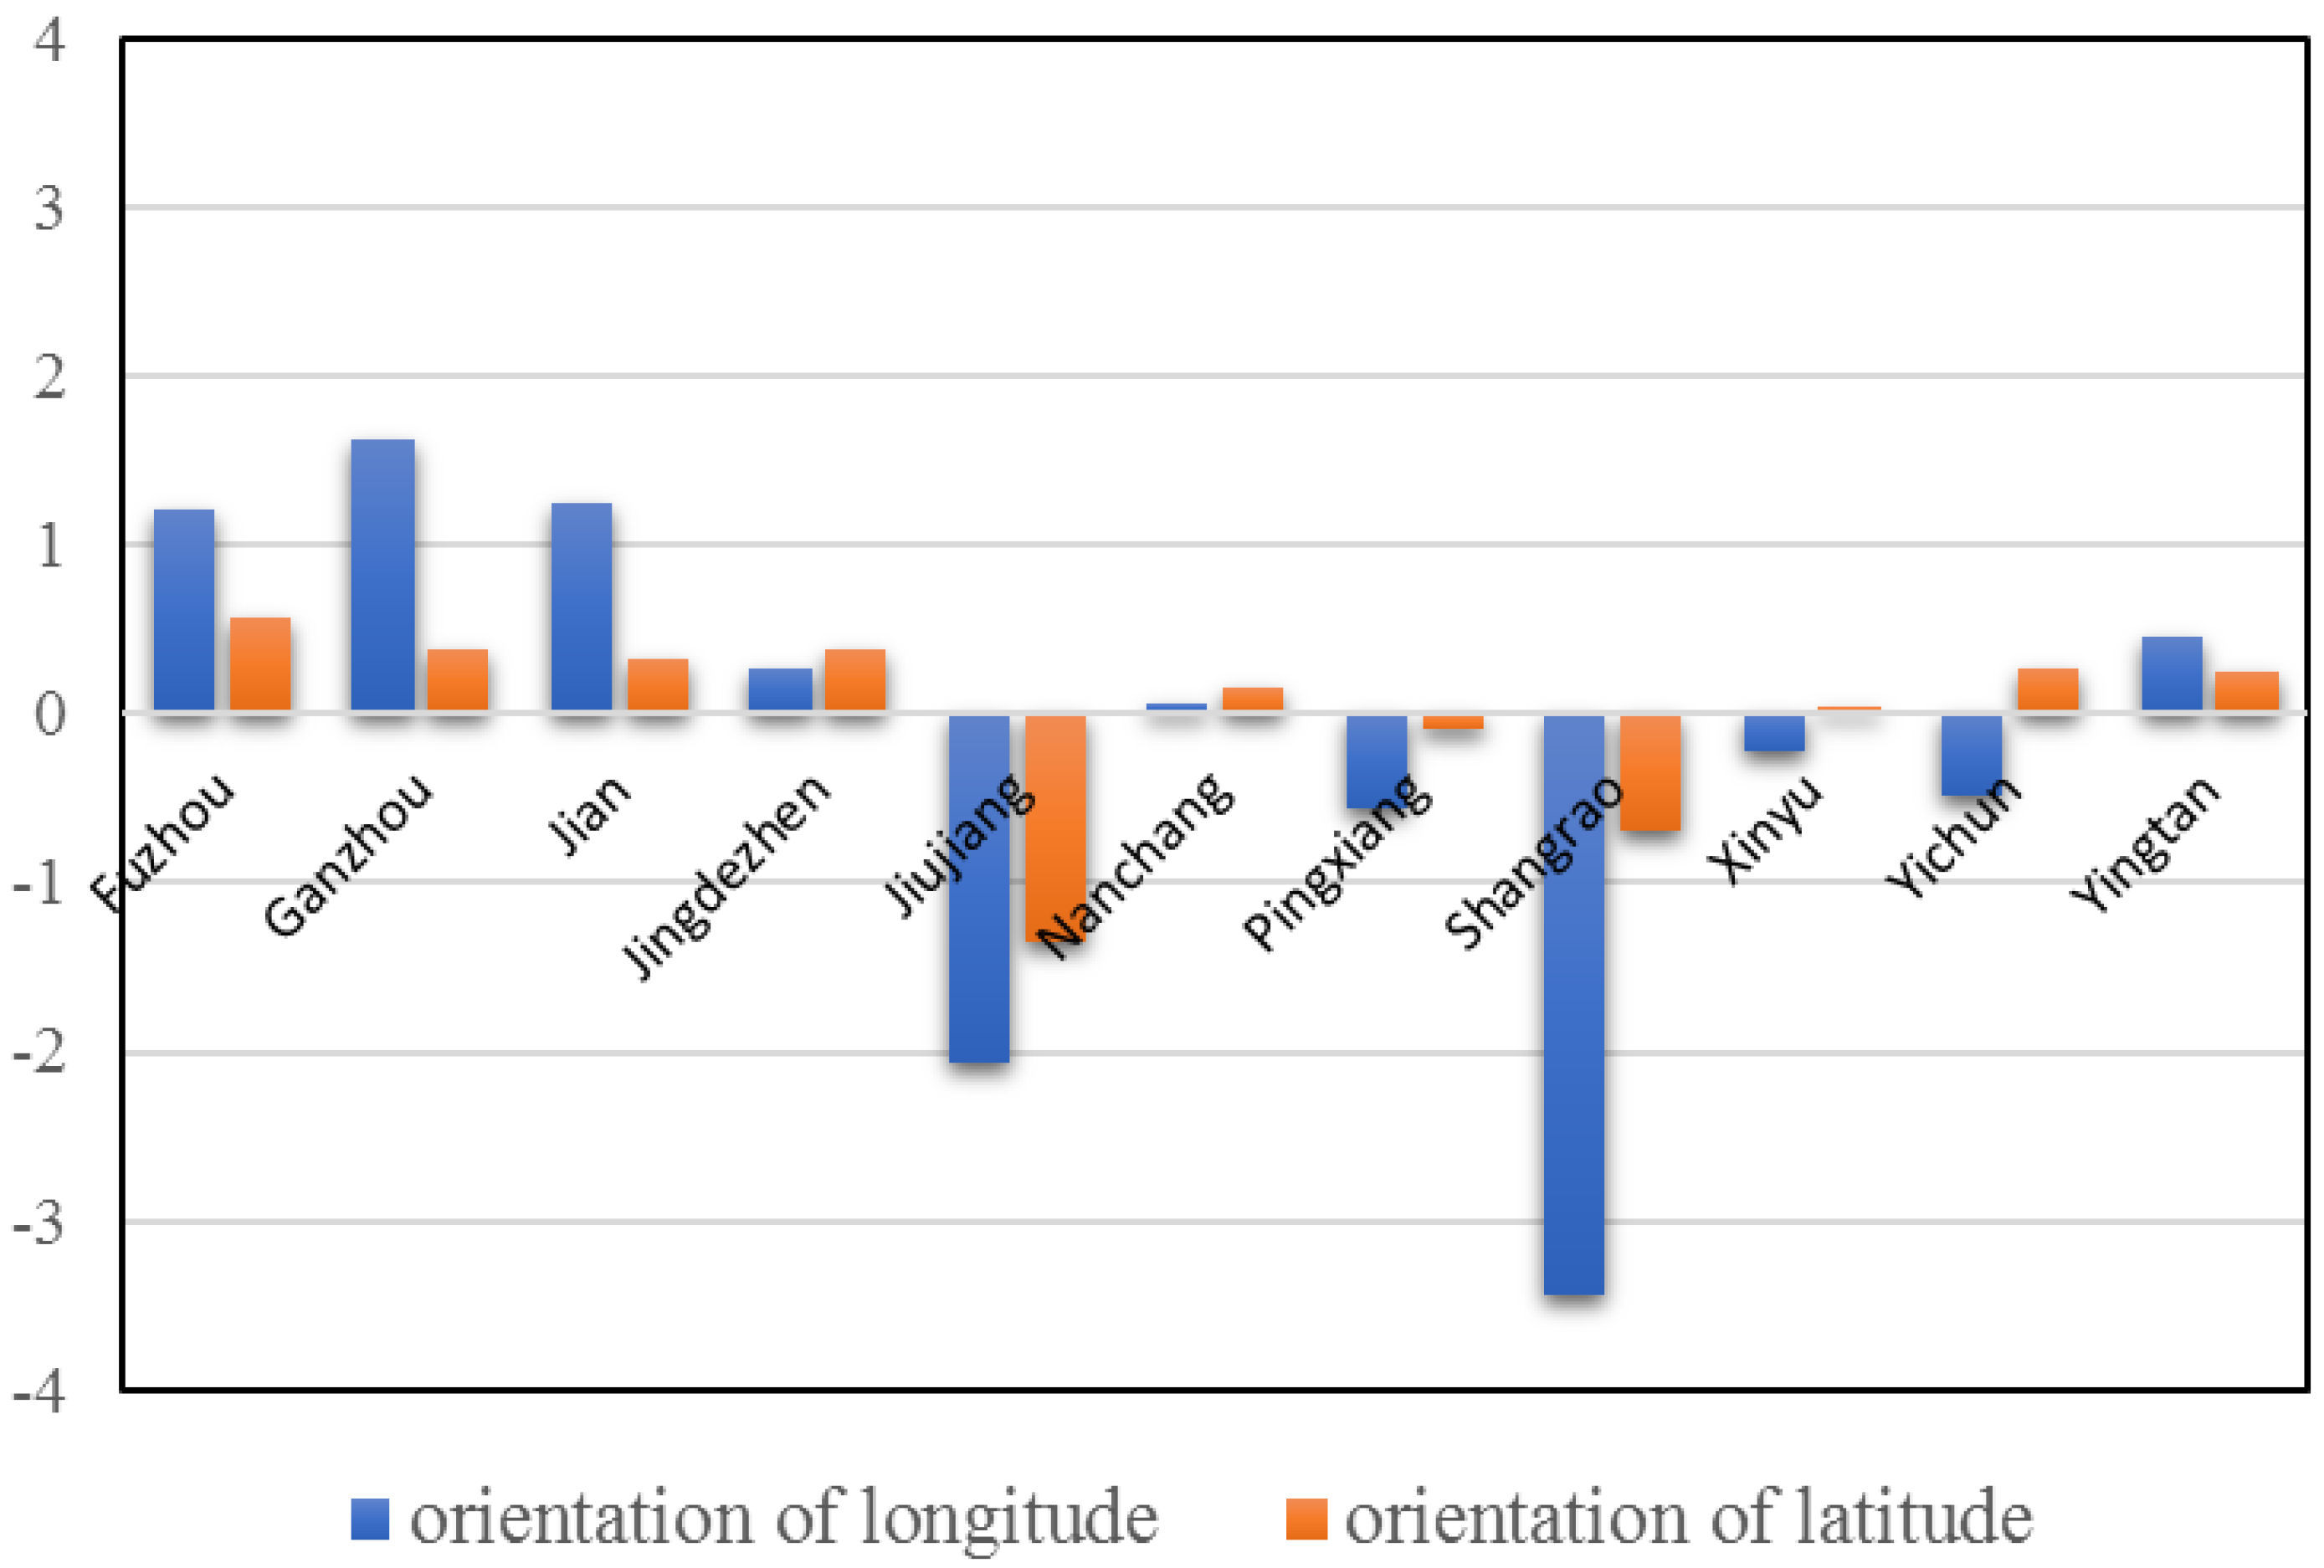
Figure 9.
Human-induced spatial differences of SE change.

Table 1.
Description of data.
| Name | Data Type | Time | Scale/Resolution | Data Sources |
|---|---|---|---|---|
| Boundary of Jiangxi province and cities | SHP | 2010 | 1:4,000,000 | Resources and Environmental Scientific Data Center (RESDC), Chinese Academy of Sciences (CAS) |
| Boundary of watershed | SHP | 2008 | 1:4,000,000 | RESDC |
| Land use | grid | 1990/2015 | 1000 m | RESDC |
| DEM | grid | 2000 | 30 m | RESDC |
| Rainfall data | excel | 1990/2015 | / | RESDC |
| Soil database | SHP | 1990s | 1:1,000,000 | RESDC |
| Soil texture data | grid | 1990s | 1000 m | RESDC |
| Soil carbon pool | grid | 1980s–1990s | 1000 m | RESDC |
| NDVI | grid | 1990/2015 | 1000 m | RESDC |
Table 2.
SE classification standard of the study area.
| SEM(Mg/(km2·a)) | Grade | Grade Value |
|---|---|---|
| <500 | Tolerable | 1 |
| 500–2500 | Slight | 2 |
| 2500–5000 | Medium | 3 |
| 5000–8000 | Strong | 4 |
| 8000–15,000 | Very Strong | 5 |
| >15,000 | Destructive | 6 |
Table 3.
Sub-regions’ average SEM & change ratios in 1990 and 2015.
| City Name | 1990SEM_Mean (Mg/(km2·a)) | 2015SEM_Mean (Mg/(km2·a)) | Change (%) |
|---|---|---|---|
| Fuzhou | 1024.22 | 236.13 | −76.94 |
| Ganzhou | 1050.14 | 322.88 | −69.25 |
| Jian | 877.62 | 193.36 | −77.96 |
| Jingdezhen | 860.53 | 212.03 | −75.36 |
| Jiujiang | 790.06 | 439.97 | −44.31 |
| Nanchang | 370.11 | 85.85 | −76.80 |
| Pingxiang | 873.23 | 377.91 | −56.72 |
| Shangrao | 732.01 | 357.71 | −51.13 |
| Xinyu | 576.42 | 301.67 | −47.66 |
| Yichun | 589.14 | 204.95 | −65.21 |
| Yingtan | 1036.56 | 185.49 | −82.10 |
Table 4.
Contribution rate of rainfall and human influence on SE gravity-center migration.
| Longitude | Latitude | |
|---|---|---|
| Rainfall impact | 3.1 | 0.49 |
| Human impact | −2.1 | 0.51 |
© 2019 by the authors. Licensee MDPI, Basel, Switzerland. This article is an open access article distributed under the terms and conditions of the Creative Commons Attribution (CC BY) license (http://creativecommons.org/licenses/by/4.0/).
Share and Cite
MDPI and ACS Style
Huang, D.; Yang, X.; Cai, H.; Xiao, Z.; Han, D. Identifying Human-Induced Spatial Differences of Soil Erosion Change in a Hilly Red Soil Region of Southern China. Sustainability 2019, 11, 3103. https://doi.org/10.3390/su11113103
AMA Style
Huang D, Yang X, Cai H, Xiao Z, Han D. Identifying Human-Induced Spatial Differences of Soil Erosion Change in a Hilly Red Soil Region of Southern China. Sustainability. 2019; 11(11):3103. https://doi.org/10.3390/su11113103
Chicago/Turabian StyleHuang, Dong, Xiaohuan Yang, Hongyan Cai, Zuolin Xiao, and Dongrui Han. 2019. "Identifying Human-Induced Spatial Differences of Soil Erosion Change in a Hilly Red Soil Region of Southern China" Sustainability 11, no. 11: 3103. https://doi.org/10.3390/su11113103
Note that from the first issue of 2016, this journal uses article numbers instead of page numbers. See further details here.