The Integrated Effect of Carbon Emissions Trading and Pollution Rights Trading for Power Enterprises—A Case Study of Chongqing


Abstract
1. Introduction
2. Modelling Methodology
2.1. Description of the Problem
2.2. Software Introduction
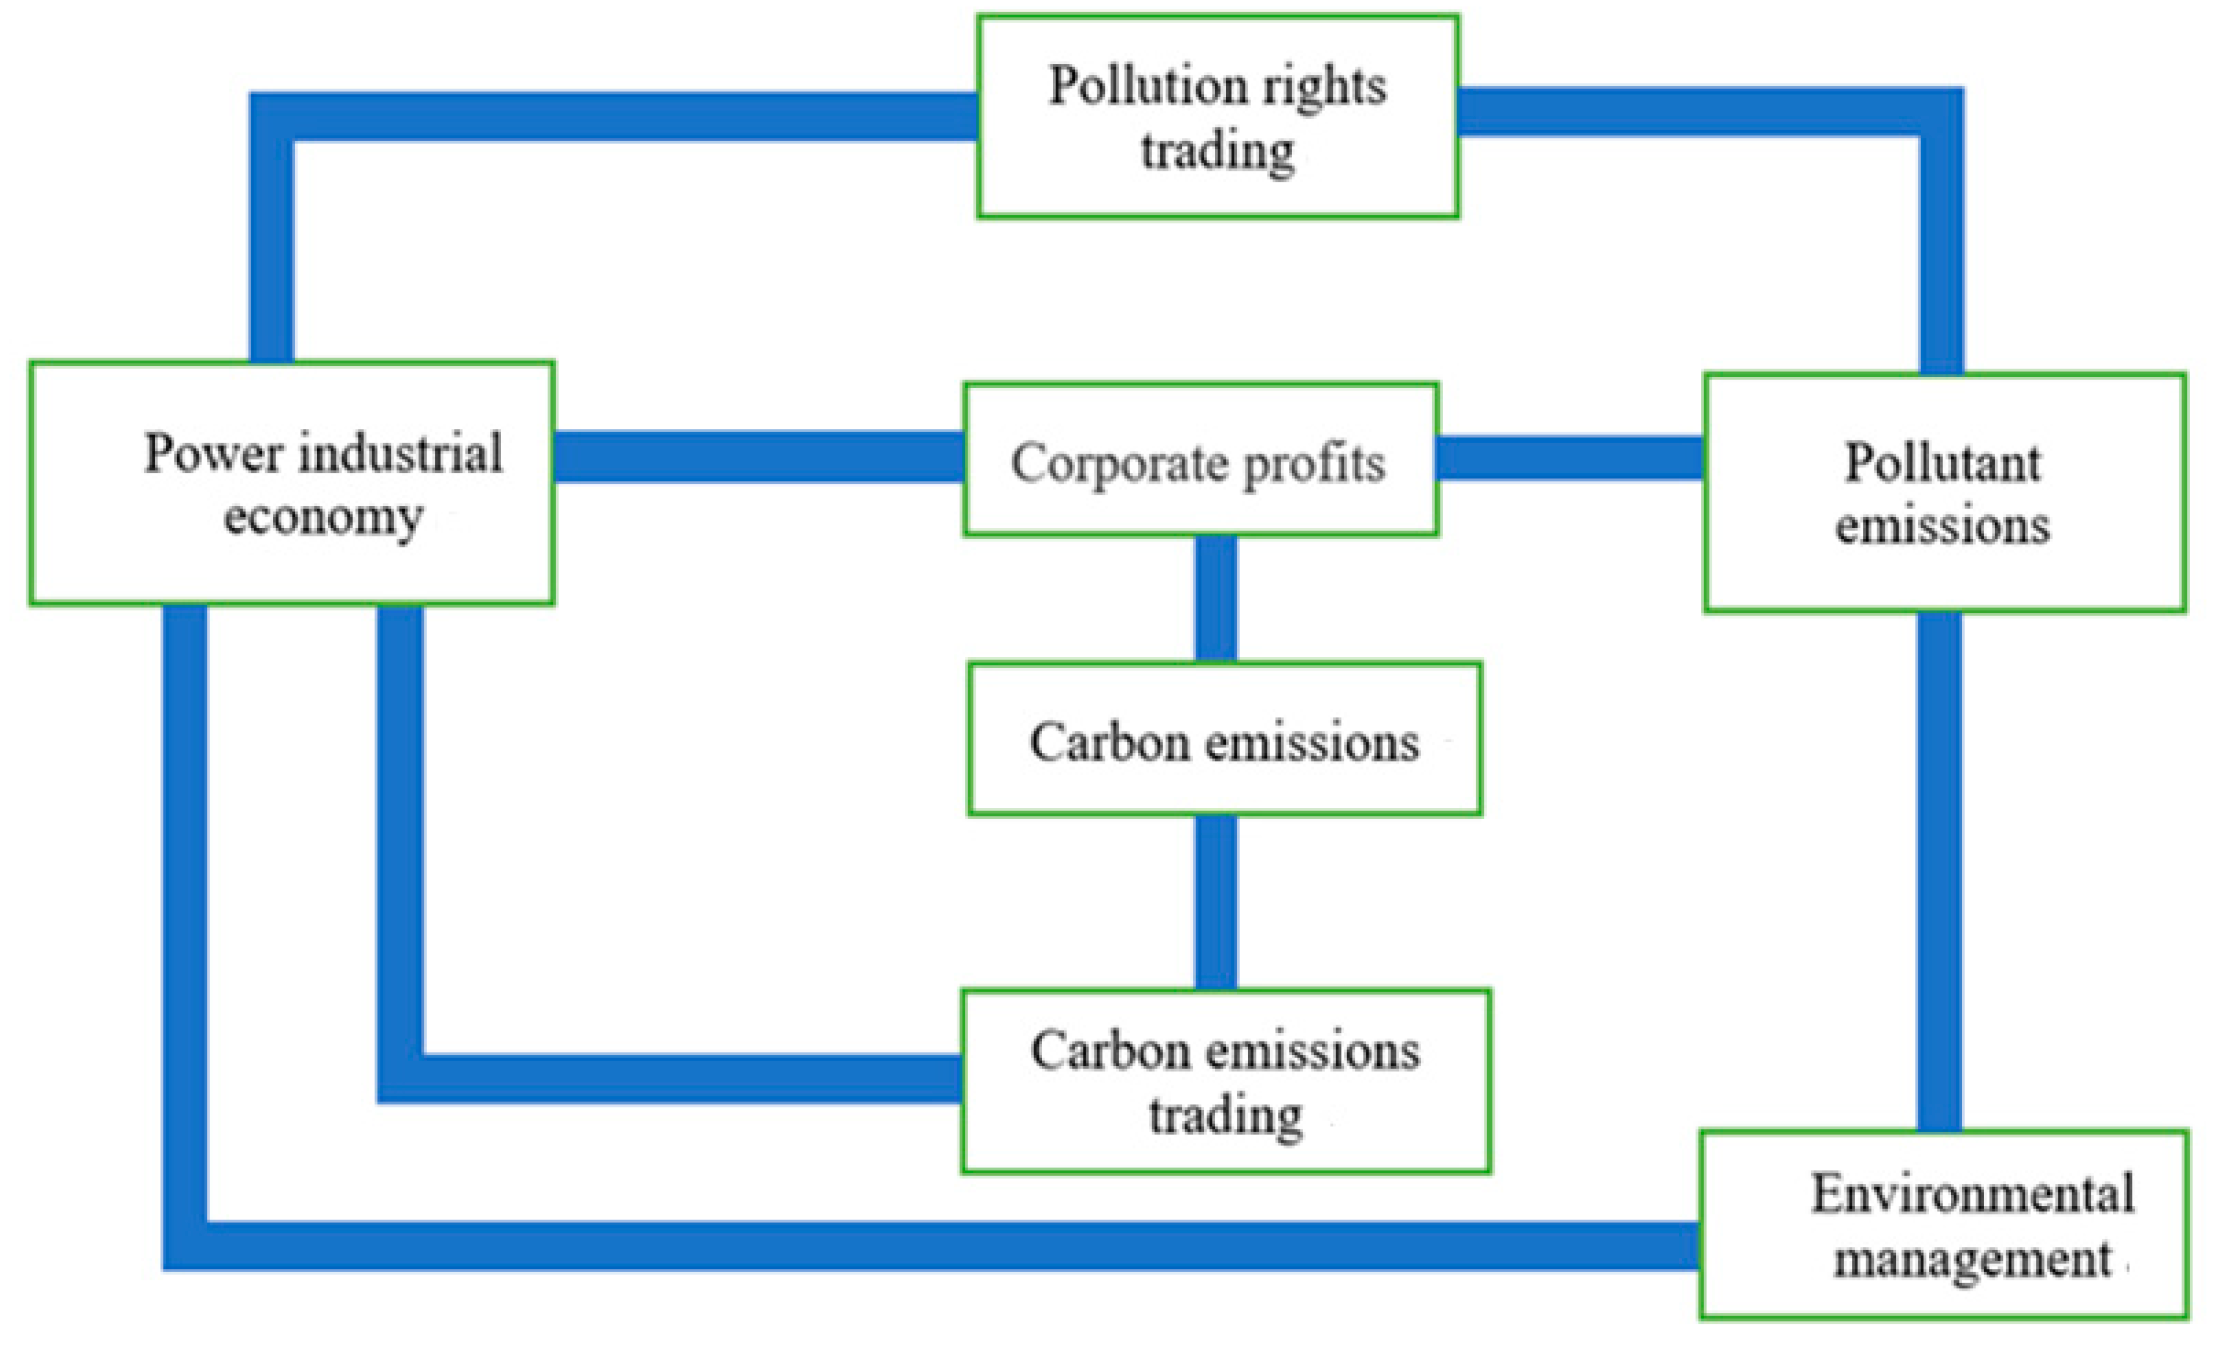
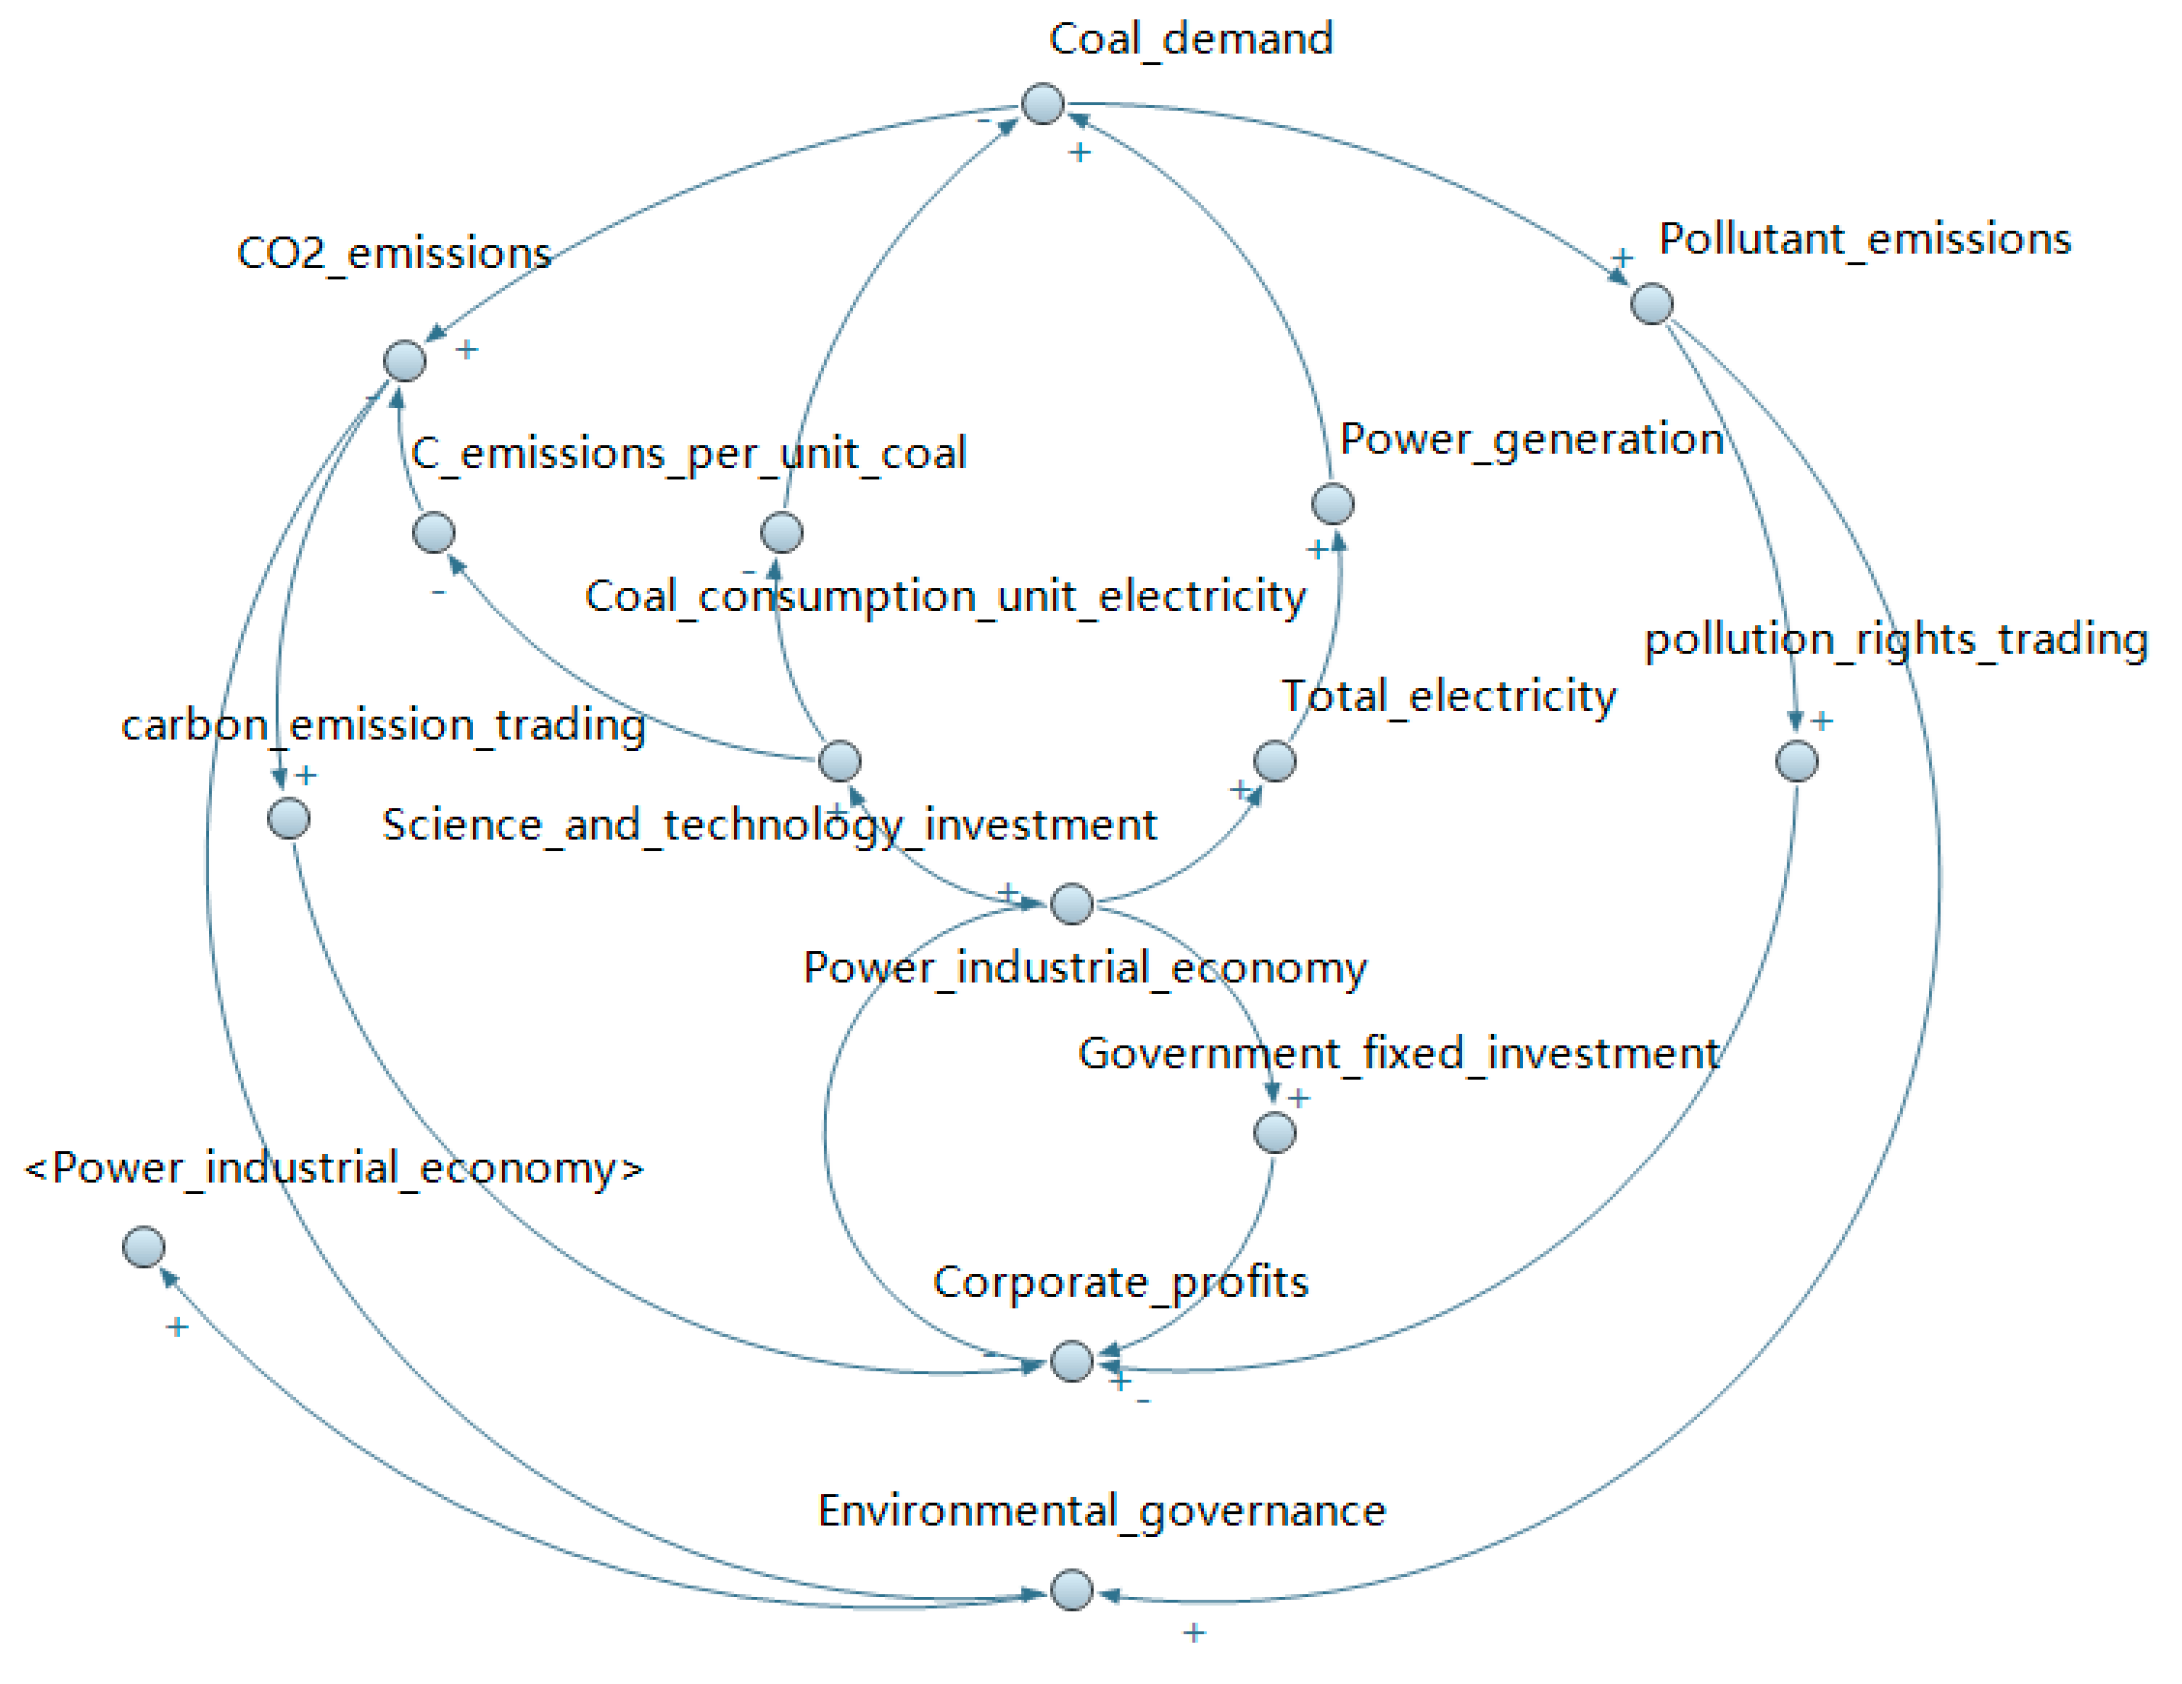
2.3. Causal Circuit Diagram
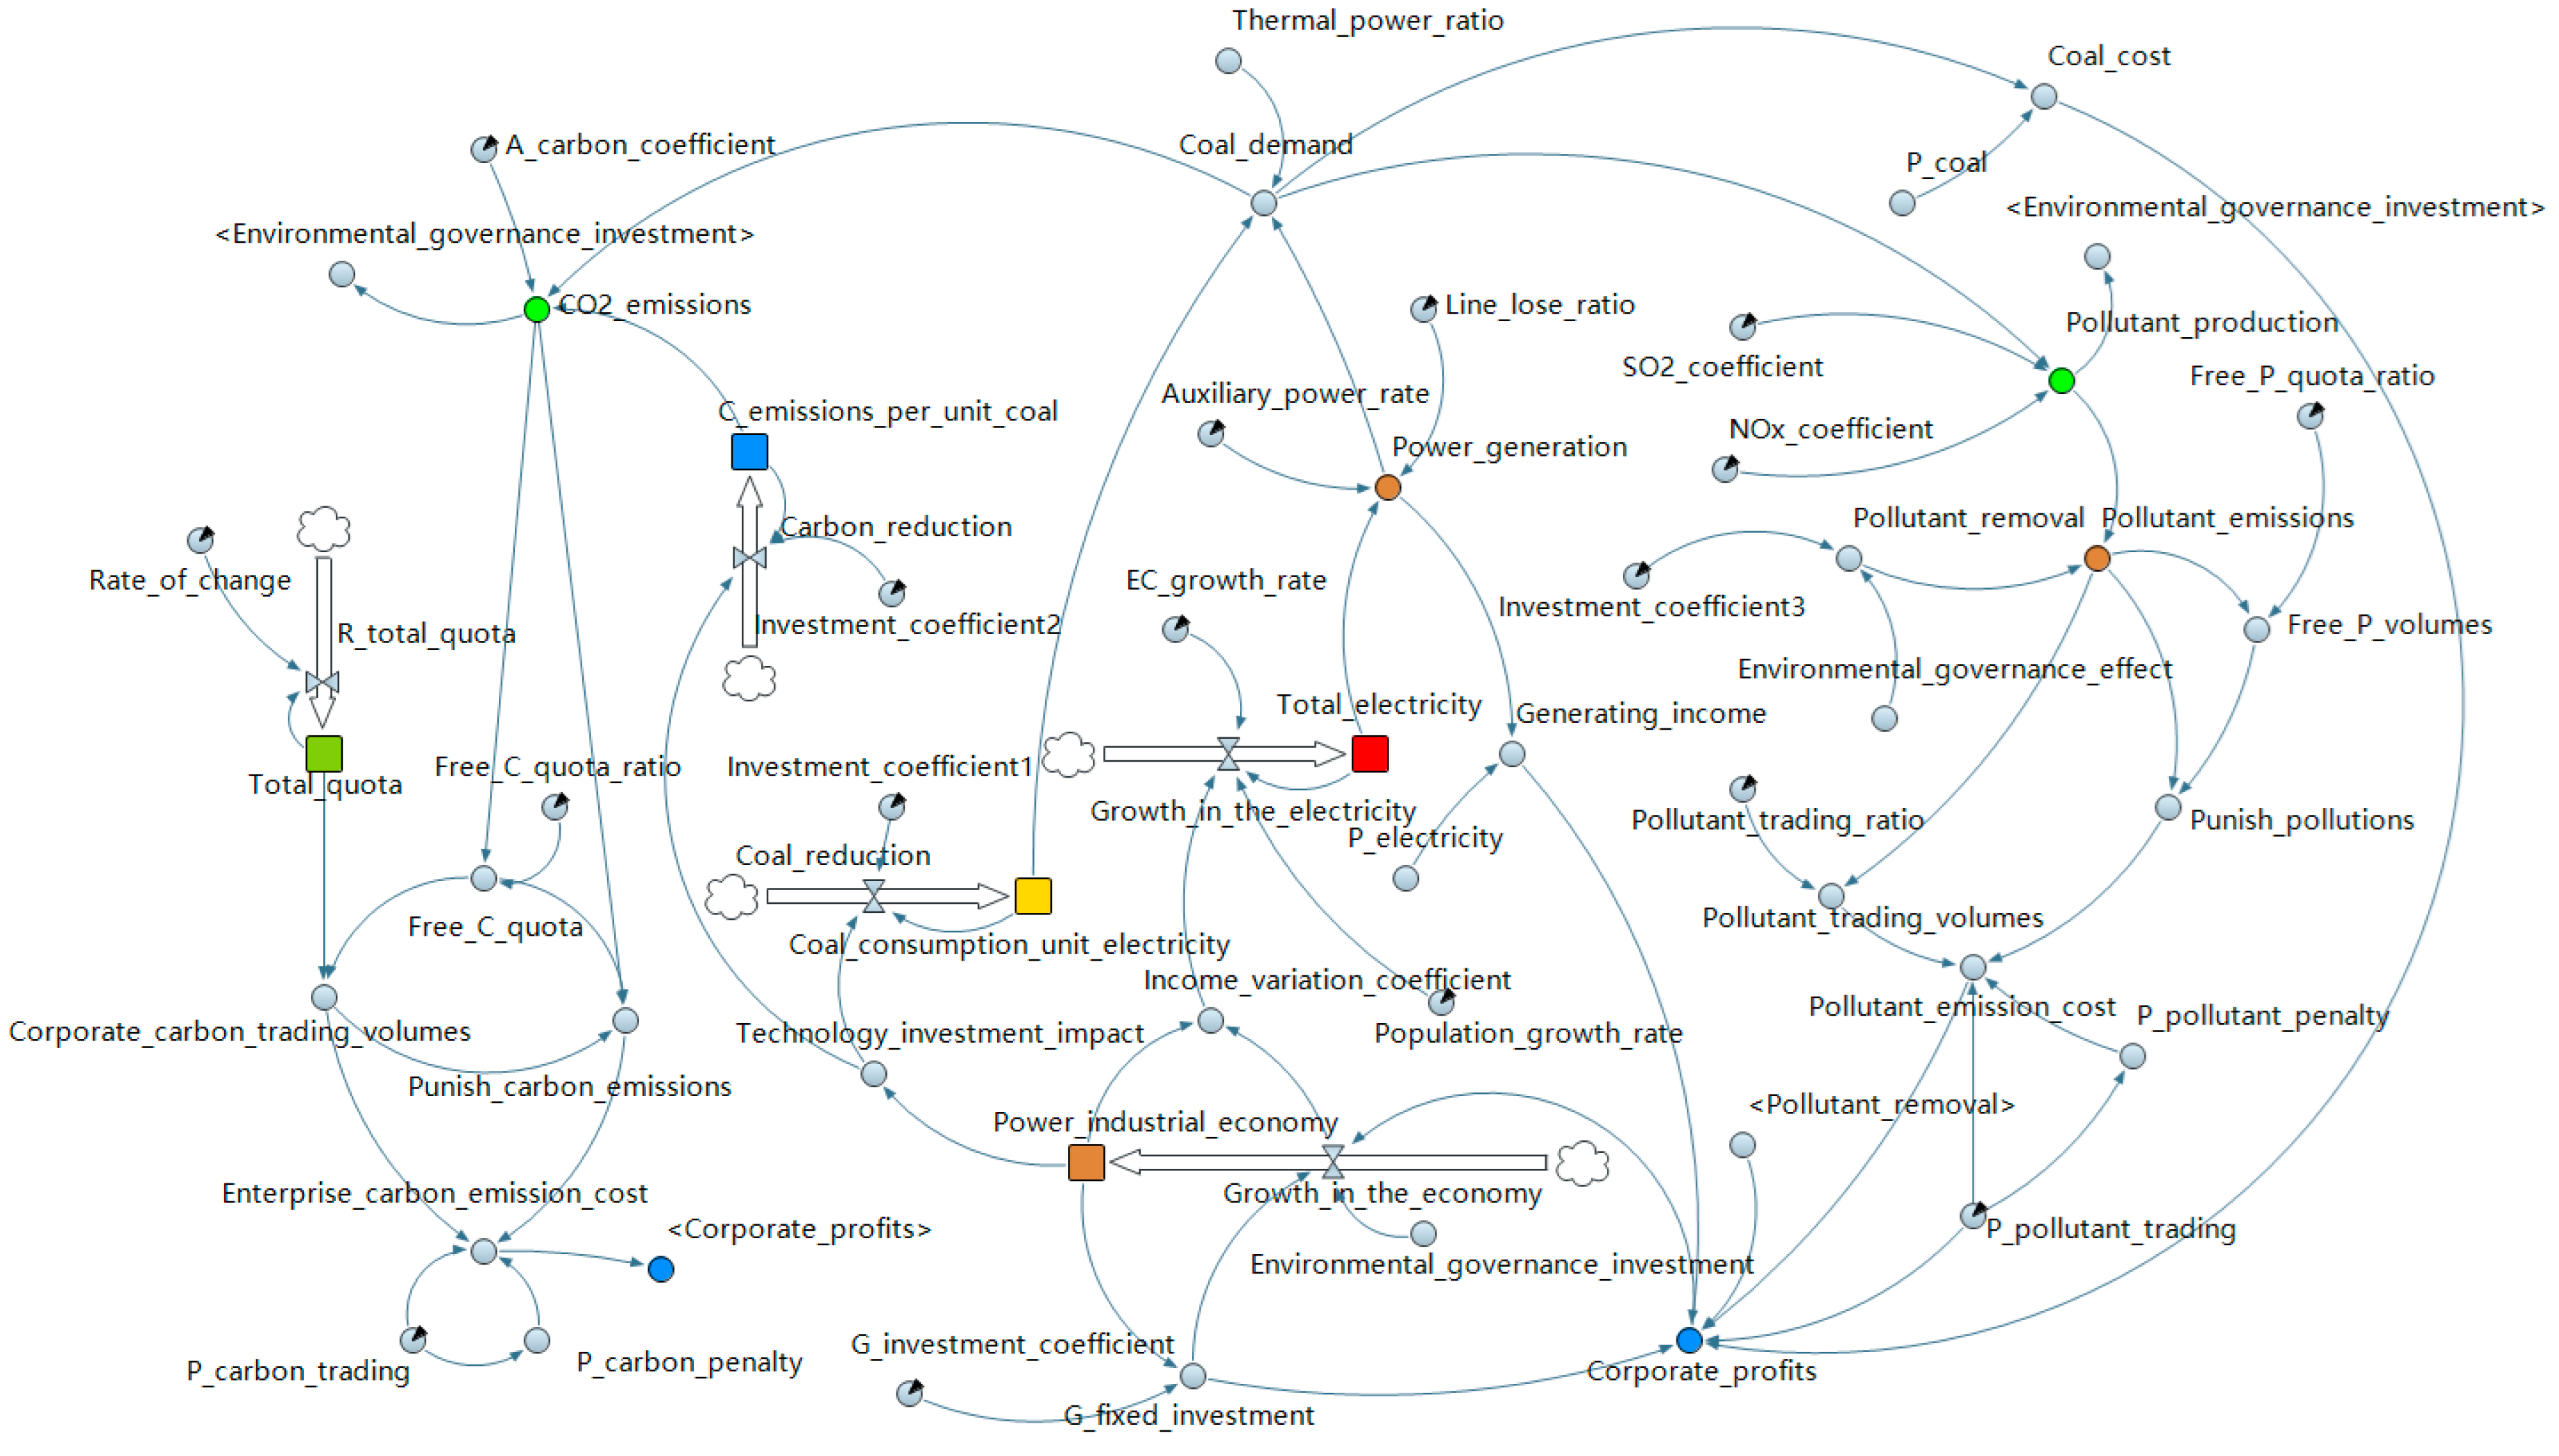
2.4. Stock Flow Diagram
2.5. Main Parameters and Variables
3. The Empirical Research
3.1. Validation Test
3.2. Simulation Scenario Design
3.3. Simulation Analysis
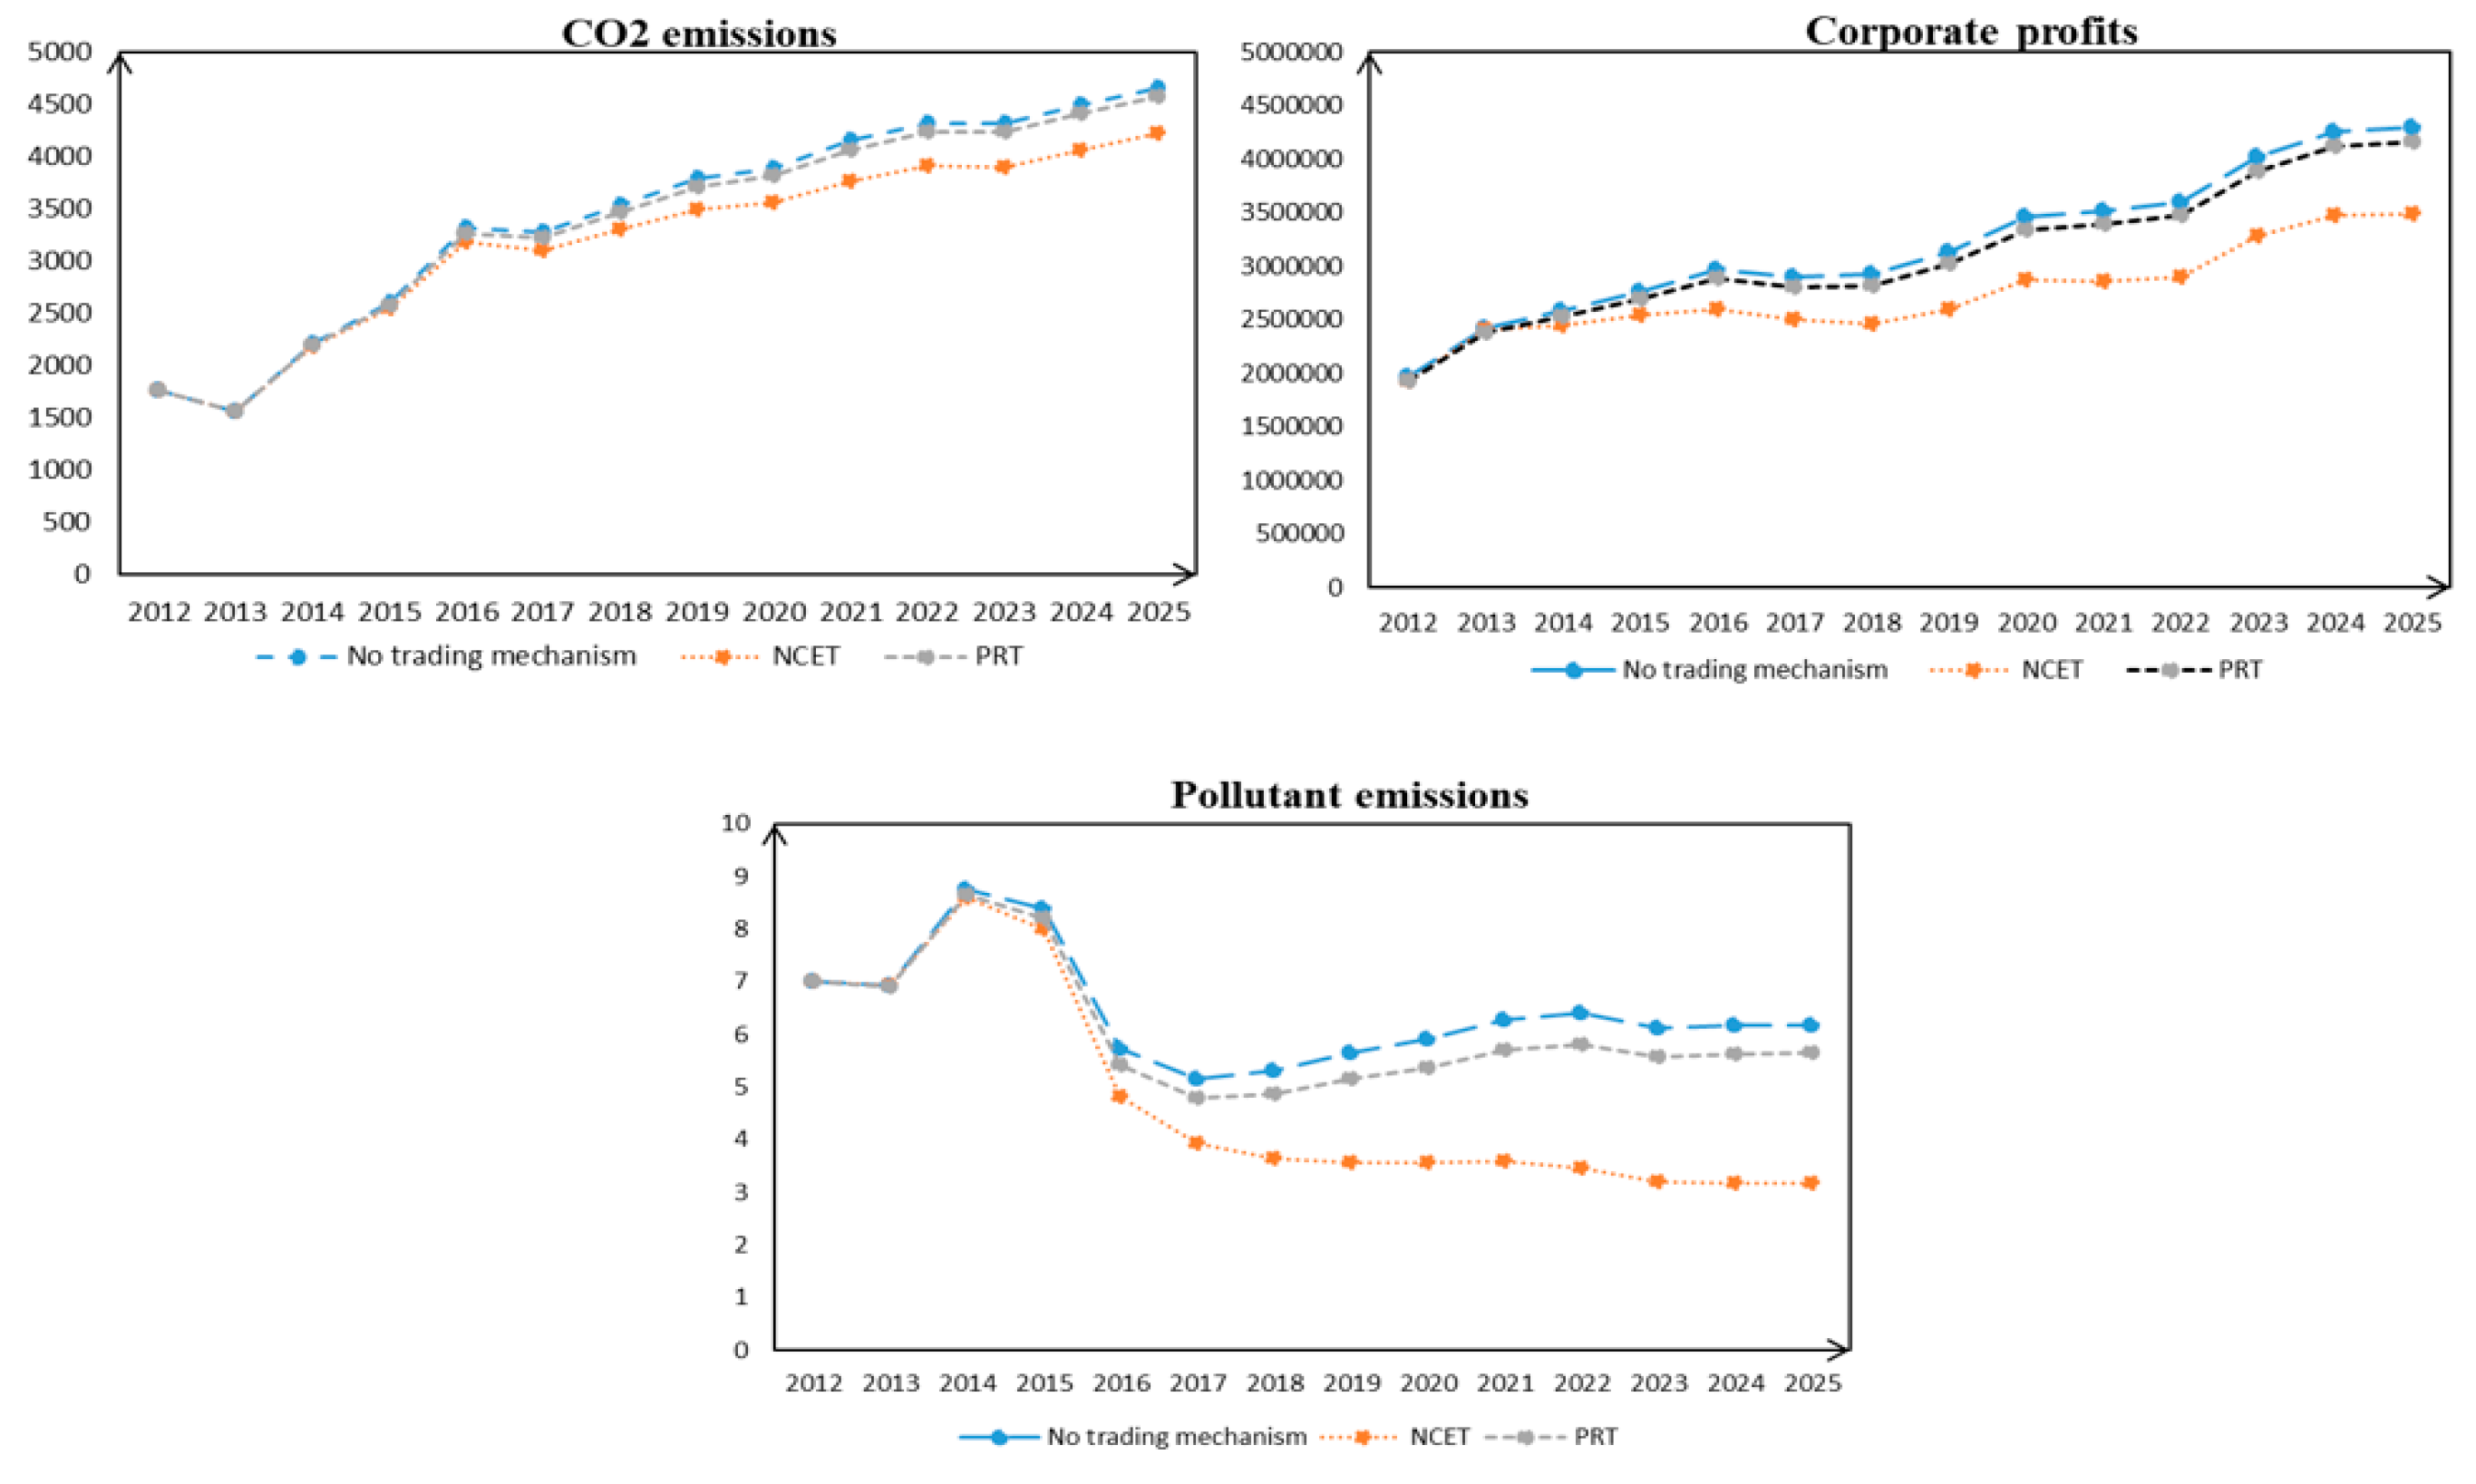
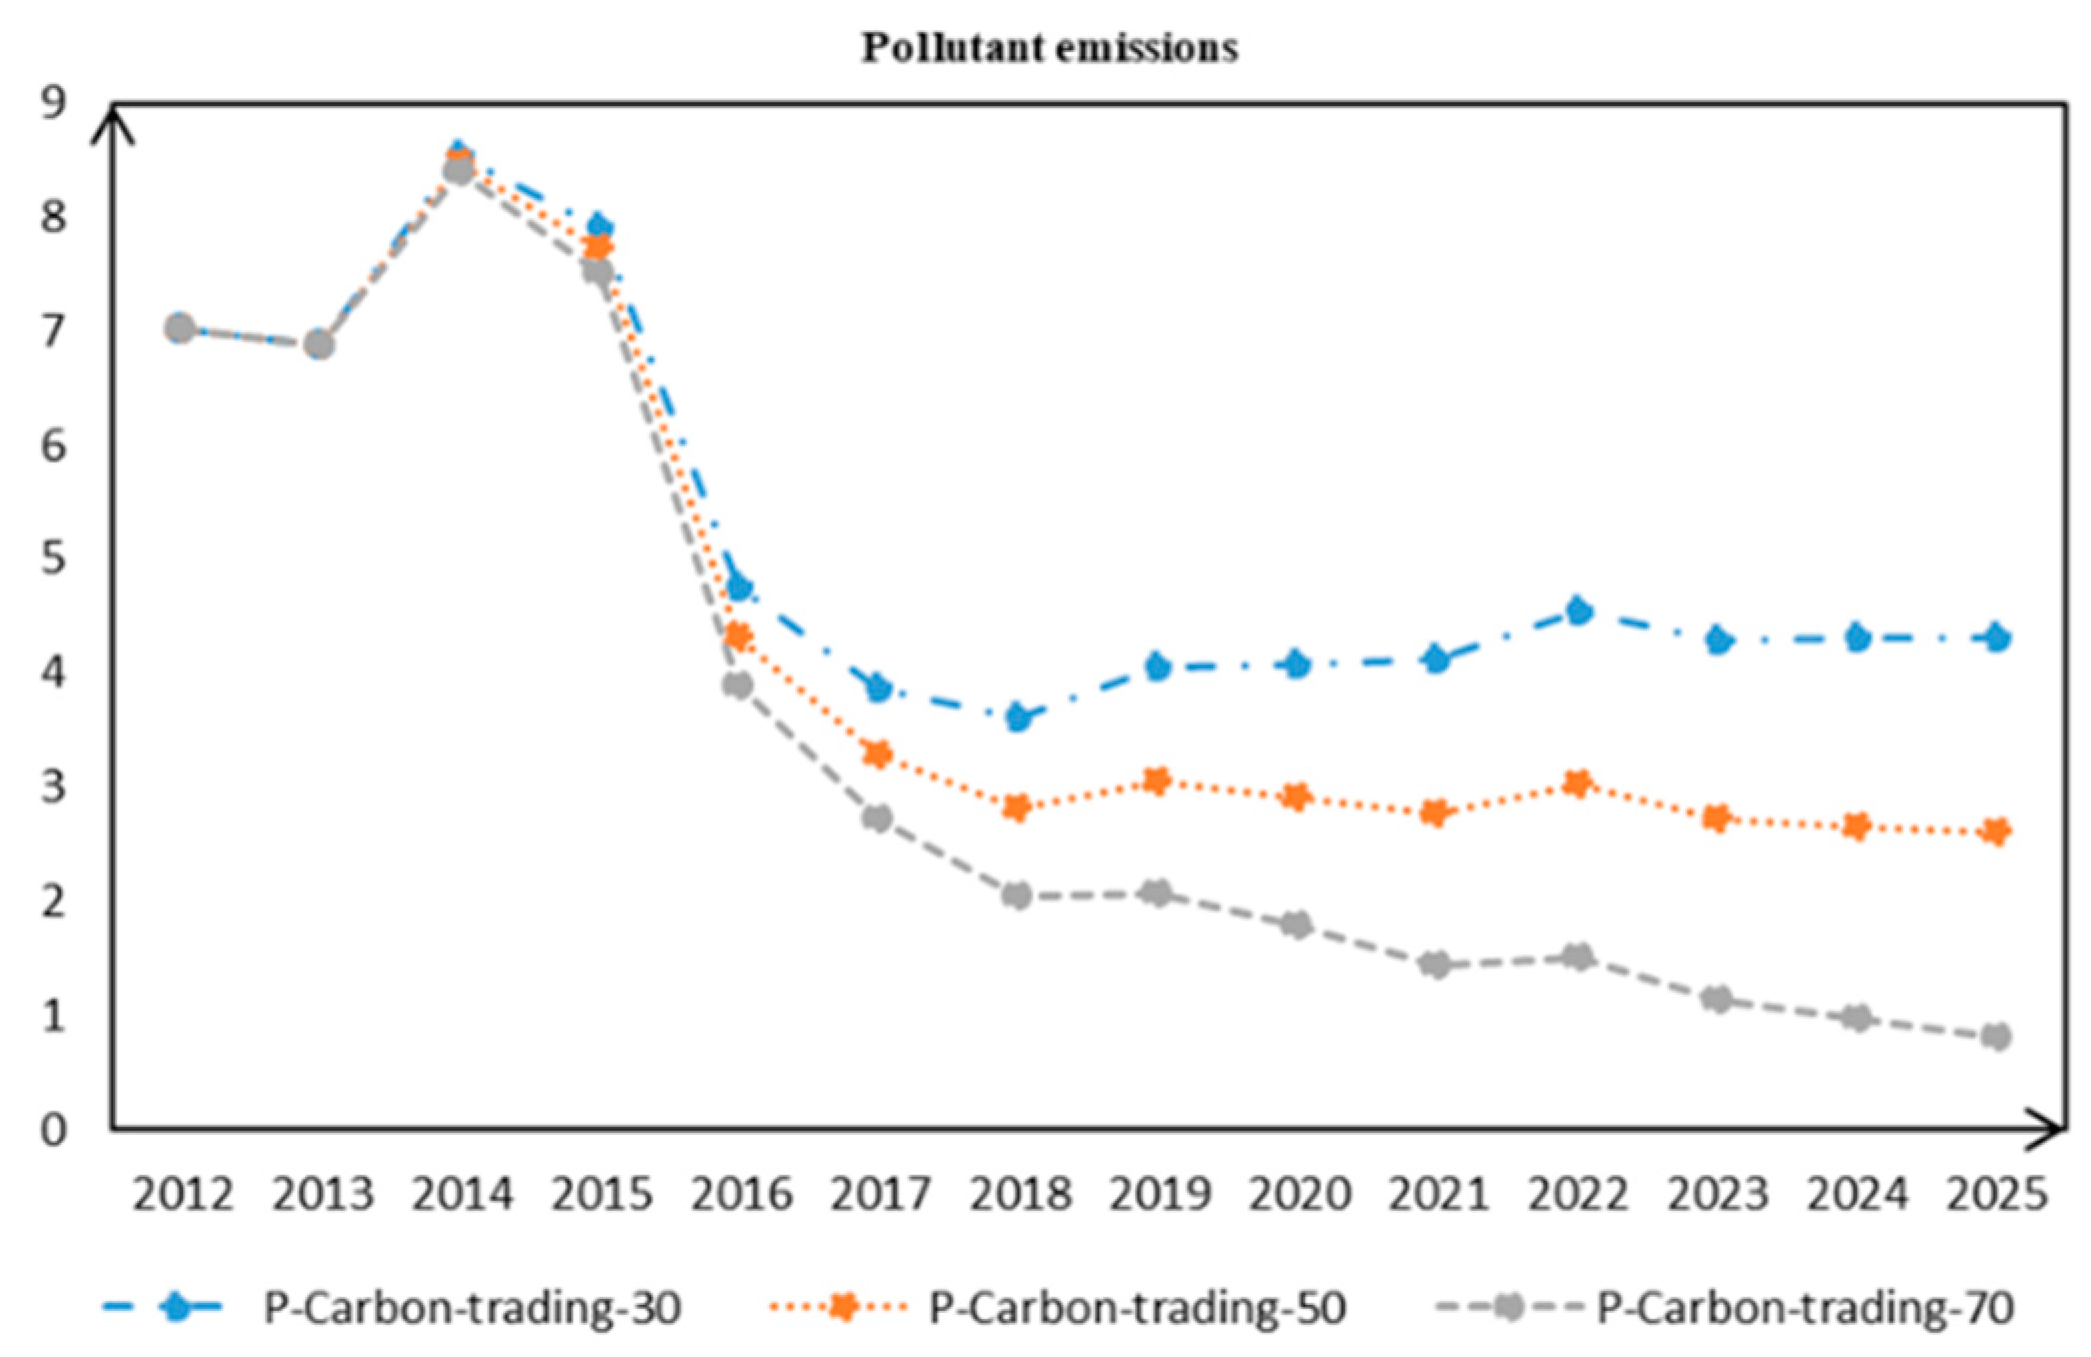
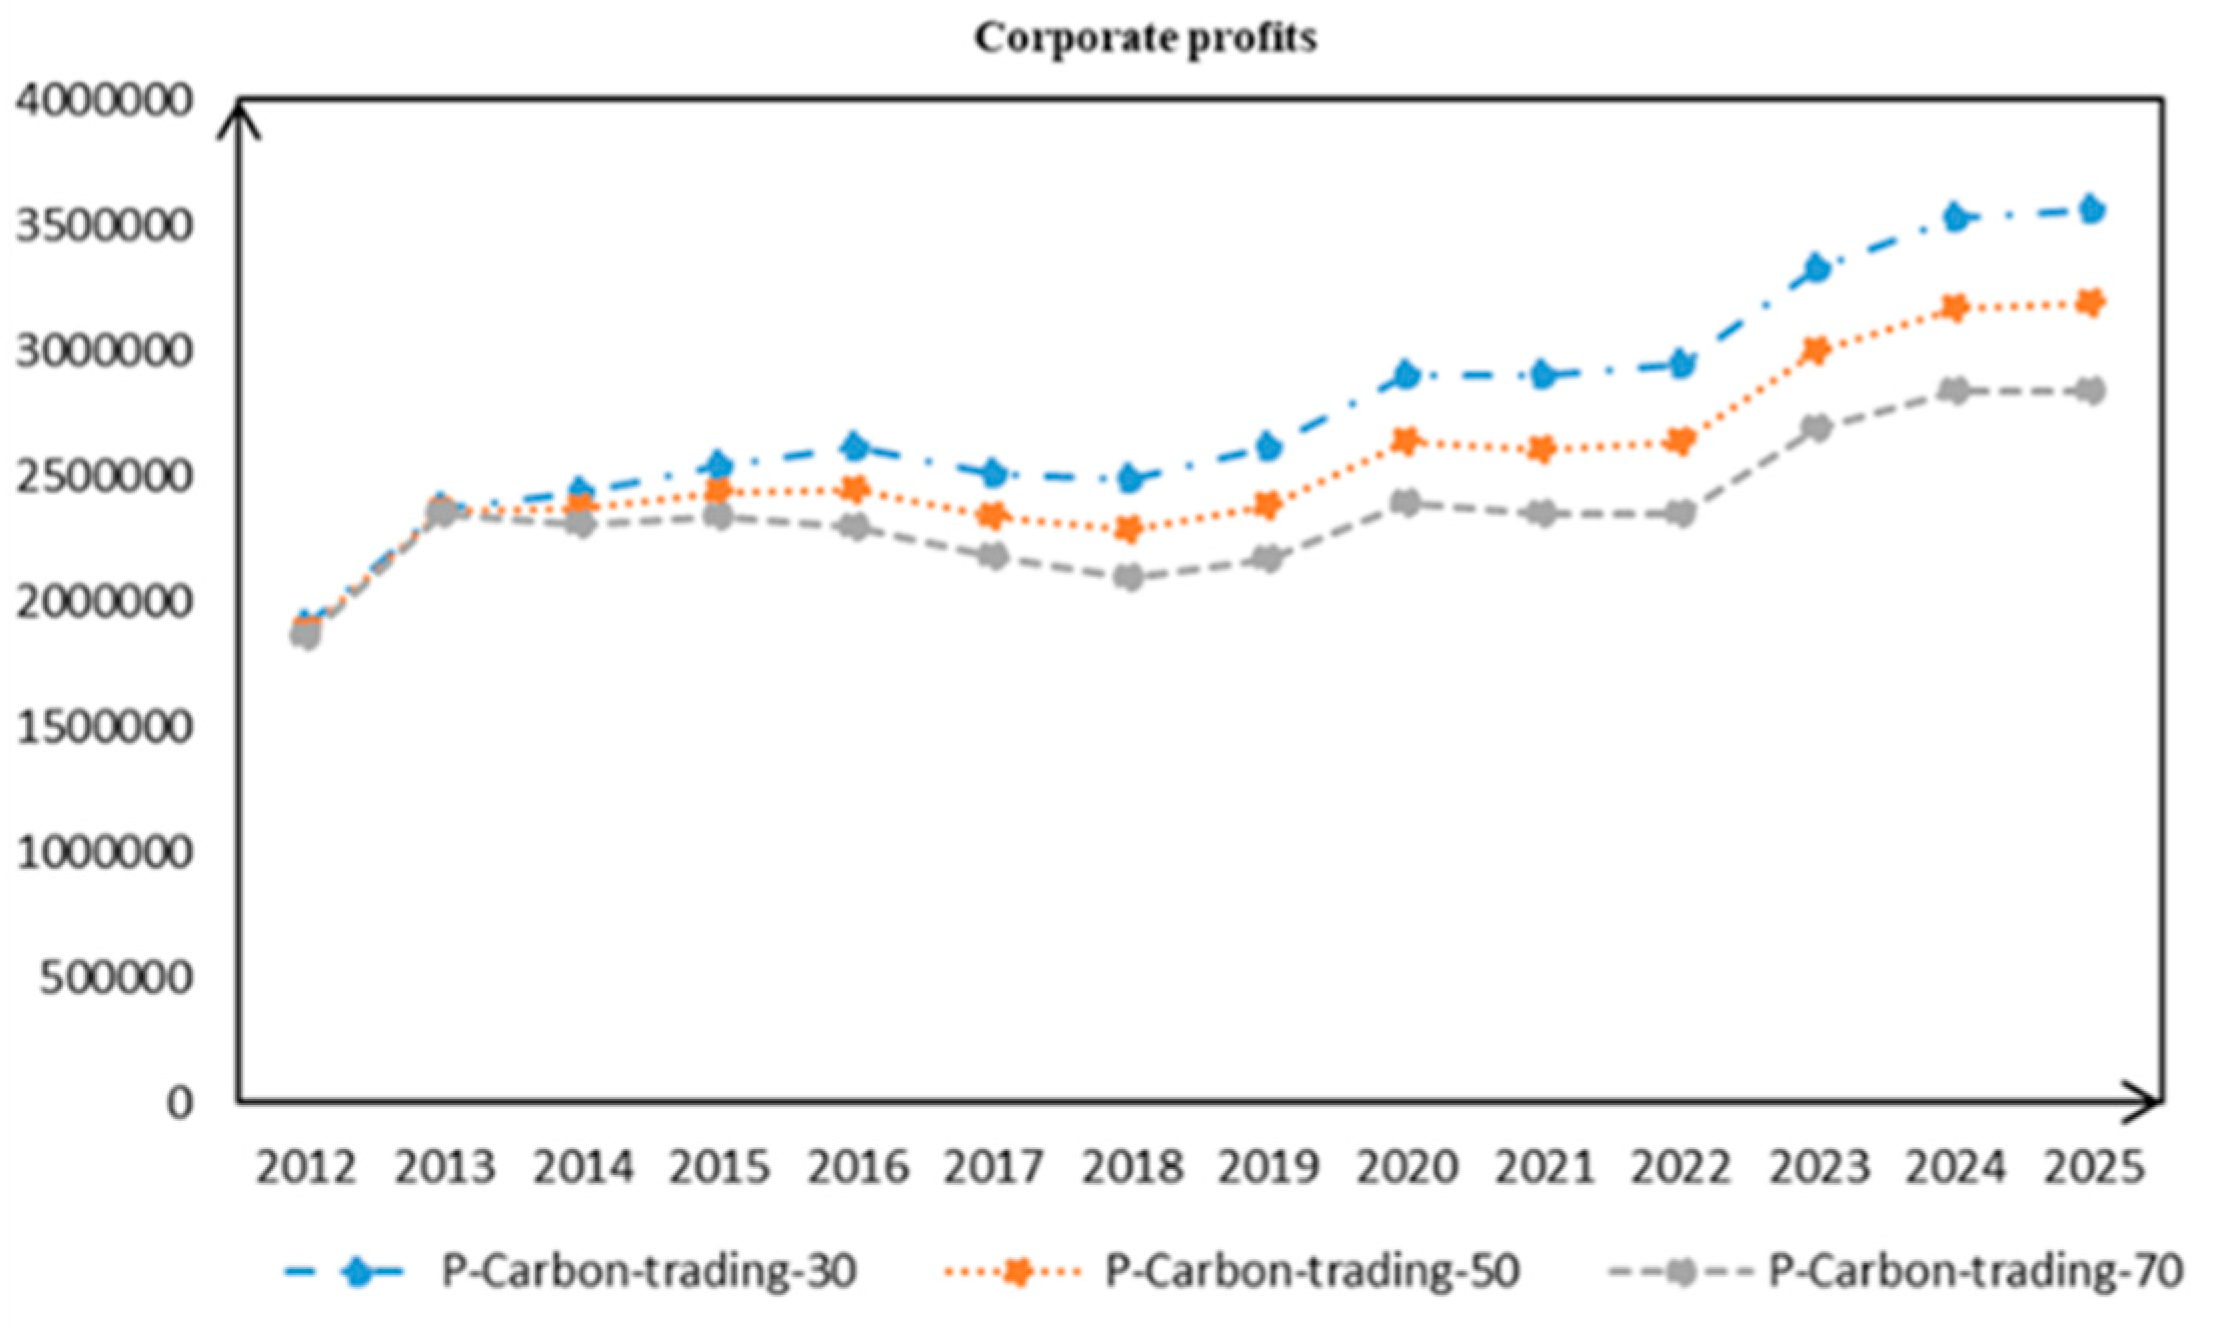
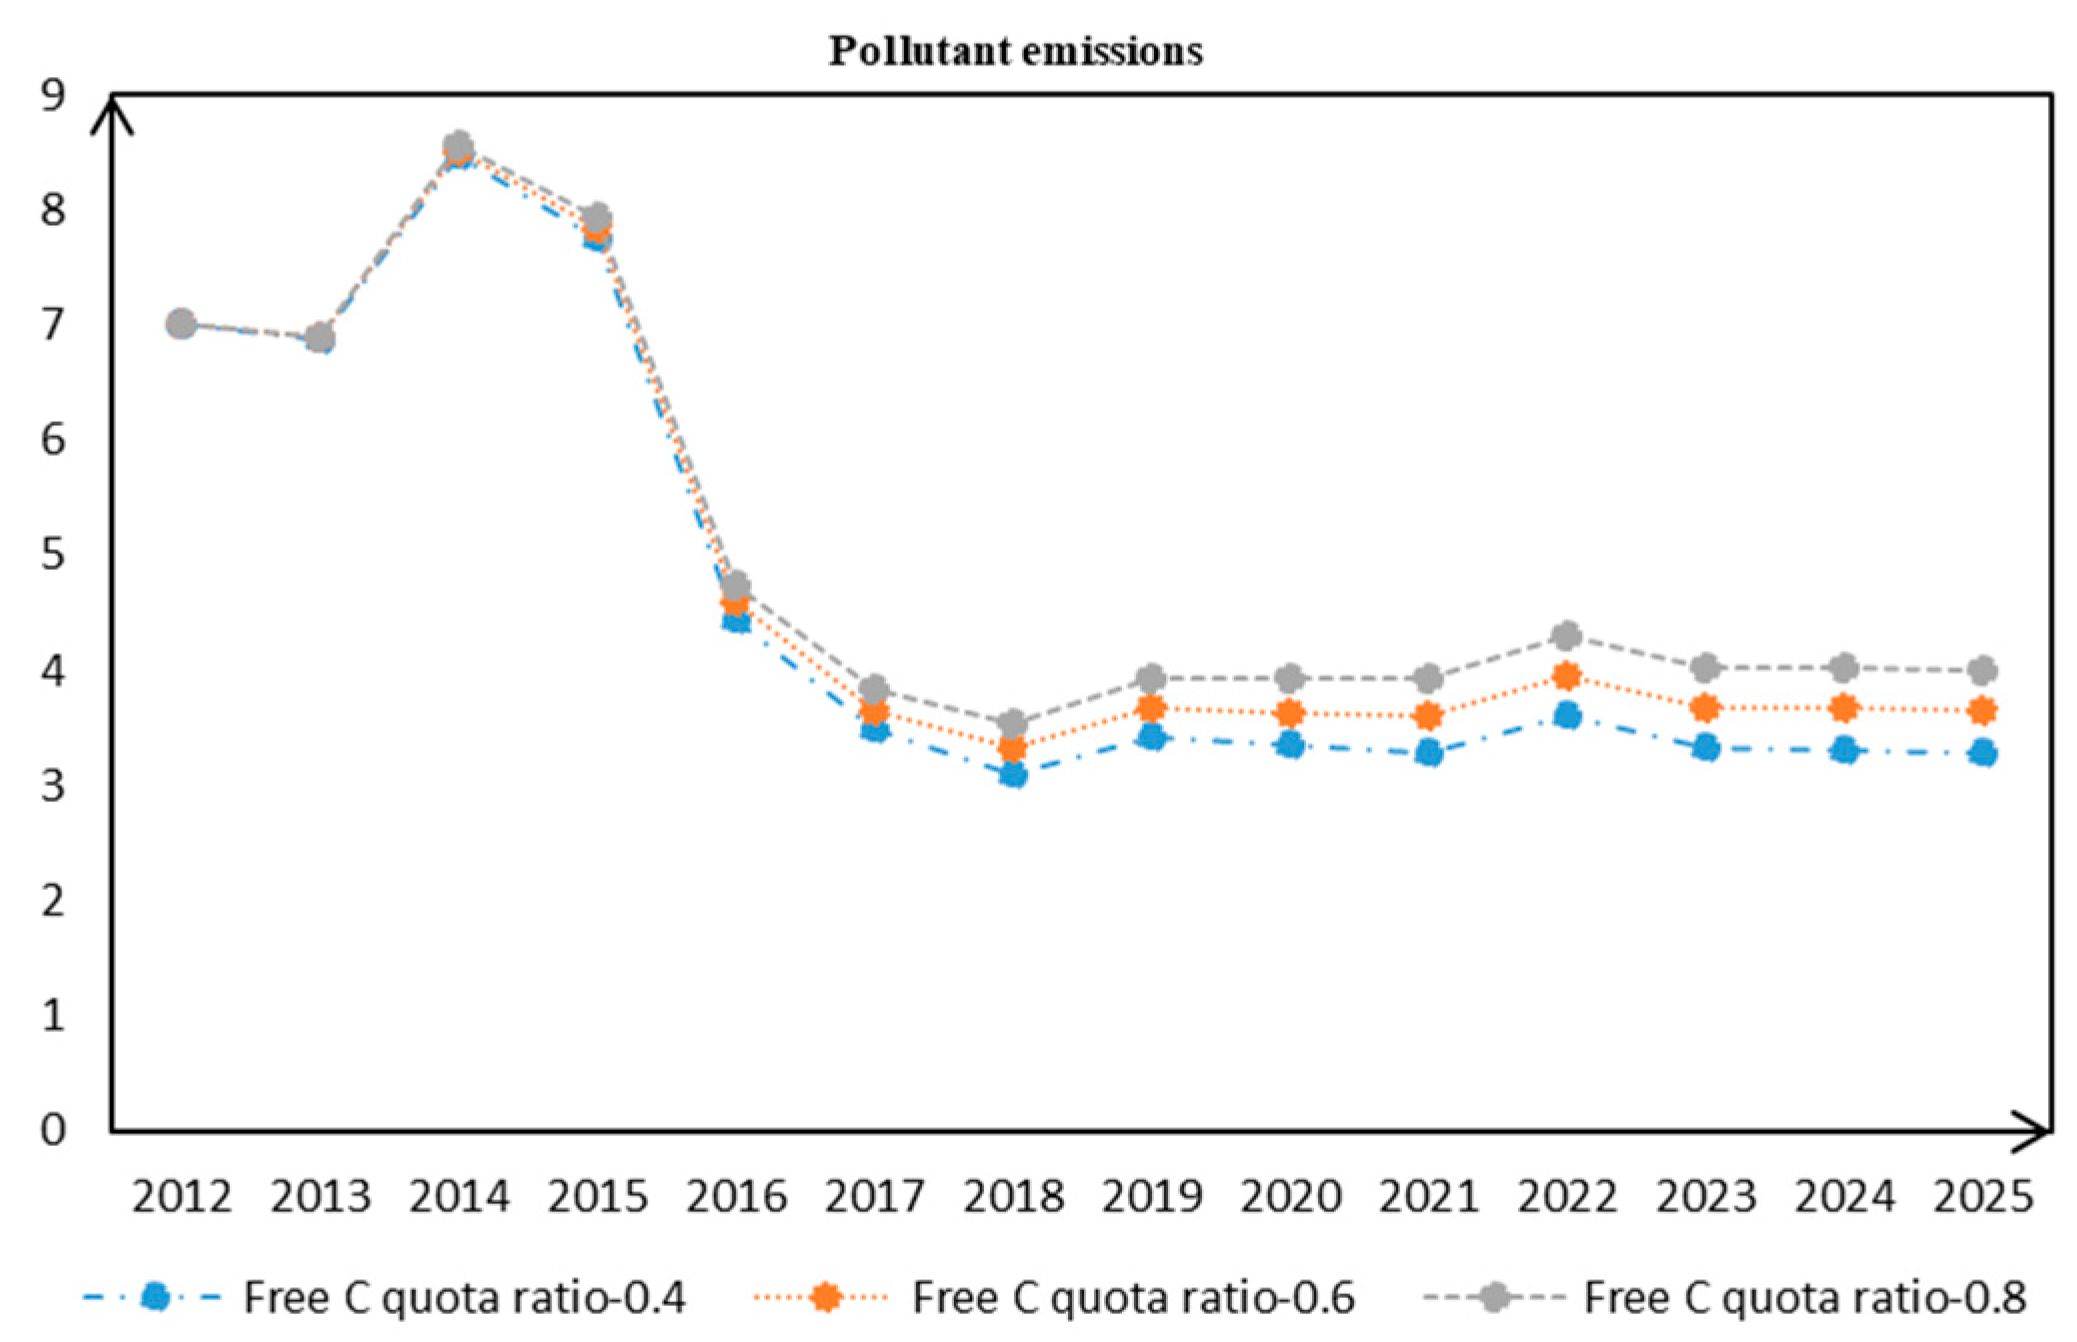
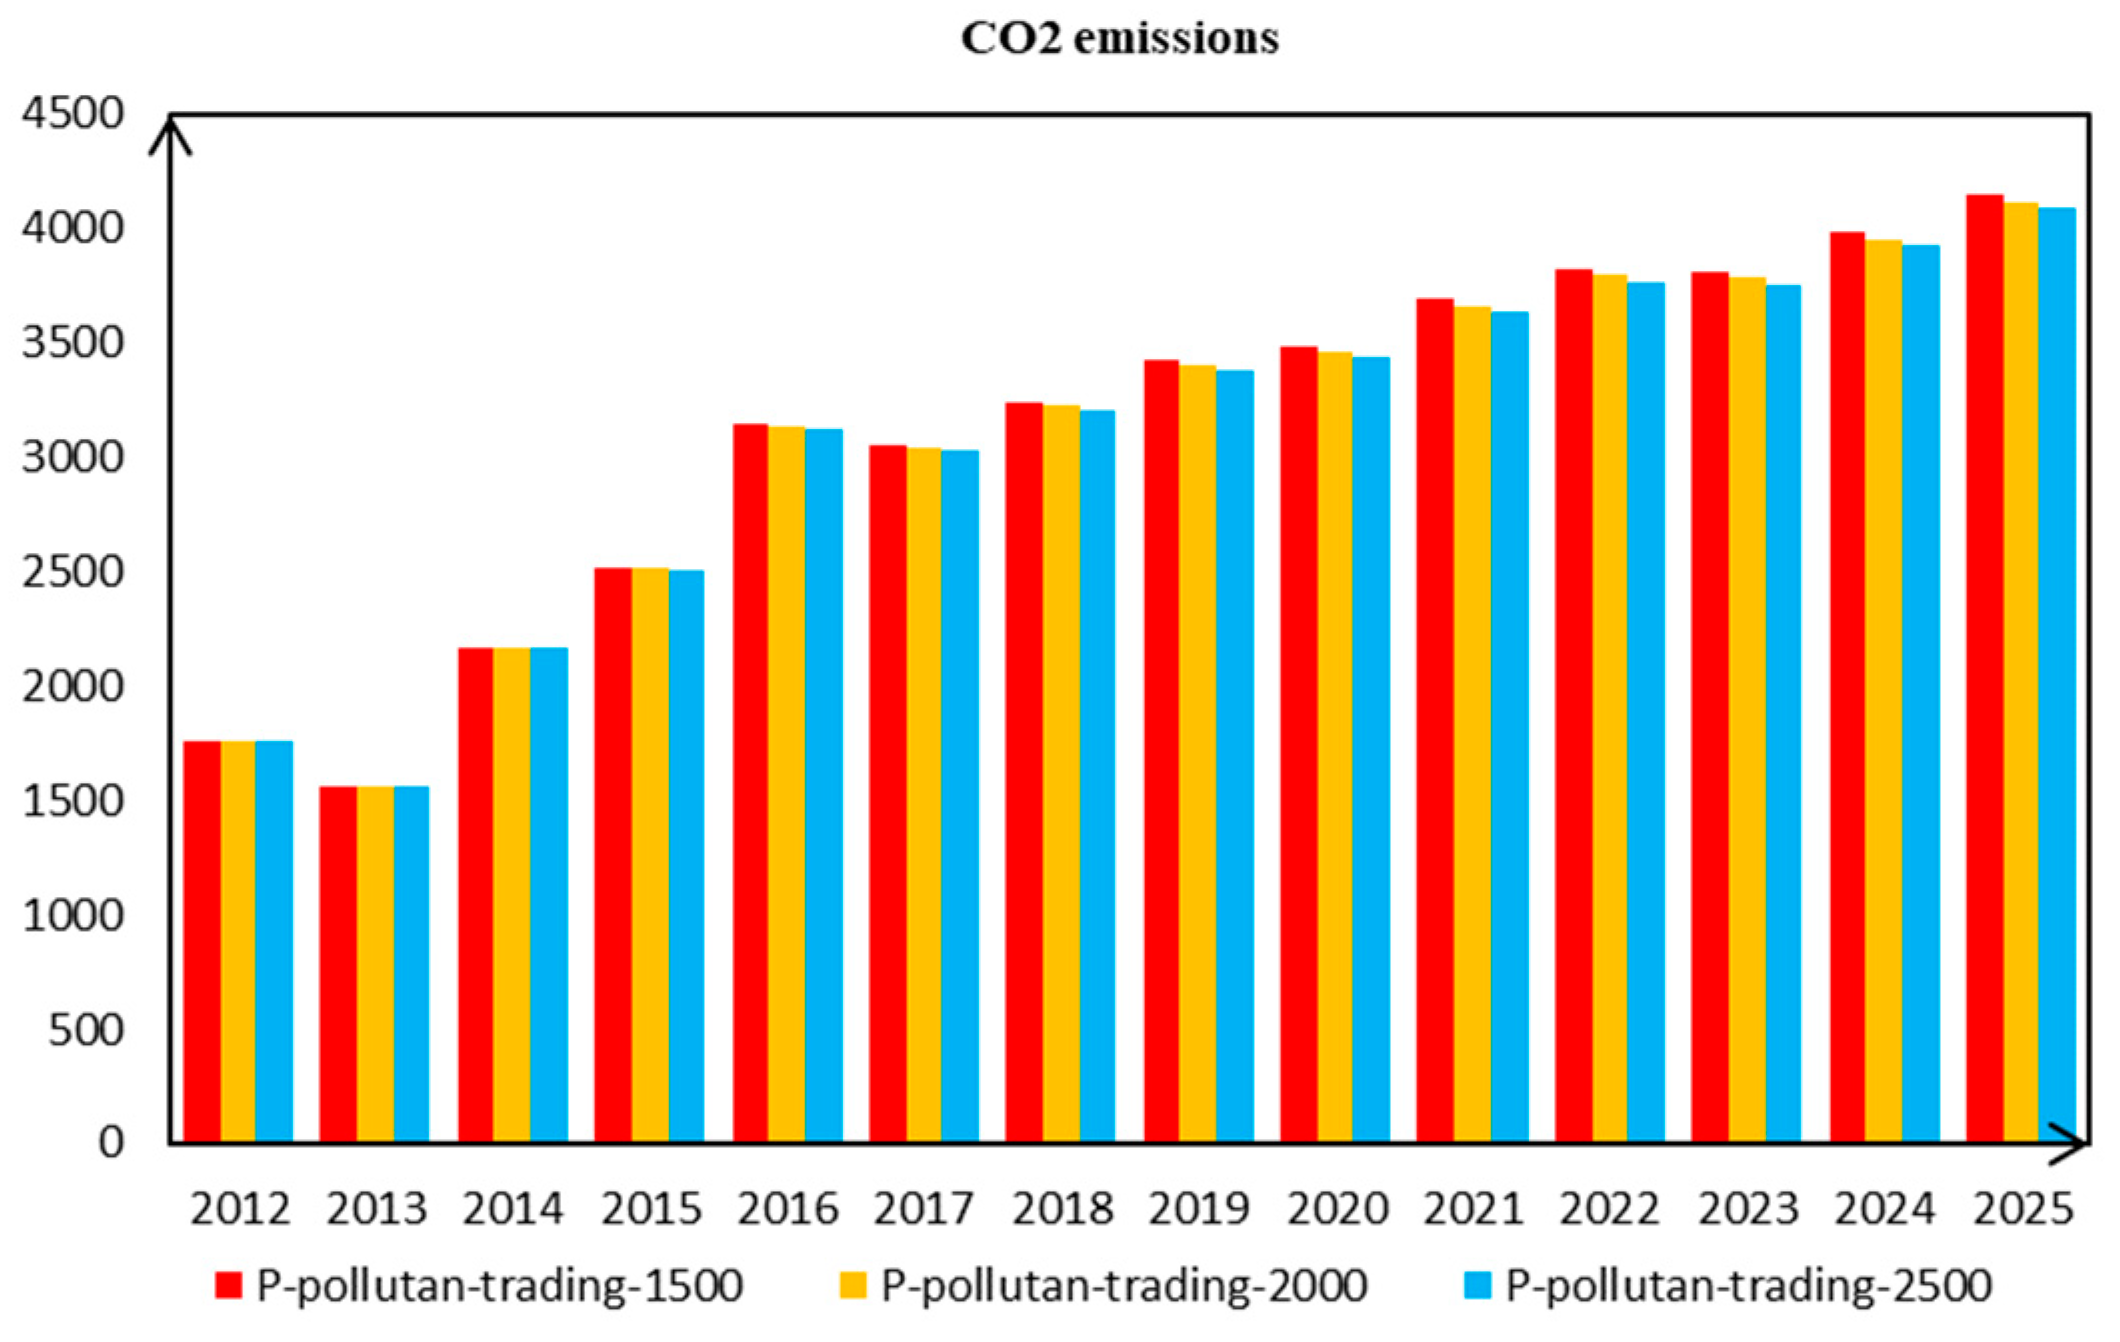
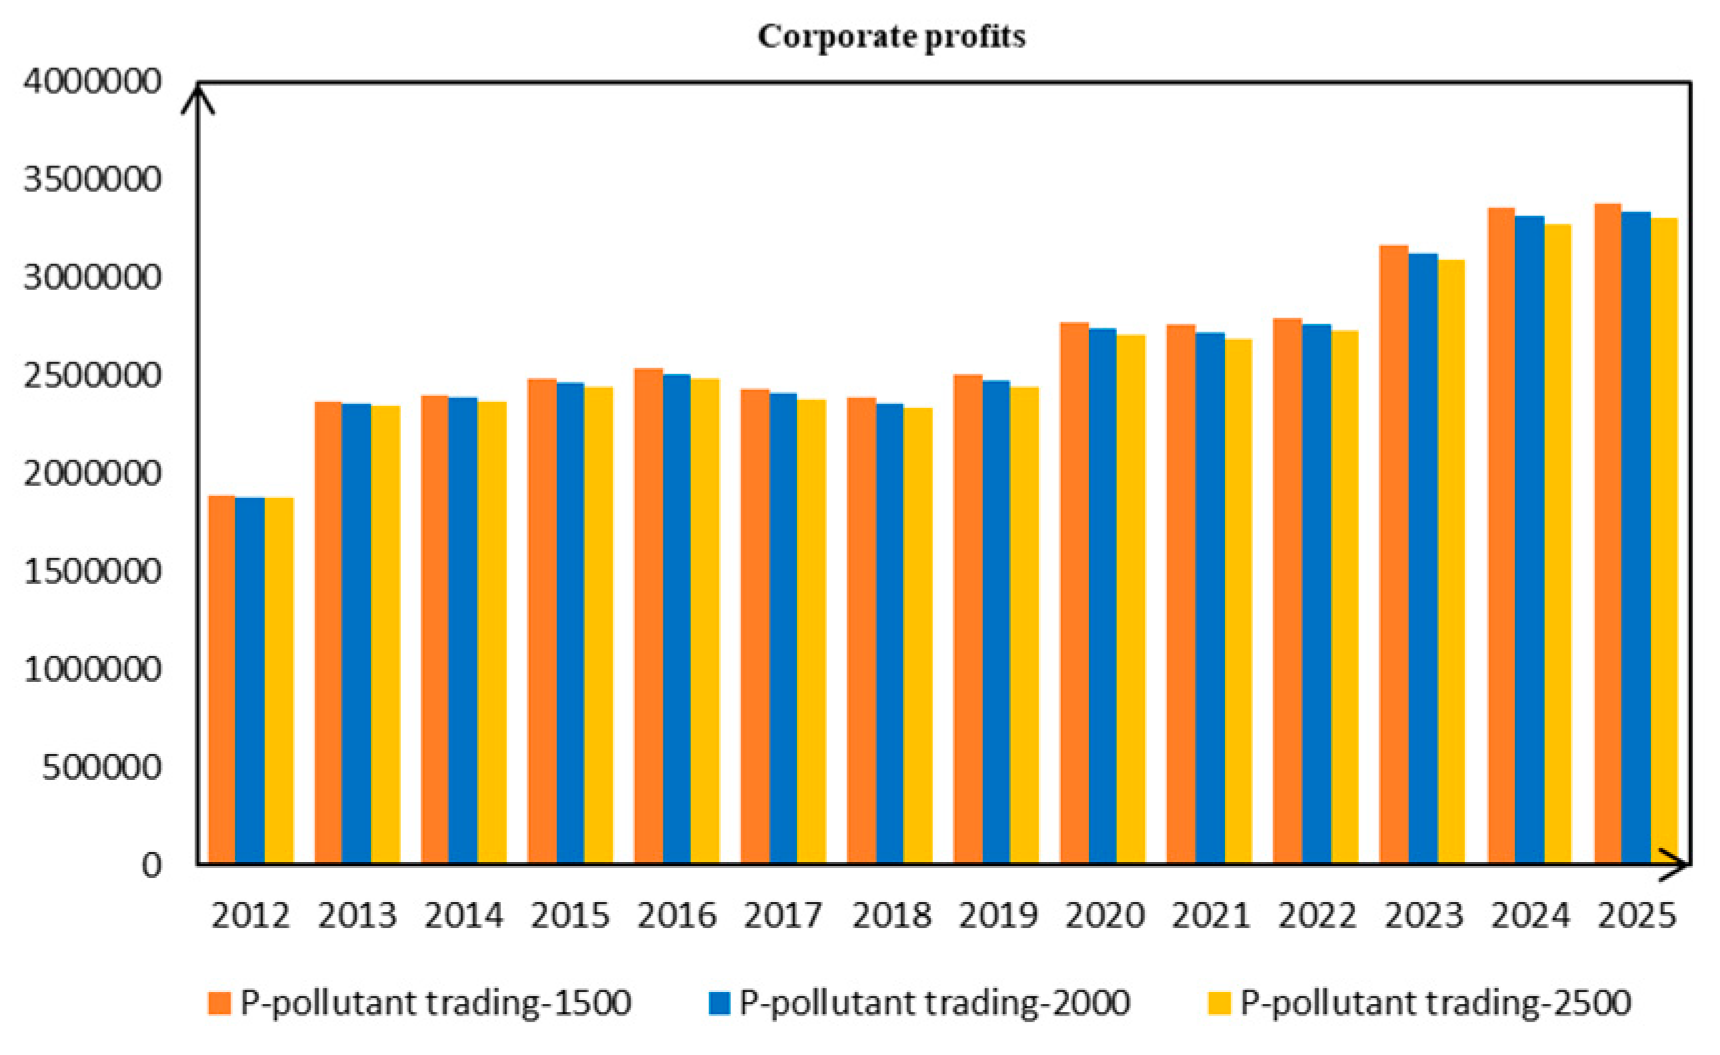
3.3.1. The Impact of Carbon Emissions Trading and Pollution Rights Trading
3.3.2. The Interaction of Trading Mechanisms
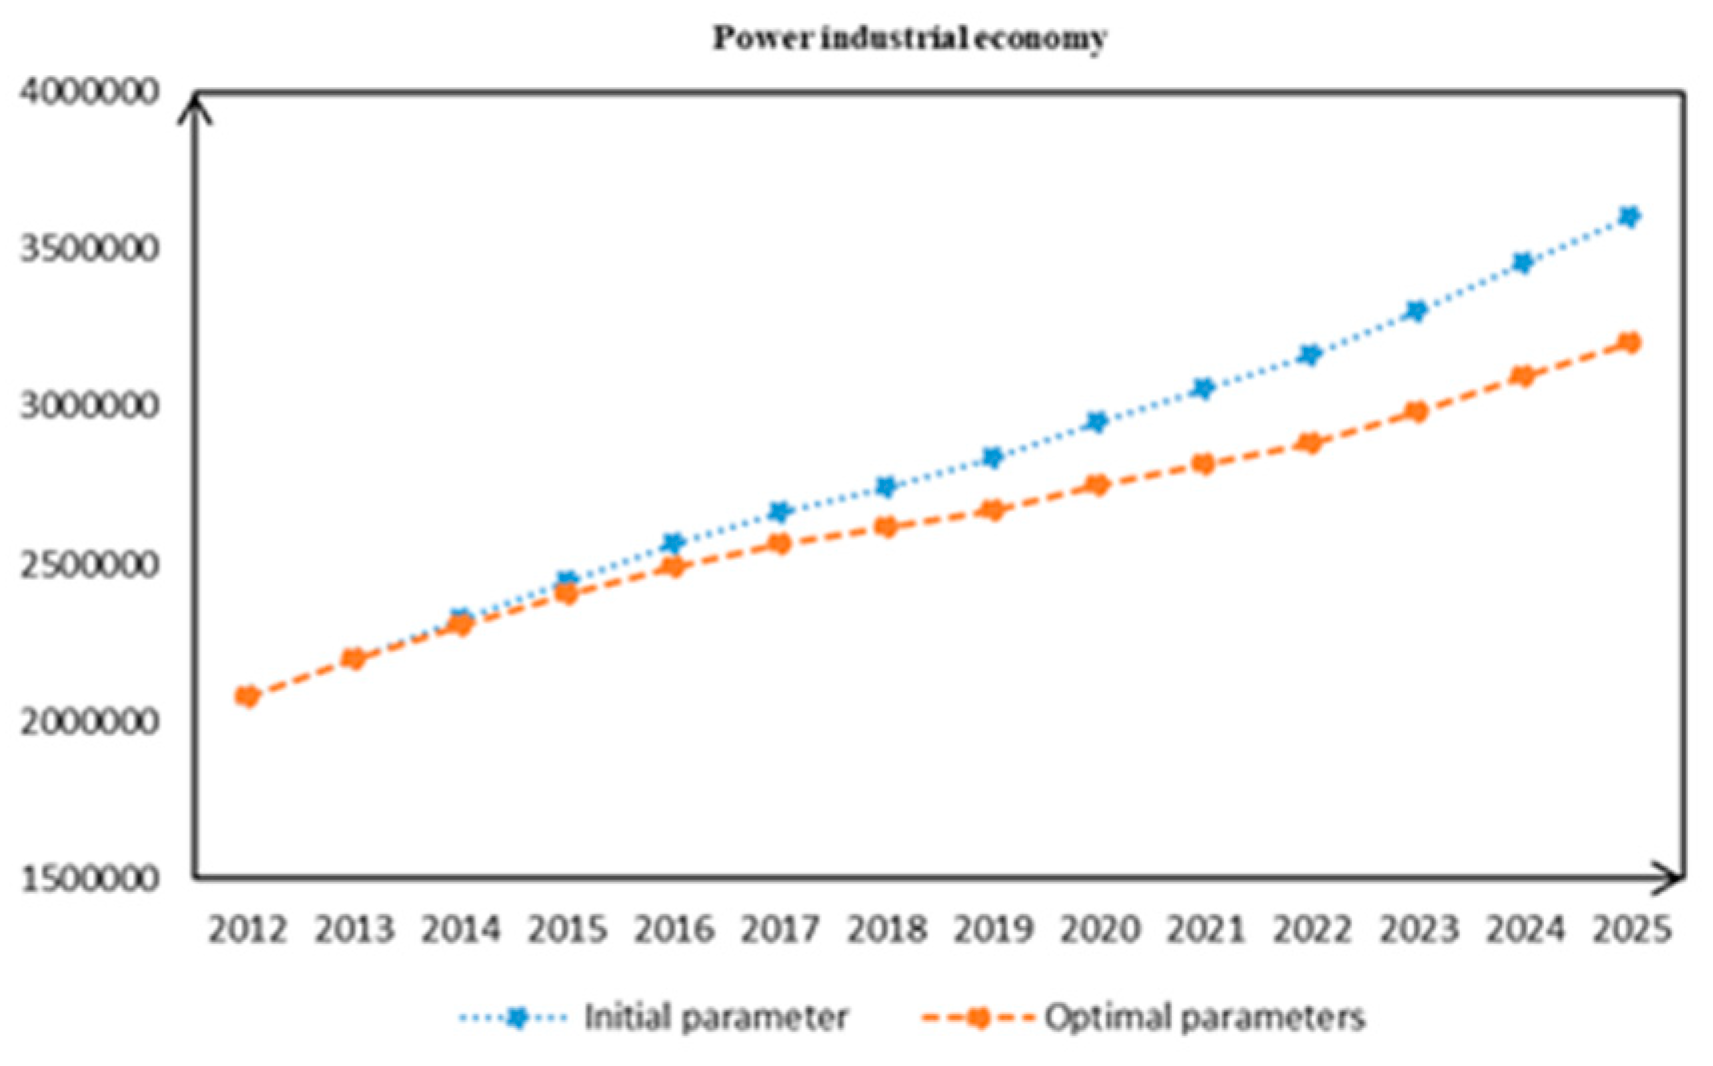
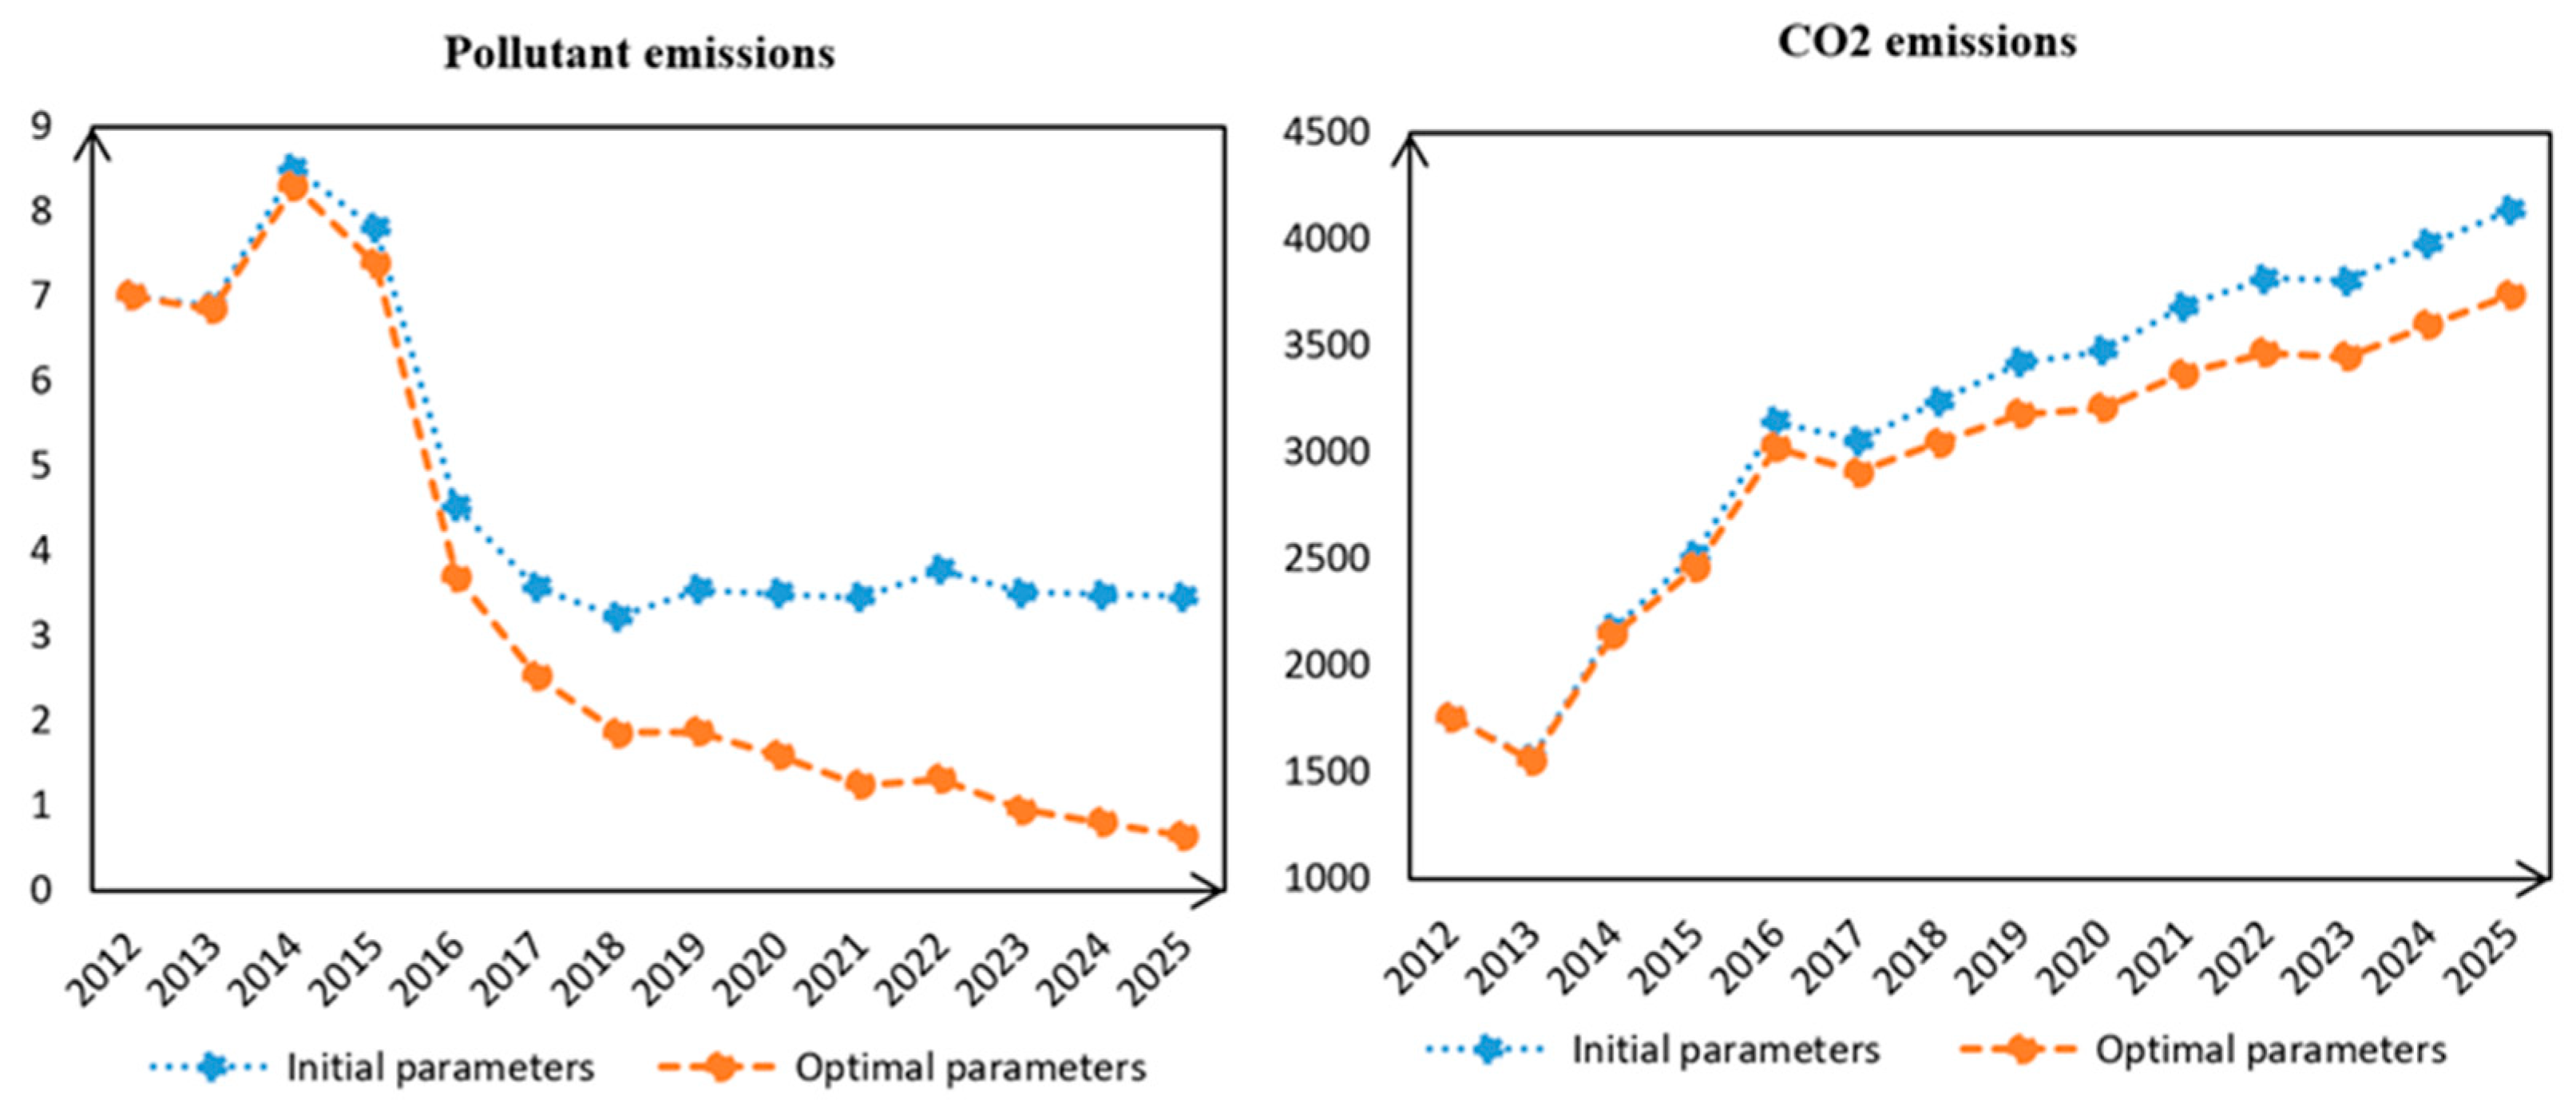
3.3.3. Simulation Optimization
4. Conclusions and Future Research Needs
- Under the influence of carbon emissions trading (NCET) and pollution rights trading (PRT), the pollutant discharge and carbon dioxide emissions of the power industry in Chongqing have been significantly reduced, and the environment has been improved noticeably, but at the same time, it will have a certain impact on the economy and reduce the profits of enterprises.
- Under the effect of the carbon trading mechanism, reducing the amount of free quota or increasing the price of carbon trading will reduce the emission of pollutants; pollution rights trading (PRT) has a similar effect on carbon dioxide emissions, but not as strong.
- At a certain range of economic levels and corporate profits, the simulation optimization can make the corporate profit loss smaller under certain conditions and at the same time obtain a larger income from emission reduction.
Author Contributions
Funding
Conflicts of Interest
References
- National Development and Reform Commission (NDRC). Notice on the Implementation of Pilot Carbon Emission Trading. Available online: http://zfxxgk.ndrc.gov.cn/web/iteminfo.jsp?id=1349 (accessed on 29 October 2011).
- National Development and Reform Commission (NDRC). The 13th Five-Year Plan for Electric Power Development. Available online: http://zfxxgk.ndrc.gov.cn/web/iteminfo.jsp?id=398 (accessed on 22 December 2016).
- National Development and Reform Commission (NDRC). Notice on the Implementation of Key Tasks in the National Carbon Emission Trading Market. Available online: http://zfxxgk.ndrc.gov.cn/web/iteminfo.jsp?id=2944 (accessed on 18 December 2017).
- Jiaxing City Government. Notice on the Issuance of Measures for Trading the Emission Rights of Major Pollutants in Jiaxing (for Trial Implementation). Available online: http://www.jiaxing.gov.cn/art/2007/9/27/art_1590761_27355431.html (accessed on 27 September 2007).
- Galinis, A.; Leeuwen, M. A cge model for lithuania: The future of nuclear energy. J. Policy Model. 2000, 22, 691–718. [Google Scholar] [CrossRef]
- Stern, N. The Economics of Climate Change, 1st ed.; TSO (The Stationery Office): Britain, UK, 2006; Volume 98, pp. 1–37. [Google Scholar]
- Linares, P.; Javier, S.F.; Ventosa, M. Incorporating oligopoly, CO2 emissions trading and green certificates into a power generation expansion model. Automatica 2008, 44, 1608–1620. [Google Scholar] [CrossRef]
- Keohane, N.O. Cap and Trade, Rehabilitated: Using Tradable Permits to Control U.S. Greenhouse Gases. Rev. Environ. Econ. Policy 2008, 3, 42–62. [Google Scholar] [CrossRef]
- Zhanga, Y. Research on international carbon emissions trading and optimal exports scale of china carbon emissions. Procedia Environ. Sci. 2011, 10, 101–107. [Google Scholar] [CrossRef][Green Version]
- Cui, L.B.; Fan, Y.; Zhu, L.; Bi, Q.H. How will the emissions trading scheme save cost for achieving china’s 2020 carbon intensity reduction target? Appl. Energy 2014, 136, 1043–1052. [Google Scholar] [CrossRef]
- Li, W.; Jia, Z.J. The impact of emission trading scheme and the ratio of free quota: A dynamic recursive cge model in china. Appl. Energy 2016, 174, 1–14. [Google Scholar] [CrossRef]
- Tang, L.; Wu, J.Q.; Yu, L.A.; Bao, Q. Carbon allowance auction design of china\s emissions trading scheme: A multi-agent-based approach. Energy Policy 2017, 102, 30–40. [Google Scholar] [CrossRef]
- Zhang, Y.J.; Hao, J.F. Carbon emission quota allocation among china’s industrial sectors based on the equity and efficiency principles. Ann. Oper. Res. 2017, 255, 117–140. [Google Scholar] [CrossRef]
- Zhao, X.G.; Wu, L.; Li, A. Research on the efficiency of carbon trading market in china. Renew. Sustain. Energy Rev. 2017, 79, 1–8. [Google Scholar] [CrossRef]
- Li, L.; Liu, D.; Hou, J.; Xu, D.D.; Chao, W.B. The Study of the Impact of Carbon Finance Effect on Carbon Emissions in Beijing-Tianjin-Hebei Region—Based on Logarithmic Mean Divisia Index Decomposition Analysis. Sustainability 2019, 11, 1465. [Google Scholar] [CrossRef]
- Zhou, J.G.; Li, Y.S.; Huo, X.J.; Xu, X.L. How to Allocate Carbon Emission Permits Among China’s Industrial Sectors Under the Constraint of Carbon Intensity? Sustainability 2019, 11, 914. [Google Scholar] [CrossRef]
- Martin, R.; Muûls, M.; Wagner, U.J. The impact of the european union emissions trading scheme on regulated firms: What is the evidence after ten years? Rev. Environ. Econ. Policy 2016, 10, 129–148. [Google Scholar] [CrossRef]
- Nugent, R.A. Teaching tools: A pollution rights trading game. Econ. Inq. 1997, 35, 679–685. [Google Scholar] [CrossRef]
- Chen, B.W.; Xiao, Z.H. Study on the property right of emission trading in china. Adv. Mater. Res. 2011, 233, 2087–2090. [Google Scholar] [CrossRef]
- Lu, Z. Emissions trading in china: Lessons from taiyuan so\r, 2\r, emissions trading program. Sustain. Account. Manag. Policy J. 2011, 2, 27–44. [Google Scholar] [CrossRef]
- Liao, X.L.; Li, X.L.; Zhang, B.X. System Dynamics Modeling and Simulation of China’s SO2 Emission Trading Policy. In Proceedings of the International Conference on Computer Distributed Control & Intelligent Environmental Monitoring, Changsha, China, 19–20 February 2011. [Google Scholar]
- Li, X.Q.; Liu, M.L. A research on emission trading policy in electric power market based on network equilibrium theory. Adv. Mater. Res. 2013, 6, 869–870. [Google Scholar] [CrossRef]
- Tu, Z.G.; Shen, R.J. Can china’s industrial SO2 emissions trading pilot scheme reduce pollution abatement costs? Sustainability 2014, 6, 7621–7645. [Google Scholar] [CrossRef]
- Ma, X.L.; Wang, H.Q.; Wei, W.X. The role of emissions trading mechanisms and technological progress in achieving china’s regional clean air target: A cge analysis. Appl. Econ. 2019, 51, 155–169. [Google Scholar] [CrossRef]
- Zhao, Q.R.; Chen, Q.H.; Xiao, Y.T.; Tian, G.Q.; Chu, X.L.; Liu, Q.M. Saving forests through development? Fuelwood consumption and the energy-ladder hypothesis in rural Southern China. Transform. Bus. Econ. 2017, 16, 199–219. [Google Scholar]
- Tomas, B.; Dalia, S. Sustainability in the Electricity Sector through Advanced Technologies: Energy Mix Transition and Smart Grid Technology in China. Energies 2019, 12, 1142. [Google Scholar]
- Chen, J.D.; Cheng, S.L.; Nikic, V.; Song, M.L. Quo Vadis? Major Players in Global Coal Consumption and Emissions Reduction. Transform. Bus. Econ. 2018, 17, 112–132. [Google Scholar]
- Wu, G.; Baležentis, T.; Sun, C.W.; Xu, S.H. Source control or end-of-pipe control: Mitigating air pollution at the regional level from the perspective of the Total Factor Productivity change decomposition. Energy Policy 2019, 129, 1227–1239. [Google Scholar] [CrossRef]
- Chappin, E.J.L.; Dijkema, G.P.J. On the impact of CO2 emission-trading on power generation emissions. Technol. Forecast. Soc. Change 2009, 76, 358–370. [Google Scholar] [CrossRef]
- Chu, J.C.; Zeng, M.; Yang, L.L. Carbon Emissions Trading and Sustainable Development of Power Industry. In Proceedings of the International Conference on Electrical & Control Engineering, Hubei, China, 25–27 June 2010. [Google Scholar]
- Zhang, F.W.; Guo, Y.; Chen, X.P. Research on China’s Power Sector Carbon Emissions Trading Mechanism. Energy Procedia 2011, 12, 127–132. [Google Scholar] [CrossRef]
- Huang, Y.; Liu, L.; Ma, X.M.; Pan, X. Abatement technology investment and emissions trading system: A case of coal-fired power industry of shenzhen, china. Clean Technol. Environ. 2015, 17, 811–817. [Google Scholar] [CrossRef]
- Oestreich, A.M.; Tsiakas, I. Carbon emissions and stock returns: Evidence from the EU Emissions Trading Scheme. J. Bank. Financ. 2015, 58, 294–308. [Google Scholar] [CrossRef]
- Kahrl, F.; Williams, J.; Ding, J.H.; Hu, J.F. Challenges to China’s transition to a low carbon electricity system. Energy Policy 2011, 39, 4032–4041. [Google Scholar] [CrossRef]
- China Environment Statistical Yearbook (CESY). Available online: http://www.mee.gov.cn/gzfw_13107/hjtj/hjtjnb/201702/P020170223595802837498.pdf (accessed on 23 February 2017).
- Zhang, J.R.; Wang, Z.D.; Tang, L.; Yu, L.A. Research on the impact of carbon emission trading policies in beijing-tianjin-hebei region based on system dynamics. Chin. J. Manag. Sci. 2016, 24, 1–8. [Google Scholar]


| Variable | Computational formula | Unit |
|---|---|---|
| Corporate profits | (0.152 × G fixed investment – Enterprise carbon emission cost + Generating income – Coal cost – Pollutant emission cost – Pollutant removal × P pollutant trading × 1.1)/100 | Million yuan |
| Growth in the economy | (Corporate profits × 0.15 + Environmental governance investment – 0.158 × G fixed investment)/100 | Million yuan |
| G fixed investment | Industrial power economy × G investment coefficient/100 | Million yuan |
| Income variation coefficient | Economic increment / Industrial power economy | —— |
| Technology investment impact | Industrial power economy × 0.062/100 | Million yuan |
| Growth in the electricity | Total electricity × (EC growth rate + Population growth rate + 2.5 × Income variation coefficient) × (1 – Total electricity / 15,000,000)/100 | M kw·h/year |
| Coal reduction | – (3406/Technology investment impact × Investment coefficient1) × Coal consumption unit electricity | T/kw·h |
| Carbon reduction | – (C emissions per unit coal × (3000/Technology investment impact × Investment coefficient2)) | Tons/ton |
| Power generation | Total electricity × (1 + Line lose ratio + Auxiliary power rate)/100 | M kw·h |
| Coal demand | Power generation × Coal consumption unit electricity/100 | Mt |
| CO2 emissions | C emissions per unit coal × Coal demand × A carbon coefficient / 100 | Mt |
| Free C quota | CO2 emissions × Free C quota ratio/100 | Mt |
| R total quota | –1 × Total quota × Rate of change/100 | Mt |
| Corporate carbon trading volumes | (Total quota – Free C quota) / 100 | Mt |
| Punish carbon emissions | (CO2 emissions – Free C quota – Corporate carbon trading volumes)/100 | Mt |
| Enterprise carbon emission cost | (Corporate carbon trading volumes × P carbon trading + Punish carbon emissions × P carbon penalty)/100 | Million yuan |
| P carbon penalty | 4 × P carbon trading | CNY/ton |
| P coal | Table function | CNY/ton |
| Coal cost | P coal × Coal demand/100 | Million yuan |
| Generating income | Power generation × P electricity/100 | Million yuan |
| Pollutant production | Coal demand × (SO2 coefficient + NOx coefficient)/100 | Mt |
| Free P volumes | Pollutant emissions × Free P quota ratio | Mt |
| Punish pollutions | Pollutant emissions – Free P volumes | Mt |
| Pollutant trading volumes | Pollutant emissions × Pollutant trading ratio | Mt |
| Pollutant emission cost | (Pollutant trading volumes × P pollutant trading + Punish pollutions × P pollutant penalty)/100 | Million yuan |
| P pollutant penalty | 4 × P pollutant trading | CNY/ton |
| Environmental governance investment | (0.0258 × CO2 emissions + Pollutant emissions × 16)/100 | Million yuan |
| Pollutant removal | (Investment coefficient3 × Environmental governance effect)/100 | Mt |
| Pollutant emissions | Pollutant production – Pollutant removal | Mt |
| Parameter | Value | Unit | Data Source |
|---|---|---|---|
| P carbon trading | 40 | CNY/ton | Low-carbon industrial network |
| P pollutant trading | 1600 | CNY/ton | Chongqing bureau of ecological environment |
| SO2 coefficient | 0.0085 | Tons/ton | Chongqing bureau of ecological environment |
| NOx coefficient | 0.0074 | Tons/ton | Chongqing bureau of ecological environment |
| Free P quota ratio | 0.4 | —— | National pollution emission reduction policy |
| G investment coefficient | 0.6499 | —— | References [36] |
| Population growth rate | 0.0089 | —— | National Bureau of statistics |
| Auxiliary power rate | 0.0552 | —— | State Grid Corporation of China |
| Line lose ratio | 0.0605 | —— | State Grid Corporation of China |
| Rate of change | 0.0413 | —— | Chongqing development and reform commission |
| Free C quota ratio | 0.5 | —— | National carbon emission reduction policy |
| Abbreviation | The Full Name |
|---|---|
| G fixed investment | Government fixed investment |
| Free C quota ratio | Free carbon quota ratio |
| Free P quota ratio | Free pollutant quota ratio |
| R total quota | Rate of change of total quota |
| P carbon penalty | Carbon penalty price |
| P coal | Coal price |
| Free P volumes | Free Pollutant volumes |
| P pollutant penalty | Pollutant penalty price |
| P carbon trading | Carbon trading price |
| P pollutant trading | Pollutant trading price |
| EC growth rate | Rate of growth in electricity consumption |
| C emissions per unit coal | Carbon emissions per unit coal |
| A carbon coefficient | Actual carbon emissions coefficient |
| Year | Coal Demand | Power Generation | Pollutant Emissions | ||||||
|---|---|---|---|---|---|---|---|---|---|
| The Fitting Value | The Real Value | Error Ratio | The Fitting Value | The Real Value | Error Ratio | The Fitting Value | The Real Value | Error Ratio | |
| 2012 | 761.579 | 767.98 | −0.833% | 548.02 | 550.55 | −0.460% | 7.009 | 7.0086 | 0.006% |
| 2013 | 676.224 | 673.11 | 0.867% | 605.580 | 593.67 | 2.006% | 6.843 | 6.89 | −0.682% |
| 2014 | 942.196 | 925.53 | 2.704% | 662.212 | 674.99 | −1.893% | 8.365 | 8.5 | −1.588% |
| 2015 | 1,092.44 | 1074.77 | 3.045% | 717.589 | 750.37 | −4.369% | 7.567 | 7.8 | −2.987% |
| 2016 | 1,361.48 | 1358.02 | 2.204% | 769.420 | 801.78 | −4.036% | 4.305 | 4.49 | −4.120% |
| 2017 | 1,321.82 | 1315.15 | 2.920% | 811.046 | 840.63 | −3.159% | 3.355 | 3.5 | −4.143% |
| Simulation Scenario | Project | Carbon Trading Price (yuan/ton) | Carbon Free Quota Ratio | Pollutant Trading Price (yuan/ton) | Pollutant Free Quota Ratio |
|---|---|---|---|---|---|
| The basic situation | BASE | 0 | 0 | 0 | 0 |
| Different carbon trading price | A1 | 30 | 0.5 | 1600 | 0.6 |
| A2 | 50 | 0.5 | 1600 | 0.6 | |
| A3 | 70 | 0.5 | 1600 | 0.6 | |
| Different free carbon quotas | B1 | 40 | 0.4 | 1600 | 0.6 |
| B2 | 40 | 0.6 | 1600 | 0.6 | |
| B3 | 40 | 0.8 | 1600 | 0.6 | |
| Different pollutants trading price | C1 | 40 | 0.5 | 1500 | 0.6 |
| C2 | 40 | 0.5 | 2000 | 0.6 | |
| C3 | 40 | 0.5 | 2500 | 0.6 | |
| Different free pollutant quotas | D1 | 40 | 0.5 | 1600 | 0.3 |
| D2 | 40 | 0.5 | 1600 | 0.55 | |
| D3 | 40 | 0.5 | 1600 | 0.8 | |
| Two trading mechanism combination | E1 | 30 | 0.8 | 1500 | 0.3 |
| E2 | 50 | 0.6 | 2000 | 0.55 | |
| E3 | 70 | 0.4 | 2500 | 0.8 |
| Different Scenarios | P Carbon Trading (CNY) | Free C Quota Ratio | P pollutant Trading (CNY) | Free P Quota Ratio |
|---|---|---|---|---|
| Initial parameters | 30 | 0.5 | 1600 | 0.6 |
| Optimal parameters | 73 | 0.7 | 2470 | 0.15 |
© 2019 by the authors. Licensee MDPI, Basel, Switzerland. This article is an open access article distributed under the terms and conditions of the Creative Commons Attribution (CC BY) license (http://creativecommons.org/licenses/by/4.0/).
Share and Cite
Ge, S.; Yu, X.; Zhou, D.; Sang, X. The Integrated Effect of Carbon Emissions Trading and Pollution Rights Trading for Power Enterprises—A Case Study of Chongqing. Sustainability 2019, 11, 3099. https://doi.org/10.3390/su11113099
Ge S, Yu X, Zhou D, Sang X. The Integrated Effect of Carbon Emissions Trading and Pollution Rights Trading for Power Enterprises—A Case Study of Chongqing. Sustainability. 2019; 11(11):3099. https://doi.org/10.3390/su11113099
Chicago/Turabian StyleGe, Shengxian, Xianyu Yu, Dequn Zhou, and Xiuzhi Sang. 2019. "The Integrated Effect of Carbon Emissions Trading and Pollution Rights Trading for Power Enterprises—A Case Study of Chongqing" Sustainability 11, no. 11: 3099. https://doi.org/10.3390/su11113099
APA StyleGe, S., Yu, X., Zhou, D., & Sang, X. (2019). The Integrated Effect of Carbon Emissions Trading and Pollution Rights Trading for Power Enterprises—A Case Study of Chongqing. Sustainability, 11(11), 3099. https://doi.org/10.3390/su11113099