Human and Natural Impacts on the Water Resources in the Syr Darya River Basin, Central Asia

 ,
,  ,
,  and
and
Abstract
1. Introduction
2. Datasets and Methods
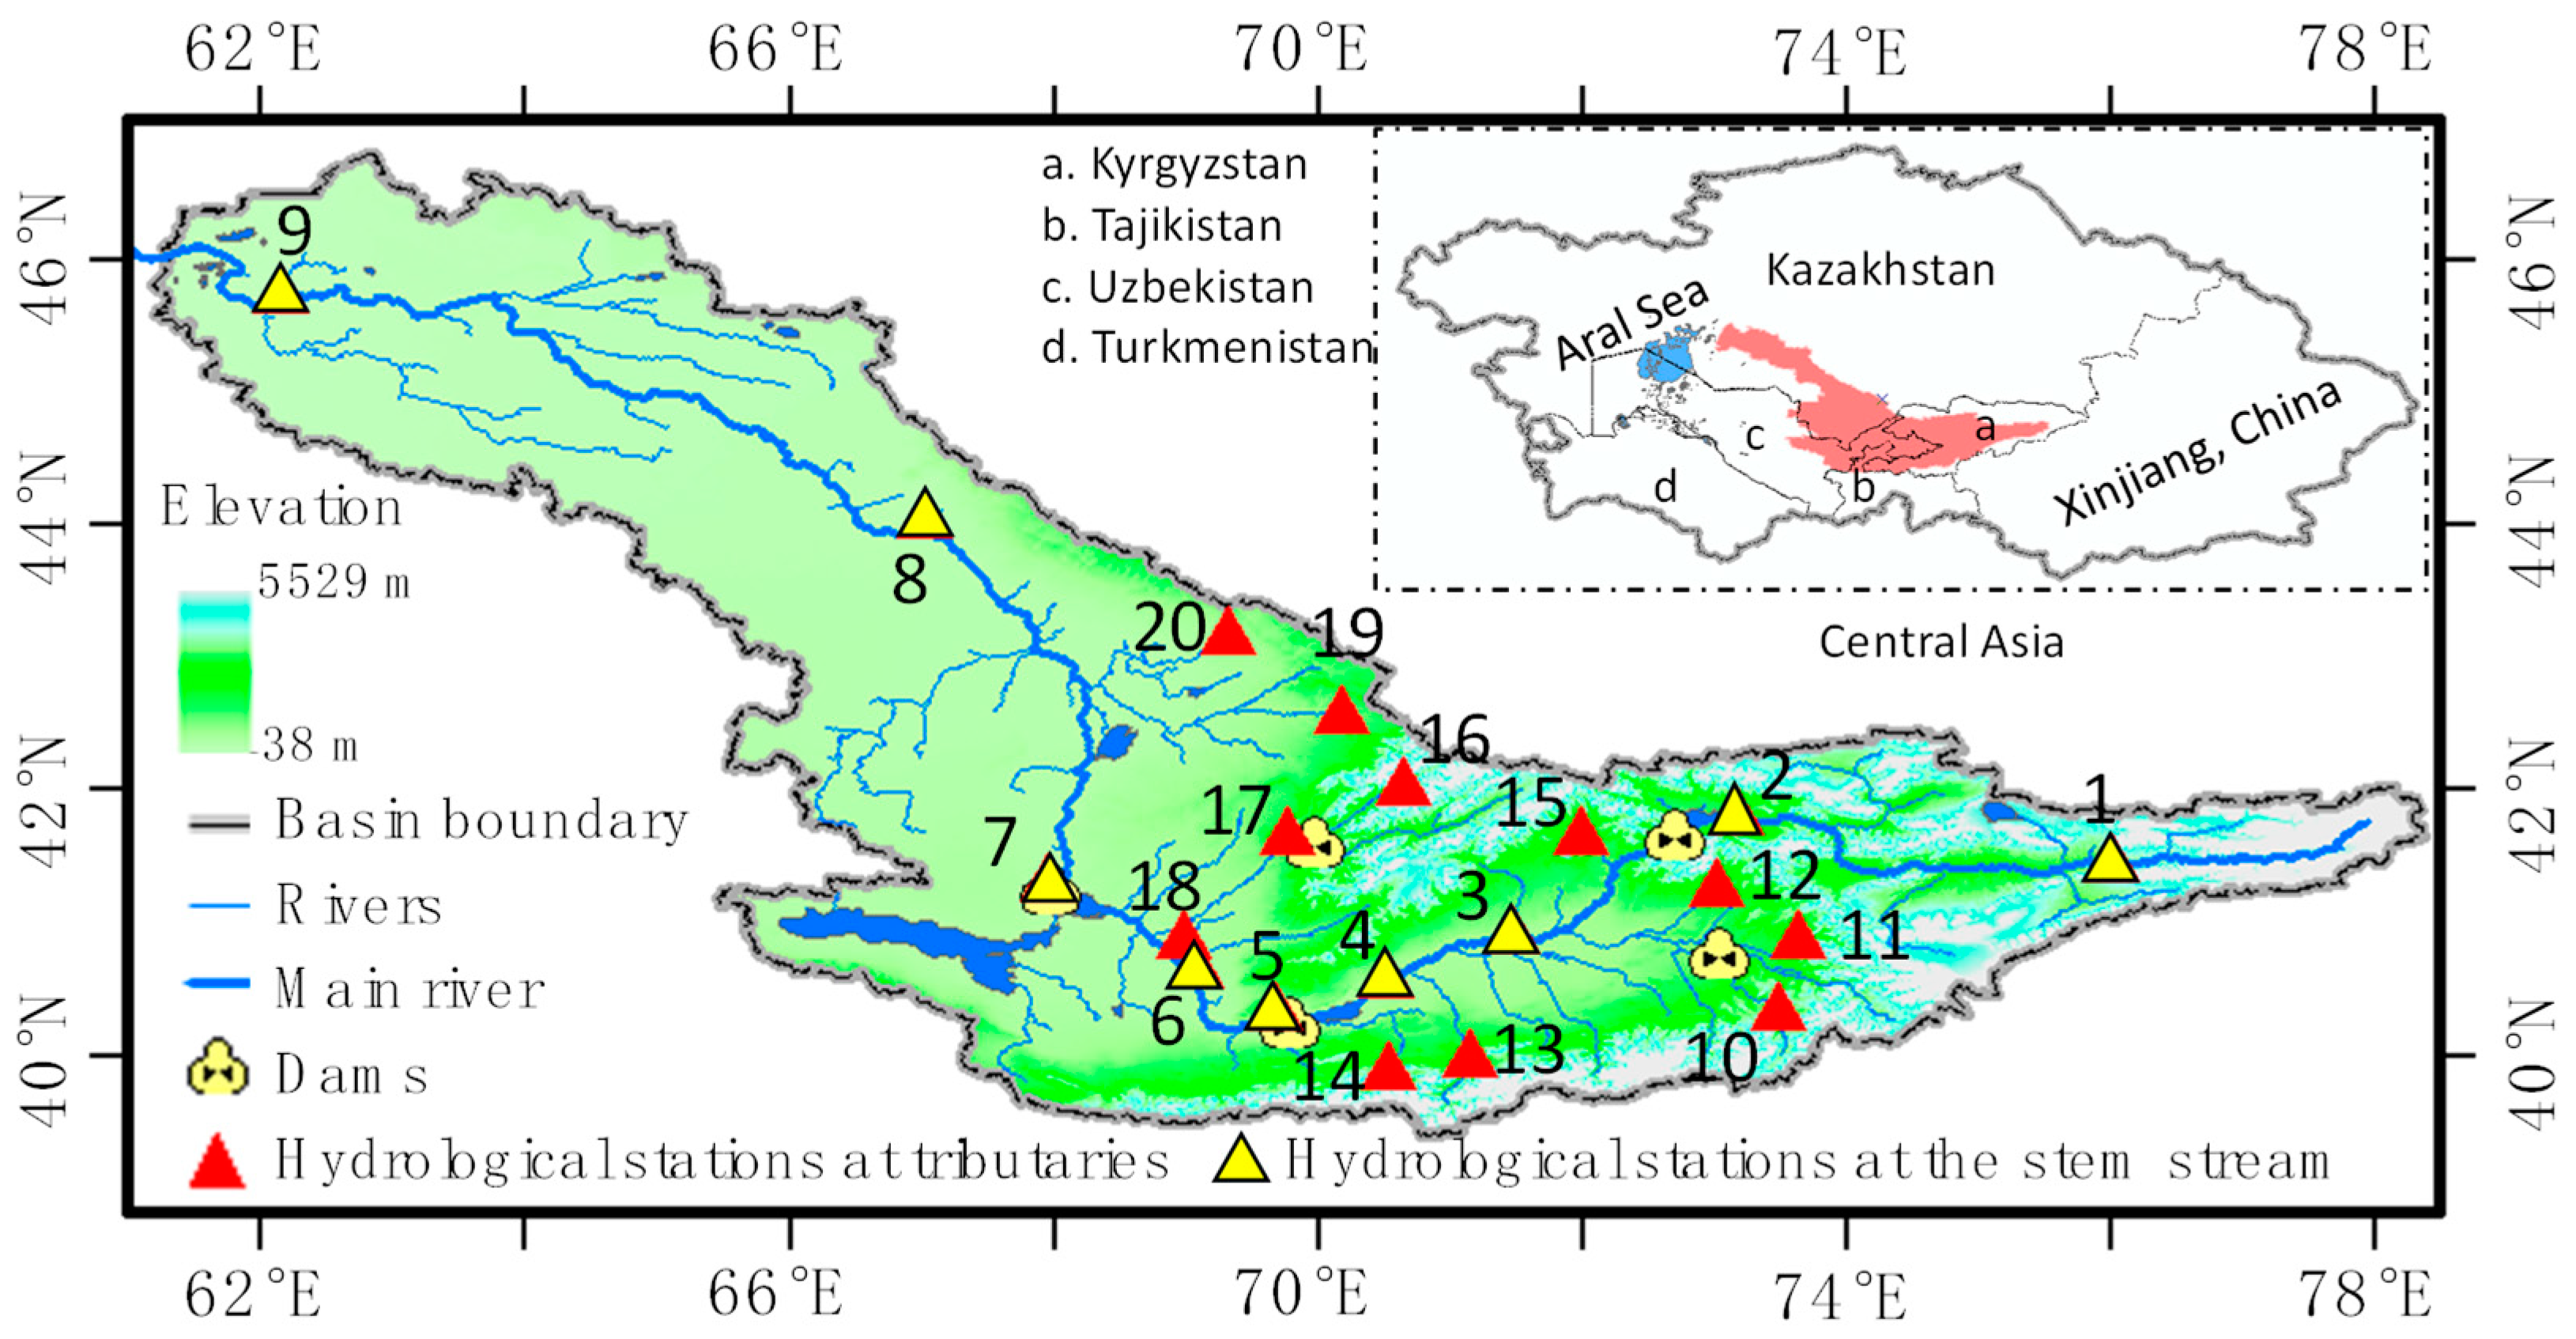
2.1. Study Area
2.2. Datasets
2.3. Methodology
2.3.1. Trend Analysis
2.3.2. Change-Point Detection
2.3.3. Correlation Analysis
- (1)
- Pearson’s Correlation
- (2)
- Multiple Linear Regression
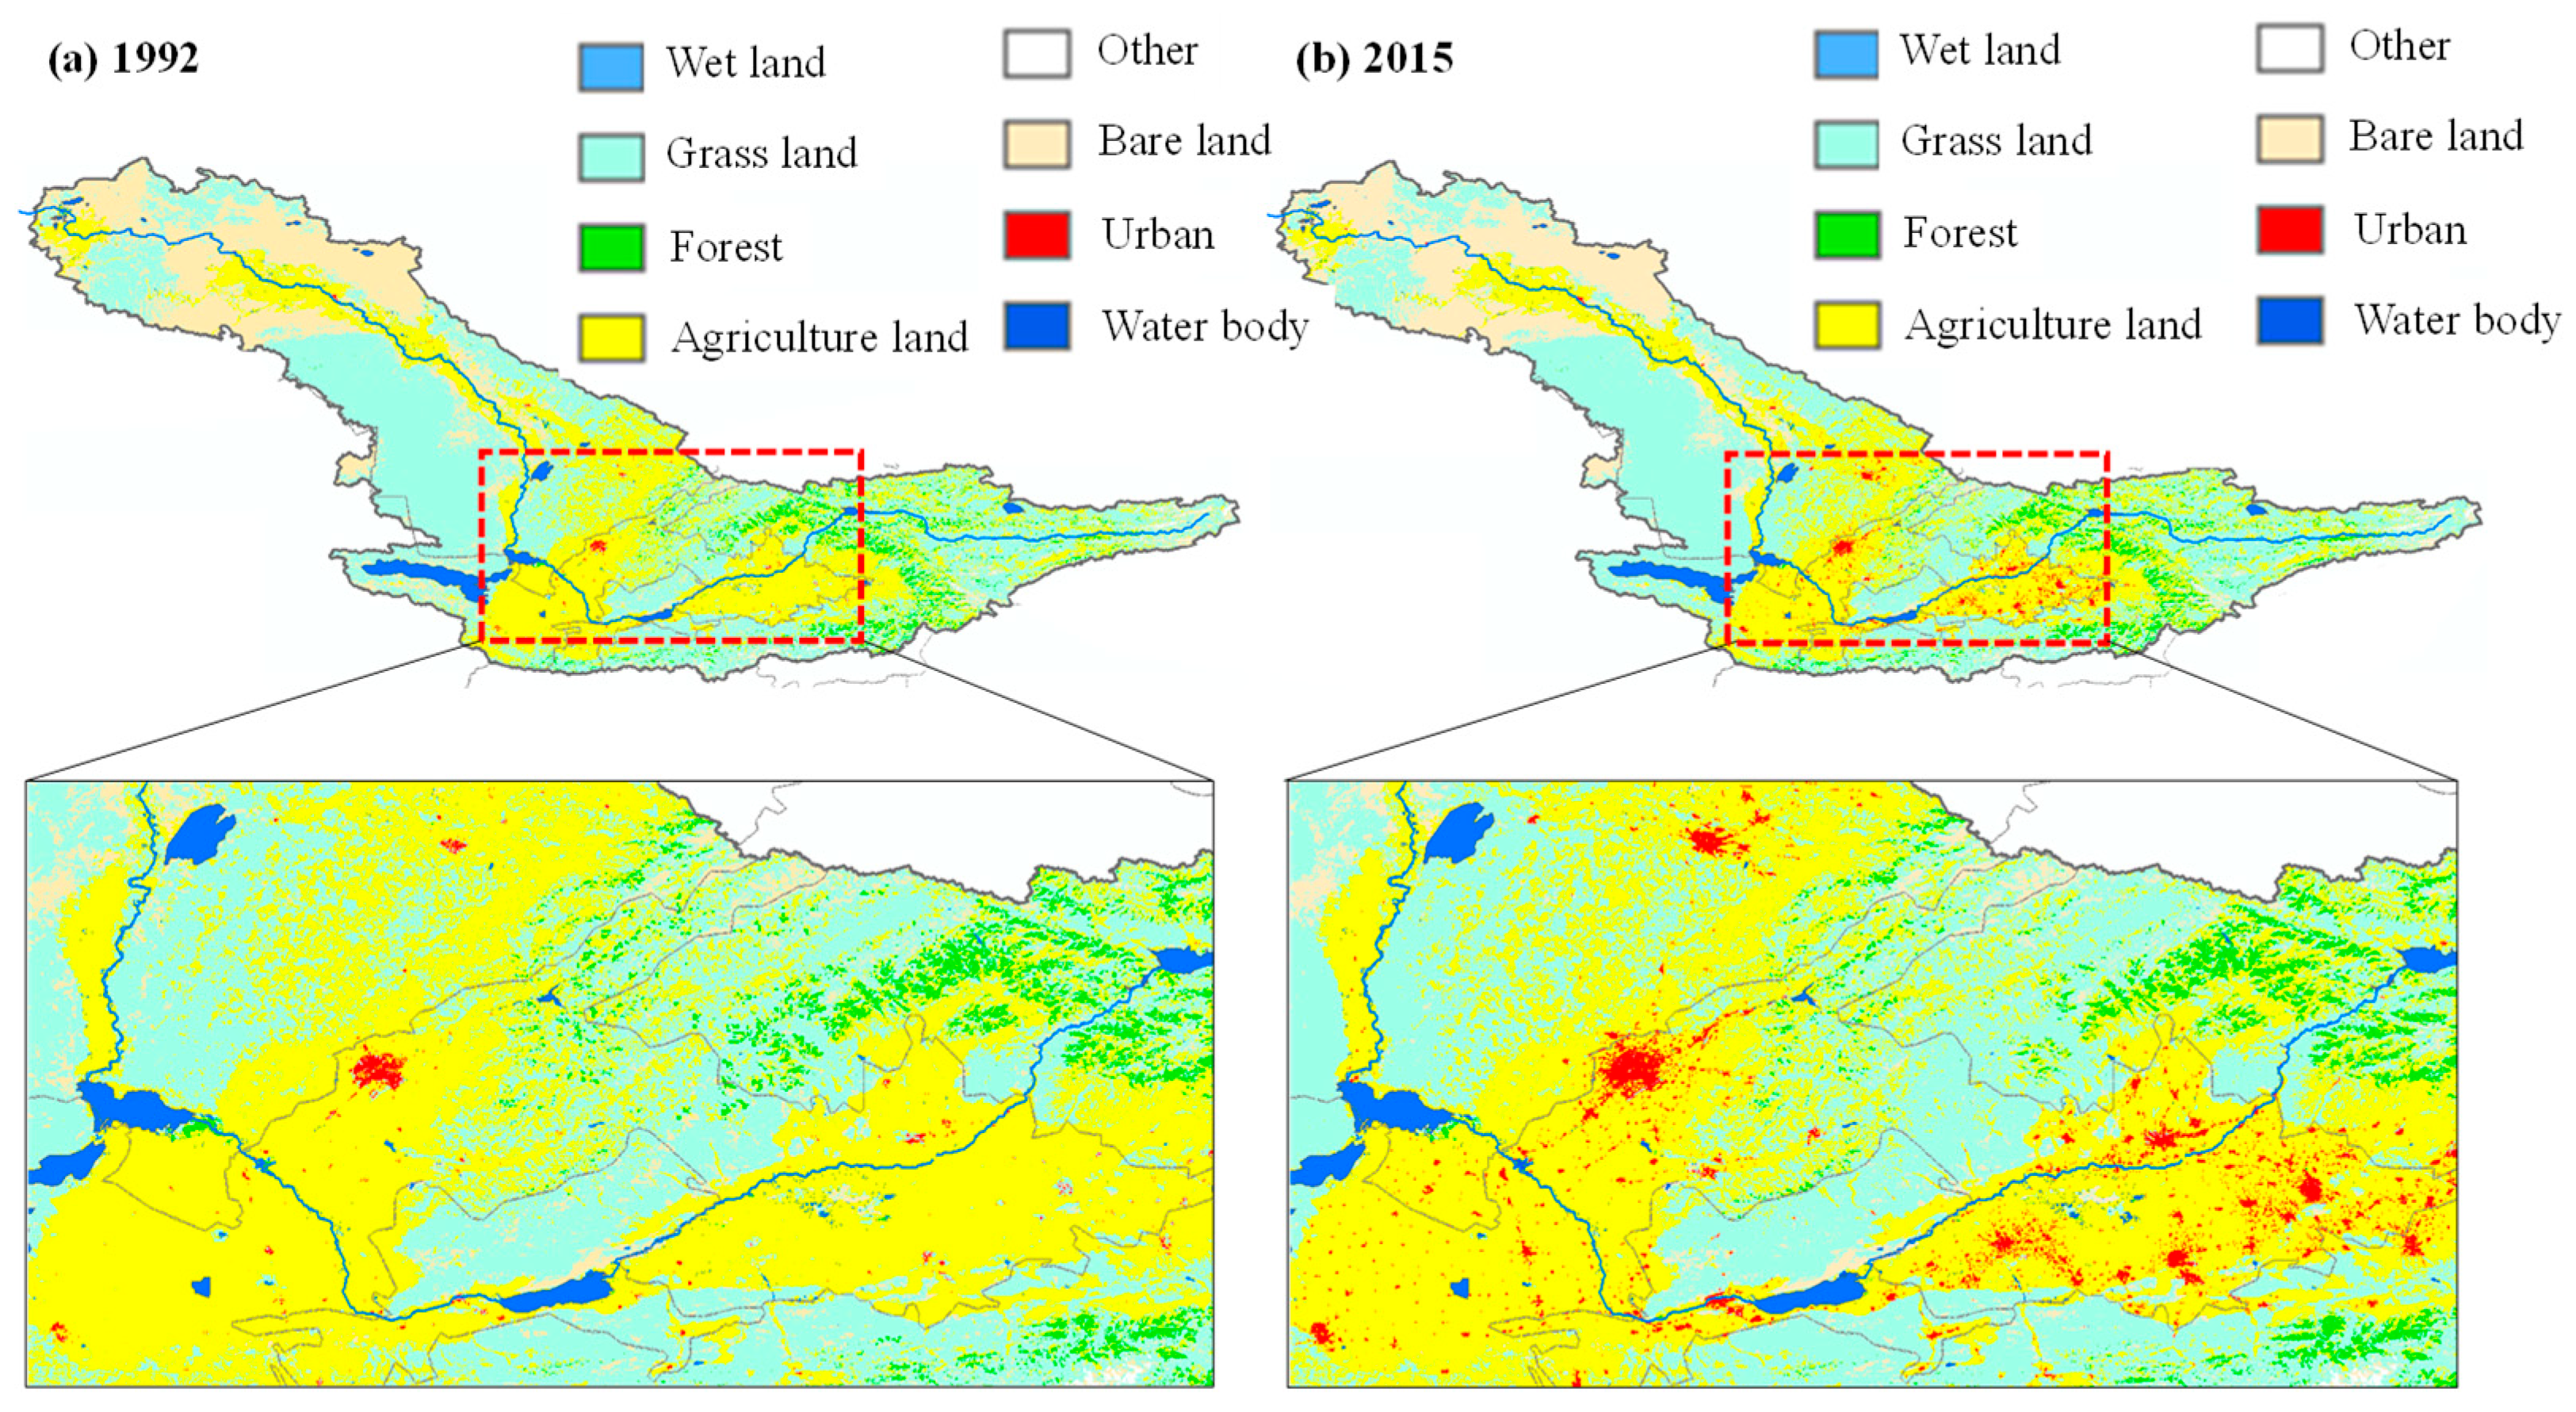
2.3.4. Land Use Change Analysis
3. Results and Discussion
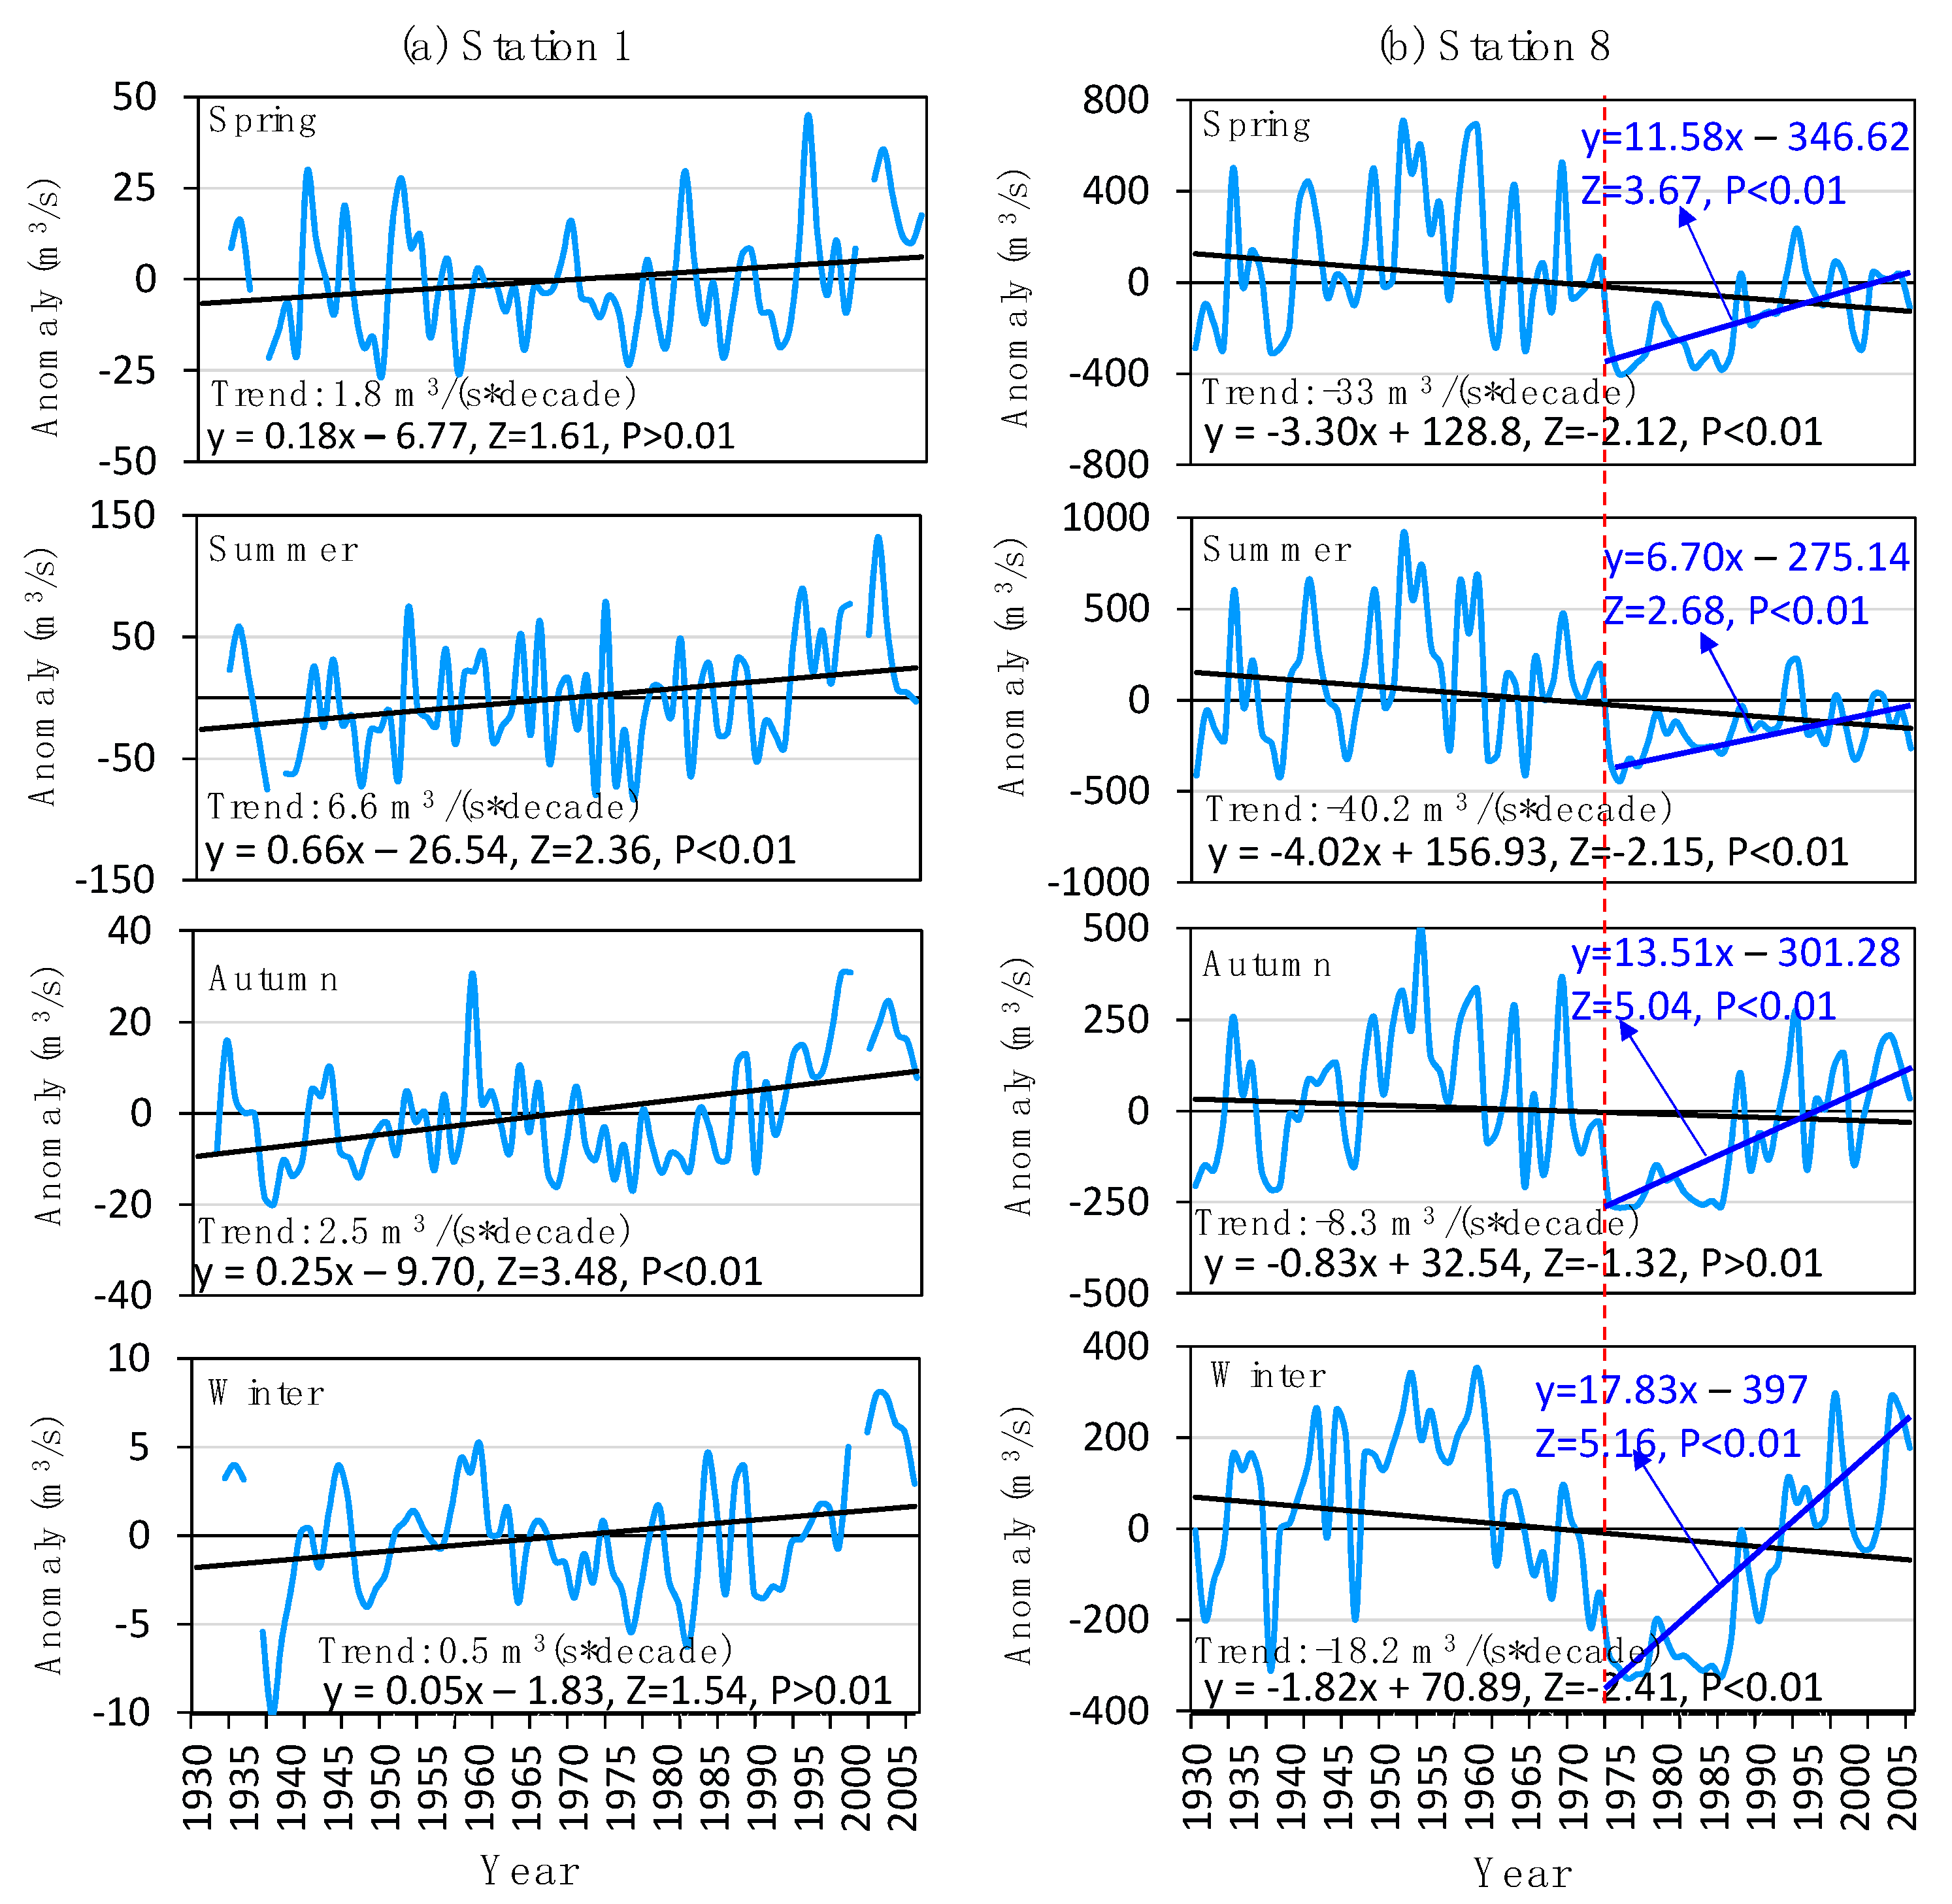
3.1. Trend Analysis of the River Discharge
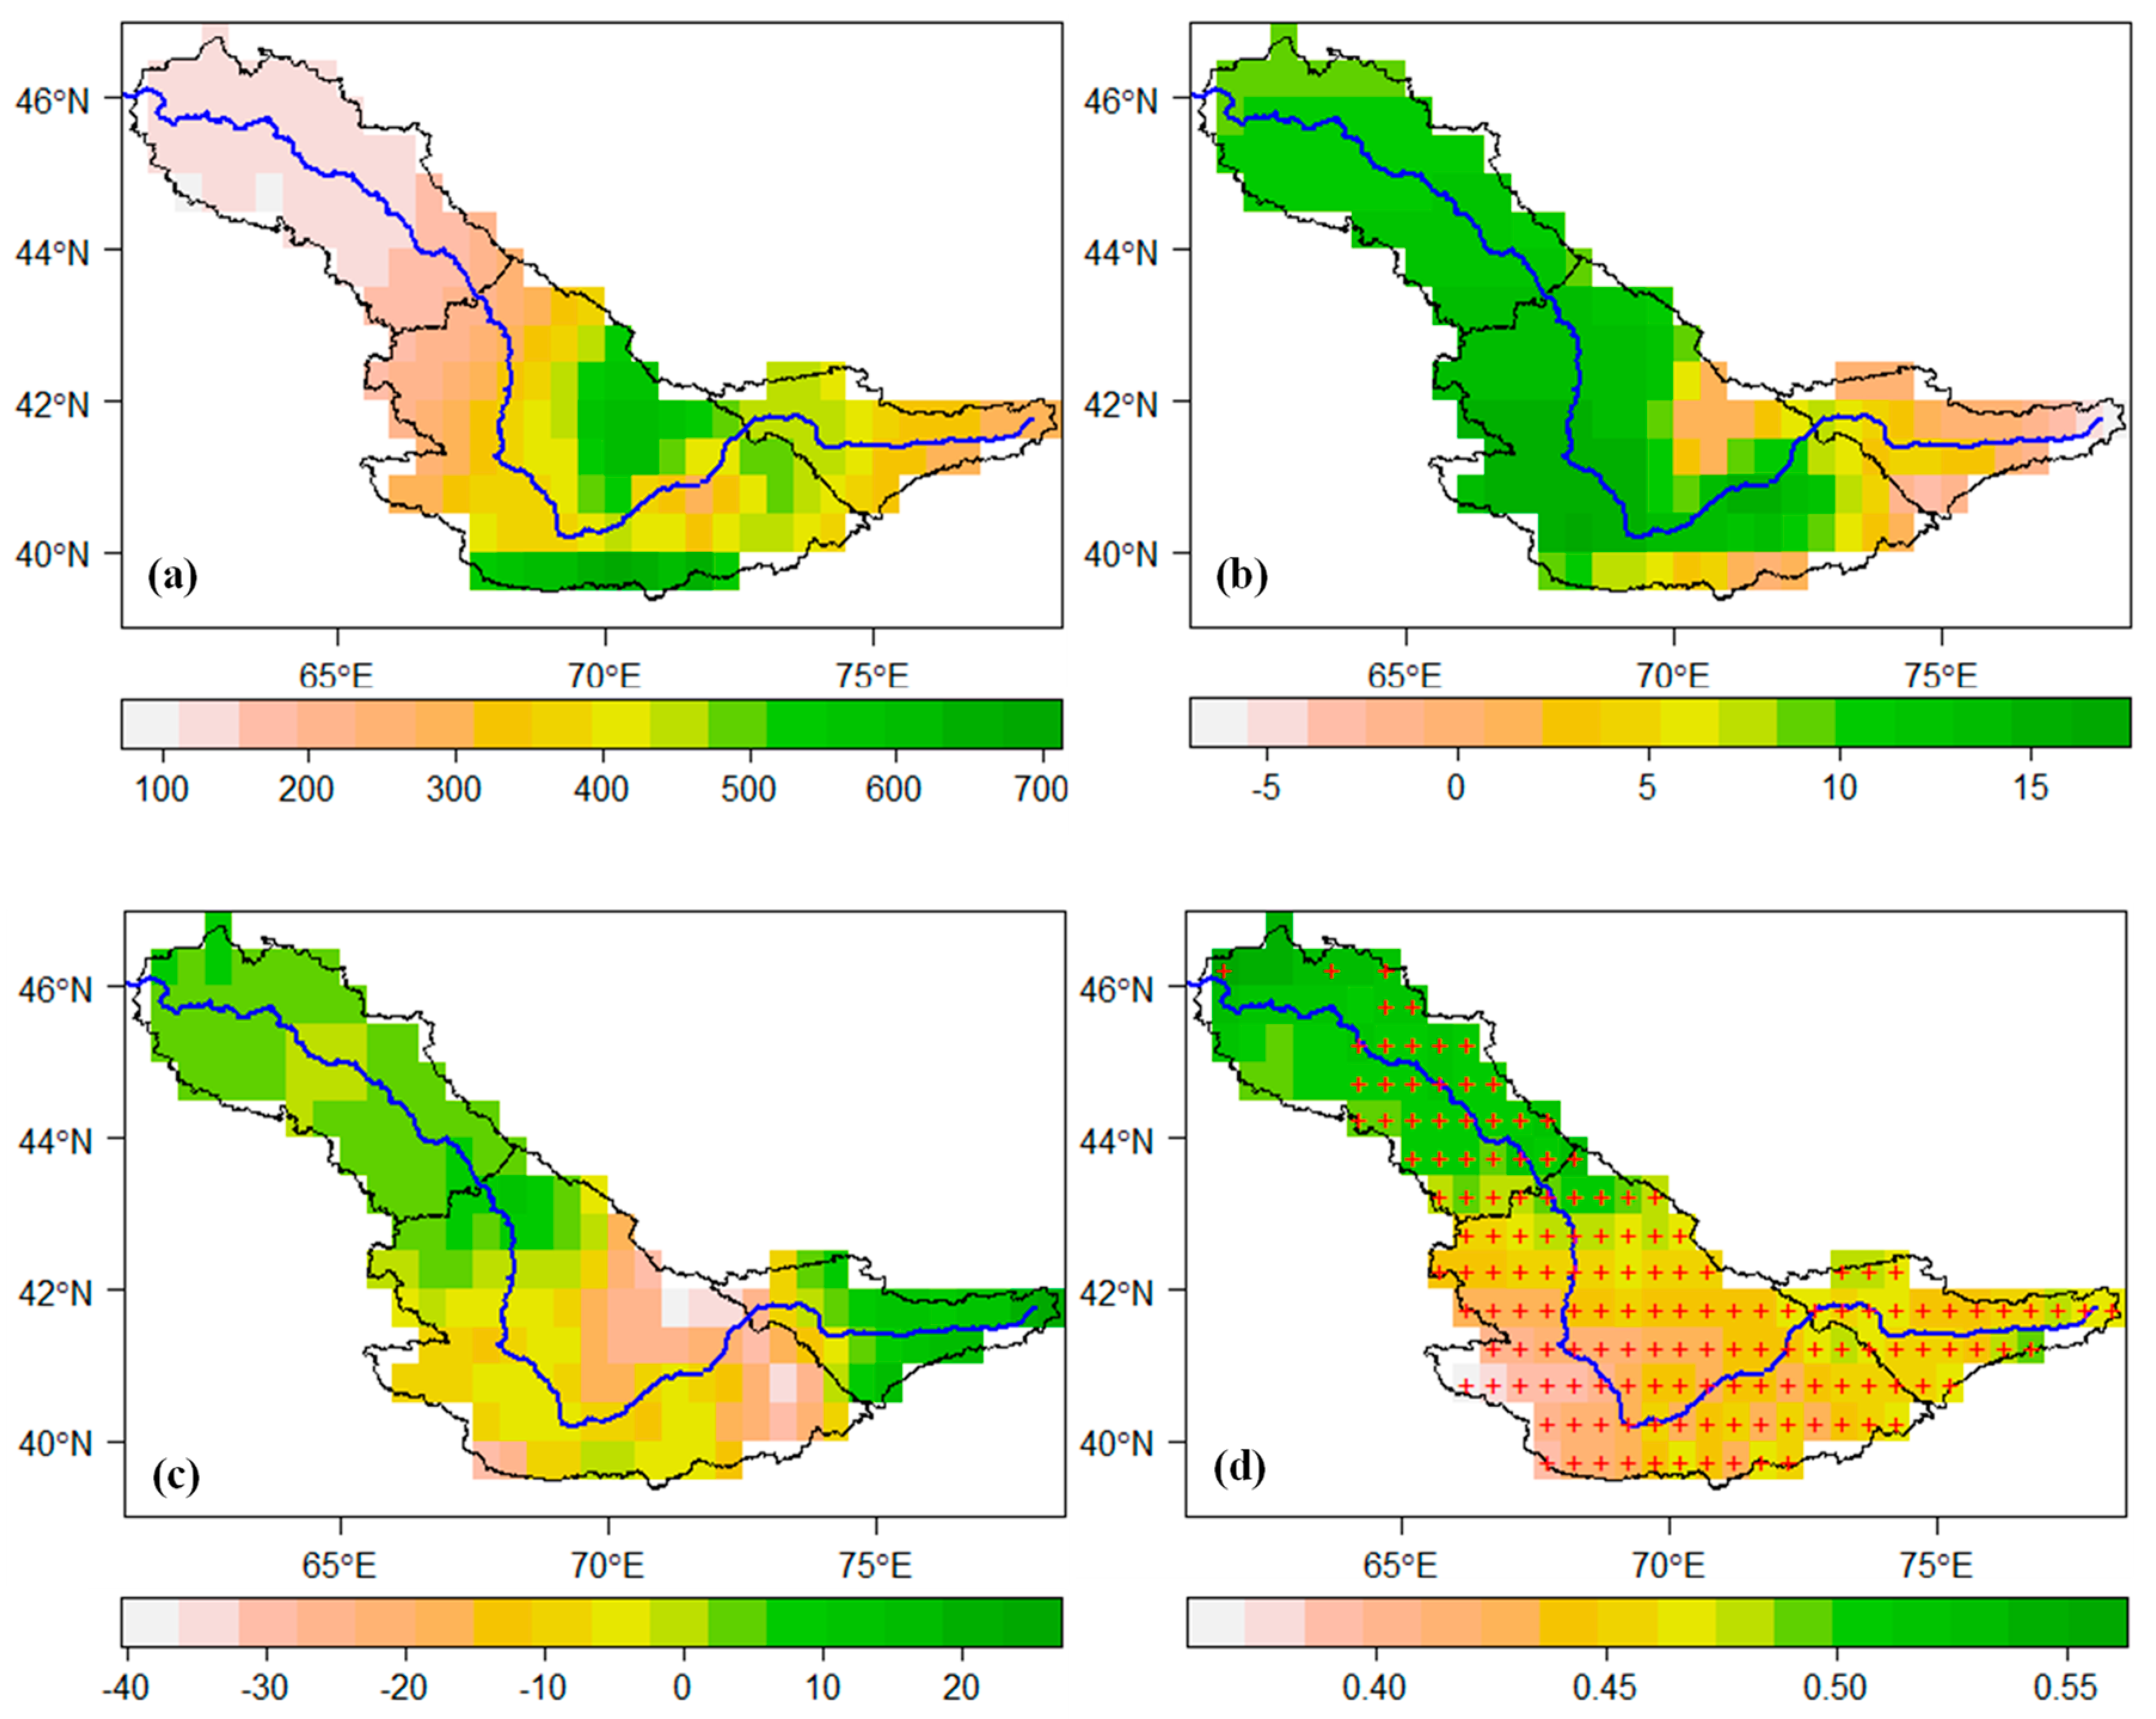
3.2. Trend Analysis of the Precipitation and Temperature
3.3. Relation of the Climatic Factors and River Discharges
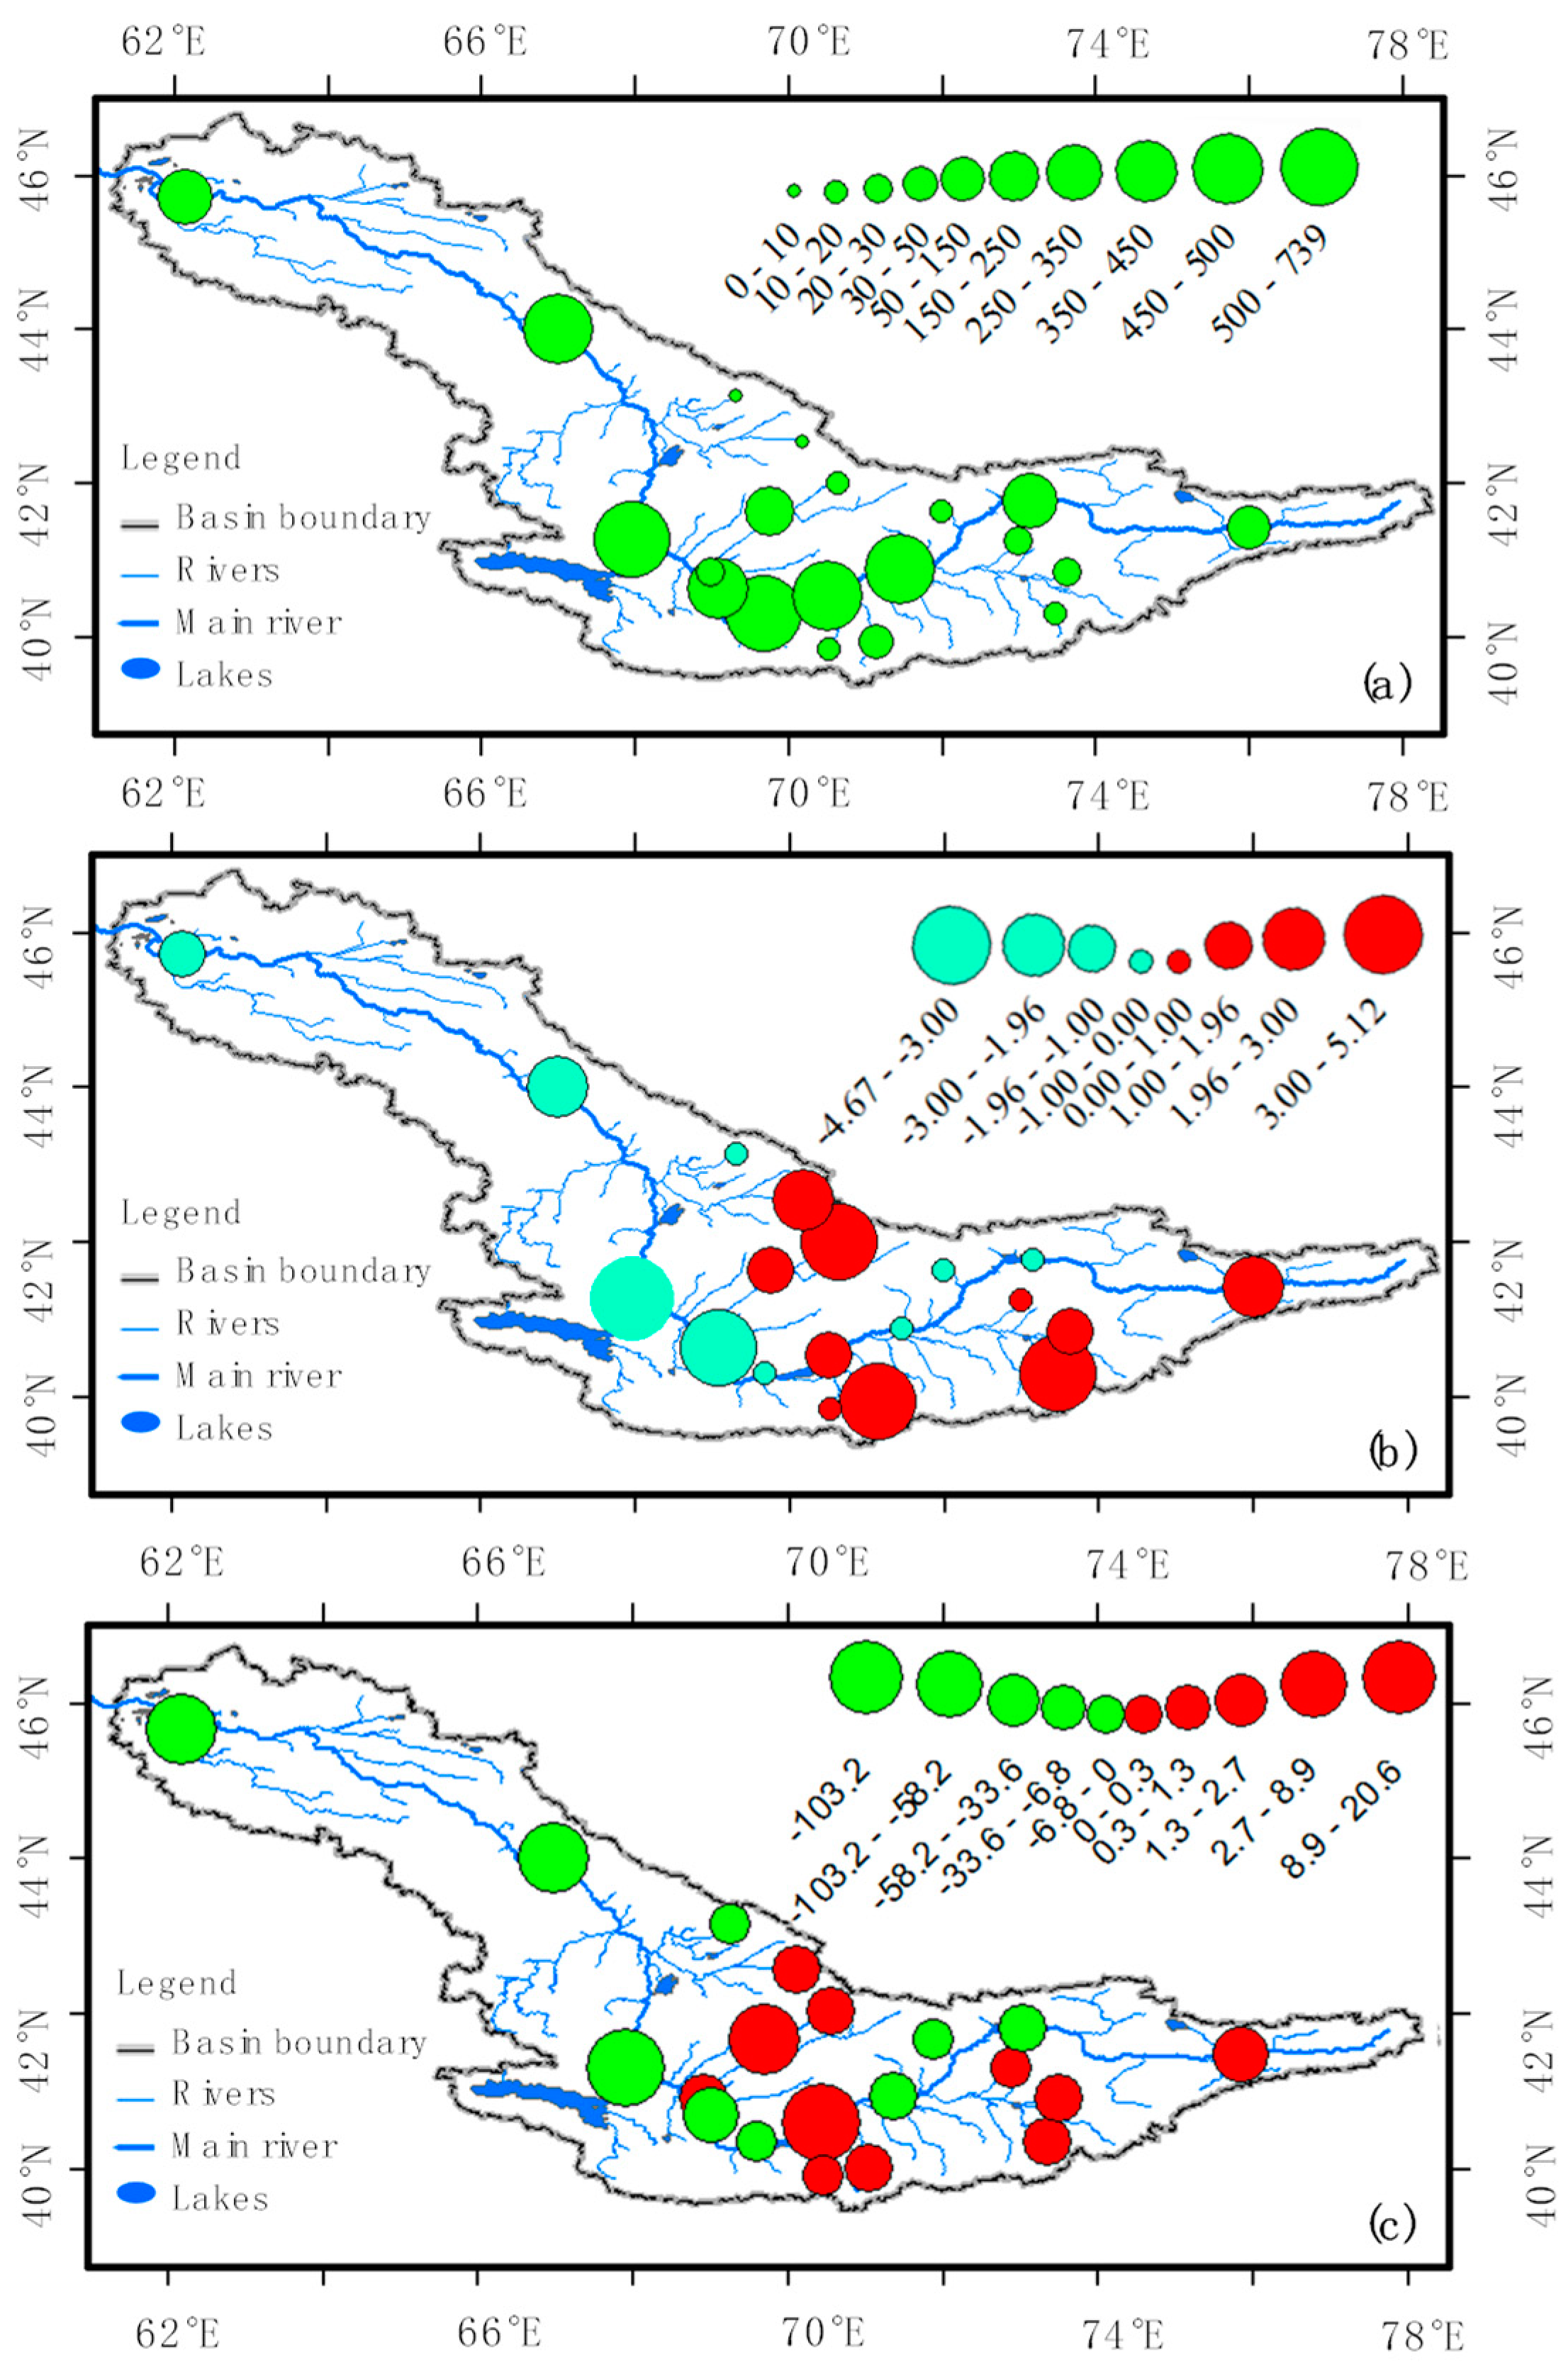
3.4. Impact of the Land Use on the River Discharges
3.5. Impact of the Groundwater Recharge on the River Discharges
4. Conclusions, Management Measures, and Future Work
Author Contributions
Funding
Conflicts of Interest
References
- Chatalova, L.; Djanibekov, N.; Gagalyuk, T.; Valentinov, V. The Paradox of water management projects in Central Asia: An institutionalist perspective. Water 2017, 9, 300. [Google Scholar] [CrossRef]
- Duan, W.; Chen, Y.; Zou, S.; Nover, D. Managing the water-climate-food nexus for sustainable development in Turkmenistan. J. Clean. Prod. 2019, 220, 212–224. [Google Scholar] [CrossRef]
- Siegfried, T.; Bernauer, T.; Guiennet, R.; Sellars, S.; Robertson, A.W.; Mankin, J.; Bauer-Gottwein, P.; Yakovlev, A. Will climate change exacerbate water stress in Central Asia? Clim. Chang. 2012, 112, 881–899. [Google Scholar] [CrossRef]
- Abdullaev, I.; Kazbekov, J.; Manthritilake, H.; Jumaboev, K. Participatory water management at the main canal: A case from South Ferghana canal in Uzbekistan. Agric. Water Manag. 2009, 96, 317–329. [Google Scholar] [CrossRef]
- Groll, M.; Opp, C.; Kulmatov, R.; Ikramova, M.; Normatov, I. Water quality, potential conflicts and solutions—An upstream–downstream analysis of the transnational Zarafshan River (Tajikistan, Uzbekistan). Environ. Earth Sci. 2015, 73, 743–763. [Google Scholar] [CrossRef]
- Dukhovny, V.A.; de Schutter, J. Water in Central Asia: Past, Present, Future; Taylor and Francis: London, UK, 2011. [Google Scholar]
- Zhupankhan, A.; Tussupova, K.; Berndtsson, R. Water in Kazakhstan, a key in Central Asian water management. Hydrol. Sci. J. 2018, 63, 752–762. [Google Scholar] [CrossRef]
- Aizen, V.B.; Kuzmichenok, V.A.; Surazakov, A.B.; Aizen, E.M. Glacier changes in the central and northern Tien Shan during the last 140 years based on surface and remote-sensing data. Ann. Glaciol. 2006, 43, 202–213. [Google Scholar] [CrossRef]
- Ibatullin, S.; Yasinsky, V.; Mironenkov, A. Impacts of Climate Change on Water Resources in Central Asia; Sector Report of the Eurasian Development Bank; Eurasian Development Bank: Almaty, Kazakhstan, 2009; p. 44. [Google Scholar]
- Golubtsov, V.; Lineitseva, A.; Merz, B.; Dukhovny, V.; Unger-Shayesteh, K. Receipt of water in the rivers of Northern slope of Jetisu Alatau because of glacier degradation. In Proceedings of the International Scientific Symposium, “Water in Central Asia”, Tashkent, Uzbekistan, 4–26 November 2010; p. 87. [Google Scholar]
- Lioubimtseva, E.; Henebry, G.M. Climate and environmental change in arid Central Asia: Impacts, vulnerability, and adaptations. J. Arid Environ. 2009, 73, 963–977. [Google Scholar] [CrossRef]
- Bernauer, T.; Siegfried, T. Climate change and international water conflict in Central Asia. J. Peace Res. 2012, 49, 227–239. [Google Scholar] [CrossRef]
- Akiyama, T.; Li, J.; Kubota, J.; Konagaya, Y.; Watanabe, M. Perspectives on Sustainability Assessment: An Integral Approach to Historical Changes in Social Systems and Water Environment in the Ili River Basin of Central Eurasia, 1900–2008. World Futures 2012, 68, 595–627. [Google Scholar] [CrossRef]
- Savoskul, O.S.; Chevnina, E.V.; Perziger, F.I.; Vasilina, L.Y.; Baburin, V.L.; Danshin, A.I.; Matyakubov, B.; Murakaev, R.R. Water, Climate, Food, and Environment in the Syr Darya Basin. Available online: http://www.weap21.org/downloads/adaptsyrdarya.pdf (accessed on 21 February 2019).
- Wegerich, K.; van Rooijen, D.; Soliev, I.; Mukhamedova, N. Water security in the Syr Darya basin. Water 2015, 7, 4657–4684. [Google Scholar] [CrossRef]
- Gaybullaev, B.; Chen, S.; Gaybullaev, D. Changes in water volume of the Aral Sea after 1960. Appl. Water Sci. 2012, 2, 285–291. [Google Scholar] [CrossRef]
- Soliev, I.; Wegerich, K.; Kazbekov, J. The costs of benefit sharing: Historical and institutional analysis of shared water development in the Ferghana valley, the Syr Darya basin. Water 2015, 7, 2728–2752. [Google Scholar] [CrossRef]
- Cai, X.; McKinney, D.C.; Rosegrant, M.W. Sustainability analysis for irrigation water management in the Aral Sea region. Agric. Syst. 2003, 76, 1043–1066. [Google Scholar] [CrossRef]
- Shibuo, Y.; Jarsjö, J.; Destouni, G. Hydrological responses to climate change and irrigation in the Aral Sea drainage basin. Geophys. Res. Lett. 2007, 34, L21406. [Google Scholar] [CrossRef]
- Farinotti, D.; Longuevergne, L.; Moholdt, G.; Duethmann, D.; Mölg, T.; Bolch, T.; Vorogushyn, S.; Güntner, A. Substantial glacier mass loss in the Tien Shan over the past 50 years. Nat. Geosci. 2015, 8, 716–722. [Google Scholar] [CrossRef]
- Sorg, A.; Bolch, T.; Stoffel, M.; Solomina, O.; Beniston, M. Climate change impacts on glaciers and runoff in Tien Shan (Central Asia). Nat. Clim. Chang. 2012, 2, 725–731. [Google Scholar] [CrossRef]
- Abdullaev, I.; Molden, D. Spatial and temporal variability of water productivity in the Syr Darya Basin, central Asia. Water Resour. Res. 2004, 40, W08S02. [Google Scholar] [CrossRef]
- Bernauer, T.; Siegfried, T. Compliance and performance in international water agreements: The case of the Naryn/Syr Darya Basin. Glob. Gov. 2008, 14, 479–501. [Google Scholar] [CrossRef]
- Immerzeel, W.W.; Lutz, A.F.; Droogers, P. Climate Change Impacts on the Upstream Water Resources of the Amu and Syr Darya River Basins; Future Water: Wageningen, The Netherlands, 2012. [Google Scholar]
- Crétaux, J.; Biancamaria, S.; Arsen, A.; Bergé-Nguyen, M.; Becker, M. Global surveys of reservoirs and lakes from satellites and regional application to the Syrdarya river basin. Environ. Res. Lett. 2015, 10, 356–357. [Google Scholar] [CrossRef]
- Bocchiola, D.; Pelosi, M.G.; Soncini, A. Effects of hydrological changes on cooperation in transnational catchments: The case of the Syr Darya. Water Int. 2017, 42, 852–873. [Google Scholar] [CrossRef]
- Cardenal, S.J.P.; Riegels, N.; Bauer-Gottwein, P.; Berry, P.; Smith, R.G.; Yakovlev, A.; Siegfried, T.U. Real-time remote sensing driven river basin modeling using radar altimetry. Hydrol. Earth Syst. Sci. 2011, 15, 241–254. [Google Scholar] [CrossRef]
- Harris, I.; Jones, P.D.; Osborn, T.J.; Lister, D.H. Updated high-resolution grids of monthly climatic observations-the CRU TS3. 10 Dataset. Int. J. Climatol. 2014, 34, 623–642. [Google Scholar] [CrossRef]
- Deng, H.; Chen, Y. Influences of recent climate change and human activities on water storage variations in Central Asia. J. Hydrol. 2017, 544, 46–57. [Google Scholar] [CrossRef]
- Center for International Earth Science Information Network-CIESIN-Columbia University. Gridded Population of the World, Version 4 (GPWv4): Population Density; NASA Socioeconomic Data and Applications Center (SEDAC): Palisades, NY, USA, 2016. [Google Scholar]
- Hollmann, R.; Merchant, C.J.; Saunders, R.; Downy, C.; Buchwitz, M.; Cazenave, A.; Chuvieco, E.; Defourny, P.; de Leeuw, G.; Forsberg, R.; et al. The ESA climate change initiative: Satellite data records for essential climate variables. Bull. Am. Meteorol. Soc. 2013, 94, 1541–1552. [Google Scholar] [CrossRef]
- Hurtt, G.C.; Chini, L.P.; Frolking, S.; Betts, R.A.; Feddema, J.; Fischer, G.; Klein Goldewijk, K.; Hibbard, K.A.; Janetos, A.C.; Jones, C.; et al. Harmonisation of Global Land-Use Scenarios for the Period 1500–2100 for IPCC-AR5. Available online: http://gel.umd.edu/images/Hurtt_2009_iLEAPS.pdf (accessed on 1 February 2019).
- Mann, H.B. Nonparametric tests against trend. Econometrica 1945, 13, 245–259. [Google Scholar] [CrossRef]
- Kendall, M.G. Rank Correlation Methods, Charles Griffin, London; Griffin: London, UK, 1975. [Google Scholar]
- Yue, S.; Pilon, P.; Cavadias, G. Power of the Mann–Kendall and Spearman’s rho tests for detecting monotonic trends in hydrological series. J. Hydrol. 2002, 259, 254–271. [Google Scholar] [CrossRef]
- Bai, J.; Perron, P. Computation and analysis of multiple structural change models. J. Appl. Econ. 2003, 18, 1–22. [Google Scholar] [CrossRef]
- Lawrence, I.; Lin, K. A concordance correlation coefficient to evaluate reproducibility. Biometrics 1989, 45, 255–268. [Google Scholar]
- Hinkle, D.; Wiersma, W.; Jurs, S. Applied Statistics for the Behavioral Sciences, 5th ed.; Rand McNally: Skokie, IL, USA, 1979. [Google Scholar]
- Guo, L.; Xia, Z. Temperature and precipitation long-term trends and variations in the Ili-Balkhash Basin. Theor. Appl. Climatol. 2014, 115, 219–229. [Google Scholar] [CrossRef]
- Sorg, A.; Mosello, B.; Shalpykova, G.; Allan, A.; Clarvis, M.H.; Stoffel, M. Coping with changing water resources: The case of the Syr Darya river basin in Central Asia. Environ. Sci. Policy 2014, 43, 68–77. [Google Scholar] [CrossRef]
- Duan, W.; He, B.; Takara, K.; Luo, P.; Nover, D.; Hu, M. Impacts of climate change on the hydro-climatology of the upper Ishikari river basin, Japan. Environ. Earth Sci. 2017, 76, 490. [Google Scholar] [CrossRef]
- Jackson, R.B.; Carpenter, S.R.; Dahm, C.N.; McKnight, D.M.; Naiman, R.J.; Postel, S.L.; Running, S.W. Water in a changing world. Ecol. Appl. 2001, 11, 1027–1045. [Google Scholar] [CrossRef]
- Walsh, C.J.; Roy, A.H.; Feminella, J.W.; Cottingham, P.D.; Groffman, P.M.; Morgan, R.P. The urban stream syndrome: Current knowledge and the search for a cure. J. N. Am. Benthol. Soc. 2005, 24, 706–723. [Google Scholar] [CrossRef]
- Duan, W.; He, B.; Nover, D.; Fan, J.; Yang, G.; Chen, W.; Meng, H.; Liu, C. Floods and associated socioeconomic damages in China over the last century. Nat. Hazards 2016, 82, 401–413. [Google Scholar] [CrossRef]
- McGrane, S.J. Impacts of urbanisation on hydrological and water quality dynamics, and urban water management: A review. Hydrol. Sci. J. 2016, 61, 2295–2311. [Google Scholar] [CrossRef]
- Benjaminovich, Z.M.; Tersitskiy, D.K. Irrigation of Uzbekistan II (in Russian); Fan: Tashkent, Uzbekistan, 1975. [Google Scholar]
- Forkutsa, I.; Sommer, R.; Shirokova, Y.I.; Lamers, J.; Kienzler, K.; Tischbein, B.; Martius, C.; Vlek, P.L.G. Modeling irrigated cotton with shallow groundwater in the Aral Sea Basin of Uzbekistan: II. Soil salinity dynamics. Irrig. Sci. 2009, 27, 319–330. [Google Scholar] [CrossRef]
- Antipova, E.; Zyryanov, A.; McKinney, D.; Savitsky, A. Optimization for Syr Darya Water and Energy Use. Available online: http://www.ce.utexas.edu/prof/mckinney/papers/aral/Naryn(ver3).pdf (accessed on 1 February 2019).
- Rakhmatullaev, S.; Huneau, F.; Kazbekov, J.; Celle-Jeanton, H.; Motelica-Heino, M.; Coustumer, P.; Jumanov, J. Groundwater resources of Uzbekistan: An environmental and operational overview. Open Geosci. 2012, 4, 67–80. [Google Scholar] [CrossRef]
- Heaven, S.; Koloskov, G.B.; Lock, A.C.; Tanton, T.W. Water resources management in the Aral Basin: A river basin management model for the Syr Darya. Irrig. Drain. 2002, 51, 109–118. [Google Scholar] [CrossRef]
- Karimov, A.; Smakhtin, V.; Borisov, V.; Jumanov, J. Transboundary aquifers of the Fergana Valley: Challenges and opportunities. In Proceedings of the International UNESCO Conference on “Transboundary Aquifers: Challenges and New Directions”, Paris, France, 6–8 December 2010; pp. 72–73. [Google Scholar]


| Variable | Season | Mean | Z | Decadal Trend |
|---|---|---|---|---|
| Station 1 | Annual | 92.7 | 2.50 * | 3.1 |
| Spring | 63.9 | 1.61 | 1.8 | |
| Summer | 219.4 | 2.36 * | 6.6 | |
| Autumn | 57.3 | 3.48 * | 2.5 | |
| Winter | 26.5 | 1.54 | 0.5 | |
| Station 8 | Annual | 475.6 | −2.92 * | −33.6 |
| Spring | 599.7 | −2.12 * | −33.0 | |
| Summer | 594.3 | −2.15 * | −40.2 | |
| Autumn | 319.7 | −1.32 * | −8.3 | |
| Winter | 385.0 | −2.41 * | −18.2 | |
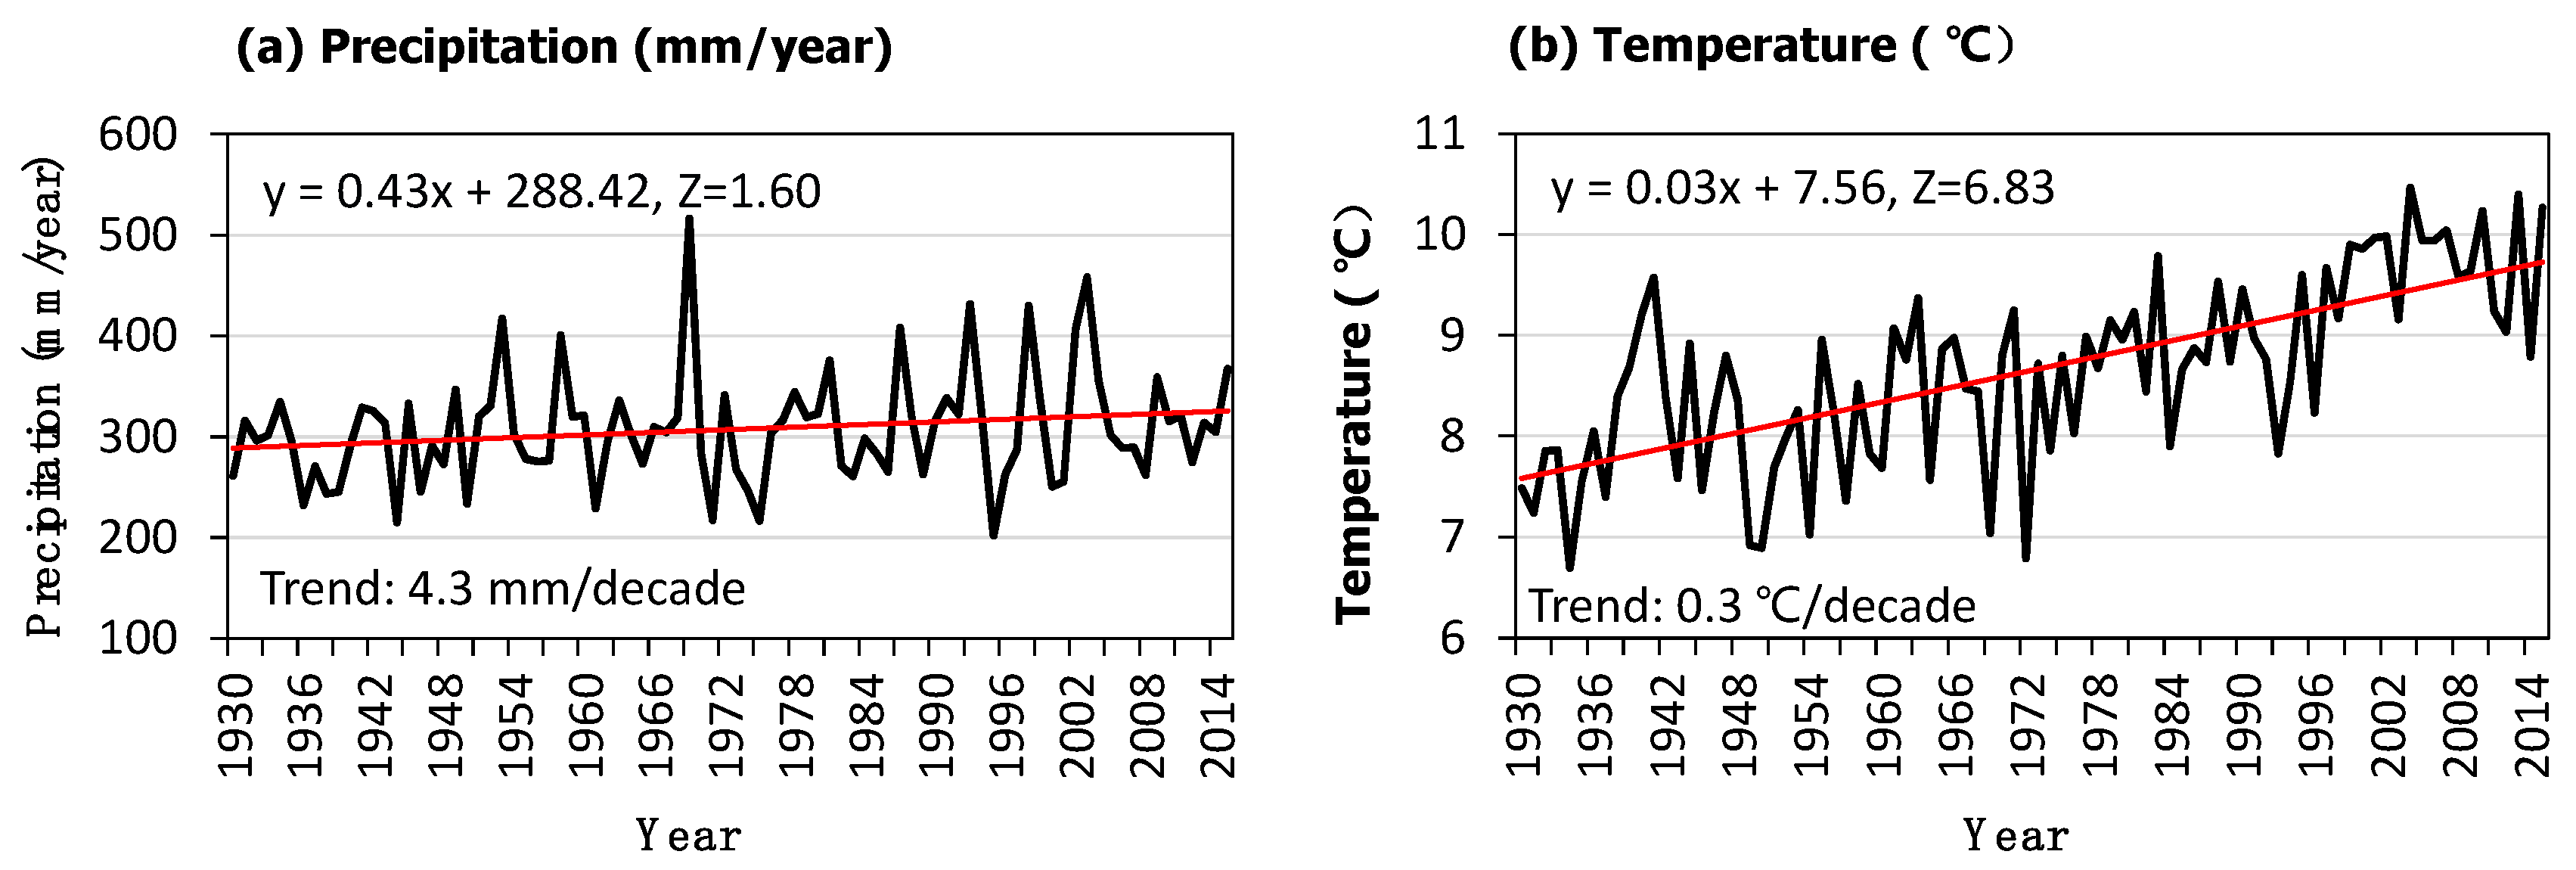
| Precipitation (1930–2015) | Annual | 307.2 | 1.60 | 4.3 |
| Spring | 124.6 | 0.69 | 1.3 | |
| Summer | 32.7 | 0.25 | 0.2 | |
| Autumn | 56.8 | 1.07 | 1.4 | |
| Winter | 93.1 | 1.40 | 1.5 | |
| Temperature (1930–2015) | Annual | 8.6 | 6.83 * | 0.3 |
| Spring | 9.5 | 4.29 * | 0.3 | |
| Summer | 22.2 | 5.64 * | 0.2 | |
| Autumn | 8.7 | 5.51 * | 0.3 | |
| Winter | −5.8 | 3.24 * | 0.3 |
| Station | Station 1 | Station 6 | Station 7 | Station 8 | Station 10 | Station 13 |
|---|---|---|---|---|---|---|
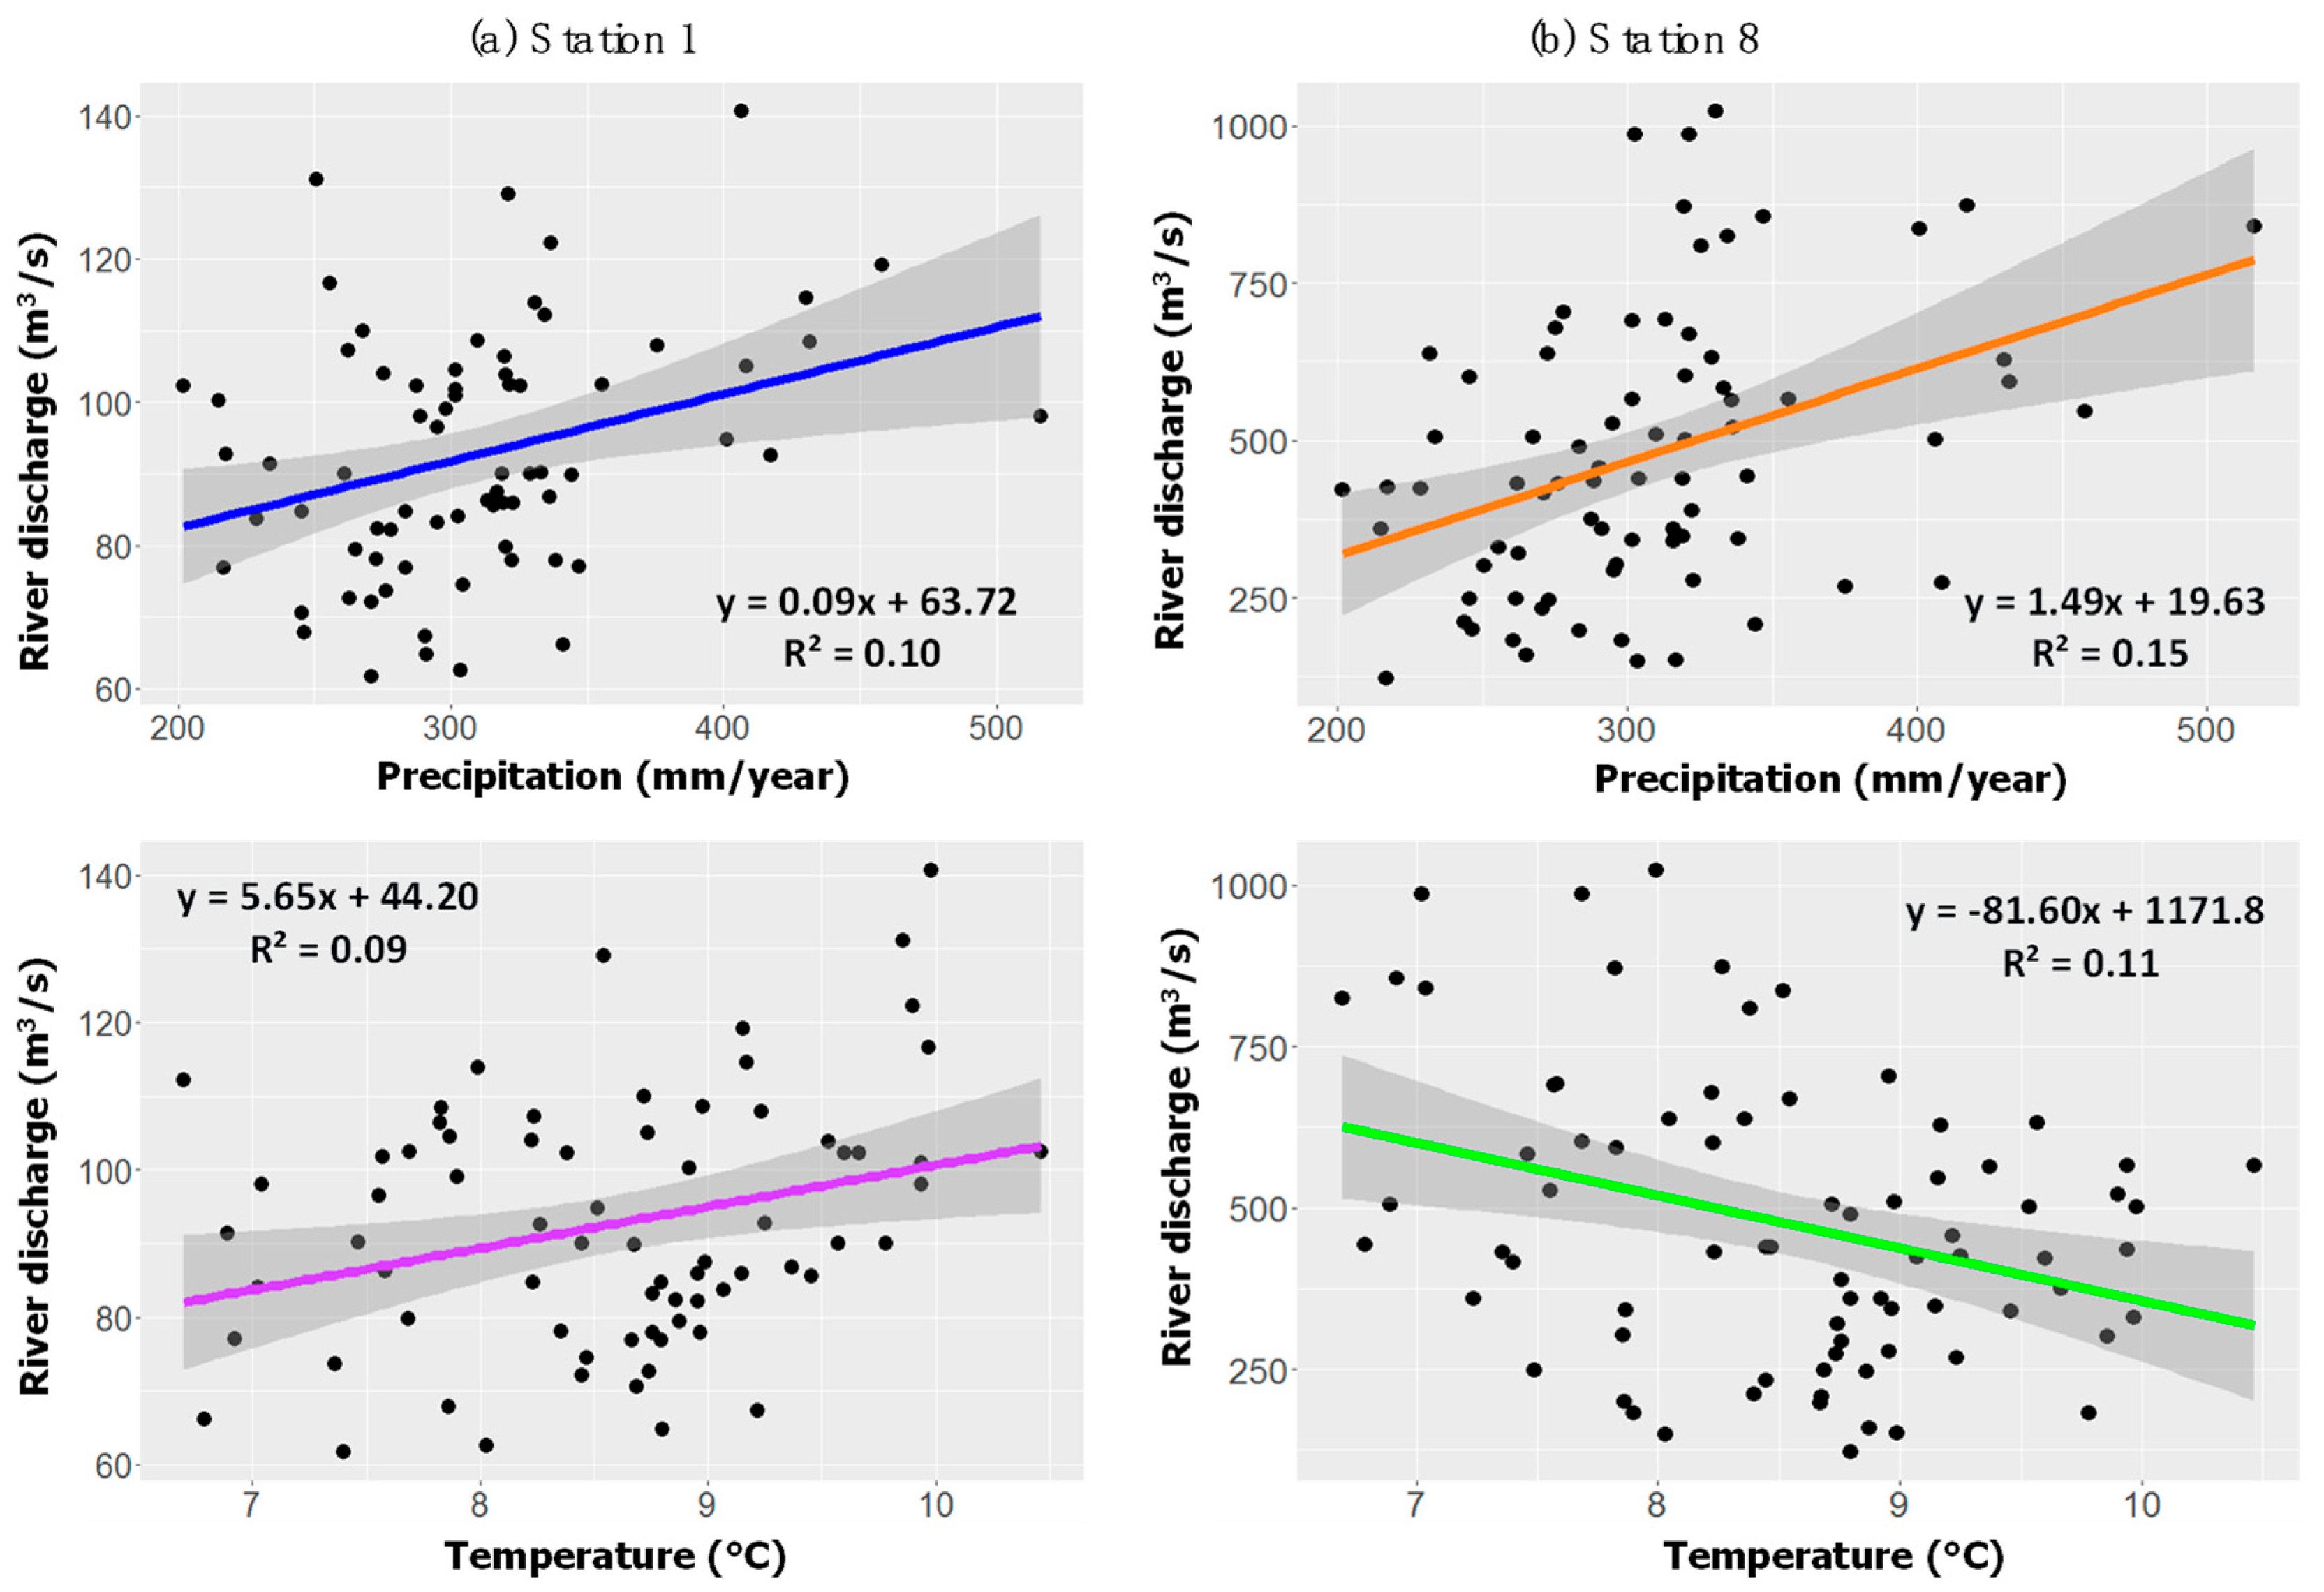
| Precipitation | 0.32 * | 0.31 * | 0.14 | 0.39 * | 0.50 * | 0.23 * |
| Temperature | 0.29 * | −0.38 * | −0.45 * | −0.32 * | 0.29 * | 0.55 * |
| Correlation Coefficient (R) | Correlation Strength |
|---|---|
| 0.0–0.3 | Very weak |
| 0.3–0.5 | Weak |
| 0.5–0.7 | Moderate |
| 0.7–0.9 | Strong |
| 0.9–1.0 | Very strong |
| Station | Parameter | Interception | Precipitation | Temperature |
|---|---|---|---|---|
| Station 1 | Coefficients | 0.55 | 0.11 | 6.85 |
| Standard error | 19.78 | 0.03 | 1.97 | |
| t value | 0.02 | 3.56 | 3.48 | |
| p value | >0.05 | <0.001 | <0.001 | |
| Station 8 | Coefficients | 684.42 | 1.40 | −74.95 |
| Standard error | 257.13 | 0.39 | 25.57 | |
| t value | 2.66 | 3.60 | −2.93 | |
| p value | <0.001 | <0.001 | <0.005 |
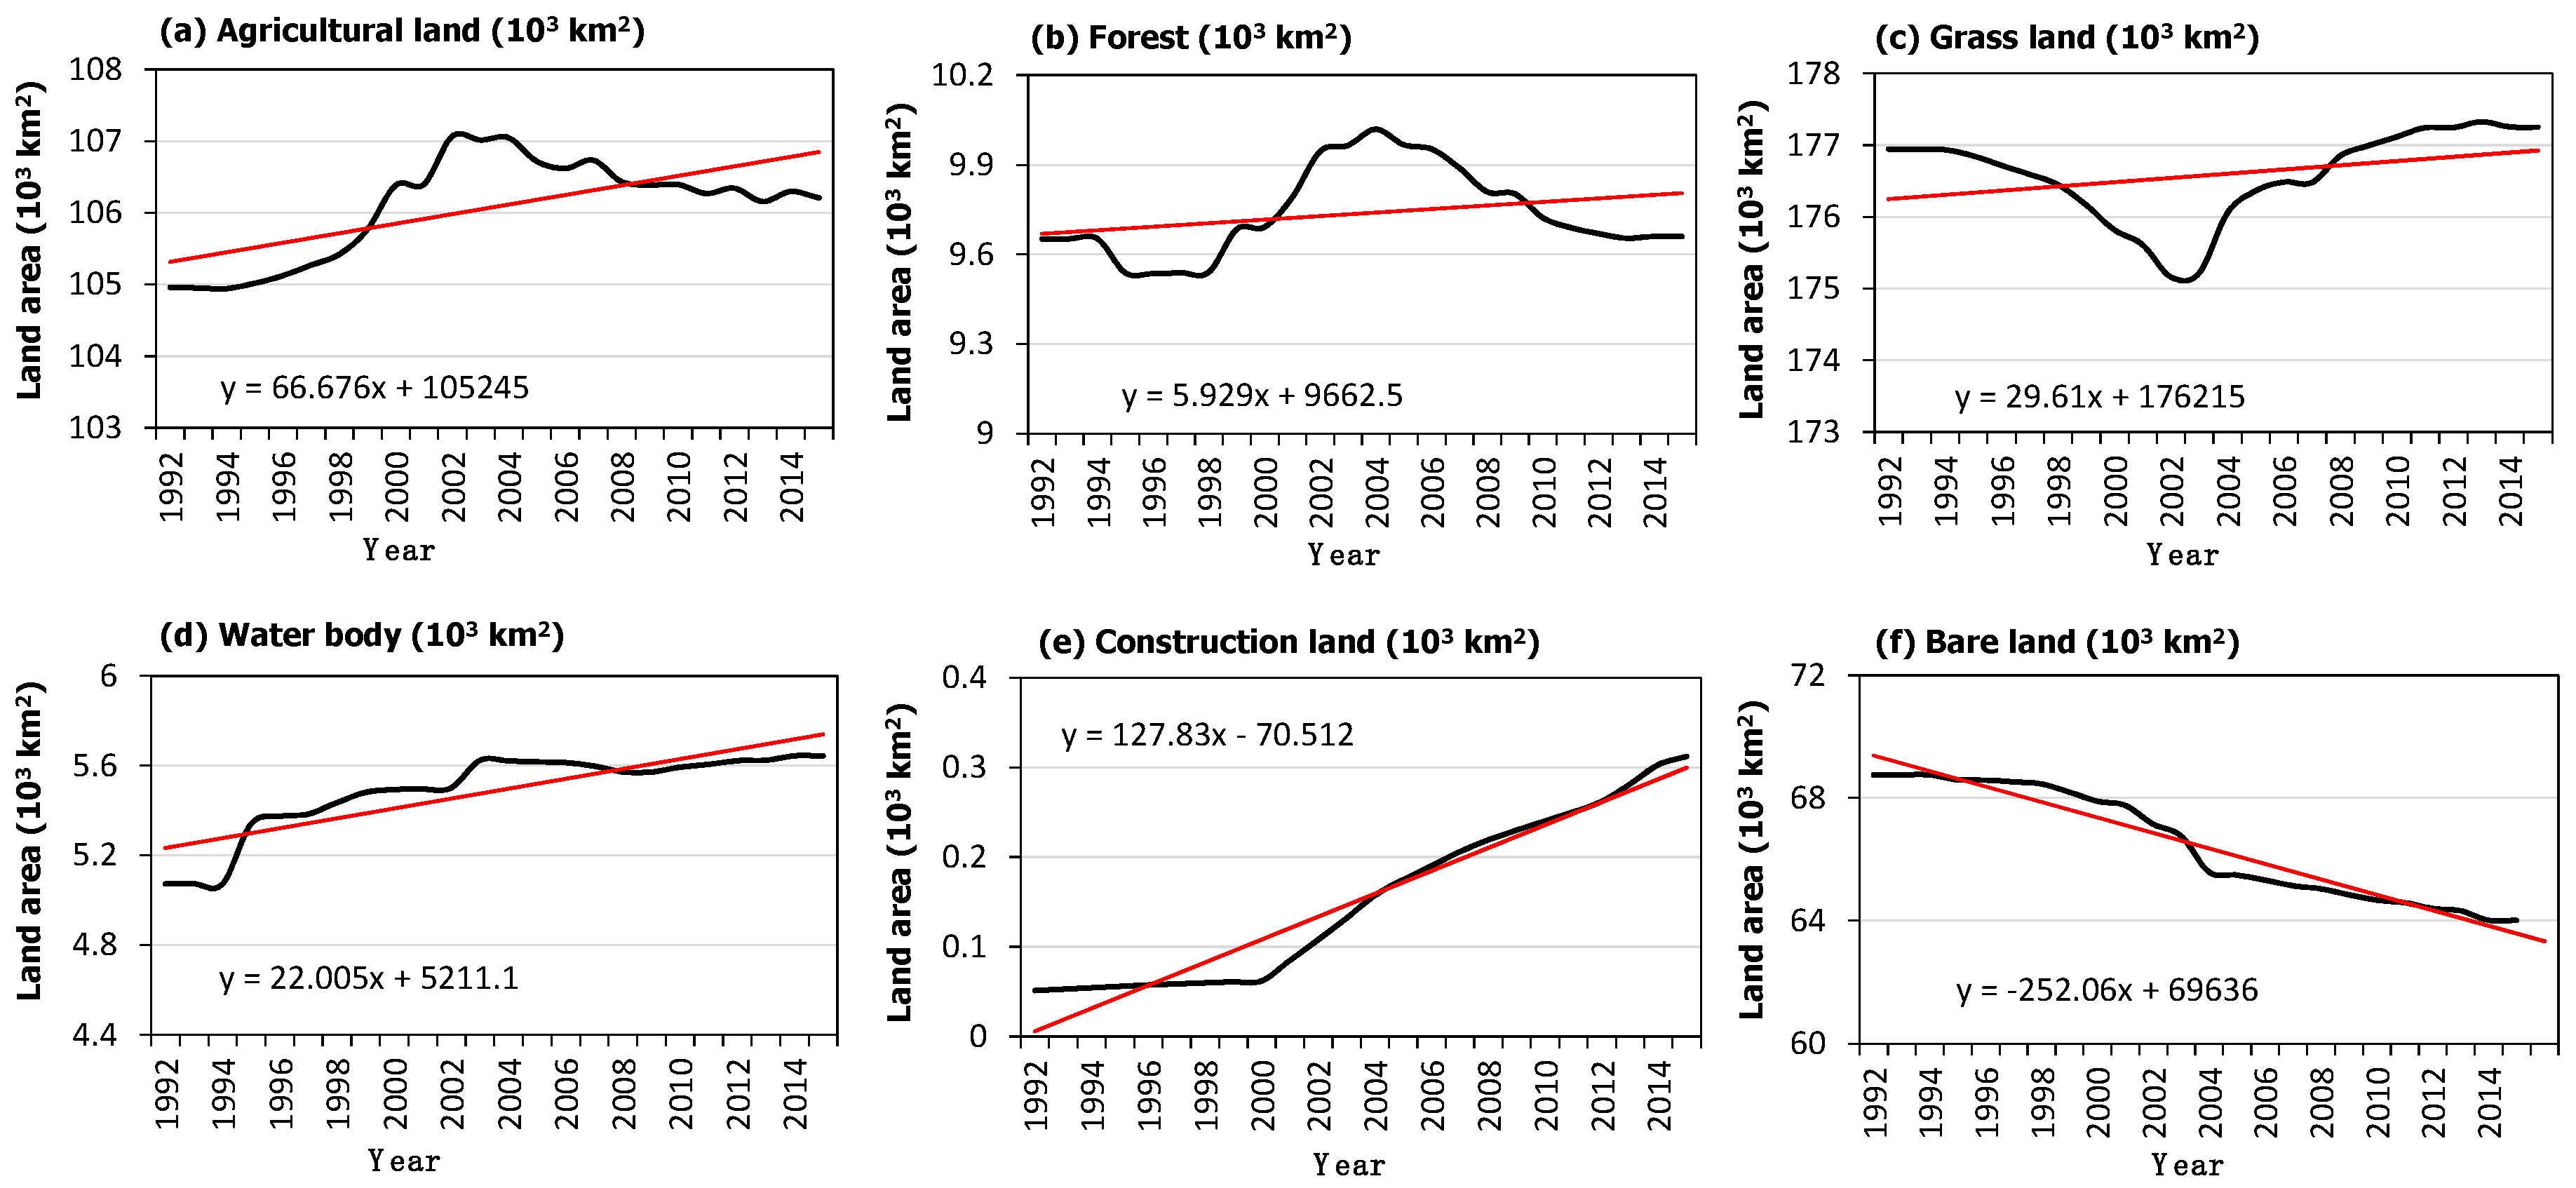
| Land Use | Agricultural Land | Forest | Grassland | Water Body | Construction Land | Bare Land |
|---|---|---|---|---|---|---|
| Change rate (km2/year) | 66.68 * | 5.93 | 29.61 | 22.01 * | 127.83 * | −252.06 * |
| Z | 1.96 | 1.27 | 1.91 | 5.21 | 6.82 | −6.82 |
| Canal’s Name | Capacity (m3/s) | Length (km) |
|---|---|---|
| Great Namangan | 61 | 162 |
| Northern Fergana | 110 | 165 |
| Great Fergana | 270 | 344 |
| Great Andijan | 200 | 110 |
| Southern Fergana | 130 | 103 |
| Akhunbabaeva | 60 | 50 |
| Upper Dalverzin | 40 | 30 |
| Lower Dalverzin | 78 | 25 |
| South Golodnaya Steppe | 300 | 127 |
| Kirov | 260 | 120 |
| Kyzylkum | 200 | 115 |
© 2019 by the authors. Licensee MDPI, Basel, Switzerland. This article is an open access article distributed under the terms and conditions of the Creative Commons Attribution (CC BY) license (http://creativecommons.org/licenses/by/4.0/).
Share and Cite
Zou, S.; Jilili, A.; Duan, W.; Maeyer, P.D.; de Voorde, T.V. Human and Natural Impacts on the Water Resources in the Syr Darya River Basin, Central Asia. Sustainability 2019, 11, 3084. https://doi.org/10.3390/su11113084
Zou S, Jilili A, Duan W, Maeyer PD, de Voorde TV. Human and Natural Impacts on the Water Resources in the Syr Darya River Basin, Central Asia. Sustainability. 2019; 11(11):3084. https://doi.org/10.3390/su11113084
Chicago/Turabian StyleZou, Shan, Abuduwaili Jilili, Weili Duan, Philippe De Maeyer, and Tim Van de Voorde. 2019. "Human and Natural Impacts on the Water Resources in the Syr Darya River Basin, Central Asia" Sustainability 11, no. 11: 3084. https://doi.org/10.3390/su11113084
APA StyleZou, S., Jilili, A., Duan, W., Maeyer, P. D., & de Voorde, T. V. (2019). Human and Natural Impacts on the Water Resources in the Syr Darya River Basin, Central Asia. Sustainability, 11(11), 3084. https://doi.org/10.3390/su11113084