Article

Is Voluntary Product Stewardship for E-Waste Working in New Zealand? A Whangarei Case Study

1
Faculty of Primary Industries, Science and Environment, Toi Ohomai Institute of Technology, Tauranga 3110, New Zealand
2
School of People, Environment, and Planning, Massey University, Palmerston North 4442, New Zealand
3
School of Agriculture and Environment, Massey University, Palmerston North 4442, New Zealand
*
Author to whom correspondence should be addressed.
Sustainability 2019, 11(11), 3063; https://doi.org/10.3390/su11113063
Submission received: 30 April 2019 / Revised: 20 May 2019 / Accepted: 20 May 2019 / Published: 30 May 2019

Abstract

:
New Zealand currently manages its annually-generated 99,000 tonnes of e-waste via voluntary product stewardship schemes. Limited data is available to determine the success of this approach. This lack of data is cited as the logic preventing the declaration of e-waste as a priority product by the Minister for the Environment which would trigger the enforcement of mandatory product stewardship. This case study involved an online survey of 264 Whangarei District householders asking questions about e-waste creation and management, as well as analyses of local services, and local and national policy. It found that only 1.8% of the estimated e-waste created in the district is recycled by municipal services, with the ‘cost to recycle’ and ‘a lack of knowledge’ presenting barriers to engagement in these services. The ‘lack of ability to repair/the cost to repair’ was found to be the most significant driver for e-waste creation. The adoption of mandatory product stewardship for e-waste was recommended to ensure robust and transparent data collection, see recycling services become more accessible, and raise awareness of these services, thus reducing the value-action gap. Mandatory e-waste management would also impact product design to ensure affordable repair-ability, further supporting a circular economy for electronic goods.

1. Introduction

The considerable volumes of e-waste (Waste Electronic and Electrical Equipment; WEEE) generated internationally [1,2,3,4,5], and the associated environmental and health impacts of this material [1,2,6,7,8] make this a waste stream of significant concern. Whilst it is recognised that New Zealand’s (NZ) waste data is poor and that this inhibits opportunities for better management [9,10], it has been estimated that as much as 97,000 tonnes of e-waste is being disposed of as landfill each year as this Whangarei case study found that 98.2% of generated household e-waste could be ending up in landfill. The authors largely attribute this limited diversion of e-waste into more appropriate recycling and treatment systems to the lack of a mandatory product stewardship (MPS)-based approach to managing e-waste in NZ [10,11].
E-waste has an estimated annual international growth rate of 3–10% [1,2,4]. The Global E-Waste Monitor estimated NZ’s e-waste increased by 1.1% between 2015 [8] and 2017 [3]. However, this does not account for population growth. The volume of e-waste generated by each NZ resident increased from 19 kg in 2015 to 20.1 kg in 2017 [3,5], with the e-waste generated nationally now estimated at 99,000 tonnes per annum (Note: An estimated total of 99,020.64 tonnes of e-waste is created annually in NZ. This is calculated as volume per resident 20.1 kg [5] × NZ population of 4,926,400 (Population estimate as at December 2018 [12])).
Whilst one of the cited barriers to improving e-waste management in NZ is deficient data [11], the significant risk of environmental harm of poor e-waste management has been widely recognised for some time [13,14]. In parallel, there are strong indications that New Zealanders broadly accept the arguments established in the scientific literature and the Global E-waste Monitor [3,5] that there are significant environmental, economic [15], and health benefits from e-waste reduction, reuse, recycling, and recovery of electronic and electrical equipment (EEE); and that EEE can be most effectively managed under an MPS scheme [16,17]. However, whilst generally the issues around e-waste are clear, arguments in favour of improved end-of-life (EOL) management are strong and legislative provision already exists; a lack of NZ-specific data, questions about ‘willingness to pay’ [18], scheme design, and the political tenability, prevent the Ministry for the Environment (MFE) from declaring e-waste a ‘priority’ waste stream under Section 9 of the Waste Minimisation Act 2008 (WMA) [19]. If prioritised, product stewardship schemes for e-waste in NZ would become a mandatory responsibility of EEE producers [19]. Drawing on e-waste data from a case study of households in the Whangarei District of NZ, as well as the international literature on e-waste management, the authors argue that a well-designed and managed national MPS for e-waste for NZ provides the most appropriate model and opportunity for progress.

1.1. The New Zealand E-Waste Scape

The ‘e-waste scape’ is based on the term “wastescape”, a term grounded in the work of Appadurai (1996, as cited by Ref. [20]), which describes scapes as “cultural flows”. This work does this by presenting the Whangarei e-waste scape, and the NZ e-waste scape as a whole, as a “dynamic political, historical, economic, social, and environmental space (s), where waste is culturally interpreted and mobilised … (and how these) are informed and structured by groups and individuals and include those at regional, national, and global scales” [20] (p. 12).
Aside from relatively minor e-waste product stewardship schemes by individual producers (see Table 1), there is currently no formal overall system for e-waste management. Unless a product type is designated as ‘priority’, MPS is not required under the WMA. Voluntary product stewardship schemes may also be accredited under the WMA, and a range of accredited and non-accredited schemes are currently in operation (Table 1). However, reliable data determining how much of the total amount of e-waste produced in NZ is recycled and/or diverted from landfills using these schemes is not available. Similarly, due to a lack of regulation, it is currently not possible to determine how many e-waste recyclers are operating in NZ nor to what standard these operations are processing/recycling e-waste. This is a concern as, during research conducted for the Minister for the Environment, SLR Consulting’s 2015 report [11] found insufficient data to recommend e-waste to be designated a ‘priority product’ under Section 9 of the WMA. This is not the first time this has been the outcome of proposals to prioritise waste streams in NZ (see for example Ref. [21]).
The WMA is a piece of NZ legislation that aims to encourage a reduction in the amount of waste generated and disposed of in the nation. The lack of data observed in the SLR report [11] highlights the under-utilisation of part 6 of the WMA, which enables the government to require that records and information be provided to the MFE Secretary by “any class of person” relating to the “progress in waste management and minimisation”, “the state of NZ’s environment”, assessment of “performance in waste minimisation and decreasing waste disposal”, and identification of “improvements needed in infrastructure for waste minimisation” [19] (s86).
New Zealand is ranked as the 10th most wasteful country in the world in terms of ‘urban waste’ according to the World Bank [29]. In their 2015 report, the United Nations University Global E-Waste Monitor estimated that NZ disposed of 19 kg/inhabitant of e-waste in 2014 [5]. However, this figure had risen to 20.1 kg per NZ resident in their 2017 report [3]. The 2015 report pointed out that, unlike Australia’s co-regulatory product stewardship backstopped by legislation, because e-waste was not classed as a ‘priority’ waste stream in NZ, most e-waste is going to landfill. The E-waste Monitor found that, because of NZ’s lack of commitment to utilise legislation and regulation to manage e-waste, there are not currently, nor have there ever been, restrictions in place in NZ to prevent e-waste (as a hazardous waste stream) entering landfills.
However, NZ does have a legislative framework which potentially enables the appropriate management of e-waste, as highlighted in Table 2. The main Acts of Parliament that relate to waste management are the WMA; the Resource Management Act 1991; and the Local Government Act 2002. Further to this, the NZ Waste Strategy 2010 outlines the two strategic waste goals of the current central government: to reduce the harmful effects of waste and to improve the efficiency of resource use. NZ is also party to various supranational directives including the Basel, Rotterdam and Stockholm Conventions; the Noumea Convention; and the Minimata Convention on Mercury, which are all relevant to the management of e-waste.
While NZ’s legislation and policy has the tools to manage e-waste appropriately, these rely on effective data. Both the 2006 and 2007 Organisation for Economic Cooperation and Development (OECD) reviews raised concerns regarding the lack of data available to allow the central government to set waste management targets [32]. Ten years later, the OECD environmental review of NZ [33] still observes that the collection of data relating to waste management in NZ could be improved for the same purposes.
Due to the lack of product prioritisation, and thus voluntary product stewardship and recycling schemes for e-waste in NZ, large volumes of e-waste are ending up in landfills. Gertsakis et al. [13] found that while some organisations did provide ‘take-back’ schemes (a form of product stewardship where producers take back EEE at the end of the product’s useful life) in NZ for household consumers (see Table 1), for example, they were largely ineffective, as they were often inaccessible, particularly for consumers who reside outside municipal centres. These issues, and others relating to waste, have risen recently in NZ politics, with the Associate Minister for the Environment, Eugenie Sage, discussing the need to use the “tools in the Waste Minimisation Act” that were, in her opinion, inadequately adopted by the previous government [34] (para. 15). At the launch of the Green Party waste strategy on 19 August 2018, Sage made specific reference to the requirements of broadening the waste levy and the introduction of MPS schemes [34].
There are several non-government organisations (NGOs) and initiatives in the e-waste scape in NZ, as outlined in Table 2 (Note: Table 2 outlines the most prominent NGOs in the e-waste space; it does not provide an exhaustive list of NGOs with an interest in e-waste in NZ). The most prominent of NGOs in the e-waste space is the eDay NZ Trust which replaced CANZ in 2010 [35]. From 2007 to 2010, CANZ was responsible for organising eDay: an annual collection day, funded by the MFE Waste Minimisation Fund (WMF), where household consumers could drop off their e-waste in main centres to be recycled free of charge. In their 2011 report, Gertsakis et al. claimed that the series of community based participatory eDays were successful [13]. The eDay NZ Trust stated participant numbers and drop-off volumes increased each year and estimated that 3220 tonnes of e-waste was recycled over the 4-year period (2010). Despite these claims, Hoeveler [36] found that the amount collected was barely 10% of the EEE imported over the same number of years. The year 2012 saw the introduction of another e-waste collection initiative, the ‘TV TakeBack’ programme, which ran from 2012 to 2014 during the transition from analogue to digital television. Collection hubs were set up throughout NZ, as the move to digital television rendered a large number of CRT TVs obsolete, with up to 500,000 TVs expected to be collected during the campaign [37,38].
Further to the aforementioned programmes, Starship Hospital (Starship) in partnership with Re:Mobile, ran a mobile phone collection appeal as part of its fundraising activities from 2009 to 2014. Starship [22] claimed that the scheme successfully diverted over 150 tonnes of e-waste from landfills, however, this figure could not be confirmed. Starship discontinued fundraising in this way in 2015, citing both the diminishing supply and value of mobile phones. Starship stated that, from their experience, “people are holding onto new smartphones for longer, selling them, or passing them on to family and friends” [22] (para. 2), and therefore collection was no longer an effective fundraising technique. However, the Re:Mobile initiative remained committed to the collection of cell and smart phones (see Table 1) despite the conclusion of the partnership with Starship, and now works with a new charity partner, Sustainable Coastlines [23]. Since the conclusion of these e-waste collection initiatives, excluding the Re:Mobile scheme, there have been no national schemes to promote the collection of e-waste. As a result of the 2015 SLR report [11], it is unlikely there will be any changes in the future in the absence of improvements to data collection and sharing.

1.2. Whangarei Case Study

The city of Whangarei is located in NZ’s northernmost region with an estimated population of 86,754 [39]. Whangarei District Council (WDC) offers a user pays, fee-based drop-off e-waste recycling service at each of its eight rural transfer stations and at its central waste facility [27]. However, currently these services manage only 1.8% of the estimated 1743 tonnes of e-waste generated in the district each year (31.72 tonnes recycled by municipal services annually/1743 tonnes estimated annual volume of e-waste created in the district) (see Table 3).

2. Methods

The research tool utilised for this study was a voluntary online survey of Whangarei householders. The survey was available to respondents from 9 March 2018 to 13 April 2018. Google Forms was employed as the data collection platform. A significant proportion of the international research investigating household consumer e-waste employed surveys as a research tool (see for example: Refs. [40,41,42,43,44]). However, of the examples listed, only one utilised online surveys (see: Ref. [41]), while others used administered surveys and face-to-face interviews. The voluntary online survey approach was selected due to the ease of administration and the ability of surveys to provide an “accurate representation” of the opinions, preferences and attitudes of a “significantly larger number of people” [45] (p. 3) from a relatively small sample. However, this approach has recognised limitations, including that associated with self-reported data, where there is the possibility for respondents ‘to exaggerate their waste management behaviours especially when these are perceived to be ethically sound” [40] (p. 27). This limitation was minimised through the application of “integrated methodologies” including a blend of qualitative and quantitative research tools to provide “greater depth, context, and nuance” to responses [20] (p. 15). While the survey was predominantly quantitative, respondents were encouraged to include additional written comments and three solely qualitative open-ended questions were included. Further, to minimise response bias in this research project, thoughtful, well-researched, peer reviewed, and rigorously pre-tested survey questions were developed that sought to eliminate issues such as leading questions and subconscious bias.
The target population for this research included all households in the Whangarei District (30,204 occupied dwellings in the 2013 census [46]) over the age of 16. The age restriction was applied for ethical reasons and was not considered to be detrimental to the outcomes of the research as the literature indicated that adults are more likely to take responsibility for household waste management [47,48].
This research used ‘convenience sampling’, a non-probability sampling method where data is collected from ‘group’ members who are conveniently available to participate in the study (i.e., “getting participants wherever you can find them” [49] (para. 2)), managed through email and social media. Participants were invited to access the online survey via the link provided. For example, localised Facebook groups (such as community and sports groups) were used to share the link, and individual invitations were sent to the Whangarei-based researchers contacts via LinkedIn. Snowballing techniques were deployed to encourage and increase participation and to ensure a statistically valid sample size to enable a reasonable margin of error. For example, survey respondents were asked to share the survey link with their local friends, family, and colleagues. Individual invitations were sent to over 150 social and professional contacts in the Whangarei area via email, sourced through the local tertiary institution and the local chamber of commerce. This minimised any bias concerning representativeness created by using the snowballing technique (for example, see: Ref. [49]).
In order to meet the objectives of the research, mainly quantitative data was collected, with 18 of the 21 survey questions (see: Appendix A) being closed questions that collected numerical data, utilising tools such as Likert scales and multiple choice. It was not mandatory for respondents to answer all questions, and questions could be skipped if respondents chose not to answer. Statistics exhibiting the Whangarei District household e-waste behaviours was a key output of the research project, as statistics can identify and, when coupled with qualitative results, clarify factors influencing behaviour, if this behaviour is affected by the e-waste category, and if these factors could be influenced by MPS. (Note: This study separated e-waste into 11 categories: Small Household Appliances; Large Household Appliances; Information and Communication Technology; Handheld Devices; Phones; Audio Visual Equipment; Lighting Equipment; Electrical Tools; Toys, Leisure and Sporting Equipment; Batteries; and Medical Equipment). The quantitative data generated also provided a statistical baseline for future research, which can enable comparison across districts, complete a broader NZ wide picture and address the data gap cited as a key reason for the current non-declaration of e-waste as a priority product under the designated terms of the WMA, which triggers the requirement for developing MPS in NZ [19]. This baseline information could also be used to inform international research looking for insight into similar issues.
To complement the quantitative data with descriptive context [50], qualitative elements were also included in the research tool, allowing the individual voices of participants to be heard. These responses allowed for a better understanding of the overall data collected and also facilitates triangulation against the quantitative data [51] and the literature. The inclusion of qualitative factors ensured a rich description of the data and direct quotations were utilised in analysis to illustrate the opinions of the respondents. This enabled the authors to explicate further depth of meaning from the data being presented, thereby increasing the interest value, relatability, and perceived validity by the reader [50].
In total, 248 individual Whangarei householders participated in the online survey. The respondents’ demographic data gleaned from the survey (see: Appendix A) approximately represented the district population, as illustrated in the results. In order to ensure validity, this research aimed to achieve a 2% margin of error. However, the number of responses collected allowed for a margin of error of 6% with a 95% confidence factor.
As only one research tool was utilised, only one set of data was produced and analysed in a straightforward manner. However, due to the quantitative and qualitative nature of elements within the data set, different analysis methods were applied. Each set of quantitative questions was analysed to identify trends. Responses were grouped together as appropriate (for example, questions 11 and 12) and graphed for easier interpretation. Correlation equations using Microsoft Excel were also conducted to ascertain correlations between demographic factors and general recycling behaviours, and environmental value statement responses. Demographic factors (age, household makeup, income) and general recycling behaviours were also compared with e-waste recycling behaviours across 11 categories of e-waste. Line graphs were made to review groupings or anomalies for further analysis.
Qualitative responses were coded, and key themes were determined by the repetition of key words and phrases. These key words and phrases were analysed, and themes were derived independently, directly from the source data, as well as relative to observations emerging from the literature review undertaken before the survey process had commenced. Typical agencies of possible bias and personal opinion were also identified, annotated and discussed in an effort to enhance the objectivity of the research process. Further to this, the answers given to qualitative question 16 were compared with the quantitative results of question 12 to determine whether the qualitative responses supported the quantitative findings, thus highlighting any possible value-action gap.

3. Results

In order to make reasonable assumptions about the e-waste recycling behaviours and understandings of Whangarei District households, it was important to ensure that the demographic profile of the district was represented in the survey. Furthermore, international research has shown that there is a relationship between demographic factors and both general recycling and e-waste recycling behaviours [20,40,48,52]. For this reason, it was important to collect this data to investigate if this was also true for the Whangarei respondents.
The survey sample represented 248 householders from 35 of the 42 suburbs in the Whangarei District, of whom 82% were female. Smith [53] found that women often have a higher response rate to online surveys. Conversely, high female response rates generally appear atypical for research conducted via surveys relevant to household waste or e-waste.
Beyond gender composition, seven age groups, from 16–65+, were represented in this study. Over 90% of responses came from household consumers over the age of 25. Twenty-five to 34-year olds (25%) and 35–44-year olds (26.2%) were the groups with the highest representation. The age groups over 25 were more highly represented than in the 2013 Census data for the Whangarei District (Note: The 2013 NZ Census data was the most recent data available at the time of data analysis) [46]. This may be because this survey was not open to participants under the age of 16. Ethnic group identification, however, nearly matched those found in the 2013 Whangarei District Demographic Profile [39].
Households with children made up 56.5% of responses. This response was lower than the 2013 NZ Census data [46] of 63.8%. Over 70% of NZ Census respondents had completed some form of tertiary education which is close to the District representation of 74.9%. However, 47.3% of the district survey respondents reported having completed a Bachelor’s degree or higher, which is much higher proportionally than indicated by the 2013 NZ Census data (13.9%). This over-representation is likely due to the fact that those with higher education are more likely to respond to survey invitations (while the referenced research was conducted using a mail survey, the same can be assumed for online survey methods) [53]. The survey also found that household income represented at a rate higher than the 2013 Census information with 63.3% reporting household incomes of over $50,000 compared with a Census total of 22.6% [46].
The final demographic question that the survey asked related to political affiliation. This was relevant to this study as political affiliation can indicate pro-environmental values [54]. The results found that, when compared with the 2017 General Election Results for the Whangarei Electorate [55], “right-wing” party supporters (the NZ National Party is considered a right-wing political party) were under-represented in the results by 29.6%, with “left-wing” party supporters (the NZ Labour Party and the NZ Green Party are considered left-wing political parties) over represented by 16.3%. This is relevant to this study as left-wing parties and their supporters are considered to hold more pro-environmental values [54], and an over-representation of pro-environmental views may have caused bias in the survey responses.
While the research findings around political affiliation did not appear highly correlated with the most recent electoral representation of the district, given complexities such as the increased levels of income, education, and the association of environmental and progressive political views, they can be considered to provide a reasonable picture of the demographic profile of the district, within the practicable scope of this study. On this basis, this research provides a reasonable foundation for undertaking generalised discussion on e-waste in Whangarei and, beyond that, NZ, as reasonable assumptions can be drawn for the population with a margin of error of 6%.

3.1. General Recycling Behaviours and Values

International research suggests that general household recycling behaviours and values impact household e-waste recycling (see for example: Refs. [20,41,48,53]). For this reason, the survey of Whangarei District households asked respondents questions relating to their general recycling behaviours and values. On a five-point scale from “Always” to “Never” recycle, respondents were asked how often their household recycled glass, plastic, metal, aluminium, paper and cardboard–all of which are collected kerbside in most parts of Whangarei. Respondents were expected to use their own judgement regarding their frequency of recycling and were not given strict definitions for these five scale points. For all six categories, at least 50% of respondents reported that they “Always” recycle, with plastic and cardboard both scoring over 70%, and glass reaching almost 90%. Metal recorded the lowest at 51%, likely due to the often large-size of metal waste items and the fact that kerbside collected recyclable waste must fit into the standard 55 L recycling bin [56].
Participants’ knowledge and values in relation to recycling causes and impacts were also questioned. Respondents were asked to rate whether they agreed or disagreed with a range of statements, some of which were factually correct, and some of which were factually incorrect. This helped to determine how much participants understood the impacts of general household recycling (i.e., their environmental ‘knowledge’), and, to a lesser extent, to allow for an introduction to the main survey topic: e-waste management behaviours. The responses indicated that householders seemed to have some understanding of general household recycling, particularly relating to resource conservation and the reduction of landfill use. However, they were less certain about whether recycling created jobs, or whether recycling made a difference to the environment. Further to this, while householders seemed reasonably confident that e-waste created significant environmental and social problems, they were less certain about the environmental impact of storing e-waste.
In addition to ‘knowledge’, two questions focused on pro-environmental values with 90% indicating they felt a moral obligation to recycle. However, respondents were unsure if their household could be held responsible for contributing to environmental problems caused by excessive waste generation, with all results on the five-point scale (from strongly agree to strongly disagree) being reasonably even (see Figure 1).

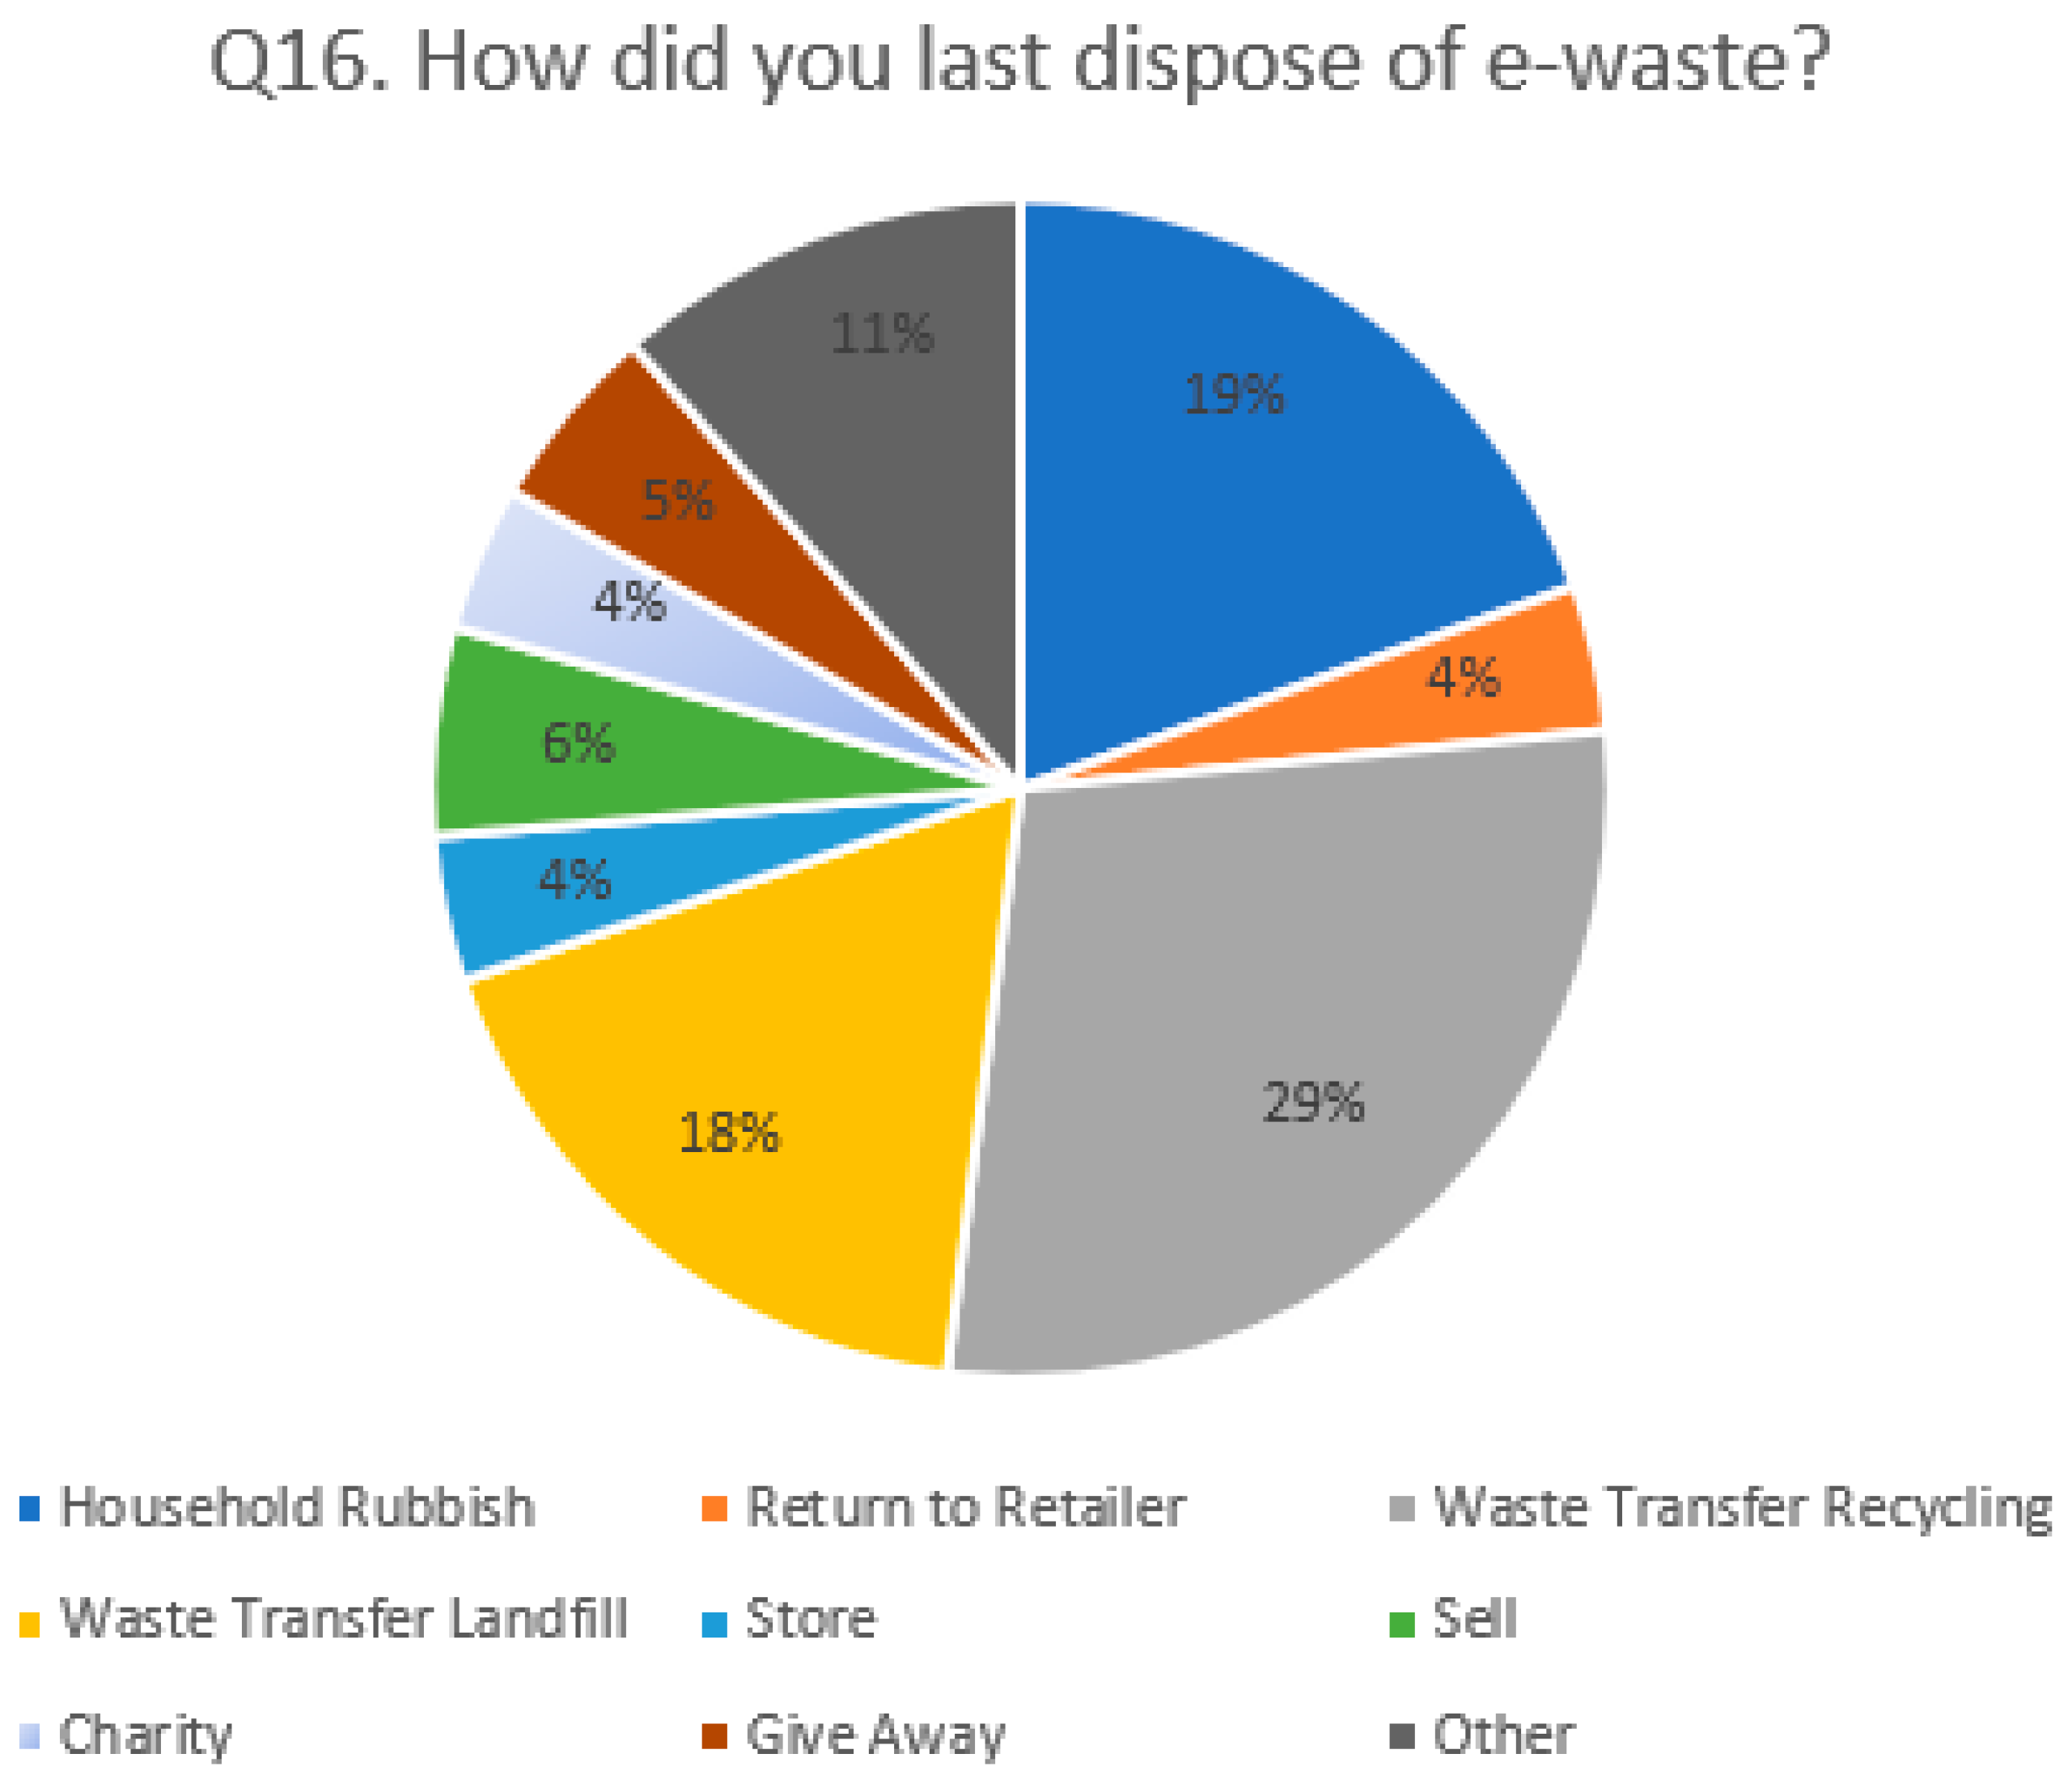
3.2. E-Waste Behaviours–Quantitative Results

Most of the survey questions focused on e-waste, including household behaviours and values, and opinions on local and national options and services available. Part three of the survey investigated e-waste behaviours and asked respondents to indicate why (and how) they might dispose of e-waste across 11 categories. The categories utilised in this survey were derived from a combination of the WEEE categories as outlined in the European Union (EU) Directive [57] and recent e-waste management literature. This combination captured a wide range of e-waste relevant to the district including small and large household appliances and more specific categories such as phones, handheld devices, and batteries. Figure 2 presents the reasons Whangarei households dispose of e-waste.
Further to the results presented in Figure 2, respondents were asked to elaborate if they selected “Other” as a reason for disposal (i.e., an option that differed from the list available). Most respondents who commented here stated that they did not have e-waste in certain categories (e.g., ME), as there was no “not applicable” option in this question. However, some statements relating to other reasons for disposal were made, many of which related to product design, including statements implying technological and planned obsolescence were the reason for their disposal.
Part three of the survey went on to ask how households currently dispose of e-waste by giving them a selection of possible disposal methods and asking them to select all that applied. As shown in Figure 3, using the mean ( x ¯ ) of responses to calculate across 11 categories, “throw away with household rubbish” was the most common method of disposal ( x ¯ = 29.6%), affected significantly by lighting equipment and batteries. The second most common disposal method was disposal at a waste transfer station, particularly affected by large household appliances, ICT, and AV equipment. Table 4 presents these results indicating the most common method of disposal by e-waste category, by disposal method, and by least common disposal method.
Again, respondents were asked to elaborate if they selected “Other” as a method of disposal (i.e., an option that differed from the list of eight disposal methods provided). Most respondents’ written responses outlined other forms of recycling that they undertook, including local metal recyclers, local e-waste recyclers (non-municipal), or other national voluntary recycling initiatives.
Respondents were asked two questions which directly related to the storage of e-waste. Table 5 illustrates how many e-waste items may be in storage in Whangarei homes, with Figure 4 presenting reasons why households store e-waste.
Utilising line graphs to present patterns and groupings, relationships were investigated between age, household makeup, income, recycling behaviours and e-waste disposal methods. While some spread could be seen in age and income for the various e-waste categories, this may have been influenced by the relatively low numbers of respondents in the associated categories (e.g., only two respondents in the 16–18-year-old category). No clear significant relationships could be found for any of the 11 categories indicating that demographic factors do not influence e-waste disposal in the Whangarei District.

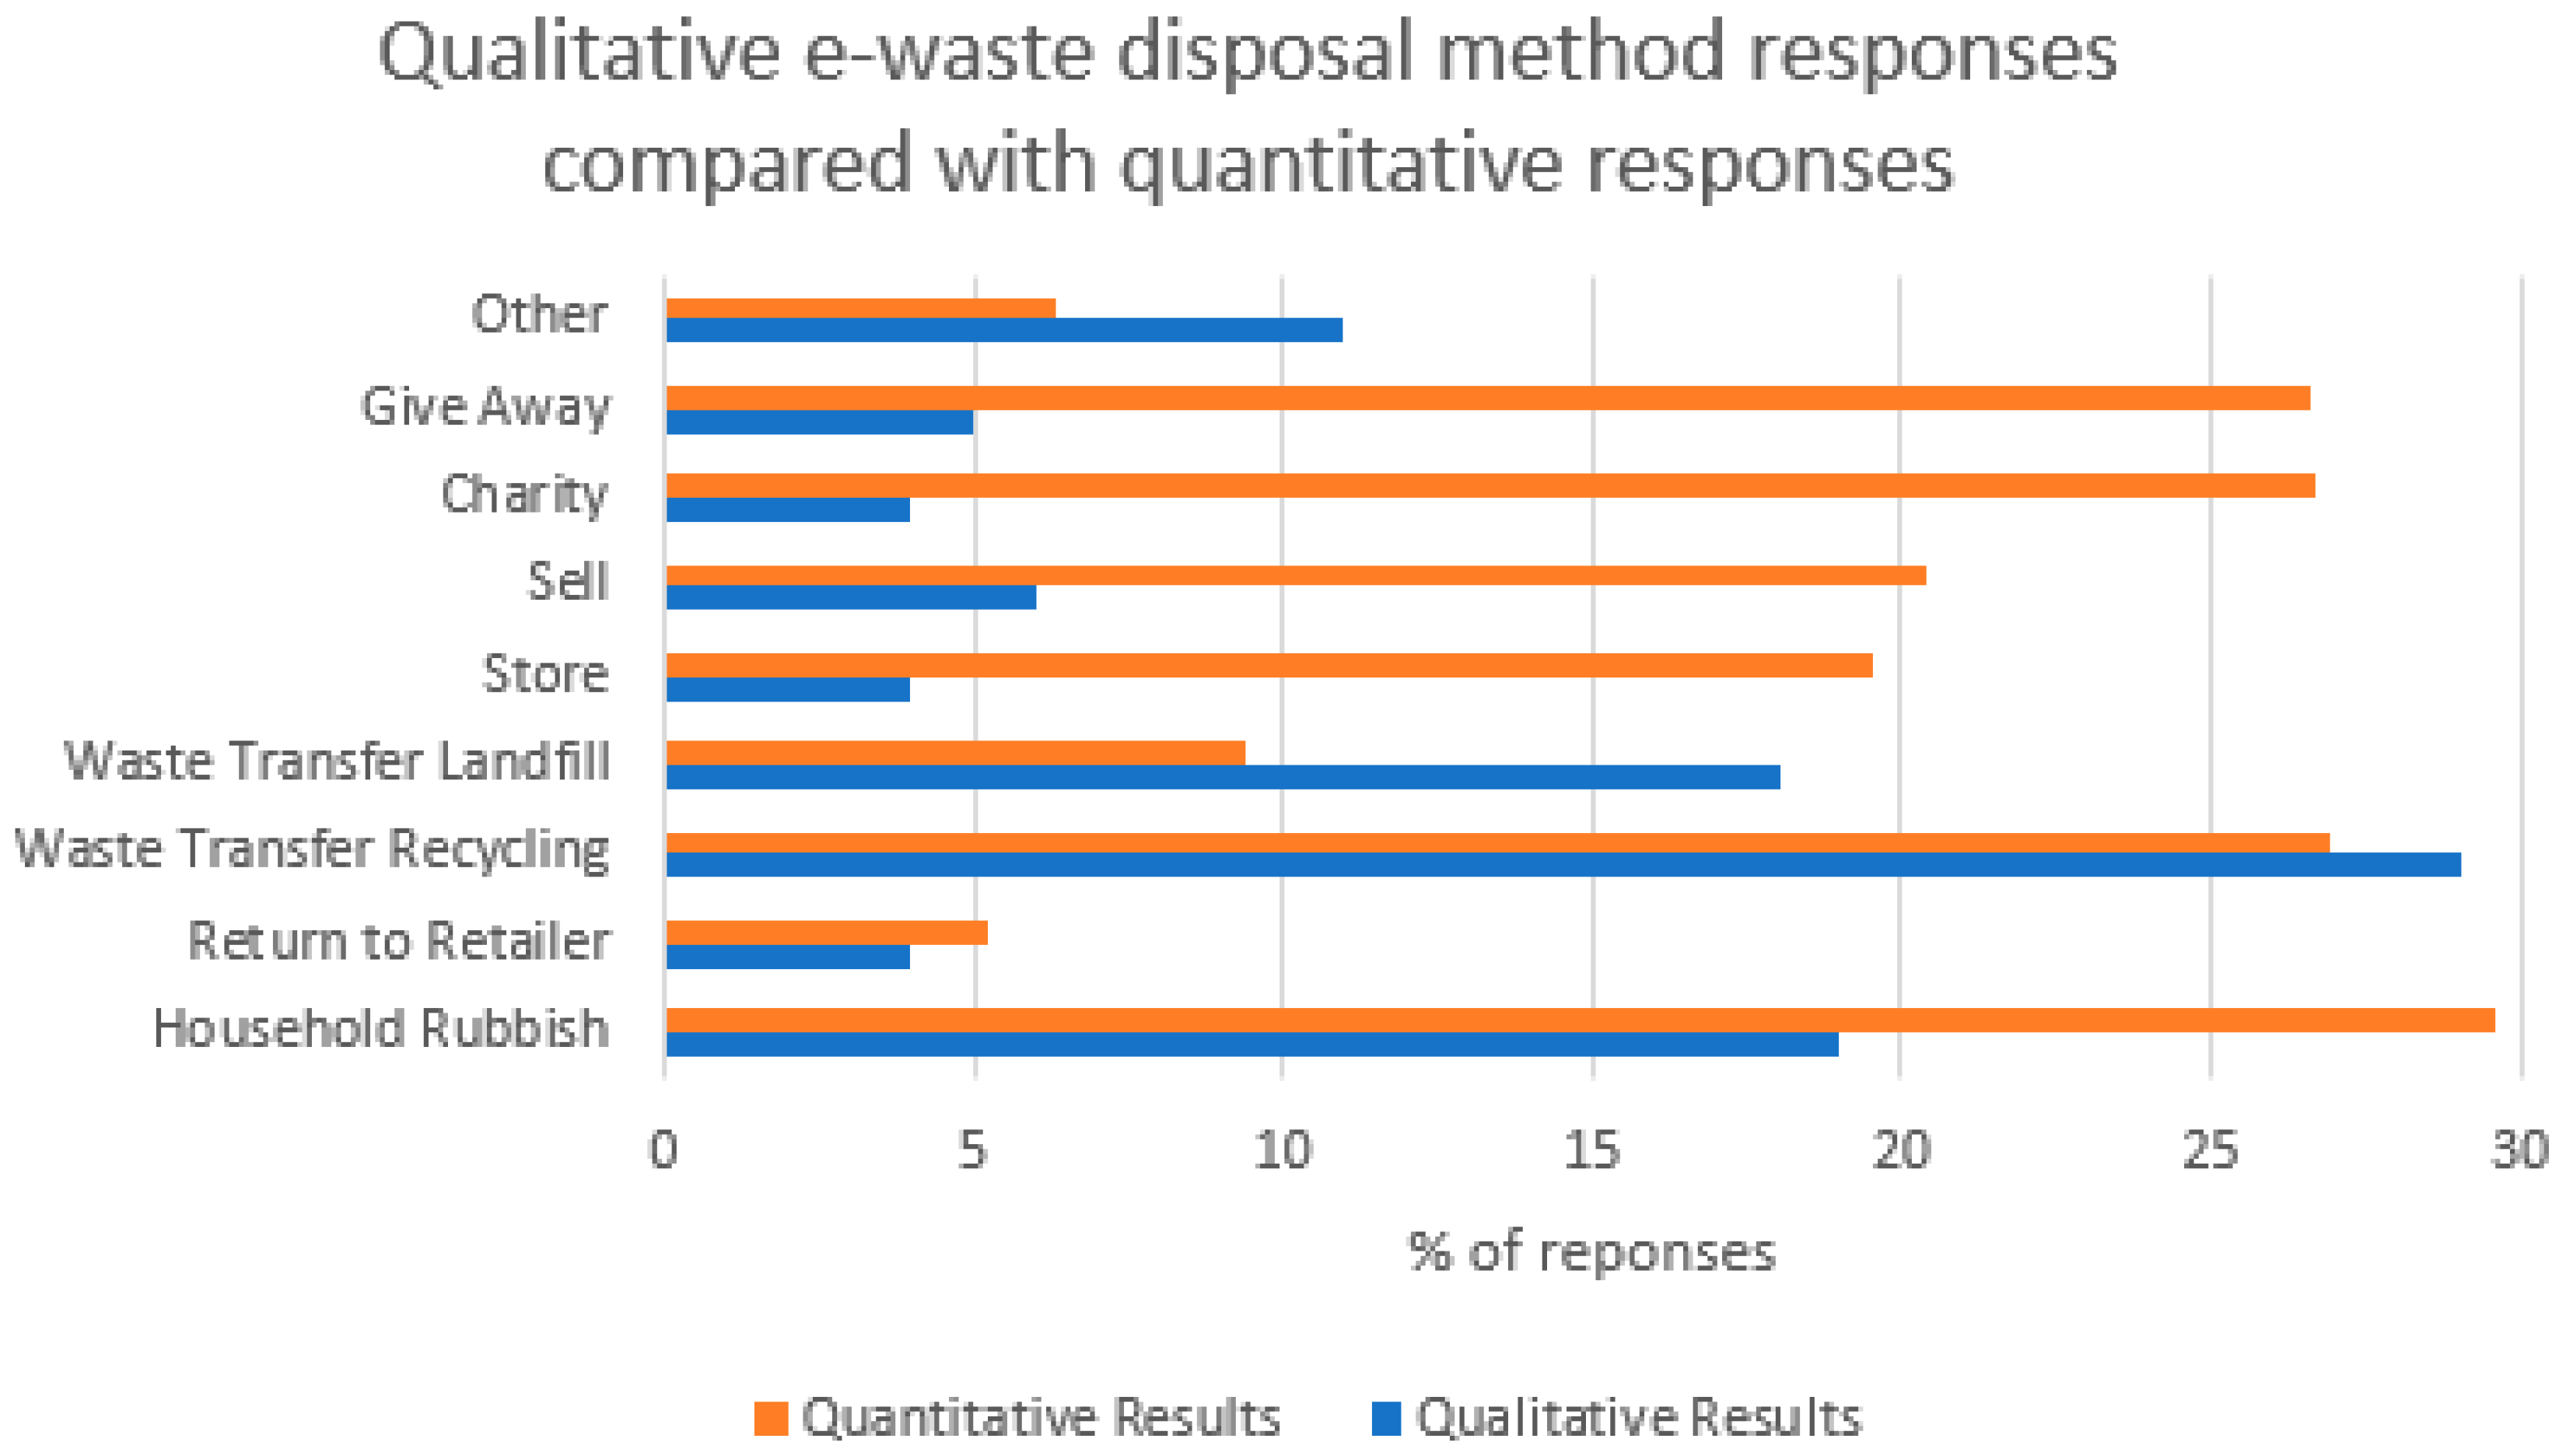
3.3. E-Waste Behaviours–Qualitative Results

Question 16 of the survey was an open-ended question that asked respondents when the last time was that they disposed of e-waste and how they disposed of it. Quantitative metrics were used to analyse this qualitative data. Figure 5 shows landfill disposal (household rubbish and waste transfer landfill) was the most common disposal method. This was followed by recycling methods (return to retailer and waste transfer station recycling) and reuse methods (sell, give away). When compared with the solely quantitative question results of how residents currently disposed of their e-waste (see Figure 3), Figure 6 shows that the disposal method differs significantly. For example, while landfill rates were similar between both questions, recycling rates were much higher in the quantitative results than in the qualitative responses. Further to this, while respondents may have good intentions of reuse, such as giving away to friends and family, or selling, the qualitative results showed these categories greatly reduced. It should be noted, however, that as this question asked respondents how and when they last disposed of e-waste, respondents who were currently storing e-waste and had not disposed of it in the past may not have responded to this question.
Regardless, the difference in these responses seems to clearly show a gap between intention (in the quantitative responses) and action (in the qualitative responses).
Again, utilising empirical metrics to analyse the qualitative data, of the 85 respondents who indicated a timeframe of when they last disposed of e-waste, 24.7% reported having disposed of e-waste within the last month, 45.9% within the last year, and 11.8% between 1 and 2 years. This means that of the 85 respondents who indicated a timeframe, 70 had disposed of some form of e-waste within the past 2 years (82.4%). This may indicate that significant amounts of e-waste are being disposed of in the Whangarei District.
A number of noteworthy comments emerged from this open-ended question which require further investigation, such as e-waste being “buried … in the paddock”, and issues raised by respondents relating to municipal e-waste recycling, particularly around concerns about the injustice of paying for recycling when they had witnessed e-waste being dumped in the landfill area of the transfer station.
Correlation equations were conducted between age, household makeup, income, general recycling behaviours, and historic e-waste disposal method (question 16). No correlation could be found in any case, once again indicating that demographic factors do not impact e-waste disposal methods in Whangarei.

3.4. E-Waste Management

To ascertain what might change the way a household manages (dispose of) their e-waste, respondents were asked to rate several statements to determine whether their household e-waste management behaviours would change if certain aspects of the current services/options available were changed. The results to this question are presented in Figure 7.
This led to further questions related to satisfaction with, and awareness of, the e-waste management services available in the community. Forty-five percent of respondents stated that they were unsatisfied with the services available, while 10% were not aware of any local services. Only 4% of respondents were satisfied with the available services. To further elaborate on household consumer awareness of services available to them locally, respondents were asked if they knew where the nearest municipal waste transfer station (a drop-off collection point for waste where the waste is sorted and distributed to recycling facilities or to landfill) was to their home, and if they had used it to dispose of e-waste. Sixteen percent of respondents were unaware of the location of their nearest transfer station; 84% were aware of the location of their nearest transfer station; and 44% had used it to dispose of e-waste.
The second set of questions in Part Four of the survey asked respondents questions about national e-waste management. The first of these asked respondents to rate the ‘overall effectiveness’ of the current national approach to dealing with e-waste in NZ: 57.2% of respondents rated the current approach as “poor” or “very bad” with a further 26.4% rating the current approach as “average”. Only 4.8% rated the current approach as “good” or “excellent” with a further 10.4% indicating they were unsure.
Question 21 asked respondents what, in their opinion, is the best approach for NZ to take when dealing with e-waste issues. Free public drop off was the overall preferred approach (70.8%), followed by the adoption of national e-waste recycling standards (52.4%). Overall, options that required some government intervention (i.e., adopting national e-waste recycling standards, banning e-waste from landfill, government intervention being required selected specifically, and compulsory registration and licensing of e-waste recyclers) rated highly across all results, while maintaining the status quo (i.e., user pays at drop-off, leaving e-waste recycling up to the free market, “status quo”, and maintaining a voluntary only approach) rated poorly.
When responding to the question relating to the best approach for e-waste management in NZ, survey respondents were asked to elaborate if they selected “Other” as an option. Here many inferred that some non-explicit form of MPS or extended producer responsibility (EPR) was necessary for NZ, some suggested other options for disposal, and others thought that education was important. Both the requirement of MPS or EPR [58] and the requirement for education [59] on both the impacts of e-waste and the availability of services were reflected in the international literature. Overall, the responses to this question indicated the respondents’ desire for change, and that this should be led by the local and central government, with producers taking further responsibility.
Respondents were asked specifically how much they would be willing to pay for user-friendly, quality-assured, environmentally-sound, healthy and safe e-waste recycling: 60.5% of respondents indicated that they would be willing to pay a fee of $1 to $10 (higher than the 40% identified in NZ-based research conducted in 2012 [21]); 21.4% were unwilling to pay anything; and 19% wanted to be paid for the ‘scrap’ value of their e-waste. Whangarei respondents that selected “Other” as an option, were again asked to elaborate. Some respondents felt payment for e-waste management was, or should be, part of the local council rates programme, and others felt that the charges or rebates should depend on the item being recycled. Further, some respondents elaborated on why they thought there should be no cost to recycle e-waste, such as arguing that producers should take more responsibility. Others felt they lacked the necessary knowledge to respond.
The final question of the survey asked respondents if they had any other comments they would like to make on e-waste management either in the Whangarei District or in NZ as a whole. Sixty-seven respondents took up the opportunity. The key themes that emerged from the open forum question are illustrated in Table 6.

4. Discussion

According to WDC figures, Whangarei households recycle 31.72 tonnes of e-waste through municipal services each year. However, this study predicts that this is barely 1.8% of the e-waste generated in the district each year. Barr et al. suggest there are several factors that may act as barriers to full engagement in appropriate waste disposal methods [48], including socio-demographics, recycling norms (normative behavior—societal behaviours that are agreed upon by society as correct i.e., socialnorms), pro-environmental values, and the disposal services available. This research found that socio-demographics, general recycling behaviours, and pro-environmental values did not have a significant impact on Whangarei household e-waste recycling behaviours. However, the structure of the services available, including provision and cost, did. The value-action gap [60], where there is a gap between the intention to behave in a pro-environmental manner and the actual behavior (see for example: Refs. [42,61]), was seen to exist in Whangarei. This is likely to be related, at least in part, to these barriers.
Further to these findings, feedback from survey respondents raised significant concerns about maintaining the status quo in relation to e-waste management in NZ. As a result of this research, it can be argued that a national MPS scheme (s) would improve the provision of, and engagement in, e-waste recycling services. In addition, it can be argued that NZ will be impacted and influenced by the global trend toward MPS for e-waste. This movement could bring a future of sustainable product design factors positively impacting the volumes and types of e-waste being generated [43,62], if it can be fully embraced.

4.1. Influences on E-Waste Behaviours

WDC reported formally recycling only 31.72 tonnes of e-waste in the last year. This is 1.8% of a possible 1743 tonnes of the estimated annual e-waste generated in the district. When asked to indicate how their household disposed of e-waste, 44–74% of residents reported recycling and reuse methods. And yet, these findings contradict the low figure presented by WDC. This range was ascertained when comparing the results to the question asking how households “intended” to dispose of their e-waste and the question asking how they had last disposed of their e-waste (i.e., “actual” behaviour), illustrating the value-action gap [60]. The survey results indicated that e-waste could be being disposed of by up to 82.4% of households over a 2-year period in the district (Note: This figure could indicate that 17.6% of residents are either storing e-waste in their homes or have not created any EOL EEE over the last 2 years). Even if the total e-waste generated in the district was calculated for only 82.4% of the population over a 2-year period, this still equates to approximately 718 tonnes of e-waste being disposed of in the district each year, which is significantly less than the volume being recycled. This amended figure would suggest that only 4.4% of this is appropriately recycled, almost 6% shy of Hoeveler’s 2008 estimation that 10% of e-waste is being recycled in New Zealand each year [36]. Regardless of whether the forecast of 1743 or 718 tonnes of e-waste generated in the district each year is used, the WDC-provided e-waste recycling data (Table 1) suggests that there is a significant amount of e-waste being inappropriately managed in Whangarei. This could result in detrimental environmental and health impacts. In as much as this scenario may be reflective of the national context, this points to significant national impacts which, left unaddressed, will serve to further undermine NZ’s international reputation in this sphere [3,5,63].
The international literature reviewed for this research indicated that various socio-demographic factors had an impact on household waste management, including general recycling and e-waste disposal methods. When these aspects were investigated in the Whangarei District, socio-demographic factors were not found to impact general recycling or e-waste recycling behaviours. However, research participants presented above average levels of income, education, and left-wing political views, and this over-representation of income and education level may have skewed the research findings as international research showed that these two demographic attributes can influence both e-waste disposal methods and reasons for e-waste disposal. For example, the literature suggests that higher income households can generate higher volumes of e-waste than lower income household, and that respondents with pro-environmental behaviours are more likely to engage in waste practices higher up the waste hierarchy. International literature also suggests that age and household size and make-up can affect disposal methods (see for example: Ref. [48]). These aspects were more closely represented in the survey sample and yet showed no significant impact on the disposal method.
Further, to socio-demographic factors, it is argued that general recycling behaviours impact e-waste recycling behaviours, with households that engage in general recycling behaviours being more likely to engage in e-waste recycling behaviour [41]. General household waste recycling could be considered normative behaviour in the Whangarei District. This may be due to the availability of weekly kerbside municipal recycling services in the district since 2003 [64]. The significant improvements in general household recycling infrastructure over the past 20 years in NZ [65] may have influenced the acceptance of recycling as normative behaviour [42]. This could explain the lack of significant relationships found between socio-demographic factors and general recycling in this research, nor between general recycling and e-waste recycling. Furthermore, most of the literature reviewed for this research that indicated connections between these factors was conducted over 10 years ago. If this research was repeated today, the results may significantly differ as notable changes in both waste management and awareness of the environmental issues surrounding waste, have occurred during this time. The adoption and acceptance of household recycling as normative behaviour, as indicated here, could suggest that if e-waste management services were improved, the e-waste recycling rates are likely to increase.
The Whangarei case study found that over 70% of survey respondents recognised that e-waste creates significant environmental and social problems, with the same number understanding the role of recycling in environmental protection. These figures indicate that Whangarei residents have high levels of environmental knowledge and understand the impacts of waste. This could have been influenced by the higher education level and left-wing political views reflected in the sample. Though when asked if their households should be blamed for environmental problems caused by excessive waste generation, the results were evenly spread on the five-point scale from “strongly agree” to “strongly disagree” (see Figure 1). These results indicate that there appears to be confusion as to who is to blame for waste creation: producers or consumers. On one side of this debate, producers are considered responsible for excessive waste generation due to, inter alia, planned obsolescence and excessive packaging. Others argue that consumers are responsible as they choose to purchase the (often cheap) goods that create excessive waste. In doing so, they encourage producers to keep producing these goods (for further discussion on this debate see: Refs. [66,67]). Some argue that this debate could be resolved by implementing EPR.
This study did not investigate reasons for purchasing EEE products; however, it is recommended that future research addresses this question as this could also shed light on what factors drive the generation of e-waste NZ, as could further targeted questioning as to the responsibility of waste creation. The uncertainty around who is responsible for waste generation could be due to the neoliberal approach to environmentalism which expects individuals to be accountable for their own (waste) footprint, commonly seen in the form of state-industry propaganda which aims to create a perception where environmental issues in relation to waste are solely the fault of careless or uninformed consumers (see: Refs. [68,69]).

4.2. E-Waste Services and Cost

The provision of effective, user-friendly, accessible, quality-assured services is vital to the success of any waste management and/or recycling programme [61], and awareness of these services, and the costs related, are considered to have a significant influence on appropriate e-waste disposal methods [42,61]. Awareness of the waste services available to households was generally high in the Whangarei District and respondents raised concerns about the quality of the services provided. Because of the cost to dispose of e-waste appropriately (end-of-life disassembly and recycling often incurs a cost in NZ, particularly CRT computer monitors and TVs which have a $26 drop-off recycling cost in the district [27]), residents must be confident in the services available. If, for example, residents are not confident that e-waste is recycled appropriately, they could choose to dispose of it inappropriately themselves or to store these items in their homes to avoid disposal costs.
Disposal costs are considered a barrier to engagement to appropriate e-waste management. While there were no statistics collected during this study to ascertain the specific impact of cost on recycling rates (another opportunity for future research in this field), it is known that cost influences fly-tipping rates (see Refs. [48,70]). Both the qualitative responses and the literature reviewed (see for example: Refs. [17,48,59]) imply that cost significantly influences recycling decisions. Furthermore, this research found 95.3% of respondents would change the way they manage e-waste if there was no cost associated, and 76.9% indicated they would change their behaviours if the cost was included at the time of purchase.
Many of the qualitative responses received via the survey indicated the main cause of dissatisfaction with the services available in Whangarei was the cost to recycle e-waste, with various suggestions given as to how this could be rectified. One solution offered was the provision of e-waste recycling coupons to householders via rates payment receipts, as many felt the cost of recycling was already covered in their local council rates, which it is not (Note: While local government rates do cover a waste disposal levy, the additional costs related to appropriate e-waste recycling are currently covered by a user-pays system as previously illustrated).
Several respondents felt that the cost to recycle e-waste (and waste disposal generally) was the primary cause of illegal dumping. Between 60 to 80 instances of fly-tipping are recorded in the district each month and this is likely to be influenced by waste disposal costs [48,70]. However, in a separate question, 60.5% of respondents indicated that they would be happy to pay a fee of between $1 and $10, and only 21.4% were unwilling to pay anything at all. This may suggest that it is the cost, and the timing of this cost, and not the requirement to pay for recycling per se, that is of concern.
The timing of the cost could be a factor in household engagement in recycling services. Some qualitative responses suggested that cost should not be applied at disposal, but at the time of purchase. This is known as advanced disposal fees (ADF), a common EPR approach. ADF can also be established so that it provide rebates on disposal, thus creating an additional incentive for engagement in appropriate e-waste recycling services.

4.3. Obsolescence and Its Impact on Volume

This research found obsolescence (including both planned and technological) to be a key factor in e-waste disposal in the Whangarei District. There were three main themes prevalent when investigating reasons for e-waste disposal, all of which related to poor product design and lack of repair-ability, functionality and usability. While the reasons for household disposal of EEE varied depending on the type of product, when asked why they might dispose of e-waste, the three top reasons across the e-waste categories were “high repair cost/cannot be repaired”, followed by “instability/malfunction during use”, and “no longer useful to me or my household” respectively. The first of these two reasons directly relates to product design and cost. Product design is a significant contributor to e-waste volumes, specifically where products are designed to break [66], and it is cheaper to buy a new item than to repair a broken one. One respondent specifically commented that they “couldn’t afford the stuff that doesn’t break”, indicating that a ‘disposable’ culture is significantly impacting e-waste volumes. Qualitative survey responses depicted consumers purchasing cheap EEE which they expect will have a short lifespan, rather than spending more money on better quality products, or paying for products to be repaired; these findings are supported in international research (for example see: Ref. [48]). Issues relating to the e-waste repair-ability and repair cost specifically affected small household appliances, which was to be expected. However, this also affected large household appliances, audiovisual equipment and lighting equipment. While this was expected for audiovisual and lighting equipment, it was not as expected for large household appliances, particularly due to the high cost involved in replacing these items.
Instability and malfunction during use was the second highest reason overall for households to dispose of e-waste. This response is closely linked to the first response as the instability/malfunction experienced could likely not be repaired. There are various reasons for instability or malfunction, including design factors and the end of a component’s life, such as internal motors, and batteries that cannot be removed/replaced [66,71], along with single-use items such as batteries and lightbulbs. Batteries and lighting equipment featured highly in this response by householders, with electronic tools also rating high here. “No longer useful to my household” was a response that was found to be most common for toys, leisure and sport equipment (TLSE). Information and communication technology (ICT) equipment, phones and handheld devices also rated highly in this category. While the question did not require elaboration on why an item may no longer be of use to a household, the TLSE category may be high in this category due to aging children where toys are no longer played with, unused sport and leisure equipment where households no longer participate in specific activities, and possible impulse purchases of these types of goods. To further clarify why EEE items are no longer useful to a household, targeted research would need to be conducted.
Phones, handheld devices and ICT equipment were commonly no longer useful to households for two reasons: the first that they had upgraded to a newer version for fashion/trend reasons and/or new features. One respondent offered an explanation for the second reason: “I have to upgrade electronics almost solely on the fact that they no longer function with current products, e.g., memory is no longer large enough to run current programs”. These memory issues appear to directly relate to Moore’s Law which refers to the ever-increasing capabilities of technological advances. (Note: Moore’s Law is based on Gordon Moore’s 1965 paper which estimated that the number of components on an integrated circuit chip would double each year. This was revisited in 1975 where Moore re-estimated these changes would occur every 2 years. This has been proven to be true with under 10,000 ‘on-chip transistor counts’ in the early 1970s to over 10,000,000,000 by 2015). These technological advances, and a lack of compatibility between devices and/or components, make products obsolete and therefore, no longer of any use. For example, analogue TVs became obsolete; they were replaced with digital transmission in NZ in 2011 and 2012.
Overall, aspects of obsolescence, such as those caused by design (built-in obsolescence), marketing and fashion trends, or the speed of technology advancement, was the main contributing factor to the disposal of e-waste in Whangarei District. These findings are reflected in the results of similar studies conducted internationally (for example see Refs. [43,66,71]).

4.4. Would Mandatory EPR Increase Recycling Rates?

The most successful internationally applied e-waste management tool is EPR. The EU has had EPR schemes in place for e-waste since 2003, and today it has some of the highest e-waste recycling rates in the world [3,5]. EPR schemes have many benefits, not only impacting end-of-life phases of the product lifecycle, but also the design phase. The responsibility EPR puts on producers influences the reduction of both built-in obsolescence and the production of poor-quality goods, as producers move toward a circular economy [67] and modular design. Global EPR for all consumer products would ensure that low standard recycling was no longer a concern for waste streams such as e-waste, and the habitual recycling of many more waste streams would become the social norm, as producers become more reliant on recycled goods (re-)entering the resource stream and ensure waste material is entering this resource cycle. The better use of resources is an aspect of the circular economy movement which has been growing significantly in recent years, particularly in relation to climate change [21,72,73,74]. Currently, the NZ central government does not support mandatory product stewardship, where the circular economy model could be adopted, and the first step on the way to full EPR (see Figure 8) however, it is possible within its policy framework.
Of the e-waste that is generated in the Whangarei District each year, this study estimates that only 1.8% of the possible e-waste generated in the district is recycled via the municipal e-waste recycling services. While there may be other e-waste recycling opportunities available in the district for which data is unavailable, it is unlikely that these are high-quality services that follow any environmental guidelines, such as the Australian/New Zealand recognised minimum standard AS/NZS5377:2013 Collection, storage, transport and treatment of end-of-life electrical and electronic equipment. Low levels of recycled material affect economies of scale, which in turn can affect the recycling services that are made available. Increased recycling rates increase the demand for high-quality recycling processes. The increased availability of quality recycled material gives producers the opportunity to include higher rate of recycled material in their products over virgin materials.
When Whangarei householders were asked their opinion on how e-waste is managed in NZ currently, only 4.8% of respondents felt that the current national approach to e-waste management was either ‘good’ or ‘excellent’, a 2.7% improvement on a NZ wide survey conducted in 2012 that asked the same question [21], and over 57% rated current approaches as ‘poor’ or ‘very bad’. While these results do not elaborate on what respondents are not satisfied with, they did indicate that the status quo was unacceptable and that government intervention, including EPR, was required. Further, almost all of the themes from the final open-ended question of the survey pointed towards issues and concerns that could be solved by EPR (see Table 6). The initial findings relating to the dissatisfaction with maintaining the status quo in NZ present an opportunity to define, through further research, what aspects of MPS or EPR householders would like to see introduced, and specifically what prevents them from engaging in the current voluntary-only approach. However, this research should be conducted nationwide, as EPR intervention, including MPS, can only be accredited at the national level under the WMA [19]. Therefore, significant improvements in district management practices depend heavily on national incentives, initiatives, policy, and legislation (see Figure 8).
The 1.8% recycling rate in the Whangarei District is a stark indication that the current national voluntary product stewardship approach is failing. Countries that have embraced EPR principles see much higher rates of appropriate e-waste management [3,76], including countries with similar demographics to New Zealand such as Australia [3,76]. Of the 38 nations identified in the 2014 Global E-waste Monitor [5] as having official e-waste takeback systems, only eight collected less than 20% of the e-waste generated annually and only one reported collecting less than 10% [3]. This would imply that MPS is required to increase citizen engagement in appropriate e-waste management systems in NZ and to allow citizens to align their pro-environmental values with pro-environmental actions.

5. Conclusions

The Whangarei case study concluded that the main barrier to engagement in available recycling services was the cost associated with appropriate disposal, which is similar to international findings [48,59,77]. This was followed by the lack of knowledge of the services available to residents, which was also found internationally [42,61]. Further, the research found that while Whangarei households reported the intention to recycle an average of 26.9% of their e-waste, only 1.8% was actually recycled by municipal recycling services in 2017. Thus, while Whangarei householders surveyed intended to recycle their e-waste, the cost and limitations of municipal e-recycling services meant they were unable to enact their environmental ethic. This point illustrates the value-action gap [60], where the pro-environmental value (such as the intention to recycle e-waste) does not translate into action due to various barriers, in this case, predominantly cost and knowledge. This also resonates with the limits of ecological citizenship (the idea the humans are part of a larger ecosystem and that the future depends on individuals behaving in a manner that has a positive impact on the natural environment) in relation to responsible waste disposal [78], highlighting the point that appropriate e-waste management is bigger than just individual consumer responsibility. Further, mirroring international e-waste case studies, product obsolescence (planned [66,71] and technological [1,2,43]) was reported as the main contributor to e-waste creation in the district, and 57.2% of Whangarei householders exhibited dissatisfaction with the current state of e-waste management in NZ, with many demanding extended producer responsibilities.
This research provided first time insights into the behaviours, attitudes and opinions of Whangarei households in relation to e-waste and thus how e-waste is managed in by Whangarei residents. The study also provides a social baseline for future e-waste research in the district and for comparison with other NZ districts. In addition to informing NZ-based policy and e-waste management requirements, the findings could be used to inform international research looking for insight into similar issues, such as the success of voluntary product stewardship schemes. The two main contributing factors to the low recycling rate identified in the study, cost and knowledge, could be avoided with a nationwide mandatory e-waste product stewardship scheme, as these barriers to engagement in e-waste services would be reduced, if not completely removed at the point of EOL drop-off, within a mandatory scheme.

Author Contributions

Conceptualization (V.B., T.F.); Data curation (V.B.); Formal analysis (V.B.); Methodology, (V.B., T.F.); Supervision, (T.F., J.H.); Writing–original draft (V.B); Writing–review & editing, (T.F., J.H.).

Funding

This research received no external funding.

Conflicts of Interest

The authors declare no conflict of interest.

Appendix A

Online survey questions
Question(s)
PART ONE: DEMOGRAPHICS
1. Which area of Whangarei do you live in?
2. Which age group do you fit into?
3. Are you: male/female/other
4. Which ethnic group(s) do you belong to?
5. Who lives in your household?
6. What is your highest completed qualification? (e.g., trade certificate, bachelor’s degree, etc.)
7. What is your household income?
8. Which political party do you support?
PART TWO: GENERAL RECYCLING BEHAVIOURS
9. How often do you recycle the following household waste items?
(Glass, Plastic, Metal, Aluminium, Paper, Cardboard)
PART TWO: ENVIRONMENTAL BELIEFS
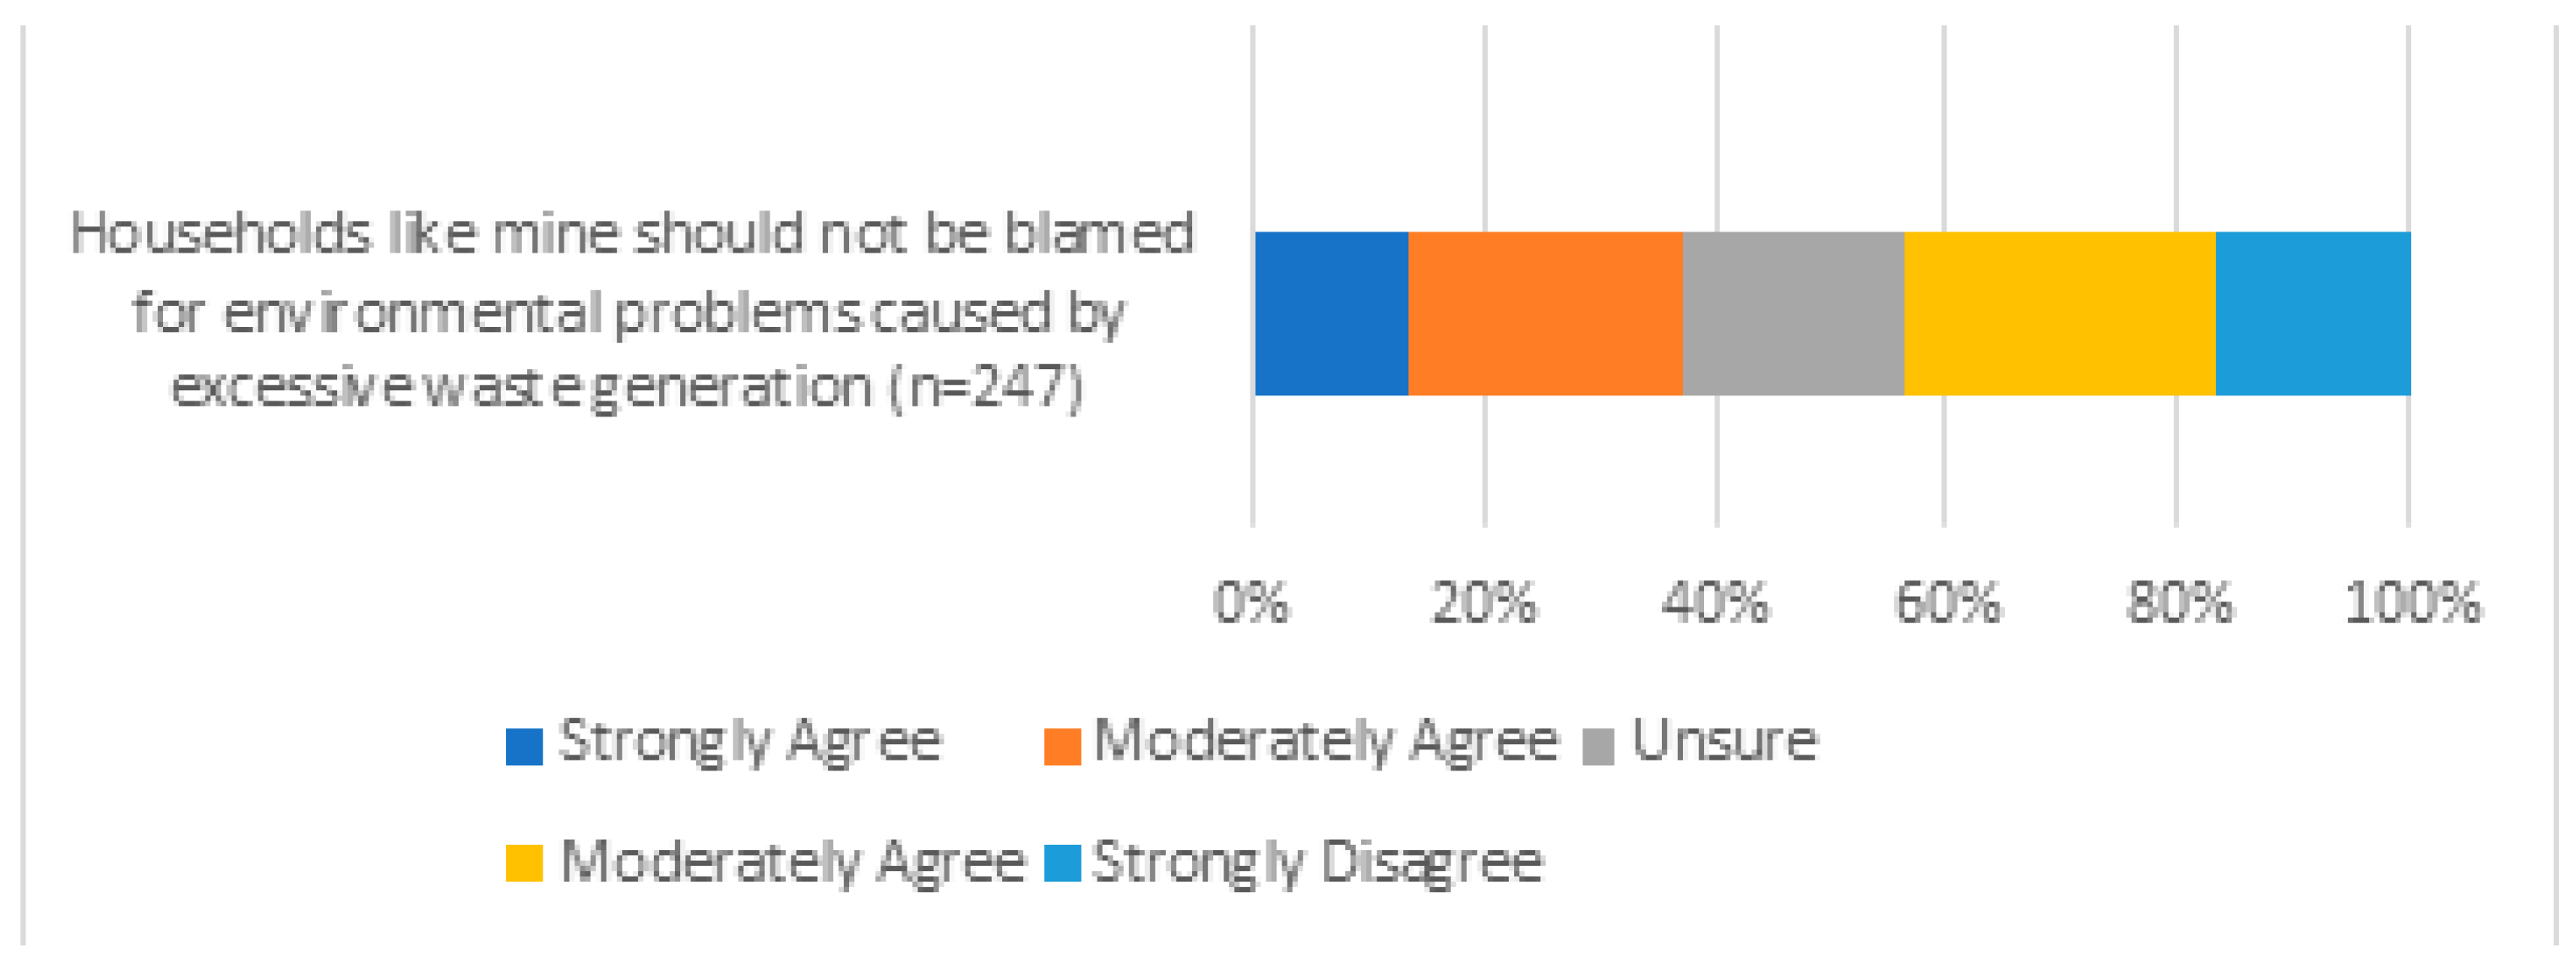
10. Please rate whether you agree with the following statements relating to household waste management.
(Recycling substantially reduces the use of landfills; Recycling conserves natural resources; Recycling will not make much difference to the quality of the environment; Recycling creates jobs; Households like mine should not be blamed for environmental problems caused by excessive waste generation; Given increasing environmental problems with waste, I feel a moral obligation to recycle; E-waste creates significant environmental and social problems; Storing electronic equipment at the end of its useful life has a significant environmental impact).
PART THREE: E-WASTE BEHAVIOURS
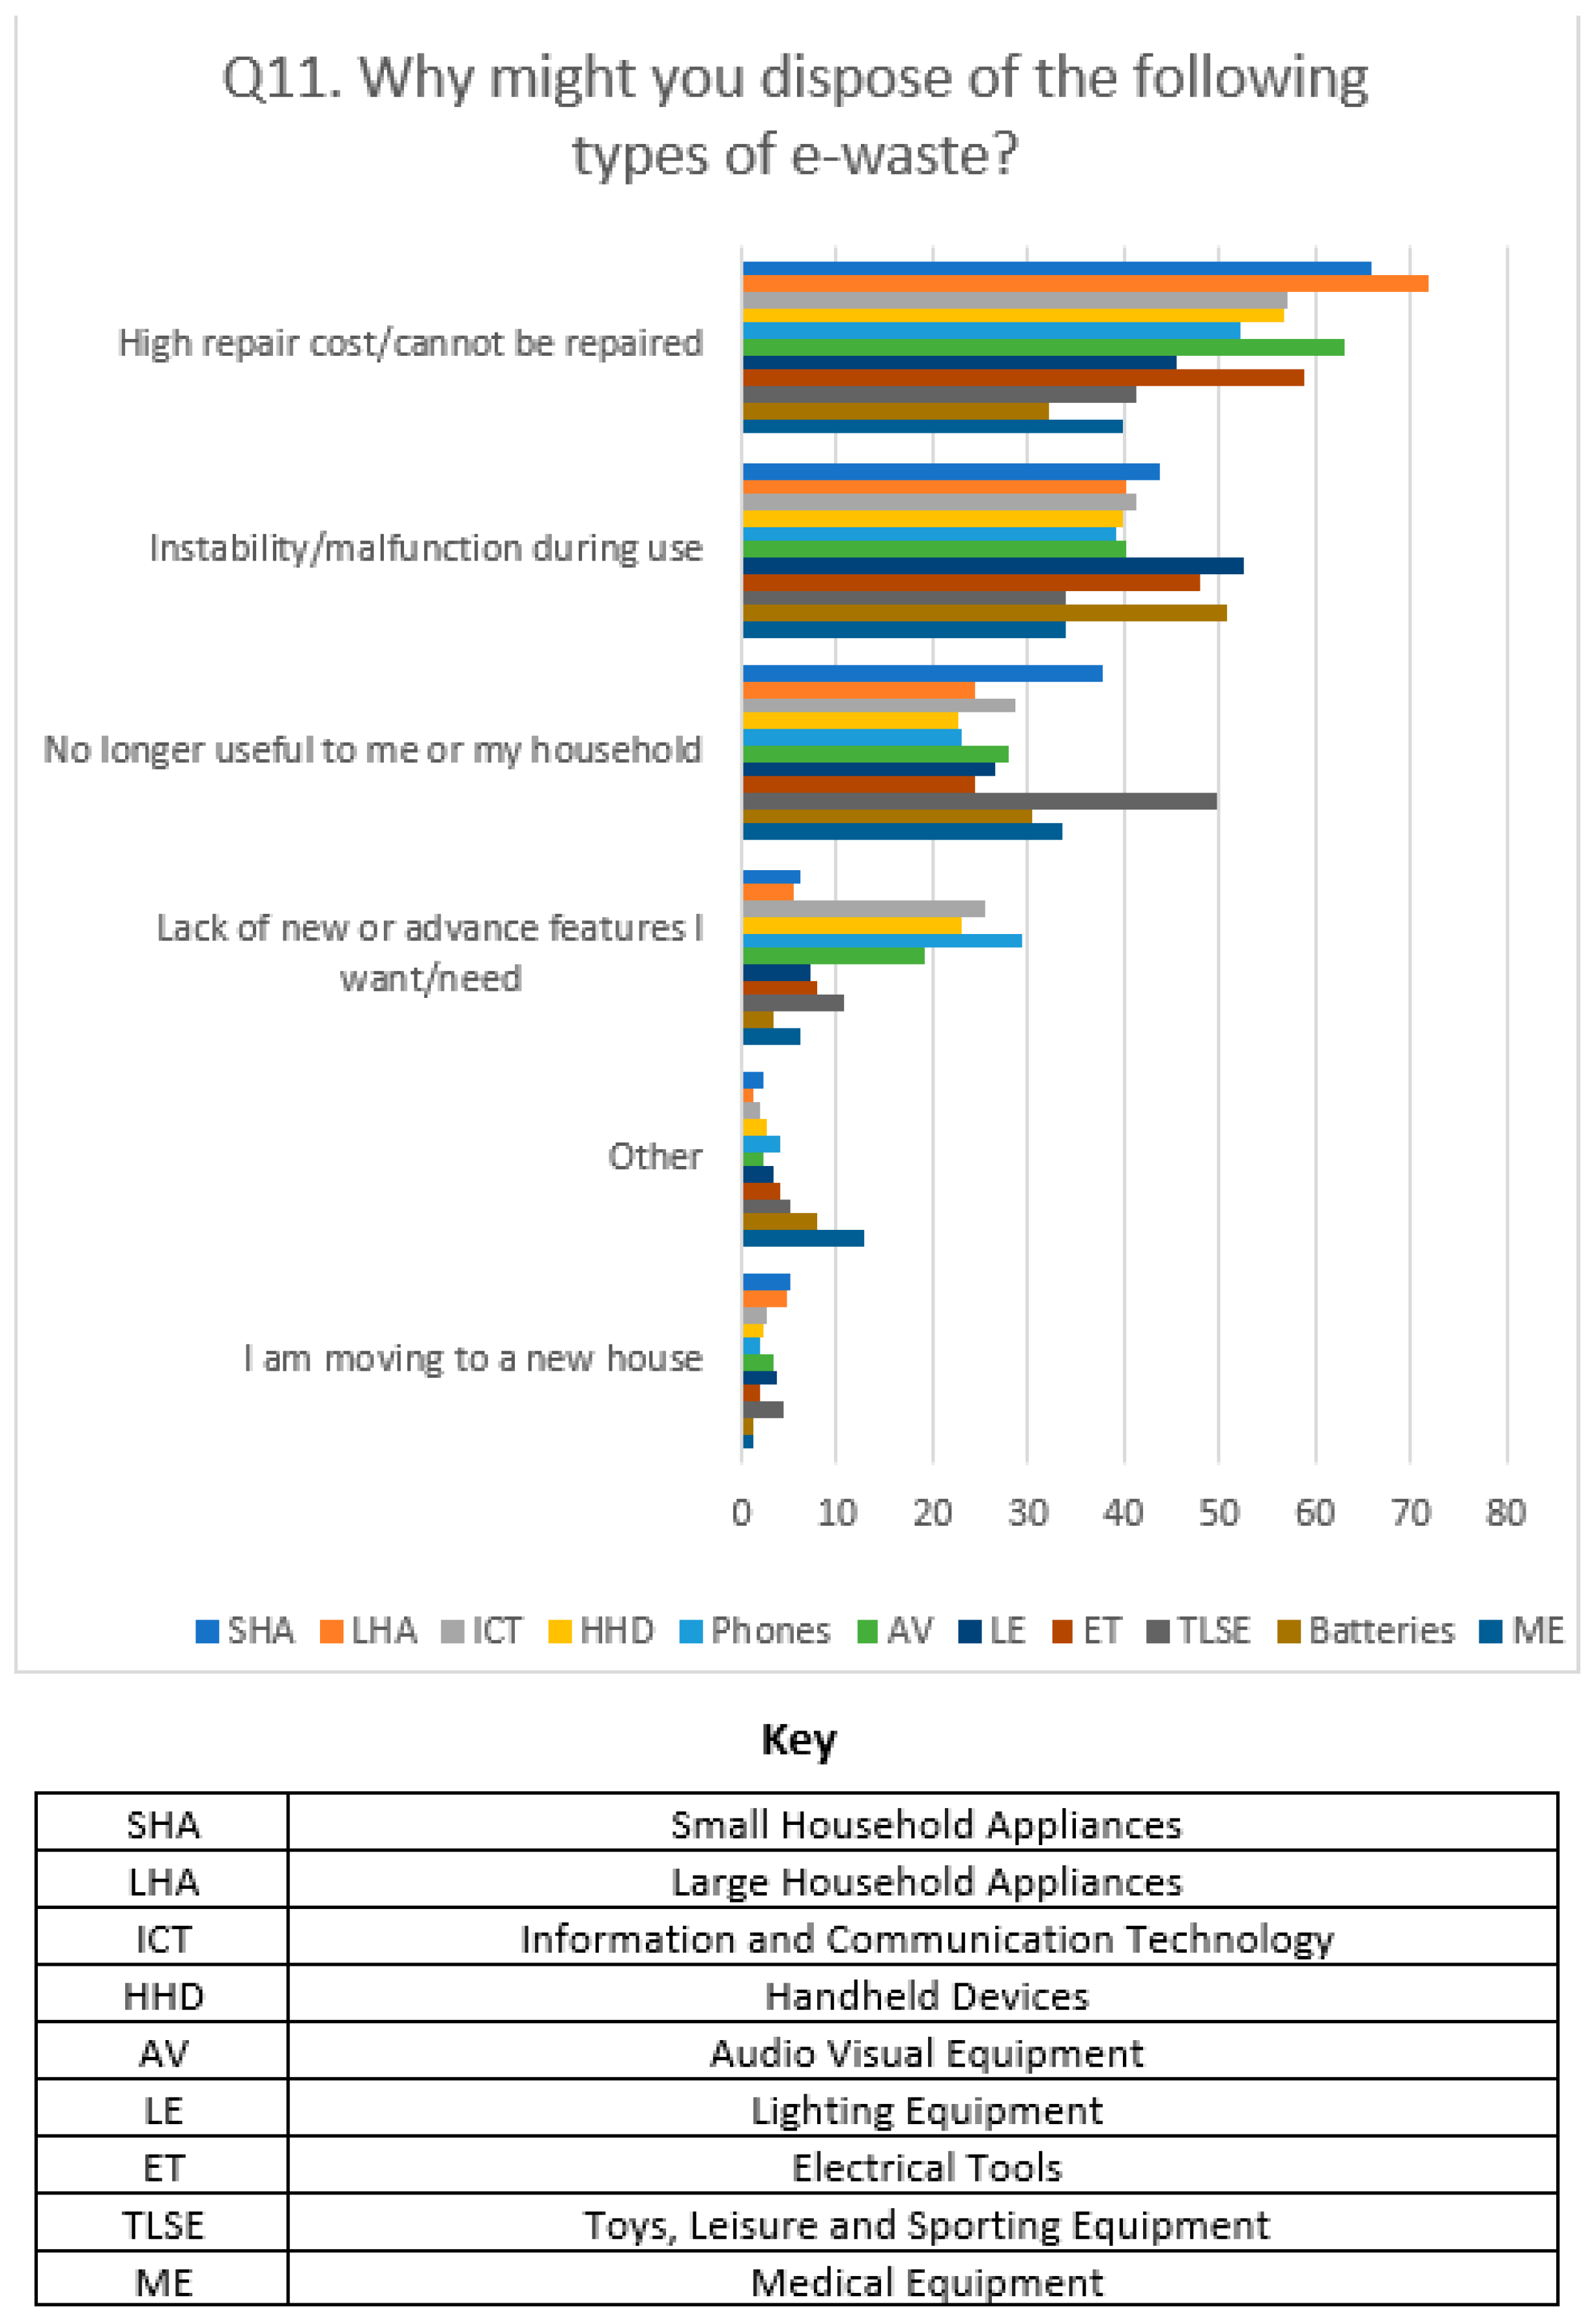
11. Why might you dispose of the following types of e-waste?
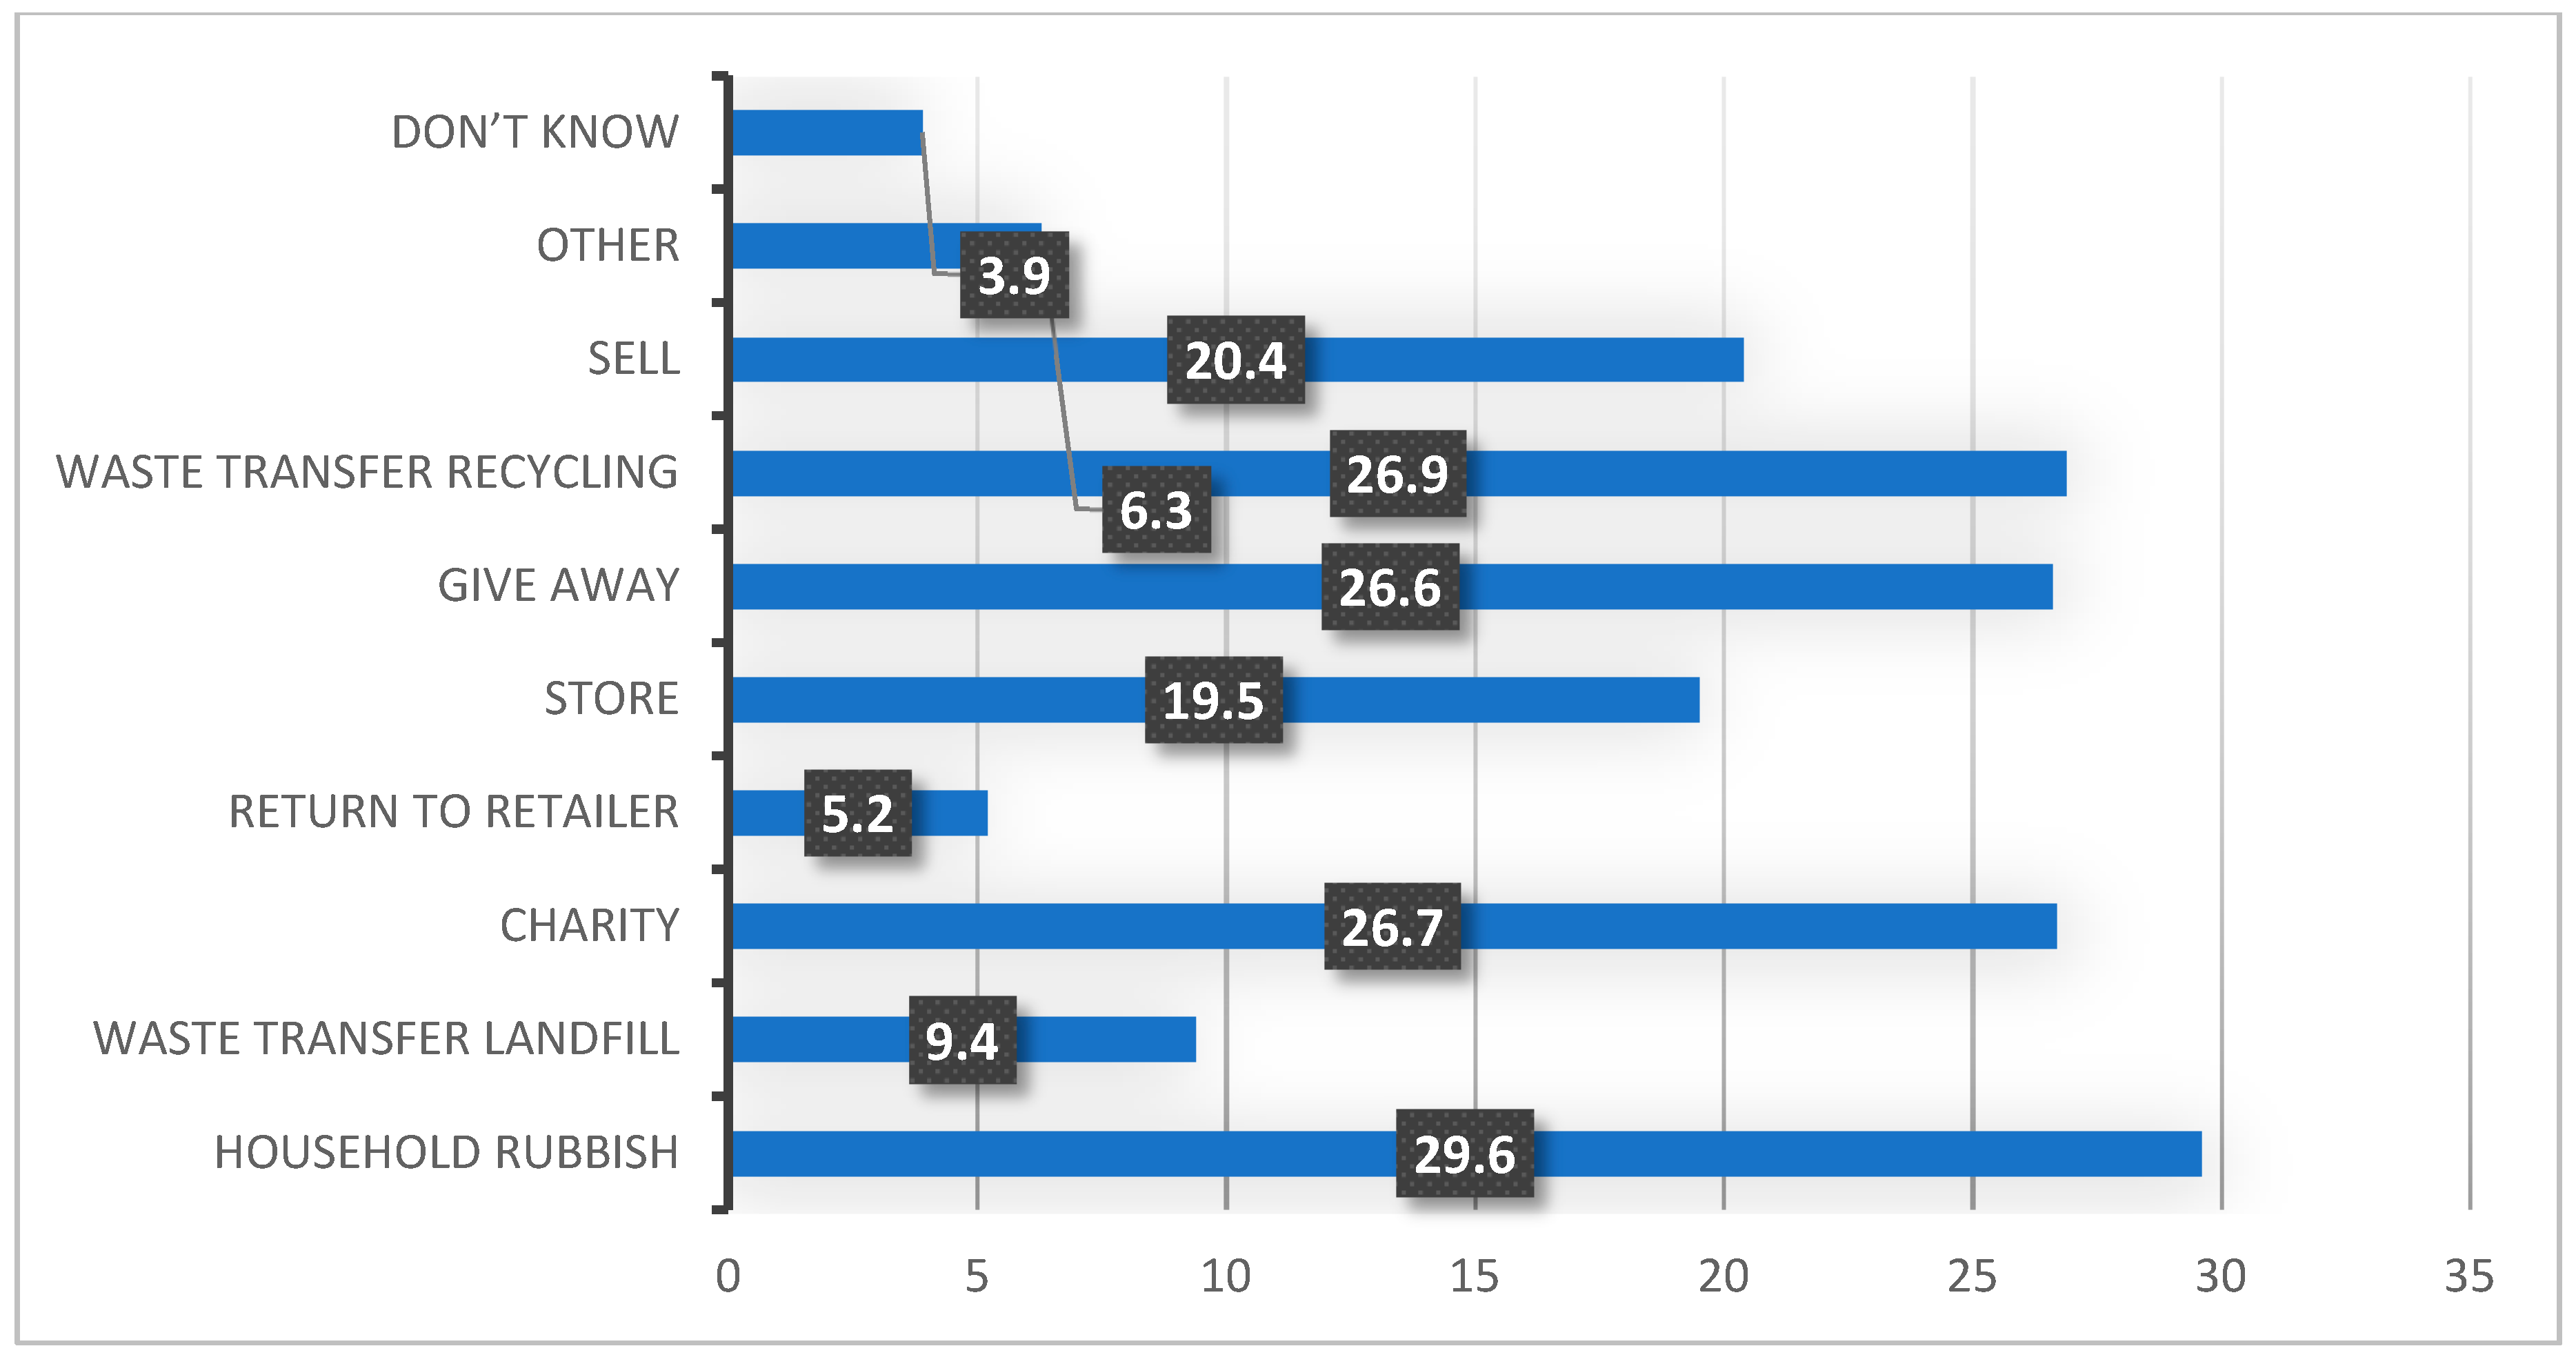
12. How do you currently dispose of [11 WEEE categories of e-waste] in your household?
13. If you stated that your household stores e-waste on the previous page, please indicate what type of e-waste you currently have in storage, and how many items.
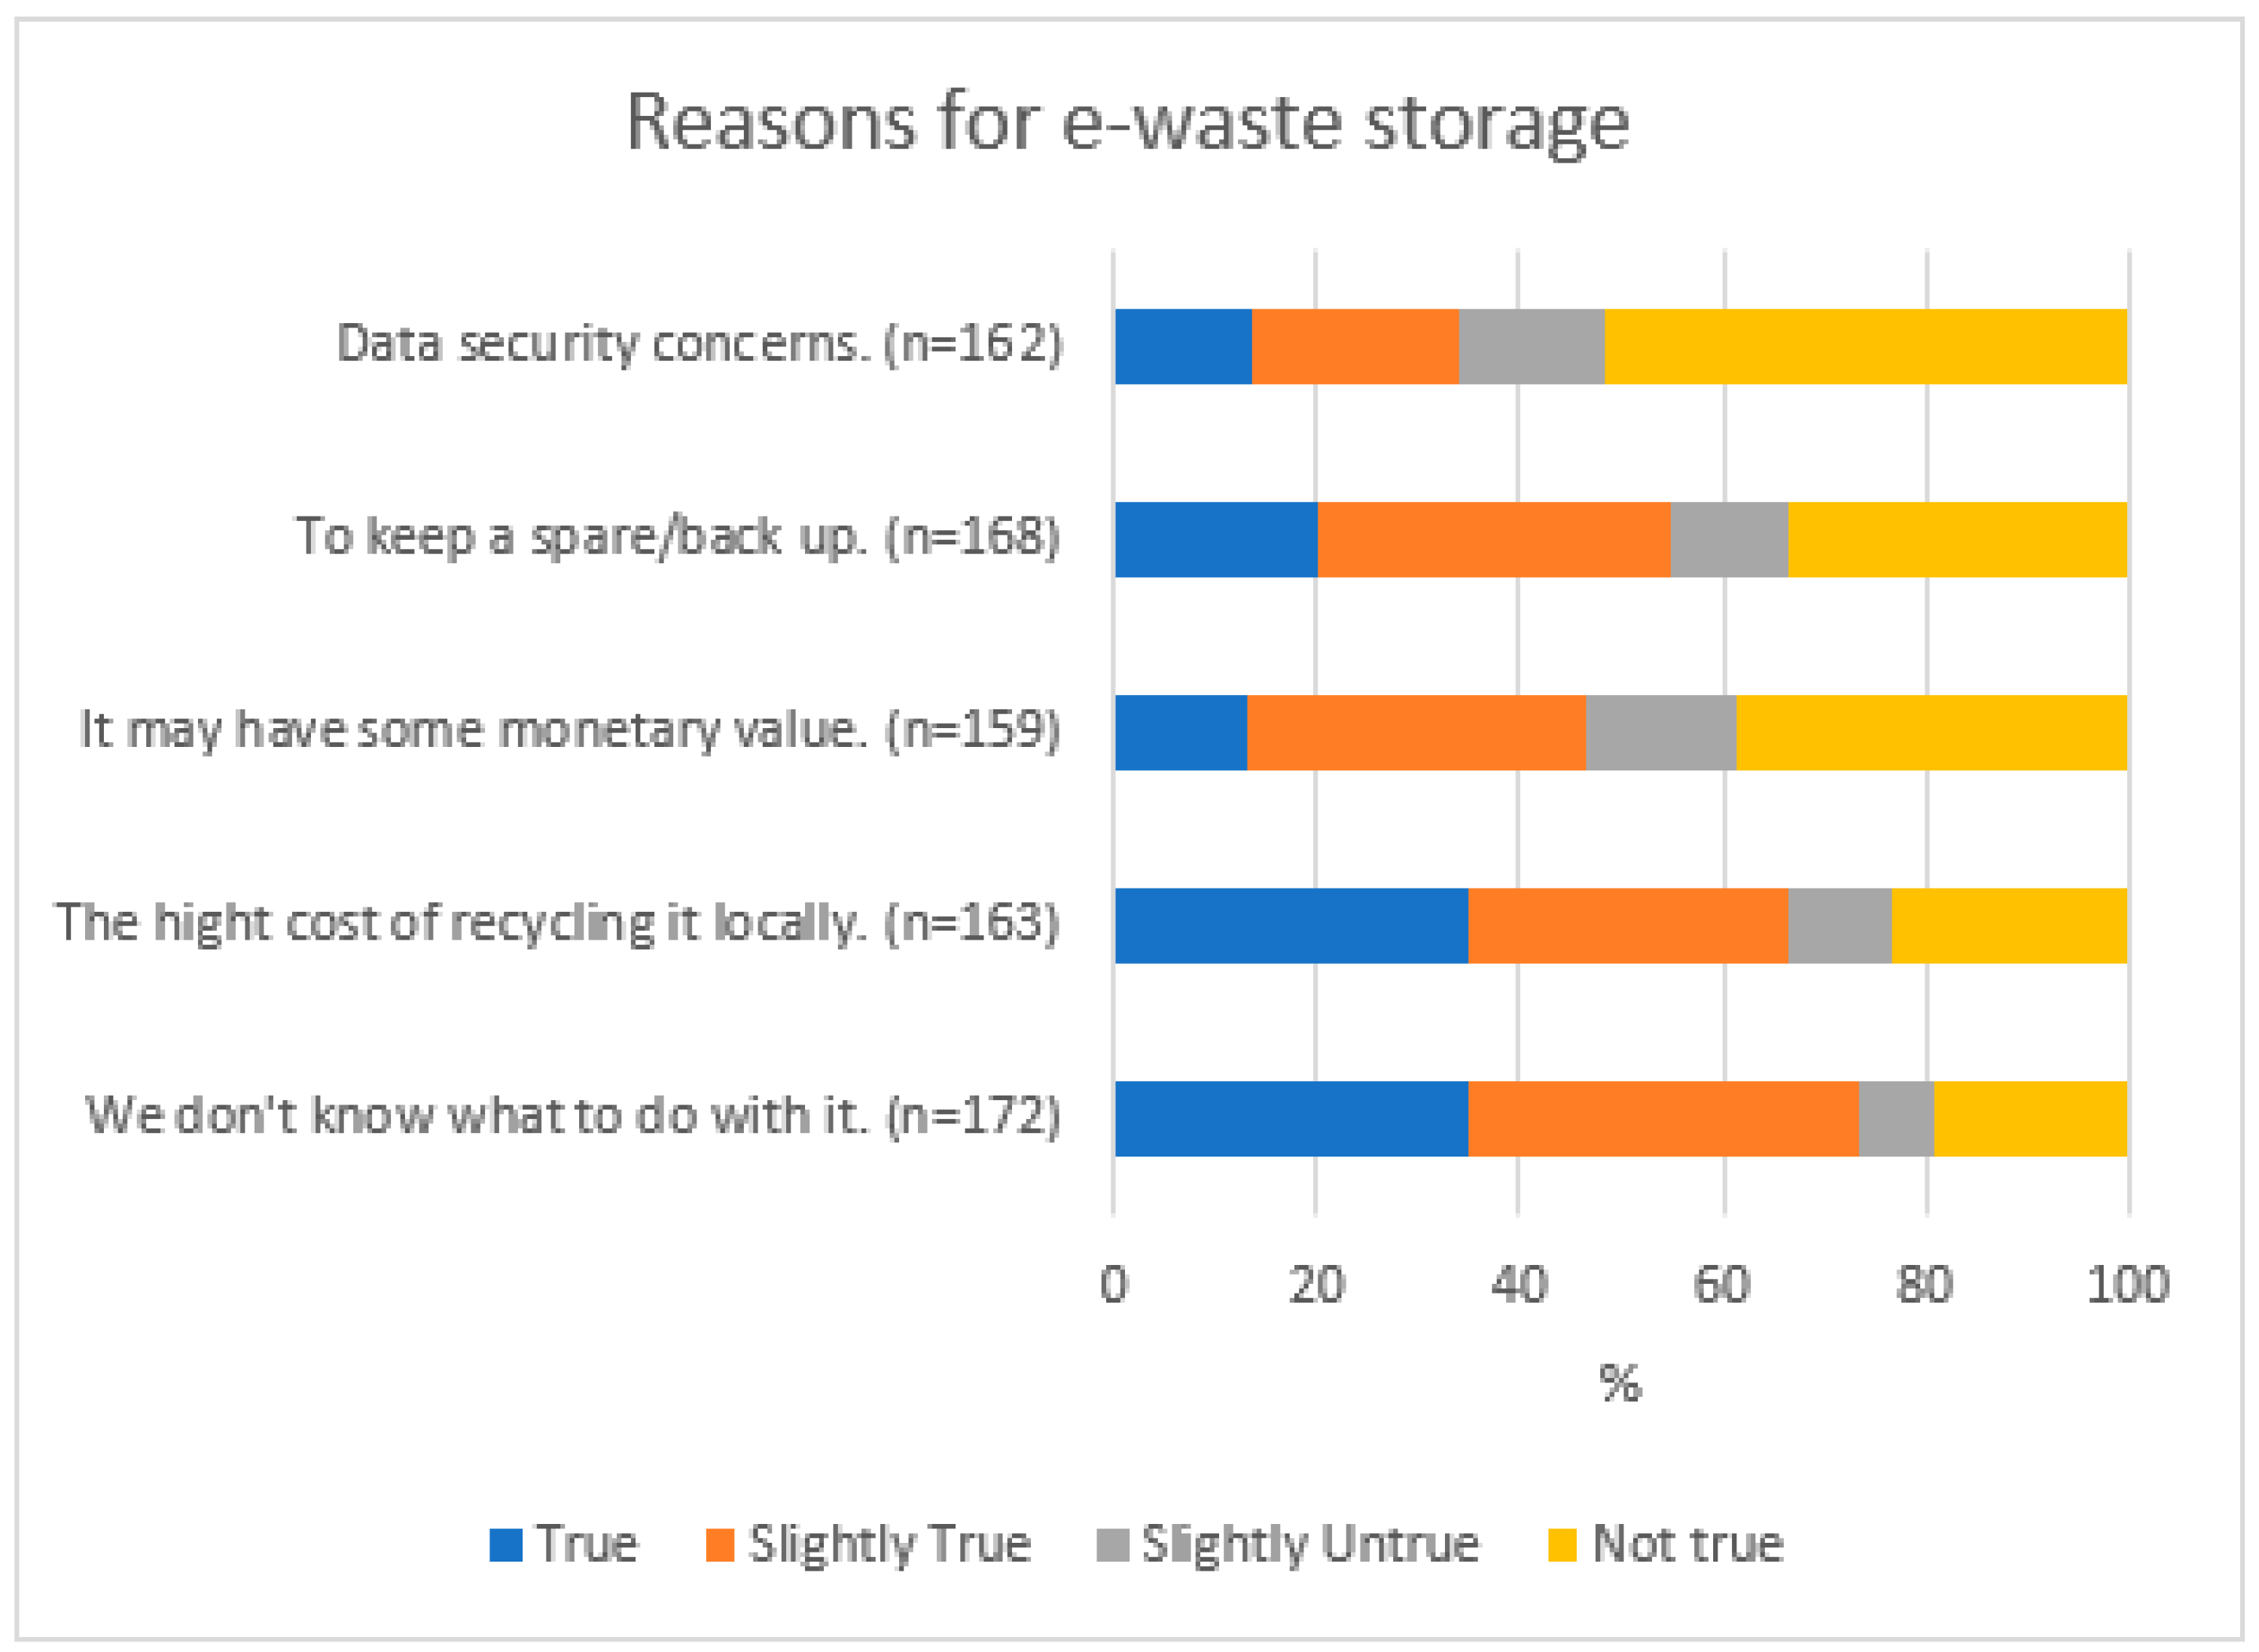
14. If you stated that your household stores e-waste, please rate the following statements for your household.
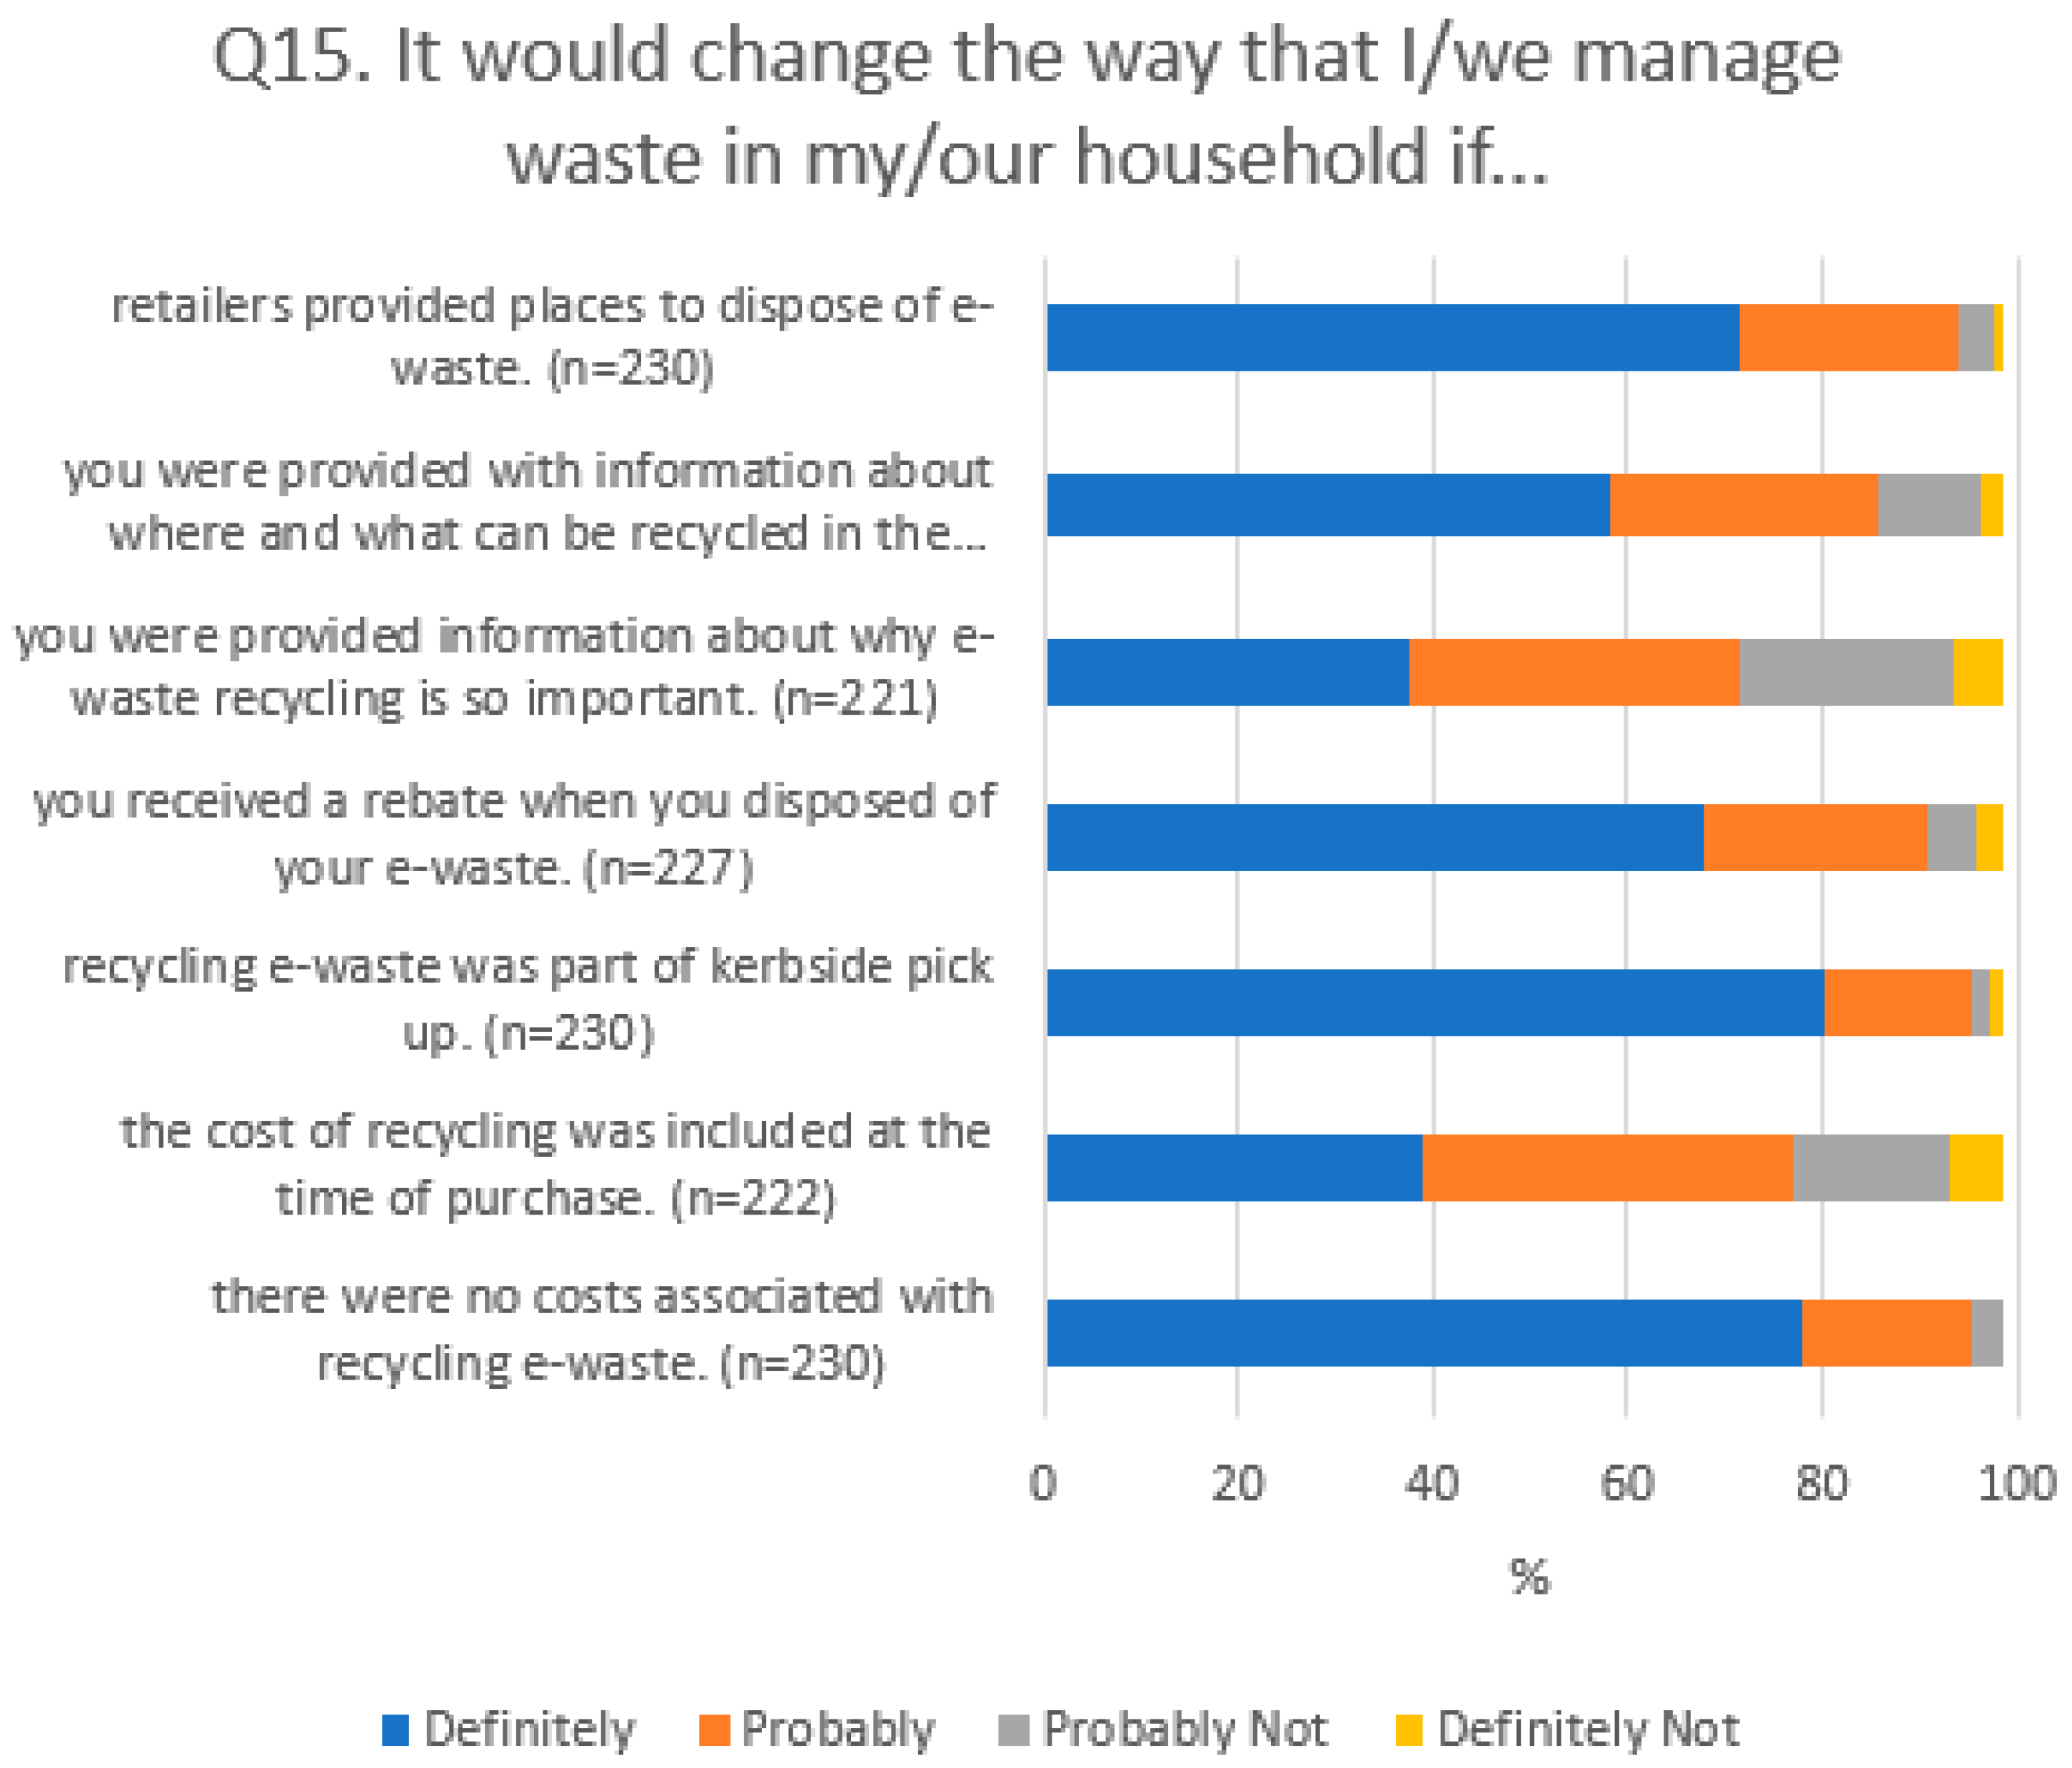
15. I would change the way that I/we manage e-waste in my/our household if...
16. When was the last time you disposed of e-waste? And how did you do it?
PART FOUR: E-WASTE MANAGEMENT
17. Are you satisfied with the effectiveness of e-waste recycling services available in your community?
18. Do you know where the nearest waste transfer station is to your home? And have you used it to dispose of e-waste?
19. If consumers are expected to pay for user friendly, quality assured, environmentally sound, healthy and safe e-waste recycling, how much would you be willing to pay?
20. How would you rate the ‘overall effectiveness’ of the current approach in dealing with e-waste in New Zealand as a whole?
21. In your opinion, what is the best approach for New Zealand in dealing with e-waste issues?

References

  1. Jaiswal, A.; Samuel, C.; Patel, B.S.; Kumar, M. Go green with WEEE: Eco-friendly approach for handling e-waste. Procedia Comput. Sci. 2015, 46, 1317–1324. [Google Scholar] [CrossRef]
  2. Kiddee, P.; Naidu, R.; Wong, M.H. Electronic waste management approaches: An overview. Waste Manag. 2013, 33, 1237–1250. [Google Scholar] [CrossRef] [PubMed]
  3. Baldé, C.P.; Forti, V.; Gray, V.; Kuehr, R.; Stegmann, P. Quantities, Flows, and Resources the Global E-Waste Monitor 2017; United Nations University: Tokyo, Japan, 2017; Available online: https://www.itu.int/en/ITU-D/Climate-Change/Documents/GEM%202017/Global-E-waste%20Monitor%202017%20.pdf (accessed on 27 May 2019).
  4. Cucchiella, F.; D’Adamo, I.; Lenny Koh, S.C.; Rosa, P. Recycling of WEEEs: An economic assessment of present and future e-waste streams. Renew. Sustain. Energy Rev. 2015, 51, 263–272. [Google Scholar] [CrossRef] [Green Version]
  5. Baldé, C.P.; Wang, F.; Kuehr, R.; Huisman, J. The Global E-Waste Monitor 2014; United Nations University: Bonn, Germany, 2015. [Google Scholar]
  6. Marvropoloulos, A.; Newman, D. Wasted Health: The Tragic Case of Dumpsites; ISWA: Vienna, Austria, 2015; Available online: https://www.iswa.org/fileadmin/galleries/Task_Forces/THE_TRAGIC_CASE_OF_DUMPSITES.pdf (accessed on 27 May 2019).
  7. Robinson, B.H. E-waste: An assessment of global production and environmental impacts. Sci. Total Environ. 2009, 408, 183–191. [Google Scholar] [CrossRef]
  8. Wilson, D.C.; Rodic, L.; Modak, P.; Soos, R.; Carpintero, A.; Velis, C.; Iyer, M.; Simonett, O. Global Waste Management Outlook: Summary For Decision-Makers; ISWA and UNEP: Vienna, Austria, 2015. [Google Scholar]
  9. Ministry for the Environment. Briefing to the Incoming Minister for the Environment: ‘Environment Portfolio’; Ministry for the Environment: Wellington, New Zealand, 2017. Available online: https://www.mfe.govt.nz/sites/default/files/media/final-bim-release-environment-portfolio-dec-2017.pdf (accessed on 27 May 2019).
  10. Ministry for the Environment. Review of the Effectiveness of the Waste Disposal Levy 2017; Ministry for the Environment: Wellington, New Zealand, 2017. Available online: http://www.mfe.govt.nz/sites/default/files/media/Waste/Review-of-the-effectiveness-of-the-waste-disposal-levy-2017.pdf (accessed on 27 May 2019).
  11. SLR Consulting NZ Limited. E-Waste Product Stewardship Framework for New Zealand Final Report; Ministry for the Environment: Wellington, New Zealand, 2015. Available online: http://www.mfe.govt.nz/sites/default/files/media/Waste/e-waste-product-stewardship-framework.pdf (accessed on 27 May 2019).
  12. Population—Stats NZ. Available online: https://www.stats.govt.nz/topics/population (accessed on 20 March 2019).
  13. Gertsakis, J.; Hannon, J.; MacGibbon, J.; Nixon, C.; Tripathi, N.; Wilkinson, S.; Zwimpfer, L. e-Waste in New Zealand: Five Years on; Ministry for the Environment: Wellington, New Zealand, 2012. Available online: http://www.eday.org.nz/template/ewaste_in_nz_2011_final2.pdf (accessed on 27 May 2019).
  14. MacGibbon, J.; Zwimpfer, L. e-Waste in New Zealand: Taking Responsiblity for End of Life Computers and TVs; Ministry for the Environment: Wellington, New Zealand, 2006. Available online: http://www.eday.org.nz/template/e-waste_in_nz_report_final_050706_medium_res.pdf + (accessed on 27 May 2019).
  15. Nixon, C. The Economics of e-Waste: Evaluation of Regulatory Options; NZIER & eDay NZ Trust: Wellington, New Zealand, 2011. [Google Scholar]
  16. Ministry for the Environment. Waste Minimisation in New Zealand: Summary of Submissions; Ministry for the Environment: Wellington, New Zealand, 2010. Available online: http://www.mfe.govt.nz/publications/waste/waste-minimisation-summary-submissions/index.html (accessed on 27 May 2019).
  17. Ministry for the Environment. Priority Waste Streams for Product Stewardship Intervention: Summary of Submissions; Ministry for the Environment: Wellington, New Zealand, 2015. Available online: http://www.mfe.govt.nz/publications/waste/priority-waste-streams-product-stewardship-intervention-summary-submissions (accessed on 27 May 2019).
  18. Kaye-Blake, B.; Nixon, C.; Byett, A.; Cocks, J. Willingness to Pay for Six End-Of-Life Products: NZIER Report to Ministry for the Environment; Ministry for the Environment: Wellington, New Zealand, 2013. Available online: http://www.mfe.govt.nz/sites/default/files/media/Waste/willingness-to-pay-final.pdf (accessed on 27 May 2019).
  19. Parliament of New Zealand. Waste Minimisation Act 2008, (January), 51. Available online: http://www.legislation.govt.nz/act/public/2008/0089/latest/DLM999802.html (accessed on 27 May 2019).
  20. Farrelly, T.; Tucker, C. Action research and residential waste minimisation in Palmerston North, New Zealand. Resour. Conserv. Recycl. 2014, 91, 11–26. [Google Scholar] [CrossRef]
  21. Hannon, J. A Multi-Stakeholder Examination of Ewaste Issues and Opportunities in New Zealand; Massey University: Palmerston North, New Zealand, 2014; unpublished manuscript. [Google Scholar]
  22. Mobile Phone Appeal. Available online: https://www.starship.org.nz/foundation/fundraising/mobile-phone-appeal/ (accessed on 12 May 2019).
  23. Re:Mobile—Mobile Phone Recycling Programme. Available online: http://www.remobile.org.nz/ (accessed on 12 May 2019).
  24. Mobile Trade-In. Available online: https://www.spark.co.nz/help/other/terms/retired-terms/tradeintradeuptermsandconditions/ (accessed on 18 May 2019).
  25. Vodafone Trade-In. Available online: http://tradein.vodafone.co.nz/ (accessed on 18 May 2019).
  26. Trade-In Terms and Conditions. Available online: https://www.2degreesmobile.co.nz/termsofuse/mobile/extra-services/trade-in-terms-and-conditions/ (accessed on 18 May 2019).
  27. Rubbish—Whangarei District Council. Available online: http://www.wdc.govt.nz/WaterandWaste/Rubbish/Pages/default.aspx (accessed on 20 March 2019).
  28. Sustainability. Available online: https://www.fisherpaykel.com/nz/company/sustainability.html (accessed on 19 May 2019).
  29. New Zealand among Most Wasteful Countries in Developed World—World Bank. Available online: https://www.newshub.co.nz/home/new-zealand/2018/01/new-zealand-among-most-wasteful-countries-in-developed-world-world-bank.html (accessed on 18 May 2019).
  30. International Environmental Agreements. Available online: http://www.mfe.govt.nz/more/international-environmental-agreements (accessed on 12 May 2019).
  31. New Zealand Product Stewardship Council. Available online: https://www.nzpsc.nz/ (accessed on 19 May 2019).
  32. Ministry for the Environment. Waste Minimisation in New Zealand: A Discussion Document from the Ministry for the Environment; Ministry for the Environment: Wellington, New Zealand, 2009. Available online: http://www.mfe.govt.nz/sites/default/files/waste-minimisation-discussion-document.pdf (accessed on 27 May 2019).
  33. OECD Environmental Performance Reviews: New Zealand 2017. Available online: https://www.oecd.org/newzealand/oecd-environmental-performance-reviews-new-zealand-2017-9789264268203-en.htm (accessed on 12 May 2019).
  34. Speech to Green Party 2018 AGM—Eugenie Sage, Associate Environment Minister. Available online: https://www.greens.org.nz/news/speech/speech-green-party-2018-agm-eugenie-sage-associate-environment-minister (accessed on 12 May 2019).
  35. Computer Access NZ Trust (CANZ). Available online: http://www.canz.org.nz/ (accessed on 27 May 2019).
  36. Hoeveler, J.-A. International approaches to dealing with electronic waste. N. Z. J. Environ. Law 2009, 13, 117–160. [Google Scholar]
  37. TV Takeback WasteMINZ Presentation. Available online: https://www.wasteminz.org.nz/wp-content/uploads/TV-TakeBack.pdf (accessed on 12 May 2019).
  38. $1m for Electronic Waste Scheme. Available online: http://www.radionz.co.nz/news/national/82225/$1m-for-electronic-waste-scheme (accessed on 12 May 2019).
  39. Whangarei District Council. Demographic profile of the Whangarei District. 2013. Available online: http://www.wdc.govt.nz/PlansPoliciesandBylaws/Plans/SustainableFutures/Documents/Sustainable Society and Culture/Demographic-Profile-of-the-Whangarei-District.pdf (accessed on 27 May 2019).
  40. Darby, L.; Obara, L. Household recycling behaviour and attitudes towards the disposal of small electrical and electronic equipment. Resour. Conserv. Recycl. 2005, 44, 17–35. [Google Scholar] [CrossRef]
  41. Dwivedy, M.; Mittal, R.K. Willingness of residents to participate in e-waste recycling in India. Environ. Dev. 2013, 6, 48–68. [Google Scholar] [CrossRef]
  42. Barr, S.; Ford, N.J.; Gilg, A.W. Attitudes towards recycling household waste in Exeter, Devon: Quantitative and qualitative approaches. Local Environ. 2003, 8, 407–421. [Google Scholar] [CrossRef]
  43. Ansari, N.L.; Ashraf, M.; Malik, B.T.; Grunfeld, H. Green IT awareness and practices: Results from a field study on mobile phone related e-waste in Bangladesh. In Proceedings of the International Symposium on Technology and Society, Wollongong, Australia, 7–9 June 2010; Available online: https://www.researchgate.net/publication/224158109_Green_IT_awareness_and_practices_Results_from_a_field_study_on_mobile_phone_related_e-waste_in_Bangladesh (accessed on 27 May 2019).
  44. Nixon, H.; Saphores, J.-D.M.; Ogunseitan, O.A.; Shapiro, A.A. Understanding preferences for recycling electronic waste in California: The influence of environmental attitudes and beliefs on willingness to pay. Environ. Behav. 2008, 41, 101–124. [Google Scholar] [CrossRef]
  45. Rea, L.M.; Parker, R.A. Designing and Conducting Survey Research: A Comprehensive Guide, 3rd ed.; John Wiley & Sons: San Francisco, CA, USA, 2005. [Google Scholar]
  46. 2013 Census Quickstats about Whangarei District. Available online: http://archive.stats.govt.nz/Census/2013-census/profile-and-summary-reports/quickstats-about-a-place.aspx?url=%2FCensus%2F2013-census%2Fprofile-and-summary-reports%2Fquickstats-about-a-place.aspx&request_value=13108&tabname=&sc_device=pdf (accessed on 27 April 2019).
  47. Hunter, L.M.; Hatch, A.; Johnson, A. Cross-national gender variation in environmental behaviors. Soc. Sci. Q. 2004, 85, 677–694. [Google Scholar] [CrossRef]
  48. Martin, M.; Williams, I.D.D.; Clark, M. Social, cultural and structural influences on household waste recycling: A case study. Resour. Conserv. Recycl. 2006, 48, 357–395. [Google Scholar] [CrossRef]
  49. Dudovskiy, J. Convenience Sampling. 2018. Available online: https://research-methodology.net/sampling-in-primary-data-collection/convenience-sampling/ (accessed on 27 May 2019).
  50. Creswell, J.W.; Miller, D.L. Determining validity in qualitative inquiry. Theory Pract. 2000, 39, 124–130. [Google Scholar] [CrossRef]
  51. Triola, M.F. Elementary Statistics Using Excel, 5th ed.; Pearson Education Limited: Essex, UK, 2014. [Google Scholar]
  52. Saphores, J.D.M.; Ogunseitan, O.A.; Shapiro, A.A. Willingness to engage in a pro-environmental behavior: An analysis of e-waste recycling based on a national survey of U.S. households. Resources. Conserv. Recycl. 2012, 60, 49–63. [Google Scholar] [CrossRef]
  53. Smith, W.G. Does Gender Influence Online Survey Participation? A Record-Linkage Analysis of University Faculty Online Survey Response Behavior; San Jose State University: San Jose, CA, USA, 2008; Available online: https://files.eric.ed.gov/fulltext/ED501717.pdf (accessed on 27 May 2019).
  54. Neumayer, Eric. The Environment, Left-Wing Political Orientation and Ecological Economics. 2004. Available online: https://www.researchgate.net/publication/292047385_The_environment_left-wing_political_orientation_and_ecological_economics (accessed on 27 May 2019).
  55. Final Results—New Zealand 2017 General Election. Available online: https://interactives.stuff.co.nz/NZ-election-home/ (accessed on 21 June 2018).
  56. Recycling—Whangarei District Council. Available online: http://www.wdc.govt.nz/WaterandWaste/Rubbish/Pages/Recycling.aspx (accessed on 3 April 2019).
  57. Directive 2012/19/Eu of the European Parliament and of the Council of 4 July 2012 on Waste Electrical and Electronic Equipment (WEEE) European Union. Available online: http://data.europa.eu/eli/dir/2012/19/oj (accessed on 27 May 2019).
  58. Rice, J.L. An urban political ecology of climate change governance. Geogr. Compass 2014, 8, 381–394. [Google Scholar] [CrossRef]
  59. Fahy, F.; Davies, A. Home improvements: Household waste minimisation and action research. Resour. Conserv. Recycl. 2007, 52, 13–27. [Google Scholar] [CrossRef]
  60. Blake, J. Overcoming the ‘value-action gap’ in environmental policy: Tensions between national policy and local experience. Local Environ. 1999, 4, 257–278. [Google Scholar] [CrossRef]
  61. Tonglet, M.; Phillips, P.S.; Bates, M.P. Determining the drivers for householder pro-environmental behaviour: Waste minimisation compared to recycling. Resour. Conserv. Recycl. 2004, 42, 27–48. [Google Scholar] [CrossRef]
  62. Murugesan, S. Harnessing Green IT: Principles and Practices. IT Prof. 2008, 10, 24–33. [Google Scholar] [CrossRef]
  63. Un-Backed Body ‘Right’ to Single Out New Zealand as an E-Waste Laggard. Available online: https://www.stuff.co.nz/business/industries/99848483/unbacked-body-singles-out-new-zealand-as-an-ewaste-laggard (accessed on 30 April 2019).
  64. Whangarei District Council. Personal Communication; Whangarei District Council: Whangarei District, New Zealand, 2018. [Google Scholar]
  65. Measuring New Zealand’s Progress Using a Sustainable Development Approach. Available online: http://archive.stats.govt.nz/browse_for_stats/snapshots-of-nz/Measuring-NZprogress-sustainable-dev-approach/sustainable-development/waste.aspx (accessed on 30 October 2018).
  66. Slade, G. Made to Break: Technology And Obsolescence in America; Harvard University Press: Cambridge, MA, USA, 2006. [Google Scholar]
  67. Braungart, M.; McDonough, W. Cradle to Cradle: Re-Making the Way We Make Things; Johnathan Cape: London, UK, 2008. [Google Scholar]
  68. Liboiron, M. Tactics of Waste, Dirt and Discard in the Occupy Movement. Soc. Mov. Stud. 2012, 11, 393–401. [Google Scholar] [CrossRef]
  69. Hallows, D.; Munnik, V. Wasting the Nation: Making Trash of People and Places; Groundwork: Petermaritzburg, South Africa, 2008. [Google Scholar]
  70. Webb, B.; Marshall, B.; Czarnomski, S.; Tilley, N. Fly-Tipping: Causes, Incentives and Solutions; UCL Jill Dando Institute: London, UK, 2006; Available online: http://www.tacklingflytipping.com/Documents/NFTPG-Files/Jill-Dando-report-flytipping-research-report.pdf (accessed on 27 May 2019).
  71. Gurauskienė, I. The behaviour of consumers as one of the most important factors in e-waste problem. Environmental Res. Eng. Manage. ISSN 2008, 4, 56–65. Available online: https://www.researchgate.net/publication/229015608_The_Behaviour_of_Consumers_as_One_of_the_Most_Important_Factors_in_E-waste_Problem (accessed on 27 May 2019).
  72. Enkvist, P.A.; Klevnas, P. The Circular Economy—A Powerful Force for Climate Mitigation: Transformative Innovation for Prosperous and Low-Carbon Industry; Material Economics Sverige AB: Stockholm, Sweden, 2018; Available online: https://www.sitra.fi/en/publications/circular-economy-powerful-force-climate-mitigation/ (accessed on 27 May 2019).
  73. Ellen MacArthur Foundation. Towards the Circular Economy: Economic and Business Rationale for an Accelerated Transition; Executive Summary; Ellen MacArthur Foundation: Cowes, Isle of Wright, UK, 2012; Available online: http://www.ellenmacarthurfoundation.org/business/reports (accessed on 27 May 2019).
  74. Griffin, J.; Jones, P.; Brosnahan, E.; McGlennon, S.; Kenworthy, A.; Stephenson, F.; Tomashek, M. The Circular Economy Opportunity for Auckland and How Business Can Realise it; SBN-NZ: Auckland, New Zealand, 2017; Available online: https://static1.squarespace.com/static/59d8312f268b96ed79bdadc3/t/5af25e570e2e729b66cb31ea/1525833380771/SBN_CircularEconomyOpportunity_ForAuckland.pdf (accessed on 27 May 2019).
  75. 2016 EPR Summary Report. Available online: http://www.eprcanada.ca/reports/2016/EPR-Report-Card-2016.pdf (accessed on 27 April 2019).
  76. Peterson, D.P. Effective Product Stewardship Models: A look at the Overseas Evidence. Presented at the WasteMINZ Conference, Wellington, New Zealand, 30 October 2014. Available online: https://www.wasteminz.org.nz/pubs/effective-product-stewardship-modelsa-look-at-the-overseas-evidence/ (accessed on 27 May 2019).
  77. Kollmuss, A.; Agyeman, J. Mind the Gap: Why do people behave environmentally and what are the barriers to pro-environmental behaviour. Environ. Educ. Res. 2002, 8, 239–260. [Google Scholar] [CrossRef]
  78. Middlemiss, L. Reframing individual responsibility for sustainable consumption: Lessons from environmental justice and ecological citizenship. Environ. Values 2010, 19, 147–167. [Google Scholar] [CrossRef]
Figure 1. Survey responses to the question asking who is to blame for environmental problems stemming from waste generation.
Sustainability 11 03063 g001
Figure 2. Participant responses to influences on e-waste disposal by percentage.
Sustainability 11 03063 g002
Figure 3. Response distribution of e-waste disposal methods utilising mean across all e-waste categories.
Sustainability 11 03063 g003
Figure 4. Response distribution of reasons for e-waste storage statements.
Sustainability 11 03063 g004
Figure 5. Self-reported disposal method by percentage (n = 175).
Sustainability 11 03063 g005
Figure 6. Question 16 qualitative disposal method responses by percentage compared with question 12 quantitative disposal mean results (see Figure 3).
Sustainability 11 03063 g006
Figure 7. Response distribution to possible e-waste behaviour impact statements.
Sustainability 11 03063 g007
Figure 8. The transition from product stewardship to full EPR [75] (p. 2).
Sustainability 11 03063 g008
Table 1. Current New Zealand consumer voluntary e-waste recycling methods/schemes (Sources: [13,22,23,24,25,26,27,28]).
Type of DisposalOrganisationsProductCost
Service Provider Take-Back SchemeSpark
Vodafone
2 Degrees
Smart phones
Cell phones
No charge
Service Provider Trade-In SchemeSpark
Vodafone
2 Degrees
Some smart phones Consumer may be given credit or discount
Supplier Take-Back SchemeDell
HP
Apple
All products provided by supplierNo charge
Supplier Take-Back SchemeFisher & PaykelRefrigerators and freezers
Any other e-waste (except computers and TVs)
No charge if collection includes a fridge or freezer
Supplier Trade-In SchemeDellAny make of used computer or printer equipment when purchasing new from supplierNo charge
Drop-off RecyclingDistrict Council Recycling SchemesMost e-waste
(While WDC collects all forms of e-waste through its municipal schemes, this is not true for all district councils in NZ)
Most products will incur charges
Drop-off Recyclinge-Waste RecyclersMost e-wasteMost products will incur charges
Drop-off RecyclingTCF New Zealand Re:Mobile InitiativeSmart phones
Cell phones
No charge–contribution made to charity
Table 2. The multi-level governance elements of the NZ e-waste scape, plus NGO activity: key national waste management policy documents, legislation, non-governmental initiatives, and supranational waste directives (Sources: Refs. [20] p. 13; [30,31]).
Governmental InitiativesKey Details
Resource Management Act (1991)Addresses waste management through controls on the environmental effects of waste management facilities through local policy, plans and consent procedures. In 2004, new environmental standards introduced into the Act included improvements in the standards of landfills (e.g., requirements for large landfills to collect and destroy greenhouse gas emissions).
Waste Minimisation Act (2008)Levy imposed on all waste sent to landfill.
Clarification of role of territorial authorities regarding waste minimisation.
Promotes product stewardship schemes with the opportunity to define priority products for compulsory schemes.
Imposes some mandatory waste reporting.
The establishment of a Waste Advisory Board.
New Zealand Waste Strategy (2010)Aims to reduce the harmful effects of waste and to improve the efficiency of resource use.
Local Government Act (2002)Includes a requirement for territorial authorities to complete their own Waste Management Plans.
Ministry for the Environment Community Environment FundFunds projects that support partnerships between parties and increase community-based advice, educational opportunities, and public awareness on environmental issues.
Ministry for the Environment Waste Minimisation FundFunds projects that promote or achieve waste minimisation. By supporting these projects, the fund increases resource efficiency, reuse, recovery and recycling and decreases waste to landfill.
Non-Governmental InitiativesKey Details
New Zealand Product Stewardship Council (2016)An independent council that supports inclusive government, industry and community engagement around the investigation and implementation of product stewardship and related regulation.
eDay New Zealand Trust (2010)Replaced Computer Access New Zealand Trust (CANZ) (1999).
Promotes best practice e-waste collection and recycling.
Promotes education initiatives and e-waste awareness.
Ran annual e-waste collection days (eDay) in main centres from 2007–2010.
The Zero Waste New Zealand Trust (1997)Promotes zero waste in schools, businesses, councils and households.
Acts as a funding manager, distributing funds sources from The Tindall Foundation, Community Employment Group (CEG), and the Sustainable Management Fund to over 300 community groups, schools, etc.
Zero Waste Network (2017)Replaced Community Recycling Network (CRN) (2006).
Represents community enterprises focused on zero waste with members from Northland (CBEC–Community Business & Environment Centre) to Southland.
Relevant Supranational Waste DirectivesKey Details
Basel Convention (1989, NZ ratified 1994)Promotes
the reduction of hazardous waste generation and the promotion of environmentally sound management of hazardous wastes, wherever the place of disposal;
the restriction of transboundary movements of hazardous materials except where it is perceived to be in accordance with the principles of environmentally sound management; and a regulatory system applying to cases where transboundary movements are permissible.
Minimata Convention on Mercury (2013, not yet ratified)This convention addresses issues relating to the mining, movement, and emissions of mercury. It promotes:
the protection of human health and the environment from mercury exposure and
Reducing mercury emissions from human activity
Convention for the Protection of the Natural Resources and Environment of the South Pacific Region (Noumea Convention) (1986, NZ ratified 1990)Aims to protect and manage the natural resources and environment of the South Pacific region from polluting and dumping. Also discusses the storage of toxic and hazardous wastes.
Table 3. E-waste collected for the 11 months between 3 June 2017 and 21 April 2018 (Note: E-waste is shipped from the collection points for recycling/processing when WDC feels there is enough collected to necessitate shipment (i.e., on an ad hoc basis), hence the full year of e-waste collections is only reported across 11 months) by WDC municipal facilities (Source: WDC, personal communication, 17 July 2018–published with permission).
E-Waste TypeVolume (kg)
SCREENS (including CRT and small e-waste)14,860
E WASTE (large e-waste items)16,860
Table 4. Participant responses to method of e-waste disposal by percentage with most common method of disposal by e-waste category and disposal method, and least common disposal method highlighted.
Disposal MethodDon’t KnowReturn to Supplier/RetailerOtherWaste Transfer Station Mixed with General WasteStore ItSell ItGive Away to Friends/WhanauDonate to CharityWaste Transfer Station for RecyclingThrow Away with Household Rubbish
Category
Small Household Appliances24.86.413.116.725.94352.637.839
Large Household Appliances3.27.616.41014.534.533.736.148.22
ICT46.46.810.429.224.831.631.244.414.8
Handheld Devices7.66.87.66.832.426.83622.819.220
Phones3.214.58.46.437.324.134.920.815.320.1
AV Equipment5.25.23.610.126.22931.535.143.521.8
Lighting Equipment220.814.48.888.817.221.270.4
Electrical Tools6.92.42.810.619.919.924.821.121.122.8
Toys, Leisure & Sports Equipment20.80.41019.128.344.250.615.129.1
Batteries1.20.81466.40.80.40.421.668
Medical Equipment5.75.71.65.74.52.43.25.38.517.8
KeyHighest for CategoryHighest in Disposal MethodLowest in Disposal Method
Table 5. Number of items participants held in storage by percentage with most common option highlighted.
Number of Items1 Item2 Items3 Items4 Items 5 or More Items
E-Waste Type
SHA (n = 99)38.432.315.22.012.1
LHA (n = 62)46.830.611.38.13.2
ICT (n = 94)30.926.617.012.812.8
HHD (n = 71)43.735.28.58.54.2
Phones (n = 124)25.831.518.510.513.7
AV (n = 65)38.532.312.33.113.8
LE (n = 47)48.931.912.84.32.1
ET (n = 53)45.324.511.37.511.3
TLSE (n = 64)28.120.314.16.331.3
Batteries (n = 47)12.825.510.610.640.4
ME (n = 15)73.313.36.70.06.7
Power cables, cords etc. (n = 93)17.221.514.04.343.0
Table 6. General themes from open forum question.
ThemeNumber of Responses
More educational resources required17
User pays systems needed2
Free drop off/costs are too high10
Need for action7
Charge at purchase point3
Government intervention required7
Extended producer responsibility themes7
Consume less1
Rebates/incentives to recycle required3
Issues with current management in Whangarei District7
Illegal dumping/fly-tipping5
Off topic3
TOTAL RESPONSES OVERALL67

