Article

Environmental Efficiency of Organic and Conventional Cotton in Benin

by
Régina D.C. Bonou-zin
1,2,*,
Khalil Allali
1,3 and
Aziz Fadlaoui
4
1
Département d’économie et de sociologie appliquée à l’agriculture, Institut Agronomique et Vétérinaire Hassan II, Madinat Al Irfane, B.P. 6202, Rabat 10101, Morocco
2
Département d’économie et de sociologie rurales, Faculté d’Agronomie, Université de Parakou, Parakou BP 123, Bénin
3
Ecole Nationale d’Agriculture de Meknès (Morocco), Département d’Economie Rurale, B.P. S/40, Meknès 50001, Morocco
4
Department of Management of Natural Resources, Economics and Sociology and Quality, Regional Agricultural Research Center, Meknes, BP 578 (VN), Meknès 50000, Morocco
*
Author to whom correspondence should be addressed.
Sustainability 2019, 11(11), 3044; https://doi.org/10.3390/su11113044
Submission received: 24 April 2019 / Revised: 9 May 2019 / Accepted: 12 May 2019 / Published: 29 May 2019
(This article belongs to the Section Sustainable Agriculture)

Abstract

:
Recent years have seen an increasing awareness of the relative advantage of organic and conventional agriculture. This study aims to analyze the environmental efficiency of organic and conventional cotton in Benin. A Translog hyperbolic distance function which allows us to consider the joint production of desirable and undesirable output is used to analyze the environmental efficiency among organic and conventional cotton production farmers. The model includes factors that affect environmental efficiency. Greenhouse gas (GHG) was used as an indicator of undesirable output. Data were collected from 355 cotton producers (180 organics and 175 conventional) randomly selected in the cotton belt of Northern Benin. The results show that although organic cotton producers contribute less to GHG emission, they are environmentally inefficient compared to their conventional counterparts. Producers could improve the quantity of cotton produced by 27% and 17% while reducing emissions by 21% and 14% respectively for both organic and conventional cotton to achieve better environmental performance. However, the analysis of the shadow price revealed that organic cotton producers face lower opportunity cost than conventional producers. These results suggest that there is a need for more technical support and environmental education to improve the environmental efficiency of organic cotton in Benin.

1. Introduction

In recent decades, there has been a growing interest in the environmental performance of organic and conventional farming across the world. The increased use of synthetic input (fertilizers and pesticides) in conventional farming leads to an increase in agricultural productivity, but also it contributes to environmental pressures [1] such as soil erosion, water and air pollution, emission of greenhouses gases, loss of biodiversity and ecosystem services and impact on public health [2,3]. To overcome these challenges, organic farming is promoted. Organic agriculture is a production method that excludes the use of agro-chemicals. It is a part of the green economy and aims to combine the economy, the environment and social issues. It values ecosystem services and is based on technologies that are compatible with the preservation of the environment. Organic agriculture is a holistic production system which used the environmentally friendly practice to ensure environmental sustainability [4]. Then it contributes to soil health, water conservation, biodiversity preservation and ecological health, carbon and natural resource management, energy efficiency and Greenhouse gas mitigation [5,6,7].
To this end, organic farming is an environmentally friendly method which provides solutions to resource use efficiency by contributing to nutrient management, energy use and water efficiency. However, the main question is that does organic farming allow to achieve a high quantity of products and less environmental pollution? One controversy of organic agriculture is its lower productivity compared to conventional counterpart. Reference [4] reported that organics yield averaged 75% to 80% of conventional farm yields. In addition, the excessive use of organic nutrients can cause environmental impacts such as water pollution and greenhouse gas emission [6]. According to producers involved in organic agriculture [8] are generally judged in terms of input choice and production technology, but not in terms of their environmental performance. This can influence their economic performance. In this context, it is important to assess the contribution of organic agriculture in environmental performance.
Various indicators such as productivity and nutrient use efficiency are used to estimate the environmental performance of organic farming. According to Reference [3], environmental efficiency is an environmental indicator which allows us to promote environmental management in agricultural production. Many studies have treated nutrient use and pesticides risk as undesirable output or environmental detrimental input to estimate the environmental efficiency of organic farming [6]. To our knowledge, little attention has been given to the global warming potential of organic and conventional farming especially in the cotton sector in West Africa.
Agriculture plays an important role in greenhouse gas emission and in climate change [9]. The agricultural sector is one of the most important sources of greenhouse gas (GHG) emission [10]. This sector is responsible for one-third of global GHGs through activities such as the production and the use of fertilizer, pesticides, machinery, change in land use, rice production, livestock and direct energy use [11]. NO2 emissions which are the main source of GHG emission in the agricultural sector come from the use of nitrogen fertilizer [12]. According to Reference [13], quantifying the environmental impact of GHGs poses various challenges because it’s difficult to deliver monetary measures to these pollutions which are not priced in the market and their characteristics make it difficult to inventory them.
This study aims to estimate the environmental efficiency of organic and conventional cotton production in Benin and the factors that determine this efficiency. The contribution of this study is twofold. First, it focused on the GHG emissions as an indicator of environmental impact in order to estimate environmental efficiency of organic and conventional cotton, it fills the gap in the literature on the assessment of environmental performance of these production practices. Secondly, the article provides information to policymakers for the development of policies interventions that could reduce environmental damages in cotton production and promote sustainable development.
This paper is organized as follows. The next section presents the literature on cotton sector followed by the methodology used to collect data and the methods of data analysis. The results and discussion are described in Section 4. The last section summarized the main findings and implications.

2. Literature Review of the Cotton Sector

Cotton production and cotton textile industries play an important role in economic growth across the world. Harvested on 2.3% of the world’s arable land, cotton is the main crop produced after the food crop [14]. More than 100 million farm families are involved in the cotton sector across 75 countries which generate employment for more than 250 million people through the provision of inputs service, production equipment [14]. The continent of Asia is the largest cotton producer in the world. In the 2018–2019 season, China is the world’s leading producer with a production of nearly six million tons of cotton followed by India (5,879,000 tons) and United-State (4,004,000 tons). India was the main cotton producer in 2015/2016 (5.7 million bales, followed by China (4.7 million bales) and the United States (2.8 million bales). The main cotton producers in the world are also the main consumers. These are China, India, Pakistan, East Asia and then Europe. The largest industrial users of cotton which are China, India, Pakistan, Turkey, Bangladesh, the United States and Indonesia, increased their consumption. In terms of exports, the United States remains the world’s largest exporter of cotton, accounting for nearly one-third of total exports. They are followed by India, which accounts for 18% of total exports. The least developed countries (8%) and other parts of Saharan Africa (4%) are in third place and account for 12% of world cotton exports. The European Union represents only 3% of world cotton exports. Africa is now one of the farthest cotton suppliers from Asia. The main cotton importers are China (26%), Bangladesh (11%), Turkey (11%), Indonesia (8%), Vietnam (8%) and Pakistan (6%).
With an area of 5 million hectares or 14% of the world’s cotton area, African cotton production is essentially rainfed with rudimentary production methods poorly mechanized. Irrigated production is practiced in Egypt and Sudan and occupies only 10% of the area cultivated. African cotton is mainly produced in the Sahel regions of West Africa and secondarily in coastal countries such as Benin, Ghana, Nigeria and Côte d’Ivoire. The four (04) main producers are Benin, Burkina Faso, Chad and Mali.
In Benin, cotton is the main exported crop and therefore plays a key role in the country’s socio-economic development, thus contributing to the fight against poverty [15]. According to the platform of civil society actors in Benin [16], cotton is Benin’s most important economic sector, with major earnings for the country and an important contribution to the income of rural producers. Indeed, in Benin, the cotton sector accounts for 40% of foreign exchange earnings, it contributes on average 13% to the gross domestic product (GDP), represents about 60% of the national industrial tissue and 80% of export earnings and provides an income to more than one third of the population [17]. In rural areas, cotton generates more than 40% of jobs [18] and promotes the development of certain rural areas and the productivity of the food crops associated with them. Moreover, at the farm level, this crop has been at the origin of the dynamics of mechanization through animal traction, the use of inputs (fertilizers, insecticides, herbicides) and the popularization of farming techniques. the various agricultural policies of recent years have then promoted crop intensification as a means of improving production levels, resulting in excessive use of chemicals [19].
The negative environmental externalities associated with conventional cotton have led to the promotion of organic cotton in strategies to reduce environmental impacts in Benin. Organic cotton production is not only aimed at preserving the environment but also contributes to reducing the costs of agrochemical products. organic cotton production is based on the use of natural resources and could lead to an increase in producers’ income through high selling prices [19]. Since its introduction in Benin in 1996, the level of production, as well as the number of producers, has increased over the years. Organic cotton production was increased from 9.5 tons in 1997–1998 to 699 tons of organic cottonseed in 2016–2017. In agricultural season 2016–2017, 2715 producers were involved in organic cotton on 3384 hectares of land. Despite the increased importance of organic production, there is very little research on the environmental performance of cotton production methods in Benin. It is important to know whether cotton production methods in Benin combine productivity and reduction of environmental impacts.

3. Materials and Methods

3.1. Study Area and Sampling

The study was conducted in two departments named Borgou and Alibori, the largest cotton production zone located in Northern Benin. According to Reference [20], these two departments represent 51% of the cultivated area during the 2003–2004 season and 62% of cultivated area in 2017–2018 season. In addition, the rate of consumption of chemical fertilizers in this region is estimated at 62% [20]. Four districts (Gogounou, Kandi and Banikoara in Alibori’s department and Sinende in Borgou’s department) where organic cotton was introduced were selected to carry out this investigation. In each district, three main criteria (the level of production of organic cotton, the number of households involved in cotton production and the duration of organic cotton introduction (at least three (03) years which is the number of years necessary for organic certification) were used to select the villages. Data were collected from 355 cotton-producing households (180 organic cotton producing households and 175 conventional cotton producers) randomly selected.

3.2. Analytical Framework of Environmental Efficiency

This study is based on the recent development of environmental performance analysis of agricultural production farming by focusing on an estimate of the environmental efficiency of the farming system. This measure considers the joint production of desirable output and undesirable output (pollution). Theoretically, the study is based on the distance function developed by Shepherd in 1970 to modelling multi-output production technologies. According to Reference [21], the distance function does not require information on price, output aggregation and the behavior objectives (profit maximization or cost minimization). However, the conventional output distance function treats desirable and undesirable outputs symmetrically [22]. Indeed, the conventional output distance function calculates the efficiency in terms of the proportional increase in output that can be achieved while maintaining the input level constant while the input distance function calculates the efficiency in terms of the proportional reduction of inputs while maintaining the output level constant. This is not appropriate when the production technology produces both desirable and undesirable (pollution, emission) outputs because the objective is to reduce undesirable outputs (rather than increase them) and increase the desirable outputs rather than keep it constant.
In this context, a flexible distance function such as the directional distance function and hyperbolic distance function allows us to increase desirable outputs and simultaneous decrease undesirable outputs were developed respectively by References [23] and [24]. A nonparametric approach based on a data envelopment analysis (DEA) was used by these authors to estimate these function. However, according to Reference [25] when the objective is to measure the shadow price of undesirable output and the substitution between desirable and undesirable outputs in addition to efficiency, the parametric approach is more suitable. As the DEA is a deterministic approach, it is not suitable in stochastics environment [26] such as agricultural production.
Reference [25] developed a parametric directional distance function which estimates the ability of a production unit to improve environmental efficiency by simultaneously increasing desirable outputs and reducing undesirable outputs. According to Reference [22], this model is deterministic and cannot be estimated without bootstrapping. Reference [22] developed a Translog hyperbolic distance function which is stochastic and an alternative to the directional and deterministic model of Reference [25]. Following Reference [22], this study used the Translog hyperbolic distance function to estimate the environmental efficiency of cotton farms in Benin.
Consider a production technology that uses input vector x i =   ( x 1 ;   x 2 ; . x k ) R K to produce desirable outputs vector y i =   ( y 1 ;   y 2 ; . y m ) R M and undesirable outputs vector z i =   ( z 1 ;   z 2 ; . z r ) R R where i = ( 1 ,   2 ,   3 ,   , N ) is a set of observed producer. The production technology can be defined as follows:
T ( x ,   z ,   y ) =   { ( x ,   z ,   y ) :   x   can   produce   ( y ; z ) } .
This set of production possibilities satisfies the production axioms demonstrated by [27] and can be represented by hyperbolic distance function D H :   R + K × R + M × R + R R + U { + } defined by:
D H   ( x ,   y , z ) =   i n f { θ > 0 :   ( x ,   θ 1 y , θ z ) T } .
According to Reference [14], the hyperbolic distance function satisfies the following properties:
(1)
It is homogenous: D H   ( x ,   θ y , θ 1 z ) =   θ D H E   ( x ,   y , z ) ,   θ > 0 .
(2)
It is non-decreasing in desirable outputs: D H   ( x ,   φ y , z ) D H   ( x ,   y , z )   0 φ 1 .
(3)
It is non-increasing in undesirable outputs: D H   ( x ,   y , φ z ) D H   ( x ,   y , z )   φ 1 .
(4)
It is non-increasing in input: D H   ( x ,   y , z ) D H   ( φ x ,   y , z )   φ 1 .
The hyperbolic distance function is between 0 and 1: 0 < D H   ( x ,   y , z ) 1 . If D H ( x ,   y ,   z ) < 1 the production unit is environmentally inefficient. It can improve its desirable output by θ and decrease the undesirable by 1 / θ . When D H ( x ,   y ,   z ) = 1 the production unit is efficient.
The Translog hyperbolic distance function is presented as follow:
L n D H   ( x ,   y , z ) = α 0 +   m = 1 M α m L n y m + 1 2 m = 1 M n = 1 M α m n L n y m L n y n + k = 1 K β k L n x k + 1 2 k = 1 K l = 1 K β k l L n x k L n x l + r = 1 R δ r L n z r + 1 2 r = 1 R s = 1 R δ r s L n z r L n z s + m = 1 M k = 1 K γ m k L n y m L n x k + m = 1 M r = 1 R ρ m r L n y m L n z r + k = 1 K r = 1 R φ k r L n x k L n z r .
Considering the homogeneity condition, the estimation of the function is done by transforming the Translog hyperbolic distance function into a normalized function. If the normalized variable is an arbitrary desirable output y M , then the translog hyperbolic distance function becomes:
L n ( D H i / y M )   = α 0 + k = 1 K β k L n x k + 1 2 k = 1 K l = 1 K β k l L n x k L n x l + m = 1 M 1 α m L n y m * + 1 2 m = 1 M 1 n = 1 M 1 α m n L n y m * L n y n *   + r = 1 R δ r L n z r * + 1 2 r = 1 R s = 1 R δ r s L n z r * L n z s * +   m = 1 M 1 k = 1 K γ m k L n y m * L n x k + L n z r k = 1 K r = 1 R φ k r L n x k L n z r * + m = 1 M 1 r = 1 R ρ m r L n y m * L n z r * , y m * =   y m / y M   et   z r * =   z r × y M .
Replacing the right-hand side of the previous equation with T L   ( x ;   y * ;   z * ; θ ) with θ the parameters to be estimated then we obtain:
L n y M * = T L   ( x ;   y * ;   z * ; θ ) L n D H .
Consider L n D H = u i , the term of inefficiency and adding a random noise term v i , the stochastic model is defined as:
L n y M * = T L   ( x ;   y * ;   z * ; θ ) + v i u i .
The random noise component v i captures the effects that are not under the control of producers. It is assumed to be independently and identically distributed as normal with mean zero and constant variance σ v 2 [ ϑ i i d d N ( O , σ v 2 ] . The one-sided component u i captures the producer’s inefficiency and is assumed to follow a half-normal distribution N ( u , σ u 2 ).
The maximum likelihood is used to estimate the model. The environmental efficiency is defined by:
E E i = E x p   L n   D H   = e x p ( u i ) .
The hyperbolic distance function is between 0 and 1: 0 < D H   ( x ,   y , z ) 1 and measures the environmental efficiency. If D H ( x ,   y ,   z ) < 1 the production unit is environmentally inefficient. It can improve its desirable output by 1 E E and decrease the undesirable by 1 / EE . When D H ( x ,   y ,   z ) = 1 the production unit is efficient.

3.3. Empirical Model

For the estimation of the model, one desirable output is considered, the cotton yield and one undesirable output, the GHGs emission. Five (05) conventional inputs are considered. There are the cotton seed, chemical fertilizer, organic fertilizer, pesticides (organic or synthetic) and labor. The empirical model is presented as follows:
L n y i =   α 0 + k = 1 5 β k L n x k i + 1 2 k = 1 5 l = 1 5 β k l L n x k i L n x l i + δ 1 L n z r i y i + δ 11 L n z i y i L n z i y i + k = 1 5 φ k r L n x k i L n z i y i + v i u i .
  • y i   : Cotton yield (kg per hectare) of producer i
  • x 1   : Amount of cottonseed (kg per hectare)
  • x 2   : Amount of chemical fertilizer (NPK and urea) (kg per hectare)
  • x 3   : Amount of organic fertilizer (kg per hectare)
  • x 4   : Amount of synthetic pesticides or organic pesticides (liter per hectare)
  • x 5   : Amount of labor (man hour per hectare)
  • z     : Amount of GHGs emitted (kg CO2e per hectare)

3.3.1. Production Elasticity

In this section, we calculated the elasticity of input and undesirable output. The elasticity of the desired output with respect to a given input x k is the ratio of the proportionate change in output to the proportionate change in input x k when all others inputs are assumed to be constant [26]. It is defined as:
ε ( y ;   x k ) H = L n y i / L n x k =   β k + k = 1 5 β k l Ln   x l + φ k r ln z * .
The elasticity of the desired output with respect to the undesirable output z * is the ratio of the proportionate change in desirable output to the proportionate change in undesirable output z * . It measures the rate of transformation between the desirable and undesirable outputs [22]. It is defined as:
ε ( y , z ) H = L n y i / L n z *     =   δ 1 + δ 11 Ln   z * + k = 1 5 φ k r Ln   x k .

3.3.2. Shadow Price of Undesirable Output

According to Reference [13] the shadow price can be defined as the marginal abatement cost of the undesirable output. Based on Reference [28], the shadow price of the undesirable output can be represented as follows:
q = p . ( D H ( x ,   y ,   z ) / z D H ( x ,   y ,   z ) / y ) .  
Determinants of Environmental Inefficiency
In addition to the inefficiency index, it is important to assess factors that influence the level of inefficiency for a better policy orientation. The two-step approach is the most commonly used and consists of estimating inefficiency indices and then regressing exogenous variables influencing inefficiency levels [29]. As mentioned by References [30] and [31], this approach is biased because the parameters estimated in the first step may be inconsistent and therefore lead to a mis-estimation of the inefficiency. The inefficient factors are then directly introduced into the stochastic model under the assumption that the random error term u follow a truncated normal distribution ( u ~ N + ( μ   ,   σ u 2 ) ). The mean of inefficiency u is defined by:
μ = β 0 + β m s m
where s m represents the producers and farm characteristics. The variables are:
Age and experience of cotton farmer: farmer’s age is associated with knowledge accumulation [32] and shows that older farmers have accumulated managerial skills over the year, so they are more efficient. Therefore, age is supposed to have a positive effect on efficiency.
Gender of cotton farmer: agricultural production especially, the cotton sector, is dominated by men. Women have less access to education and information which decrease their level of efficiency [33]. This variable is assumed to affect positively the efficiency.
Year of schooling: Education improves farmer’s knowledge and access to information and increases their management skills [33]. A farmer with a higher level of education can better understand the technical aspects of agricultural technologies, allocate resources efficiently and then be environmentally efficient. This variable is assumed to have a positive influence on environmental efficient.
Contact with extension service: Extension services contribute to dissemination of agricultural technologies. According to Reference [34], agricultural extension is the most important sources of information and dissemination of agricultural production practices. They also contribute to access to the input for cotton production. Contact with extension service is expected to have a positive effect on environmental efficiency.
Access to agricultural credit: this is introduced in the model to reflect the relative influence of agricultural financing in agricultural production. Reference [26] argued that access to credit can increase the farmer’s ability to use quality input, services and then increase efficiency. Access to credit is supposed to have a positive effect on environmental efficiency.
Access to information on the effect of cotton practices and participation to agricultural training: These variables are expected to have a positive effect on environmental efficiency. Indeed, training and information improve farmer’s awareness on the environmental effect of the agricultural practices. They provide useful knowledge that may contribute to the efficient use of environmental detrimental inputs.
Soil fertility level assessment: Soil fertility reflects the availability of nutrients in the soil. Therefore, the more fertile the soil is, the less the producers will use chemical fertilizers to improve crop productivity. Thus, this variable is assumed to have a positive effect on environmental efficiency. Table 1 presents the variables introduced into the determinant model.

3.3.3. Estimation of the Undesirable Output

As mentioned, greenhouse gas emissions of cotton farms are considered an undesirable output. The estimation of GHG emission is based on the GHG potential of all input used in cotton production that is obtained by using the information on the emission factor corresponding to each input. Table 2 presents the GHGs emission coefficient of agricultural input.

3.4. Data Collection

Data used in this study were collected through face-to-face structured interviews during May and June 2017 and were related to the agricultural season 2015–2016. The data included the characteristics of farming and the socio-economic characteristics of farmers. The farm characteristics concern farm type and farm area cultivated, input quantity (synthetic and organic fertilizer, seed, pesticides, labor and fuel used in cotton production). For pesticides, in addition to the quantities used, information on the different active ingredients and their concentrations were also collected. The socio-economic characteristics included farmers age, gender, experience in cotton production, instruction level, access to credit and extension service and information on the environmental effect of agricultural practices, participation in agricultural training and their appreciation of soil fertility.
Secondary data were also used and included fertilizer values used in cotton production and the greenhouse gas emission factors. The fertilizing values of chemical fertilizers are derived from the formulation of these fertilizers while those of organic fertilizers are obtained in the literature.

4. Results

4.1. Socio-economics Characteristics of Producer

Table 3 presents the socio-economic characteristics of cotton producers. On average, cotton producers are 43 years old with 18 years of experience in cotton production. The intra-analysis shows that organic cotton producers are less old than conventional cotton producers (42 years against 44 years). The gender analysis reveals that more women are involved in organic cotton (25%) than conventional (only 1%). Compared to conventional producers, organic cotton producers are less educated (2 years against 4 years for the conventional cotton producer). Access to agricultural credit is higher for conventional cotton producers than organic cotton producers (31% against 3.9%). In contrast, organic cotton producers have more access to extension services (28% against 21%). The same is also observed with regard to access to information on the environmental effects of agricultural practices and producers’ participation in agricultural training.

4.2. Farm Characteristics

The cotton area is on average 5.17 hectares per producer with on average 1.29 hectares for organic cotton against 8.52 hectares for conventional cotton. The amount of seed used is on average 28 kg/ha and varies very little between the two (02) types of cotton (Table 4). The average amount of chemical fertilizer is 212 kg per hectare. The average amount of organic fertilizer used by organic cotton producers was higher than that of conventional cotton (2228 kg per hectare against 466 kg per hectare).
A total of 8.19 liter per hectare of chemical pesticide which includes 5 liters per hectare for insecticides and 4 liter per hectare for herbicides is used for growing conventional cotton. The amount of organic pesticides used in organic cotton is 21.54 liter per hectare. These bio-pesticides are manufactured using local resources including Neem leaves, chilli, garlic, local soap and cow urine in some cases. On average the quantity of labor used in conventional cotton is higher than that of organic cotton (888 man-hours per hectare against 777 man-hours per hectare).
The average cotton yield is 1127 kg per hectare, with about 1230.47 kg per hectare for conventional cotton and 924.27 kg per hectare for organic cotton. Thus, the yield of conventional cotton is significantly higher (1.38 times) than that of organic cotton.
The quantity of GHGs emitted by cotton farms is an average of 669.40 kg CO2e per hectare. Indeed, the quantity of GHGs emitted by conventional cotton is 882.06 kg CO2e per hectare compared to 462.65 kg CO2e per hectare for organic cotton. Thus, organic cotton emits about 42% less GHG than conventional cotton.

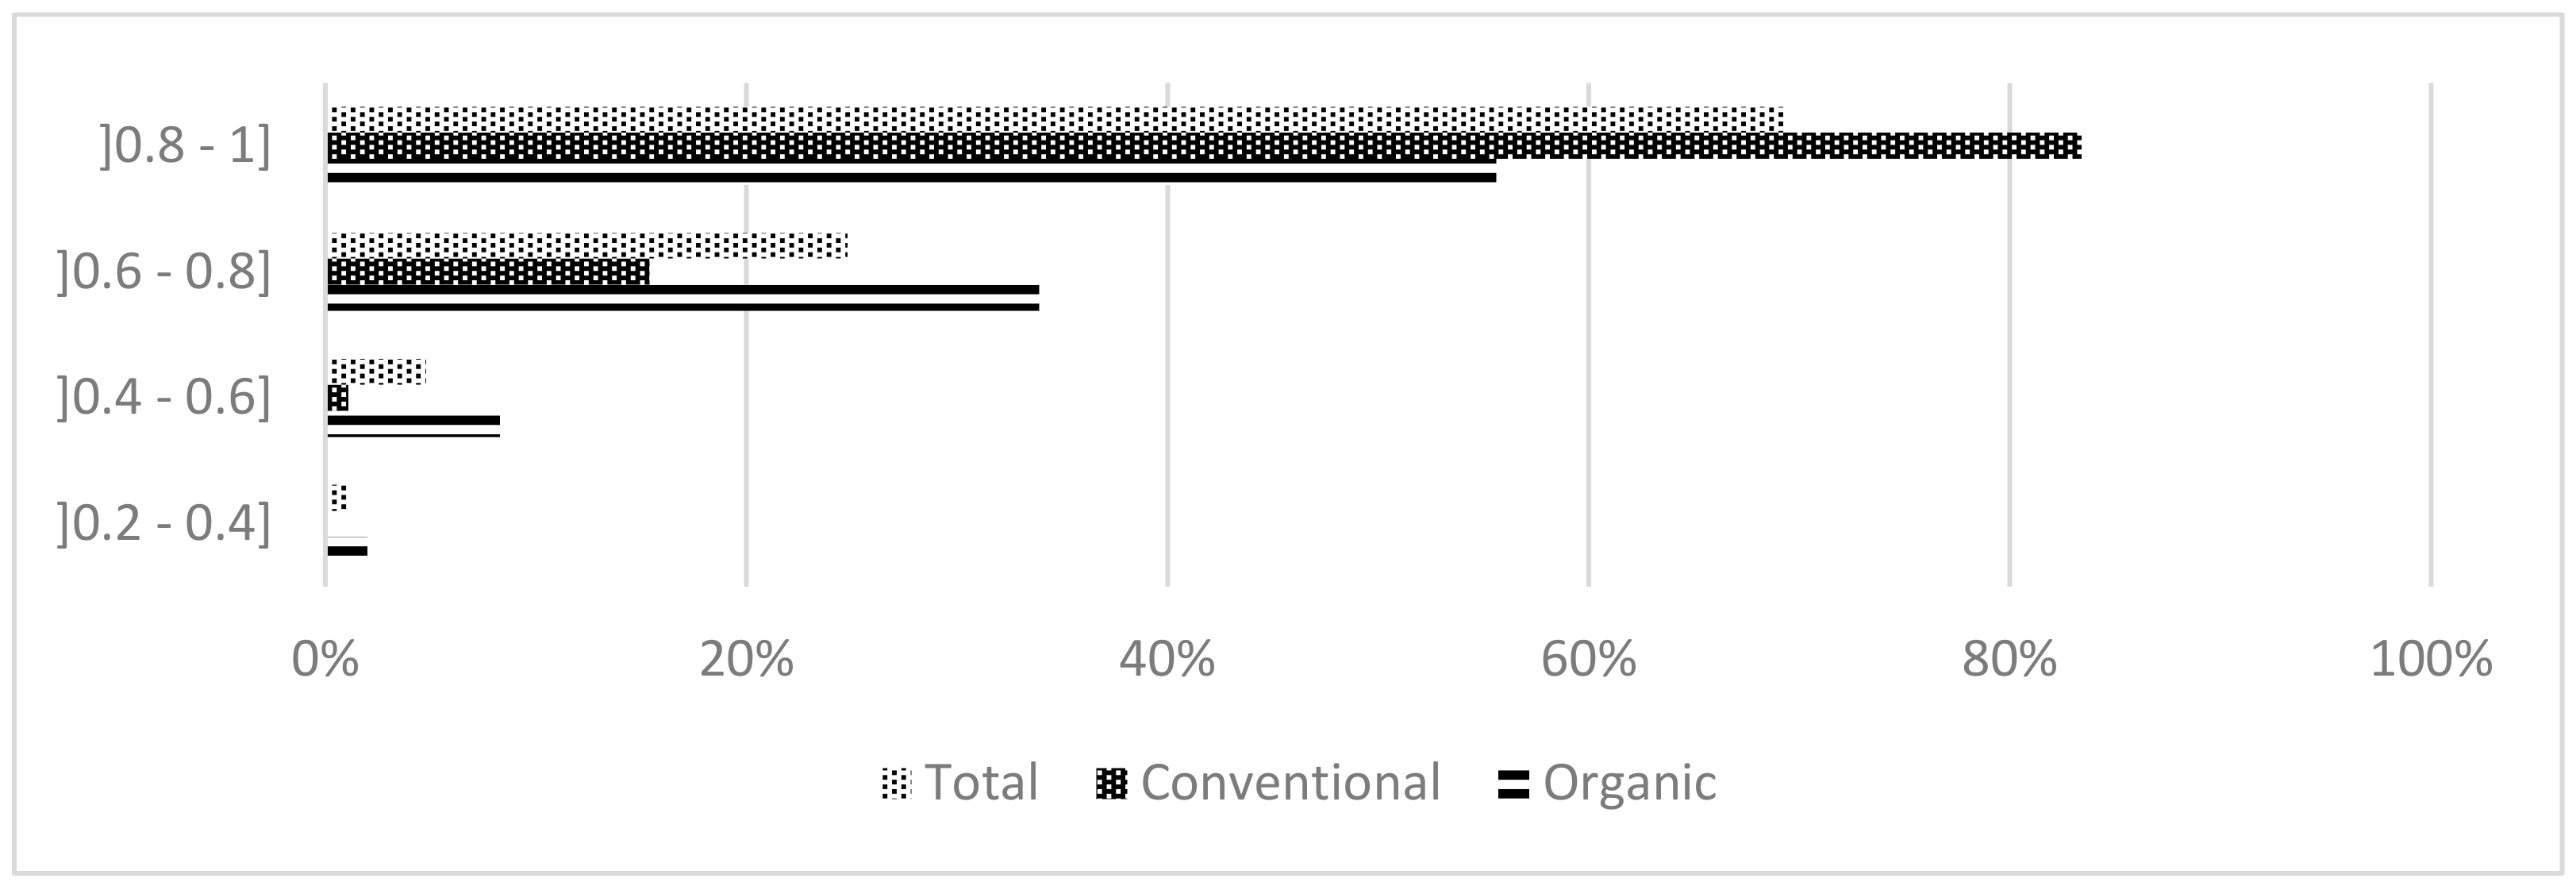
4.3. Environmental Efficiency and Shadow Price of Cotton Farming

The results of the Translog hyperbolic distance function model estimated using the maximum likelihood method are presented in Table 5. The different results are used to test the validity of the model and the presence of inefficiency. Thus, a pre-test on the residues of the ordinary least square (the asymmetry statistic (skewness)) was used to test the presence of asymmetry at the distribution level. The asymmetry coefficient is negative (−0.43) and the sktest test with the noadj option in the statistical software Stata confirms that the coefficient is significant. The null hypothesis of no asymmetry can be rejected. Therefore, the stochastic parametric model can be used to estimate the production function. In addition, the likelihood ratio test was also performed to test the presence of inefficiency in the sample. For this purpose, the values of the log likelihood function of the Ordinary Least Square (OLS) models and the stochastic boundary were considered. The value of the likelihood ratio (16.69) is higher than the critical value of 5.41 obtained from Table 1 of Reference [42] at a 1% degree of significance. Thus, the null hypothesis of no environmental inefficiency is rejected.
The parameters’ analysis shows that the model is globally significant at 1%. Thus, the estimated parameters and coefficients of the different variables are statistically valid. These differences are used to determine the effect of input and output on the distance function. The coefficients of the seed and pesticide variables are positive, showing that any increase in these inputs would lead to an increase in the distance to the production boundary. However, the signs of the chemical and organic fertilizer and labor inputs are negative, in contrast to the expected sign, this means that the distance to the frontier has been reduced by an increase in these inputs. The t-test statistics are significant for all variables except seed. In addition, the sign of the undesirable output, the GHG emission, is positive, that is in line with expectations. Thus, any increase in the level of production is associated with an increase in GHG emissions.
Input elasticity results show that pesticides and bio-pesticides, as well as labor, contribute more to cotton yield (Table 6). The intra-analysis of elasticities index reveals that in organic cotton, the elasticities with regard to seeds, organic fertilizers and labor are negative while those of bio-pesticides are positive. Indeed, the 1% increase in the amount of bio-pesticide results in a 0.07% increase in cotton yield. For conventional cotton, the results of the table show that the increase in organic fertilizers, chemical pesticides and labor by 1% increases the quantity produced by 0.02%, 0.019% and 0.066% respectively, while seed and chemical fertilizers reduce the yield by 0.012% and 0.48% respectively.
The results of elasticity and substitution rate between desirable and undesirable output showed a complementary relationship between the two outputs. Indeed, in the survey sample, the elasticity of the desired output in relation to the undesirable is 0.53. Thus, the 1% increase in undesirable output leads to a 0.53% improvement in efficiency and vice versa. Cotton production is not possible without GHG emissions. This rate is lower for organic cotton (0.31%) compared to conventional cotton (0.77%). A reduction in the current amount of GHGs of 4.63 kg would result in a reduction in the current yield of organic cotton of 2.87 kg.
The results on the opportunity costs of GHG emission are presented in Table 6. The estimated average cost is 94 Franc CFA per kg CO2e (0.16$ per kg). This cost is lower for organic cotton producers (74 Franc CFA per kg CO2e (0.13 $ per kg) compared to 115 Franc CFA per kg CO2e (0.20$ per kg) for conventional cotton). Considering the farm’s size, Table 7 shows that small organic cotton farmers have higher opportunity costs than large organic cotton farmers farms. In conventional cotton, medium-sized farms have the highest costs, followed by small and large farms.
The environmental efficiency of cotton producers varies from 0.31 to 0.97 with an average of 0.82 (Table 8). The indices are 0.79 and 0.85 respectively for organic and conventional cotton. Organic cotton and conventional cotton producers produce 79% and 85% of the maximum quantity of cotton respectively, i.e., about 21% and 15% of the quantity of seed cotton is lost due to environmental inefficiency. However, the inefficiency indices are 0.26 and 0.16 for organic and conventional cotton respectively (Table 8). To this end, organic cotton producers are less environmentally efficient than conventional cotton producers.
Analysis by farm size based on cotton area revealed that medium organics farms are more efficient (0.79) than small (0.66) and large (0.72) farms (Table 9). On the other hand, in the conventional system, large farms are the most environmentally efficient (0.88 compared to.0.80 and 0.85 respectively for small and medium-sized farms).
It should be noted that more than 80% of conventional cotton producers have an efficiency score higher than 80% (Figure 1). On the other hand, 56% of organic cotton producers have an efficiency index higher than 80%. About 8% of organic cotton producers have an efficiency between 40% and 60% compared to 1% for conventional producers. In addition, 2% of organic cotton producers are between 20% and 40%.
The effect of socio-economic factors that influence the level of inefficiency of cotton producers is determined using the stochastic frontier model (Table 5). The results show that age contributed to inefficiency while contact with extension, access to credit, access to information on the effect of agricultural practices and the number of years of experience in cotton production significantly influence positively the level of farm inefficiency.

5. Discussion

The characteristics of cotton farms showed that organic cotton producers are characterized by a small area of land. This limitation in the areas is explained by the requirement induced by the technical clauses related to the specifications for the production of organic cotton. This is mainly due to the difficulty of mobilizing organic inputs, particularly fertilizers and bio-pesticides, in addition to the low yields achieved. Indeed, the yield of organic cotton is 27% lower than those of conventional cotton. These findings are also reported by the work of Reference [43], and [44]. They are therefore in line with the results of Reference [4] which showed that organic farm yields averaged 75% to 80% of conventional farm yields. The lower yield of an organic farm could be explained by the lower quantity of organic fertilizer used associated with their quality which lead to a lower nutrient available, the poorer pest management, the difficulty to improve the nutrients of infertile soils and the long process of releasing nutrients from these organic materials [45,46], The yield of conventional cotton obtained is substantially equal to that obtained by [47] under the system characterized by a high level of chemical fertilizer use (1400 kg/ha) in 2014 and lower than that of 2015 (2400 kg/ha of seed cotton). the main constrains on organic cotton production must be addressed to improve the productivity of these farms.
The results of input elasticity show that in organic cotton, the elasticities with regard to seeds, organic fertilizers and labor are negative while those of bio-pesticides is positive. For conventional cotton, the increase in organic fertilizers, synthetic chemical pesticides and labor increase the quantity produced, while seed and chemical fertilizers reduce yields. Pesticides contribute more to the productivity of cotton. Indeed, pest control plays a key role in the development of cotton cultivation. The reasoned use of these inputs leads to better productivity. Producers in their efforts to increase the level of production are excessively using fertilizers. At a given level, the opposite effect is observed at the production level.
The negative sign of labor shows that there is a surplus of labor in organic cotton production. Organic cotton is labor-intensive. The high share of family labor, as well as the quality of this labor, could explain the low labor productivity in this production mode. The negative sign of labor elasticity is also found [6] in their study on the environmental efficiency of non-certified organic paddy rice farms in China, as well as [48] on conventional arable crops in Spain. For Reference [49], excessive use of labor can lead to very low levels of marginal labor productivity and therefore to a negative value in some cases. The negative sign observed at the seed level implies an excessive use of the seed by some producers. In this case, there will be more plants per bunch and when the dismantling is not carried out, there may be a decrease in yield. These results encourage the rational use of inputs to improve the production level of the cotton sector. The results of elasticity and substitution rate between desirable and undesirable outputs demonstrate that organic cotton could contribute to environmental pollution reduction and the promotion of sustainable agriculture.
In regards to GHGs shadow price, large farms have the lowest opportunity costs. These results corroborate those of Reference [13] who showed that the opportunity cost of CO2 emissions is higher on small Dutch dairy farms. In addition, the opportunity cost obtained for the conventional system is close to that found by Reference [13] (0.19£/ kgCO2e) and [50] in 2010 (0.22£/ kg CO2e) (1$ = 585 Franc cfa, 1£ = 661 Franc cfa).
The environmental efficiency score of 0.79 for organic cotton means that a producer can improve their performance level by increasing the quantity of cotton by 27% (1/0.786 = 1.27) while reducing the quantity of CO2 emitted by 21.4% (1 − 0.786 = 21.4%). The yield of organic cotton would then increase from 924.27 kg/ha to 1173.82 kg/ha while the quantity of CO2 would in turn decrease from 462.65 kg/ha to 365.49 kg/ha. For conventional cotton, the yield could be improved by 17% (1/0.854 = 1.17) and the amount of CO2 reduced by 14.6% (1 − 0.854). This would increase the cotton yield from 1230.47 kg/ha to 1439.64 kg/ha and the amount of CO2 from 886.06 kg/ha to 757.27 kg/ha. These various increases in production and reduction of environmental pollution could contribute to a reduction in production costs and therefore to an increase in profit.
These results are in contrast with those of Reference [8] who consider the nitrogen surplus and pesticide toxicity index as undesirable inputs in a DEA model with the bootstrap technique and showed that organic wine-growers in arid lands are more environmentally efficient than conventional ones (0.85 versus 0.71 for conventional farms). The same results are obtained by Reference [51] in their study on the analysis of the environmental and economic efficiency of agri-environmental programs. Their results show that those participating in the organic production scheme, have a better environmental efficiency index than those not participating in the various schemes (0.79 compared to 0.53). It should be noted that their efficiency score is approximately equal to that found in this study. The better environmental performance of organic farms is explained by their productive performance (they produce more output than conventional farms for the same level of undesirable input and output) and by the relatively small size of organic farms in the sample (30 farms compared to 53 for conventional farms). The low environmental efficiency of organic producers in Benin could be explained by the low yield of organic cotton compared to conventional cotton. The low capacity of producers in organic production technologies (bio-pesticides and organic manures), poor access to inputs as well as difficulties in the management of organic production technical processes could be a constraint to the productive performance of organic producers. There are opportunities to improve the performance of organic cotton. More agricultural research is needed to remove the various constraints to organic cotton production and implement more productive sustainable practices.

6. Conclusions

This study estimates the environmental efficiency of organic and conventional cotton production methods in Benin as well as the factors affecting the level of environmental inefficiency on farms. The Translog hyperbolic distance function, that treats joint production of cotton yield and GHGs emission is used. In this study, the GHGs emission of cotton farming has been incorporating in the model as undesirable output. In addition, the elasticities of desirable output with respect to inputs on the one hand and with respect to the undesirable product on the other hand, and the shadow price of undesirable output, were also estimated.
The results showed that cotton producers in Benin are environmentally inefficient. Inefficiency is even higher with organic production methods. Indeed, the environmental efficiency levels are 85% and 78% for conventional and organic cotton respectively. Although organic cotton contributes to a reduction in GHG emissions, the low level of environmental efficiency reflects inefficiency in productive resource management. Further efforts on organic practices could contribute to increasing yields through better soil fertility and pest management. The different results of the model on the substitution between desirable and undesirable output showed the potential of organic cotton as an alternative for conventional cotton.
The opportunity cost of GHG emissions is estimated at 74 Franc CFA/kg (0.12$/kg) and 115 Franc CFA/kg (0.20$/kg) for organic and conventional cotton respectively. Thus, conventional cotton producers would face higher opportunity costs than organic cotton producers. In addition, the opportunity cost of emissions is higher at the level of small and medium-sized farms for organic cotton and conventional cotton respectively. Considering the determinants of inefficiency, the results show that contact with extension, access to credit, access to information on the environmental effects of cotton production practices and experience in cotton production reduce the level of environmental inefficiency of producers while the age of producers has an opposite effect.
These various results lead to political interventions in support of both the organic and conventional sectors in order to support producers in adopting sustainable practices that are more environmentally friendly while improving their level of productivity. These policies must focus their actions on small farms, particularly in the organic sector, to improve their level of environmental efficiency and competitiveness, since they face the highest opportunity costs. These political actions could involve raising producers’ awareness of the importance of taking the environment into account in their production decisions. They would also require the technical support of producers through strong extension services to provide information on the different practices that can reduce the level of environmental pollution and improve productivity and environmental efficiency with a view to promoting sustainable intensification of cotton production in Benin.
Specifically, for organic cotton, there are additional agronomic challenges. Agricultural research in Benin could focus their action on organic practices methods in order to increase the productivity and the production of organic farms. Therefore, support for research institutes is required for in-depth research on sustainable soil fertility and pest management technologies. Furthermore, the main constraints that limit the productivity of organic cotton production must be documented in order to better understand the production environment and to enhance the performance of the sector.

Author Contributions

This study is a part of R.D.C.B.-z. PhD thesis. It is supervised by K.A. in co-supervision with A.F., R.D.C.B.-z.; K.A., A.F. contributed significantly to the implementation of the study through the research design conceptualization and validation. Research methodology, formal analysis and the writing of original draft were done by R.D.C.B.-z. The final manuscript was read by all the authors.

Funding

This research was funded by CINOP, a consulting support agency for innovation and education that implements a project of NUFFIC, an agency of Netherlands government, for capacity building at the University of Parakou in Benin.

Acknowledgments

Researchers are grateful to the Agricultural Policy Analysis Program (PAPA) of the National Institute of Agricultural of Benin (INRAB) which provided technical support and contribute to data collection.

Conflicts of Interest

The authors declare no conflict of interest

References

  1. Mondelaers, K.; Aertsens, J.; Van Huylenbroeck, G. Meta-analysis of the differences in environmental impacts between organic and conventional farming. Br. Food J. 2009, 111, 1098–1119. [Google Scholar] [CrossRef]
  2. Relyea, R. The impact of insecticides and herbicides on the biodiversity and productivity of aquatic communities. Ecol. Appl. 2005, 15, 618–627. [Google Scholar] [CrossRef]
  3. Trang, N.; Khai, H.; Tu, H.; Hong, N. Environmental efficiency of transformed farming systems: A case study of change from sugarcane to shrimp in the vietnamese mekong delta. For. Res. Eng. Int. J. 2018, 2, 54–60. [Google Scholar]
  4. Seufert, V.; Ramankutty, N.; Foley, J. Comparing the yields of organic and conventional agriculture. Nature 2012, 485, 229–232. [Google Scholar] [CrossRef] [PubMed]
  5. IFOAM, (International Federation of Organic Agriculture Movements). Resource Efficiency and Organic Frming: Facing Up to the Challenge; IFOAM EU Group: Belgium, Brussel, 2011. [Google Scholar]
  6. Marchand, S.; Guo, H. The environmental efficiency of non-certified organic farming in China: A case study of paddy rice production. China Econ. Rev. 2014, 31, 201–2016. [Google Scholar] [CrossRef]
  7. Reganold, J.P.; Wachter, J.M. Organic agriculture in the twenty-first century. Nat. Plants 2016, 2, 15221. [Google Scholar] [CrossRef]
  8. Aldanondo-Ochoa, A.; Casasnovas-Olivia, V.L.; Arandia-Miura, A. Environmental efficiency and the impact of regulation in dryland organic vine production. Land Use Policy 2014, 36, 275–284. [Google Scholar] [CrossRef]
  9. Ba, A.; Barbier, B. Economic and Environmental Performances of Organic Farming System Compared to Conventional Farming System: A Case Farm Model to Simulate the Horticultural Sector of the Niayes Region in Senegal. J. Hortic. 2015, 2, 1–10. [Google Scholar] [CrossRef]
  10. Tongwane, M.; Moeletsi, M. A review of greenhouse gas emissions from the agriculture sector in Africa. Agric. Syst. 2018, 166, 124–134. [Google Scholar] [CrossRef]
  11. FAO (Food and Agriculture Organisation). Organic Agriculture and Climate Change Mitigation: A Report of the Round Table on Organic Agriculture and Climate Change; Food and Agriculture Organization of the United Nations (FAO), Natural Resources Management and Environment Department: Rome, Italy, 2011. [Google Scholar]
  12. Ba, M. Analysis of Agricultural Commodities Value Chains and Greenhouse Gas Emission in Rice and Maize in West Africa: Impact on Food Security. Agric. Sci. 2016, 7, 457–468. [Google Scholar] [CrossRef] [Green Version]
  13. Njuki, E.; Bravo-Ureta, B.; Mukherjee, D. The Good and the Bad: Environmental Ef ciency in Northeastern U.S. Dairy Farm. Agric. Resour. Econ. Rev. 2016, 45, 22–43. [Google Scholar] [CrossRef]
  14. ICAC (International Cotton Advisory Committee). Measuring Sustainability in Cotton Farming Systems Towards a Guidance Framework; International Cotton Advisory Committee: Washington, DC, USA, 2015.
  15. Kpadé, P.C. Adaptation de la Coordination et Nouvelles Contradictions entre Acteurs du système coton au Bénin face à la Libéralisation Économique. Thèse de Doctorat, Université de Bourgogne, Science Économique, Dijon, France, 2011. [Google Scholar]
  16. PASCiB (Plateforme des Acteurs de la Société Civile du Bénin). La Filière coton au Bénin: Regard et Analyses Prospectives de la Société Civile; PASCiB: Cotonou, Bénin, 2013. [Google Scholar]
  17. MAEP (Ministère de l’Agriculture de l’Elevage et de la Pêche). Plan Stratégique de Relance du Secteur Agricole (PSRSA) au Bénin; MAEP: Cotonou, Bénin, 2000. [Google Scholar]
  18. Bonou-zin, D.C.R.; Allali, K.; Tovignan, D.S.; Yabi, A.J.; Houessionon, P. Drivers of Farmers’ Perception of the Environmental Externalities of Cotton Production Practices in Benin: A Tobit Analysis. J. Agric. Environ. Sci. 2019, 7, 120–130. [Google Scholar] [CrossRef]
  19. Sodjinou, E.; Glin, L.C.; Nicolay, G.; Tovignan, S.; Hinvi, J. Socioeconomic determinants of organic cotton adoption in Benin, West Africa. Agric. Food Econ. 2015, 3, 1–22. [Google Scholar] [CrossRef]
  20. Honfoga, B.G. Diagnosing soil degradation and fertilizer use relationship for sustainable cotton production in Benin. Cogent Environ. Sci. 2018, 4, 1422366. [Google Scholar] [CrossRef]
  21. Kumbhakar, S.; Orea, L.; Tsionas, E.; Rodriguez-Alavez, A. Do we estimate an input or an output distance function? An application of the mixture approach to European railways. J. Product. Anal. 2007, 27, 87–100. [Google Scholar] [CrossRef]
  22. Cuesta, R.; Lovell, C.; Zofio, J. Environmental efficiency measurement with Translog distance functions: A parametric approach. Ecol. Econ. 2009, 68, 2232–2242. [Google Scholar] [CrossRef]
  23. Färe, R.; Grosskopf, S.; Lovell, C.; Pasurka, C. Multilateral productivity comparisons when some outputs are undesirable: A nonparametric approach. Rev. Econ. Stat. 1989, 78, 90–98. [Google Scholar] [CrossRef]
  24. Chung, Y.; Färe, R.; Grosskopf, S. Productivity and undesirable outputs: A directional distance function approach. J. Environ. Manag. 1997, 51, 229–240. [Google Scholar] [CrossRef]
  25. Färe, R.; Grosskopf, S.; Noh, D.-W.; Weber, W. Characteristics of a polluting technology: Theory and practice. J. Econom. 2005, 126, 469–492. [Google Scholar] [CrossRef]
  26. Sodjinou, E. Poultry-Based Intervention as Tool for Poverty Reduction and Gender Empowerment: Empirical Evidence from Benin. Ph.D. Thesis, Institute of Food and Resource Economics, Faculty of Life Sciences, University of Copenhagen, Copenhagen, Denmark, 2011. [Google Scholar]
  27. Färe, R.; Primont, D. Multi-Output Production and Duality: Theory and Applications; Kluwer Academic Publishers: Dordrecht, The Netherlands, 1995. [Google Scholar]
  28. Fare, R.; Grosskopf, S.; Lovell, C.A.; Yaisawarng, S. Derivation of Shadow Prices for Undesirable Outputs: A Distance Function Approach. Rev. Econ. Stat. 1993, 75, 374–380. [Google Scholar] [CrossRef]
  29. Kumbhakar, S.; Wang, H.-J.; Horncastle, A. A Practitioner’s Guide to Stochastic Frontier Analysis Using Stata; Cambridge University Press: New York, NY, USA, 2015. [Google Scholar]
  30. Kumbhakar, S.; Ghosh, S.; Mucguckin, J.T. A generalized production frontier approach for estimating determinants of inefficiency in U.S. dairy farm. J. Bus. Econ. Stat. 1991, 9, 279–286. [Google Scholar]
  31. Battese, G.; Coelli, T. A model for technical inefficiency effect in a stochastic frontier production function for panel data. Empir. Econ. 1995, 20, 325–332. [Google Scholar] [CrossRef]
  32. Alamu, B.A.; Nuppenau, E.-A.; Boland, H. Technical Efficiency of Farming Systems across Agro-ecological Zones in Ethiopia: An Application of Stochastic Frontier Analysis. 2009. Available online: http://www.csae.ox.ac.uk/conferences/2009-EDiA/papers/030-Alemu.pdf (accessed on 11 March 2019).
  33. Ndambiri, H.K.; Ritho, C.; Mbogoh, S.; Ng’ang’a, S.I.; Muiruri, E.J.; Nyangweso, P.; Cherotwo, F.H. Analysis of Farmers’ Perceptions of the Effects of Climate Change in Kenya: The Case of Kyuso District. J. Environ. Earth Sci. 2012, 2, 74–81. [Google Scholar]
  34. Rahman, S. Environmental impacts of modern agricultural technology diffusion in Bangladesh: An analysis of farmers’ perceptions and their determinants. J. Environ. Manag. 2003, 68, 183–191. [Google Scholar] [CrossRef]
  35. Dyer, J.; Desjardins, R. Carbon dioxide emissions associated with the manufacturing of tractors and farm machinery in Canada. Biosyst. Eng. 2006, 93, 107–118. [Google Scholar] [CrossRef]
  36. Kramer, K.; Moll, H.; Nonhebel, S. Total greenhouse gas emissions related to the Dutch crop production system. Agric. Ecosyst. Environ. 1999, 72, 9–16. [Google Scholar] [CrossRef]
  37. Macedo, I.; Seabra, J.; Silva, J. Greenhouse gases emissions in the production and use of ethanol from sugarcane in Brazil: The 2005/2006 averages and a prediction for 2020. Biomass Bioenergy 2008, 32, 582–595. [Google Scholar] [CrossRef]
  38. Xiaomei, L.; Kotelko, M. An integrated manure utilization system (imus): Its social and environmental benefits. Lecture No.: AG056. In Proceedings of the 3rd International Methane and Nitrous Oxide Mitigation Conference, Beijing, China, 17–21 November 2003. [Google Scholar]
  39. IPCC, (Intergouvernemental Panel on Climate Change). IPCC Guidelines for National Greenhouse Gas Inventories Prepared by the National Greenhouse Gas Inventories; Eggleston, H.S., Buendia, L., Miwa, K., Ngara, T., Tanabe, K., Eds.; Institute for Global Environmental Strategies: Tokyo, Japan, 2006. [Google Scholar]
  40. Audsley, E.; Stacey, K.; Parsons, D.; Williams, A. Estimation of the Greenhouse Gas Emissions from Agricultural Pesticide Manufacture and Use; Prepared for Crop Protection Association; Cranfield University: Silsoe, UK, 2009. [Google Scholar]
  41. IPCC, (Intergouvernemental Panel on Climate Change). Climate Change 2007: Synthesis Report. Contribution of Working Groups I, II and III to the Fourth Assessment; Pachauri, R.K., Reisinger, A., Eds.; Intergovernmental Panel on Climate Change: Geneva, Switzerland, 2007. [Google Scholar]
  42. Kodde, D.; Palm, F. Wald criteria for jointly testing equality and inequality restriction. Econometrica 1986, 50, 1243–1248. [Google Scholar] [CrossRef]
  43. Jouzi, Z.; Azadi, H.; Taheri, F.; Zarafshani, K.; Gebrehiwot, K.; Van Passel, S.; Lebailly, P. Organic Farming and Small-Scale Farmers: Main Opportunities and Challenges. Ecol. Econ. 2017, 132, 144–154. [Google Scholar] [CrossRef] [Green Version]
  44. Dal Ferro, N.; Zanin, G.; Borin, M. Crop yield and energy use in organic and conventional farming: A case study in north-east Italy. Eur. J. Agron. 2017, 86, 37–47. [Google Scholar] [CrossRef]
  45. Kirchmann, H.; Bergström, L.; Kätterer, T.; Andrén, O.; Andersson, R. Can organic crop production feed the world. In Organic Crop Production—Ambitions and Limitations; Kirchmann, H., Bergström, L., Eds.; Springer: Doordrecht, The Netherlands, 2008; pp. 39–72. [Google Scholar]
  46. Omotayo, O.E.; Chukwuka, K.S. Soil fertility restoration techniques in Sub- Saharan Africa using organic resources. Review. Afr. J. Agric. Res. 2009, 4, 144–150. [Google Scholar]
  47. Amouzou, K.; Naab, J.; Lamers, J.; Becker, M. Productivity and nutrient use efficiency of maize, sorghum, and cotton in the West African Dry Savanna. J. Plant Nutr. Soil Sci. 2018, 181, 261–274. [Google Scholar] [CrossRef]
  48. Serra, T.; Goodwin, B. The efficiency of Spanish arable crop organic farms, a local maximum likelihood approach. J. Produat. Anal. 2009, 31, 113–124. [Google Scholar] [CrossRef]
  49. Tan, S.; Heerink, N.; Kuyvenhoven, A.; Qu, F. Impact of land fragmentation on rice producers’ technical efficiency. NJAS Wagening. J. Life Sci. 2010, 57, 117–123. [Google Scholar] [CrossRef]
  50. Kroupova, Z.; Cechura, L.; Havlikova, M.; Halova, P.; Maly, M. Shadow prices of greenhouse gas emissions: An application to the Czech dairy production. Agric. Econ. Czech 2018, 64, 291–300. [Google Scholar] [Green Version]
  51. Kantelhardt, J.; Eckstein, K.; Hoffmann, H. Assessing programs for the provision of agri-environmental services—An efficiency analysis realized in Southern Germany. In Proceedings of the Conference of the International Association of Agricultural Economists (IAAE), Beijing, China, 16–22 August 2009; p. 13. [Google Scholar]
Figure 1. Distribution of environmental efficiency index.
Sustainability 11 03044 g001
Table 1. Variables introduced in the model with an expected sign on the efficiency factor.
VariablesTypeModalitySign
AgeContinuous +
GenderBinary0 = Female, 1 = Male+
Year of schoolingContinuous +
Experience in cotton productionContinuous +
Contact with extension servicesBinary0 = No, 1 = Yes+
Access to agricultural creditBinary0 = No, 1 = Yes+
Access to information on environmental effects of cotton practicesBinary0 = No, 1 = Yes+
Training on agricultural practicesBinary0 = No, 1 = Yes+
Soil fertility level assessmentBinary0 = Poor, 1 = Fertile+
Table 2. Greenhouse Gas (GHG) emission coefficient of agricultural inputs.
InputUnitg/Unit(kg/Unit)Source
CO2N2OCH4CO2e
MachineryMj71--0.071[35]
Diesel fuell35600.75.23.8862[36]
Gasolinel3393 3.393[37]
Organic fertilizerkg126--0.126[38]
N kg3970 3.97[37]
Pkg10000.021.81.3[37]
Kkg7000.0110.710[37]
N_ureakg1595.6 1.5956[39] *
Direct emission (N)kg 15.7 0.3768[39] *
Volatilization (N)kg 1.96 0.0470[39] *
Runoff (N)kg 3.53 0.0847[39] *
Herbicide 2960 29.6[40]
Insecticidekg2139--21.39[40]
Potentialkg124310 [41]
* Calculate from the reference.
Table 3. Socio-economic characteristics of organic and conventional cotton producers.
Socio-economics CharacteristicsOrganicConventionalTotalStatistic Test
Age of producer42.16 (10.76)44.14 (12.12)43.14 (11.48)1.63 *
Formal education2.45 (4.19)3.96 (4.82)3.19 (4.57)3.15 ***
Experience in cotton production12.36 (9.42)18.7 (9.9)15.48 (10.15)6.18 ***
Gender of producer (% male)7599.48746.94 ***
Access to Credit (%)3.930.917.245.34 ***
soil fertility (%)32.622.227.34.78 **
Contact with extension agent (%)28.320.624.52.88 *
Access to information on the environmental effect of cotton practices (%)41.717.829.640.44 ***
Training on agricultural practice (%)14.49.111.82.39
() standard deviation; * signification at 10%; ** signification at 5% and *** signification at 1%.
Table 4. Input quantity used in organic and conventional cotton farms.
InputsOrganicConventionalTotalt-Student
cotton area (Hectare)1.29 (1.06)8.52 (10.06)4.85 (7.96)9.57 ***
Seed (kg/ha)29.75 (11.29)29.23 (10.80)29.49 (11.04)0.44
chemical fertilizer (kg/ha)0211.55 (71.29)104.29 (117.12)39.81 ***
organic fertilizer (kg/ha)2227.55 (3977.71)465.94 (1134.71)1359.15 (3067.77)5.64 ***
chemical pesticides (l/ha)08.19 (4.08)8.19 (4.04)3.5 ***
organic pesticide (l/ha)21.54 (50.24)021.54 (36.46)3.5 ***
human labor (man hour/ha)777.40 (929.05)887.90 (1128.08)831.87 (1031.99)1
cotton yield (kg/ha)924.27 (326.30)1230.47 (297.79)1075.21 (347.75)9.22 ***
GHG (kg CO2e/ha)462.65 (580.74)882.06 (357.98)669.40 (526.89)8.16 ***
() standard deviation; * signification at 10%; ** signification at 5% and *** signification at 1%.
Table 5. Result of parameters estimation and t statistic.
VariablesCoefficientst-Testp Value
Seed0.950 (0.770)1.230.218
Chemical fertilizer−1.196 (0.149) ***−8.010.000
Organic fertilizer−0.244 (0.080) ***−3.030.002
Pesticide0.379 (0.223) *1.700.089
Labor−0.666 (0.217) ***−3.060.002
GHGs0.891 (0.315) ***2.830.005
Seed2−0.350 (0.180) **−1.940.052
Chemical fertilizer 2−0.191 (0.029) ***−6.490.000
Organic fertilizer 2−0.042 (0.006) ***−7.100.000
Pesticide 20.015 (0.021)0.690.493
Labor 2−0.016 (0.019)−0.790.431
GHGs 2−0.068 (0.025) ***−2.700.007
Seed * Chemical fertilizer0.020 (0.021)0.970.330
Seed * Organic fertilizer0.004 (0.012)0.300.761
Seed * Pesticide0.087 (0.041) **2.140.032
Seed * Main d’œuvre0.050 (0.041)1.230.220
Seed * GES−0.029 (0.048)−0.610.539
Chemical fertilizer *Engrais organique−0.006 (0.002) **−2.490.013
Chemical fertilizer * Pesticide0.005 (0.012)0.460.648
Chemical fertilizer * Labor−0.002 (0.008)−0.220.827
Chemical fertilizer * GES0.117 (0.013) ***9.180.000
Organic fertilizer * Pesticide0.004 (0.007)0.520.601
Organic fertilizer * Labor−0.005 (0.005)−1.030.302
Organic fertilizer * GES0.029 (0.007) ***4.260.000
Pesticide * Labor−0.024 (0.018)−1.370.170
Pesticide * GES−0.043 (0.015) ***−2.880.004
Labor * GES0.049 (0.015) ***3.230.001
Constant1.091 (2.460)0.440.657
Sigmau_20.075 (0.014) ***5.31
Sigmav_20.017 (0.003) ***4.44
LR test16.69 ***
Inefficiency factors Marginal effect
Age0.026 (0.012) **2.230.003
Year of schooling0.023 (0.024)0.970.003
Gender of cotton farmer (Male)−0.208 (0.313)−0.66−0.023
Contact with extension services−0.440 (0.243) *−1.81−0.049
Access to agricultural credit−0.854 (0.319) ***−2.67−0.09
Training on agricultural practice0.251 (0.313)−0.80−0.028
Access to information on environmental effect of cotton practices−0.445 (0.158) ***−2.27−0.049
Soil fertility−1.863 (0.821)−2.81−0.207
Experience in cotton production−0.028 (0.01) **−1.99−0.003
constant−0.161 (1.019)−0.16
() standard errors; * signification at 10%; ** signification at 5% and *** signification at 1%.
Table 6. Input elasticity and undesirable output elasticity.
Input ElasticityOrganicConventionalTotalt-Test
Seed−0.079 (0.149)−0.012 (0.127)−0.463 (0.142)4.49 ***
Chemical fertilizer −0.488 (0.003)
Organic fertilizer−0.114 (0.106)0.022 (0.124)−0.468 (0.1341)11.13 ***
Pesticides (Bio)0.075 (0.047)0.019 (0.031)0.048 (0.048)−13.11 **
Human labor−0.021 (0.030)0.062 (0.030)0.083 (0.073516.65 ***
GHGs0.314 (0.091)0.769 (0.10)0.538 (0.247)44.72 ***
() standard deviation; ** signification at 5% and *** signification at 1%.
Table 7. Shadow price of GHGs (Franc CFA/kg, 1$ = 585 Franc cfa; 1£ = 661 Franc cfa).
Farm TypeOrganicConventionalTotal
Small84.64 (6.24)113.94 (8.20)110.03 (12.93)
Medium74.47 (17.78)115.18 (8.28)93.77 (24.75)
Large69.02 (14.90)111.53 (8.83)90.28 (24.73)
Total74.10 (17.51)114.76 (8.34)94.14 (24.57)
() standard deviation.
Table 8. Environmental efficiency of organic and conventional cotton.
Efficiency IndexOrganicConventionalTotalt-Test
Inefficiency0.263 (0.207)0.164 (0.088)0.214 (0.197)−5.79 ***
Environemental efficiency0.786 (0.137)0.854 (0.068)0.819 (0.114)17.24 ***
() standard deviation; ** signification at 5% and *** signification at 1%.
Table 9. Environmental efficiency of organic and conventional cotton by farm size.
Farm SizeOrganicConventionalTotal
Small0.66 (0.32)0.80 (0.11)0.78 (0.14)
Medium0.79 (0.13)0.85 (0.06)0.82 (0.11)
Large0.72 (0.16)0.88 (0.04)0.80 (0.13)
Total0.78 (0.14)0.85 (0.06)0.81 (0.11)
() standard deviation.

