Article

The Effect of Soundscapes and Lightscapes on the Perception of Safety and Social Presence Analyzed in a Laboratory Experiment

1
Department of Architecture and Design, Politecnico di Torino, 10129 Torino, Italy
2
Department of Energy, Politecnico di Torino, 10129 Torino, Italy
3
Institute for Environmental Design and Engineering, University College London, London WC1H 0NN, UK
*
Author to whom correspondence should be addressed.
Sustainability 2019, 11(11), 3000; https://doi.org/10.3390/su11113000
Submission received: 31 March 2019 / Revised: 2 May 2019 / Accepted: 23 May 2019 / Published: 28 May 2019
(This article belongs to the Special Issue Walkable living environments)

Abstract

:
The present study evaluates the effect of soundscape and lightscape variations on the perceived safety and perceived social presence in a pedestrian area through laboratory experiments. Thirty-one participants were presented with nine different virtual scenarios, in which the same underpass was reproduced under different soundscape and lightscape conditions. The participants were asked to assess each scenario considering 10 items related to perceived safety and perceived social presence. A principal component analysis allowed the 10 items to be reduced to two principal components, namely “perceived safety” and “perceived social presence”. A two-way repeated measures ANOVA analysis was conducted to assess the effect of modifications of both the soundscape and lightscape on the two components. The obtained results showed that the soundscape had an effect on both the perceived safety (p < 0.05) and perceived social presence (p < 0.05), while the lightscape variations implemented in this experiment only had a statistically significant effect on the latter (p < 0.05). The results of such studies may be of interest for public design and management as they may be conducted by means of non-intrusive and cost-effective techniques.

1. Introduction

Interest in the perceptual aspects of urban space first emerged several centuries ago, when Leon Battista Alberti, in the 15th century, studied the concept of a “city as a scene” and interpreted an urban space as a scenography connected to medieval religious traditions [1].
In the second half of the 20th century, in the same period in which Gordon Cullen was rediscovering this visual approach to a city through the concept of serial visions [2], Kevin Lynch expanded the perceptual aspect field to other sensory modalities [3,4]. He in fact investigated “the immediate experiential qualities of places—which he was fond of referring to as the ‘sensuous qualities’, or simply ‘sense’—and their importance in peoples’ lives.” [5]. With the perceptual form of the city project, Kevin Lynch and Gyorgy Kepes started one of the first pioneering studies on the sensorial experience of a city as a way of improving the capability of people to comprehend, use and enjoy public urban spaces [6]. In this context, Lynch’s student, Michael Southworth, then focused on the sound environment [7]
Despite the importance of such pioneering studies, little attention has been paid to other sensorial aspects, apart from vision, in the field of urban planning and urban space design, where, as stated by Rogerson and Rice [8], “most continue to see such guidance as form, giving shape to the space and thus enabling and supporting the occurrence of activity and function. In so doing, however, many of the sensory dimensions are often lost.”.
Nevertheless, in recent years, a significant number of researches have explored the sensorial experience and understanding of people pertaining to urban environments, and the influence that different perceptual aspects can have on the assessment and use of outdoor public spaces, with the aim of providing new indications for design and planning practices [9,10,11]. Some recent studies have in fact focused on a combination of sound- and light-walk to evaluate the perception of outdoor areas at night time [12]. Some of the studies on the perception of outdoor spaces have been directed towards evaluating its influence on contrasting the formation of no-go areas through the enhancement of perceived safety and the mitigation of anti-social behavior. In such spaces, the environmental manipulation of sound and light has been studied as a way of acting on the presence and behavior of people and therefore of enhancing the creation of what Newman [13] described as “defensible spaces”, i.e., city spaces that can become livable and controlled not by the police, but by a community of people sharing a common terrain.
The perception of the outdoor environment has been assessed in recent studies with specific reference to the university campus [14] as “a focal point in the everyday behaviour of students” [15], which can have an important influence on the quality of life of students. However, very few of these studies have assessed outdoor campus areas with specific focus on the perception of safety and social presence [16,17,18].

1.1. Soundscape and Safety Perception

The effect of a soundscape on people’s behavior was initially studied by researchers who assessed the effects of background music on employees’ mood and productivity, and on customers’ purchases in different work environments [19,20]. However, in the last few decades, due to the growing interest in soundscape studies [21,22] for the design of public urban spaces (see the work of Kang et al. [23] for a review of the studies conducted on the soundscape of the built environment), the studies on the effect of a soundscape and of its manipulation on people’s behavior have been extended to include outdoor public spaces [24,25,26,27,28]. Such effects become of particular importance when dealing with the mitigation of anti-social behavior and the regeneration of “no-go” areas.
A pilot study conducted in Brighton and Hove (England) through the real-time analysis of body language and the behavior of people walking through a 3D sound-art installation showed that soundscape manipulation can reduce tension and mitigate aggressive behavior, and can hence reduce the possibility of violent events [29]. A subsequent in situ experiment, conducted by the same authors, indicated that background music led to a decrease in the walking speed and an increase in loitering phenomena in a pedestrian subway [30,31].
Aletta et al. [16] conducted a similar in situ experiment in a pedestrian passage in the Sheffield University campus (UK), in which background music was played through loudspeakers, and the number of passers-by and the amount of time they spent in the passageway were monitored through camera recordings. The results revealed that, although the number of people stopping in the passage did not vary according to the different soundscape conditions (no music, classical background music, jazz background music), the presence of music did lead to an increase in the average time spent in the passageway.
In addition to the resort to in situ behavioral observations, other studies have used survey methods to investigate the influence of background music on the perception of safety and social presence in public places. Schafer et al. [32], using a soundscape excerpt reproduced in a laboratory environment, showed that participants rated music scenarios as more reassuring than natural sounds or silence. Sayin et al. [33] asked participants to respond to a 10-item questionnaire on perceived safety and social presence after watching videos of a car park and of a metro station filmed by a subjective camera, which included realistic environmental sounds (e.g., the participants’ own steps). The soundscape of each video was varied over four different conditions: Instrumental music, vocal sounds, bird songs and silence. The participants judged the scenario with background vocal music as being safer than the other scenarios and stated that the music would encourage them to frequent the place.
Finally, Astolfi et al. [17] conducted a laboratory experiment in which different soundscape scenarios were tested in the same pedestrian passageway used by Aletta et al. [16] for in situ measurements, and measured the perception of safety and social presence using the set of questions reported in Sayin et al. [33]. The results showed that music scenarios significantly increased the perception of safety and social presence, compared to a control condition (i.e., traffic background noise), and jazz music resulted in having a greater impact on social presence than classical music.

1.2. Lightscape and Safety Perception

According to Cozens et al. [34], interest in the relationship between lighting and safety began in the 1960s, when major lighting improvement schemes were implemented in cities in the United States to reduce street crime. Since then, several studies have been carried out to investigate the relationship between road lighting and perceived safety and, as a general result, they have demonstrated that improved lighting reduces the fear of crime in city residents and increases the feeling of safety in people walking along a road [35,36]. Literature reviews on this topic have confirmed this result. Welsh and Farrington [37] analyzed 13 studies on improvements in road lighting with before-and-after measurements of crime and, although in some cases lighting did not seems to be effective, the overall reduction in crime after lighting improvements was estimated to be about 20%. Fotios, Unwin and Farall [38] deduced, from their literature review, that previous studies had provided evidence on the impact of lighting on pedestrian reassurance (a term used to encompass perceived safety and fear of crime), but they also highlighted the possibility that the procedures that had been used in the studies had led to such findings. In order to counterbalance this possibility, they carried out an experiment using an approach that avoided any direct emphasis on lighting or on fear, but the results confirmed the association of lighting with pedestrian reassurance.
Several characteristics of road lighting may influence one’s perception of safety: Boyce et al. [39] found that horizontal lighting influenced the perceived safety in car parks; semi cylindrical illuminance was found to be relevant for facial recognition [40], but the lamp spectrum and spatial distribution of light also seemed to affect the safety perception of users in outdoor spaces [38] as did the design of the space as a whole.
Nikunen and Korpela [41] indicated that changing the light focus, so that more visibility is given either to vegetation or artificial elements (i.e., car park and road), can have the same effect on perceived restorativeness, fear and the perception of presence as the modification of the actual content of the scene. Moreover, Cellucci et al. [42] showed that the pedestrians’ sense of security can be affected not only by lighting on the path itself, but also on the surrounding areas. Boomsma and Steg [43] showed that reducing street lighting did not automatically lead to a reduction in perceived social safety and low policy acceptance, which they found to also depend on the level of entrapment, i.e., the lack of escape routes detected in the area by the observer. Peña-Garcia et al. [36], in a study conducted with 275 in situ questionnaires pertaining to five different streets in Granada (Spain), showed that white light induces a greater sense of safety in people. Moreover, a light color also seems to affect the behavior of people in general, as white light, while permitting facial recognition in pedestrian areas, increases the sense of well-being, and even helps activate commerce and nightlife because of its excellent chromatic reproduction of the environment [44].
Finally, Di Stefano [45] conducted a laboratory experiment on the same pedestrian passageway evaluated by Astolfi et al. [46] in order to assess the influence of different lightscape scenarios on the perceived sense of safety and social presence, through the same set of questions that Sayin et al. used [33]. In the context of this research, perceived safety should have been interpreted as the feeling of not being in danger (e.g., because of violent or anti-social behavior), while social presence should have been interpreted as the feeling that a place was generally vibrant/lively because of human social activities and/or because it was frequented by other people [47]. Biocca et al. [48] defined social presence as “the sense of being together with another person”. They highlighted the fact that this sense may be perceived either as the real presence of humans and animals or as a simulation of their presence. Therefore, vocal (animal and human) sounds are potent social cues that “enhance the illusion of interaction with a social entity” [47]. Additionally, social presence is related to the perception of safety, since individuals feel safer in the presence of others, because they consider the possibility that others will act somehow if they need help [49]. Accordingly, the presence of others has a soothing effect under conditions of imminent threat and provides a sense of security [50].

1.3. Simulated Test Environments and Audio-Visual Interaction

In spite of the remarkable number of studies on the effect of perceptual aspects on the mitigation of stressful situations and anti-social behavior, the influence of the contemporary manipulation of lightscape and soundscape on perceived safety and social presence has as yet been somewhat understudied.
The mutual interaction between auditory and visual stimuli has recently been investigated with respect to a landscape and soundscape evaluation in urban scenarios [51,52,53], public spaces, such as a metro station [54] and the evaluation of elements with impact on soundscape and landscape, such as wind turbines [54] and noise barriers [55].
However, to the best of the authors’ knowledge, such an interaction has never been assessed with specific reference to the requalification of no-go areas and the related safety issues.
In order to allow for the evaluation of both aspects and to assess the combination of different possible soundscape and lightscape scenarios on the same urban environment, laboratory tests on simulated scenarios were conducted. Most of the aforementioned studies were in fact conducted through in situ experiments, which, although enhancing the ecological validity of the study, reduced the possibility of controlling for boundary conditions. Simulated scenarios, realized through photorealistic renderings and soundscape auralizations, are considered as a good compromise between similarity to in situ experiment and the possibility of testing different design options within short times and with no additional costs, while controlling for boundary conditions [56].

1.4. Objectives of the Study

The present study has investigated the use of both soundscape and lightscape manipulation as a measure to influence the perception of safety and social presence in a pedestrian passageway in a university campus, which had previously been the subject of in situ analysis in another study [16].
In a previous work, Astolfi et al. [17] assessed the studied environment through laboratory tests, focusing only on soundscape manipulation through background music and the placing of noise barriers on the road above the pedestrian passageway, while Di Stefano [45] conducted a parallel experiment on the same simulated environment, focusing on lightscape manipulation [46]. Building on these previous findings, the present study is aimed at evaluating the mutual influence of visual and auditory stimuli.

2. Materials and Methods
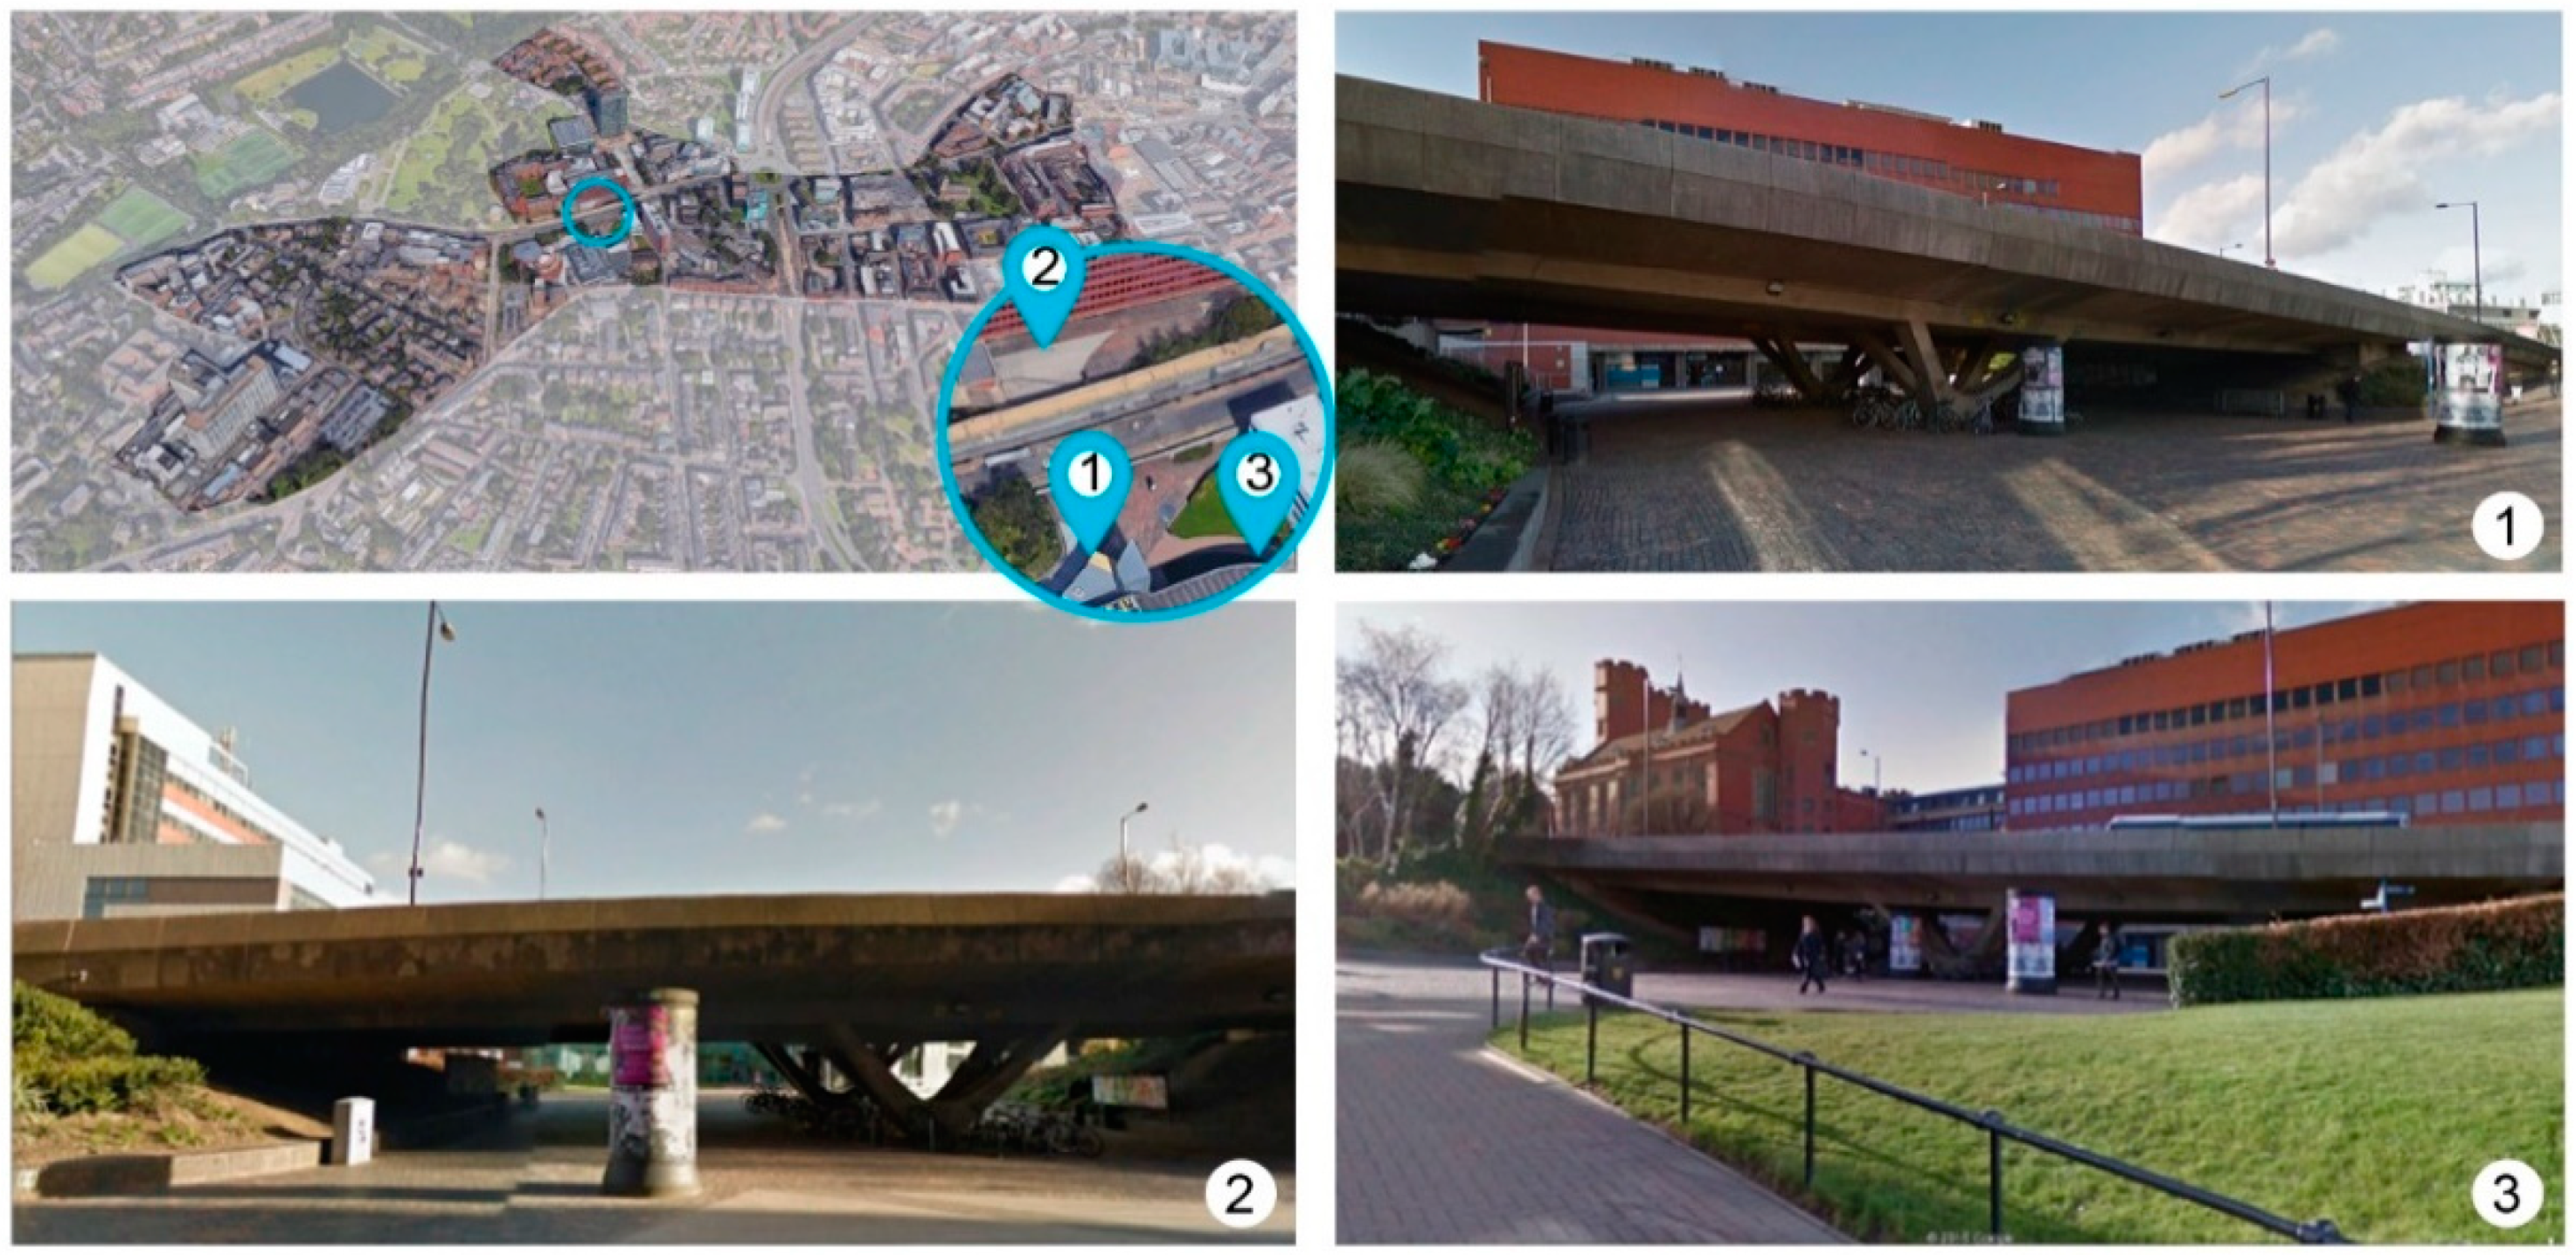
The present study has focused on the influence of soundscape and lightscape on the perception of safety and social presence in an outdoor pedestrian area. It was conducted through a laboratory test in which nine audio-visual scenarios were presented to the participants. Such scenarios were derived from a combination of three different auditory stimuli and three different visual stimuli, obtained from simulations performed with a 3D model of the real environment. The model had been realized through AutoCAD (v. 2014) software. Moreover, Odeon (v. 13) had been used for acoustic simulations and DIALux (v. N4.12), while 3D Studio Max (v. 2016) had been used for lighting simulations.

2.1. Case-Study

The area selected as a case study is a pedestrian passageway under a vehicular flyover, which is known as the “Concourse Bridge”, in the middle of the Sheffield University campus. The passageway is a crucial pedestrian connection between different parts of the campus, and had already been the subject of other in situ studies [16]. Despite its central position, with respect to the campus area, the passage is not particularly appealing. Figure 1 shows an aerial view of the university campus with an indication of the study area, together with some pictures of the Concourse Bridge.

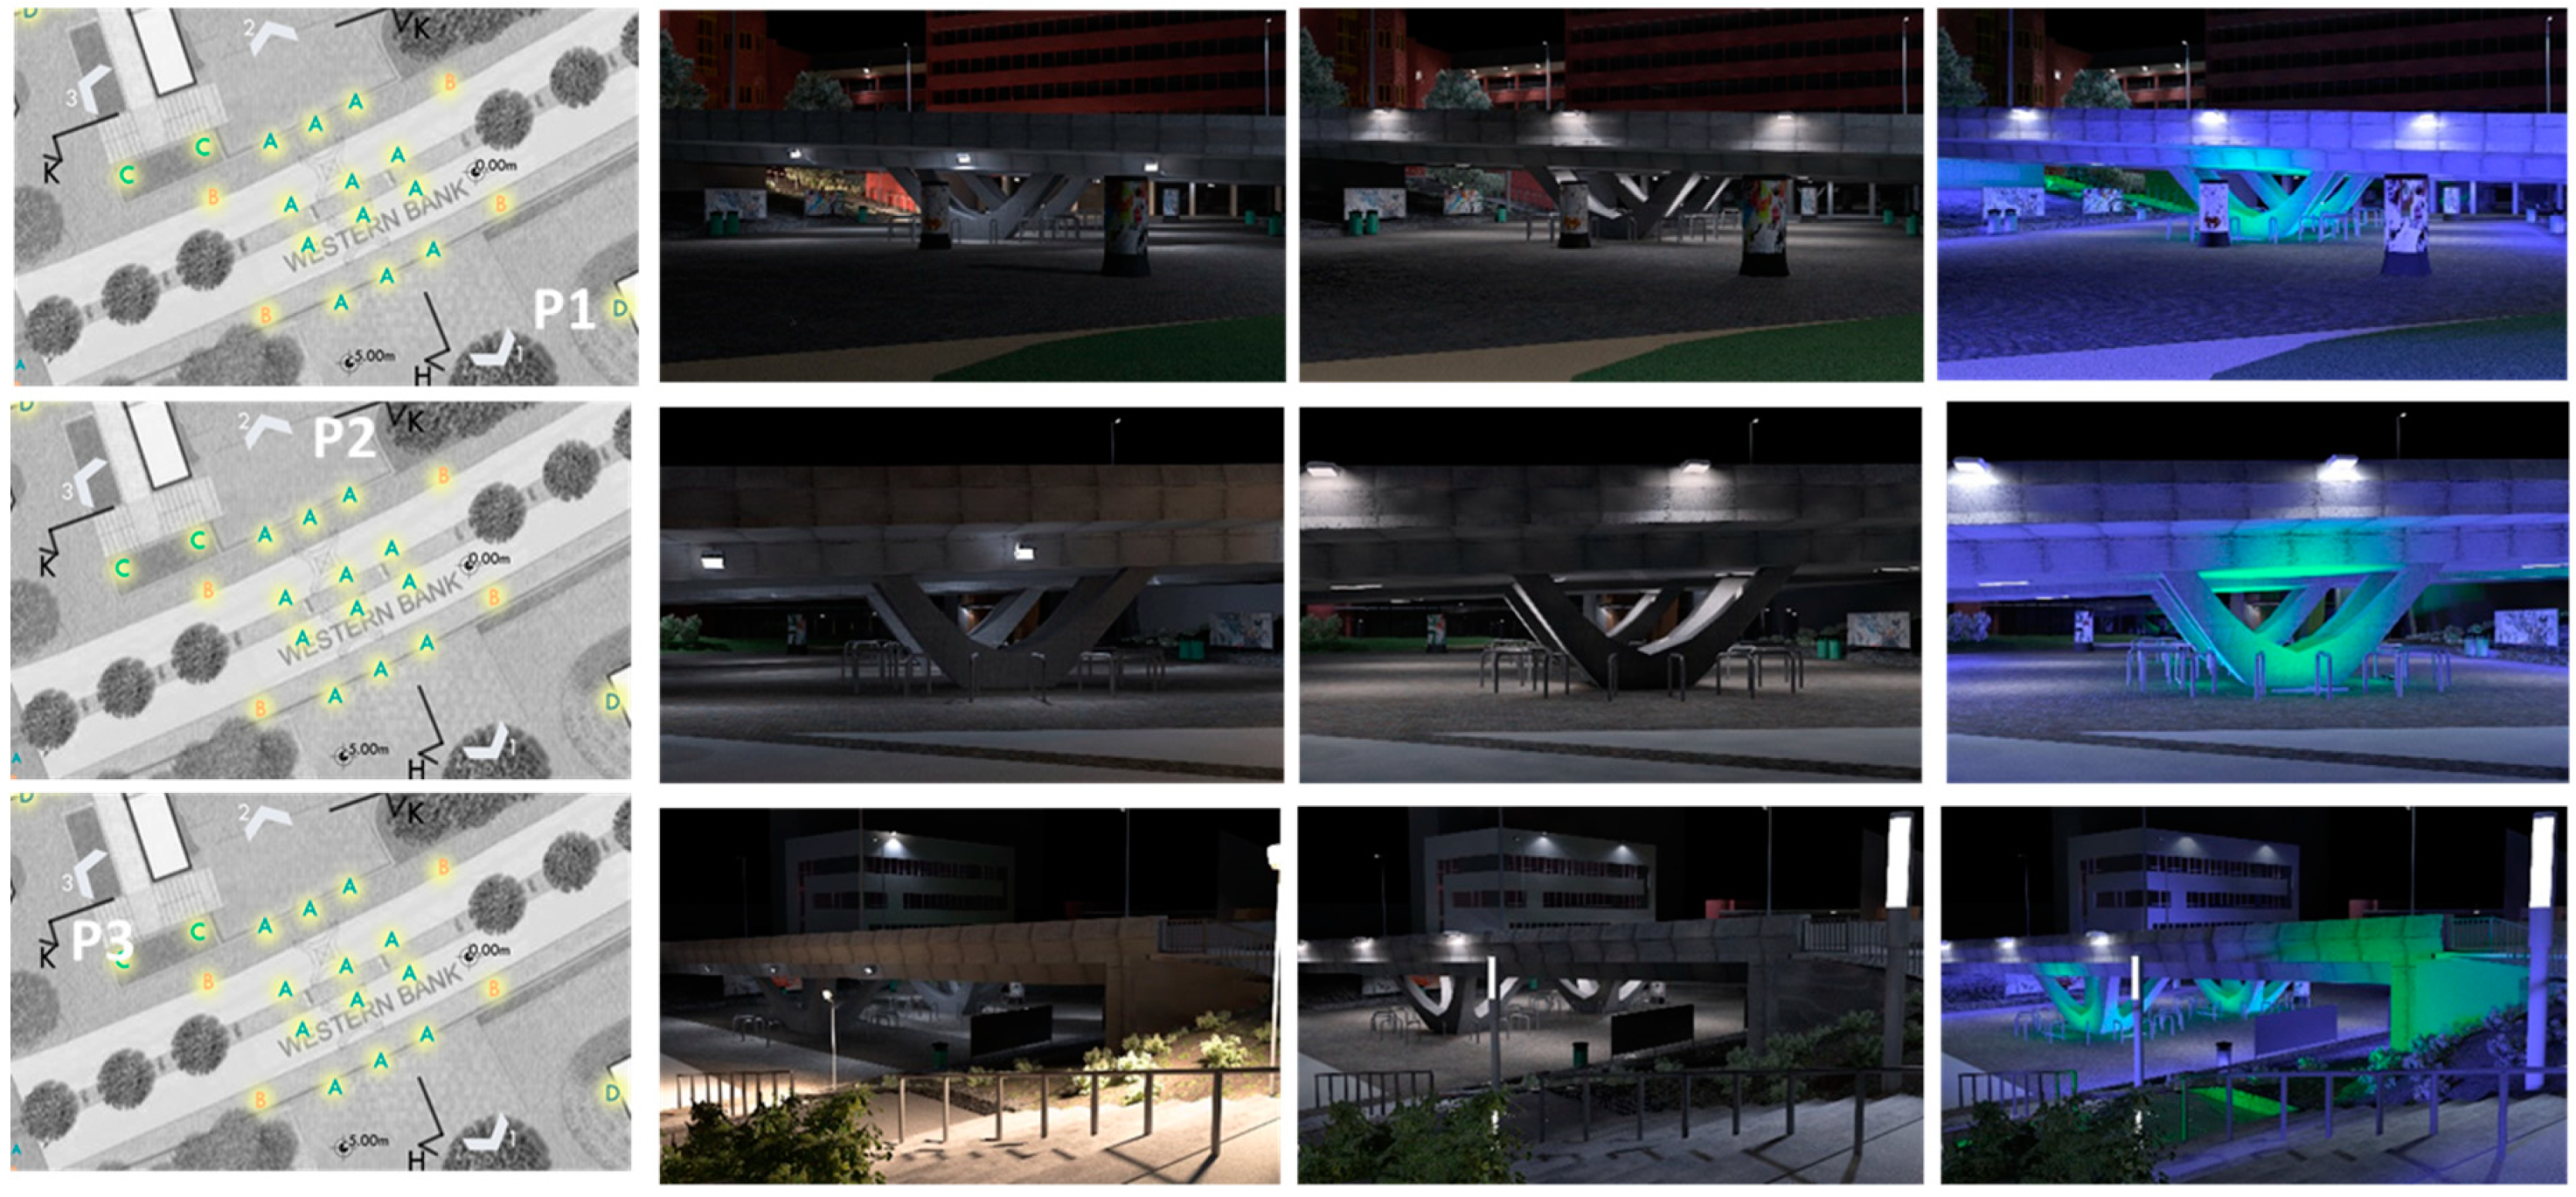
2.2. Lightscape Simulations

Lighting simulation is generally used for two different but correlated purposes: The calculation of lighting parameters, to quantify the performance of lighting projects and installations and to check their compliance with standards and requirements, and the rendering of the lighted scene, to allow a perceptual evaluation of the resulting environment.
However, the use of static or dynamic visualization of simulated environments in studies aimed at analyzing subjective responses can introduce potential errors, with respect to the experience of the real environment, as highlighted in previous studies [57]. However, the evolution of computer graphics and lighting simulation has increased the accuracy of both quantitative and qualitative results to a great extent, and this kind of approach can be particularly useful in laboratory tests and to compare different lighting scenarios of the same environment.
For this study, the visual experience of the night-time lightscape was reproduced using a detailed 3D model, created in AutoCAD and then imported into 3D Studio Max, to implement lighting simulation and visual rendering. Particular attention was paid to the reproduction of details and textures, which is necessary to increase the realism of the final renderings.
The first lighting scenario that was simulated was the current situation of the “Concourse Bridge” area; two different lighting retrofitting projects were then developed. Both solutions were designed to be compliant with the standard requirements of visibility in pedestrian areas. Furthermore, one of the two solutions was more oriented towards the improvement of the energy efficiency of the system (“functional” project), while the other was oriented towards the enhancement of the space appearance (“scenographic” project).
In the “functional” project hypothesis, energy-efficient LED luminaires with a color temperature of 4000 K were inserted into the model. Luminaires were placed along all the access and exit paths to the subway, with the purpose of creating an optical guide for users towards escape routes; the number of high-rise luminaires on the buildings was increased to improve lighting uniformity, and the lights under the bridge were replaced, shifted and rotated to lower the possibility of the disability glare phenomenon occurring thereby causing disorientation and discomfort for the pedestrians passing under the bridge. The focus in the “scenographic” project hypothesis was on the aesthetic aspect of the requalification of the appearance of the Concourse Bridge. Green and blue colored LED luminaires were inserted throughout the underpass, on the terrain along paths, stairs, and around the bridge pillars, and new lights were added to replace old sources under the bridge. Moreover, the number of luminaires on the top of the buildings in the area was increased to ensure a good uniformity of illumination. Figure 2 shows a picture of the current situation of the “Concourse Bridge” area and a scheme with the positions of the luminaires placed in the DIALux model in order to reproduce the present situation, the “functional” project and the “scenographic” project.
The three different lighting scenarios were initially simulated with DIALux (DIAL GmbH, 2011), a professional lighting design software, specifically developed to design and calculate the performance of indoor and outdoor lighting plants, and the resulting lighting installations were then included in the model and simulated with 3D Studio Max to obtain high quality renderings.
In order to evaluate the performance of the lighting plants, the parameters reported in the current EN 13201 Road Lighting standard—Part 2 [58] were considered. According to this standard, the Concourse Bridge can be defined as a pedestrian and cyclists area. The standard provides lighting requirements for this type of area in terms of average horizontal illuminance (Eav), minimum horizontal illuminance (Emin), semi-cylindrical illuminance (Esc) and illuminance uniformity (U).
The results from the DIALux simulations demonstrated that the existing lighting plant complies with the requirements of the standard, in terms of average horizontal and semi-cylindrical illuminance, but it fails to provide a uniform distribution of light, hence determining over-illuminated and under-illuminated zones over the whole area. On the other hand, the two retrofitting hypotheses comply with the requirements of the standard, in terms of average illuminance, and provide a more uniform illuminance distribution. Furthermore, according to the scope of the two retrofitting hypothesis, the “functional” project drastically increased the energy efficiency of the system (lighting power reduced from 42 KW to 2 KW), while the “scenographic” project allowed the semi-cylindrical illuminance to be increased, thus enhancing the perception of vertical surfaces and objects. The results of the lighting calculations for the main zones of the underpass area (P1 and P2 shown in Figure 2) are reported in Table 1.
Photorealistic renderings were created through 3D Studio Max software, in which the materials present in the Concourse Bridge underpass and luminaires, corresponding to the three different scenarios, were inserted. Three cameras (P1, P2 and P3, as shown in Figure 3) were placed at a height of 1.60 m above the ground, at the average height of the human eye. In two of the chosen views, the camera is located near the bridge, at the underpass level, while the third one is positioned above the staircase, thus allowing the viewer to look at the environment from a different perspective (Figure 3). The photometric files of the luminaires were inserted into the rendering software to accurately reproduce the lighting quantity and distribution. Figure 3 shows the rendering images that were obtained for the three lighting scenarios and the three viewpoints.
The presence of people or pedestrians was not considered in any of the scenarios. Although the ecological validity of the performed tests is without doubt an important issue, the focus of this study was on the difference between scenarios. Furthermore, the absence of people was considered necessary, since it is known that their presence influences vibrancy [59]. This choice was aimed at eliminating and controlling this factor explicitly, as has been done in other studies [33,60,61].

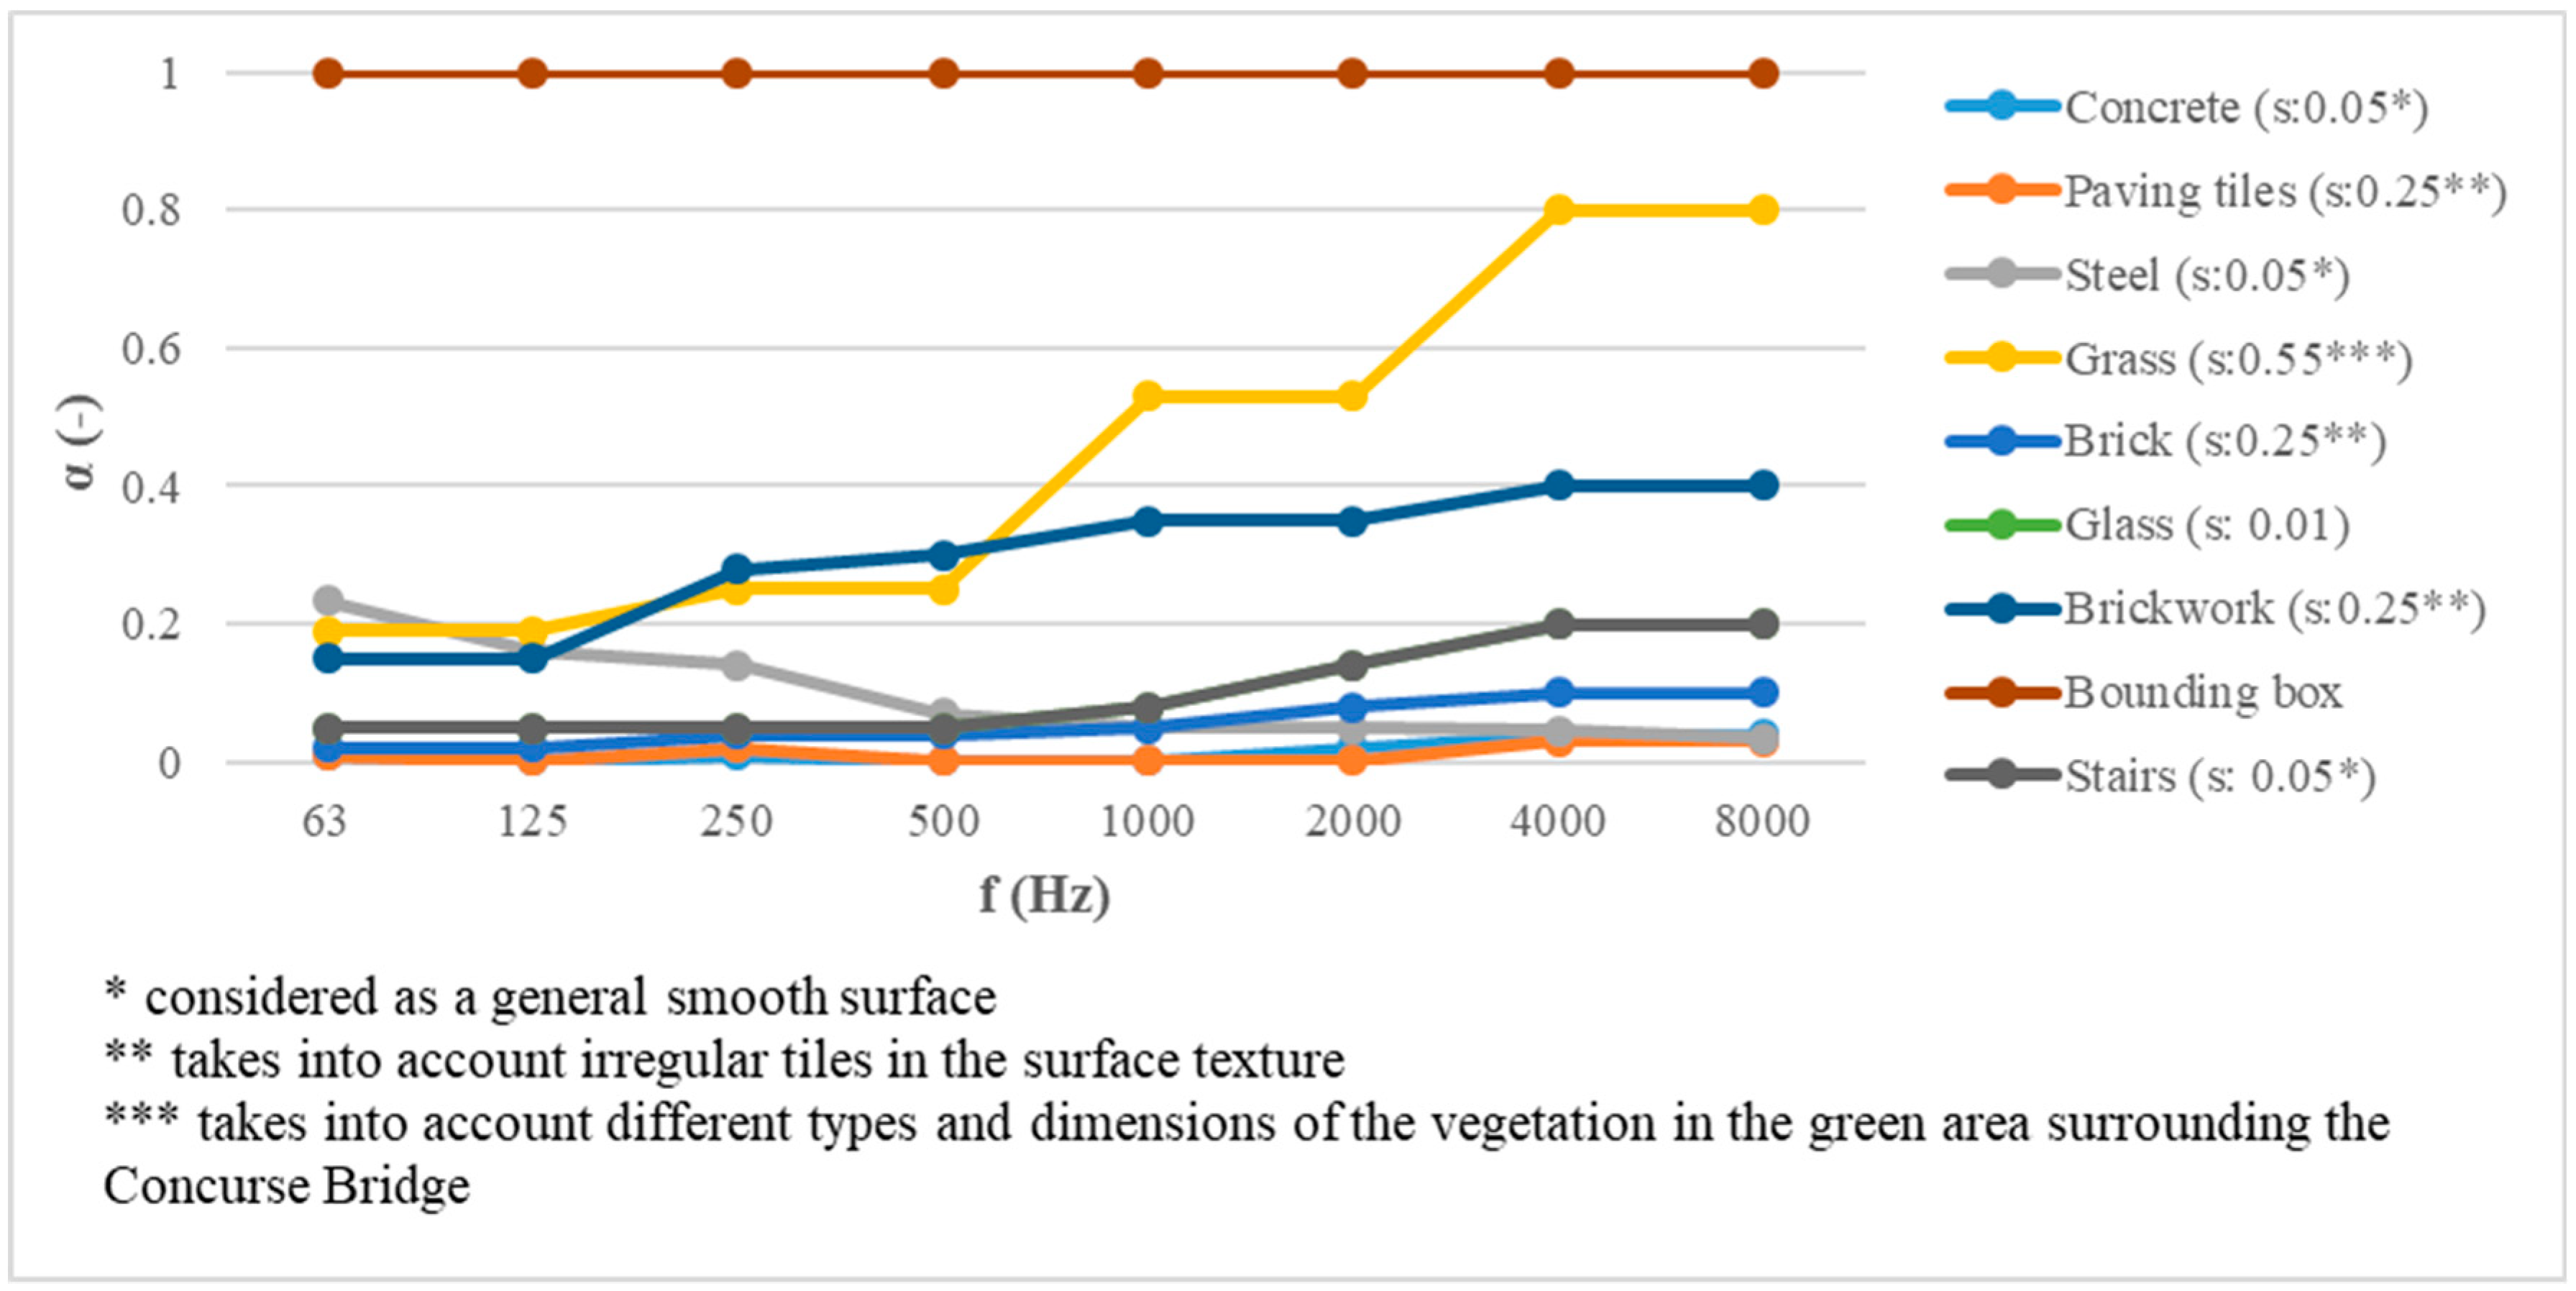
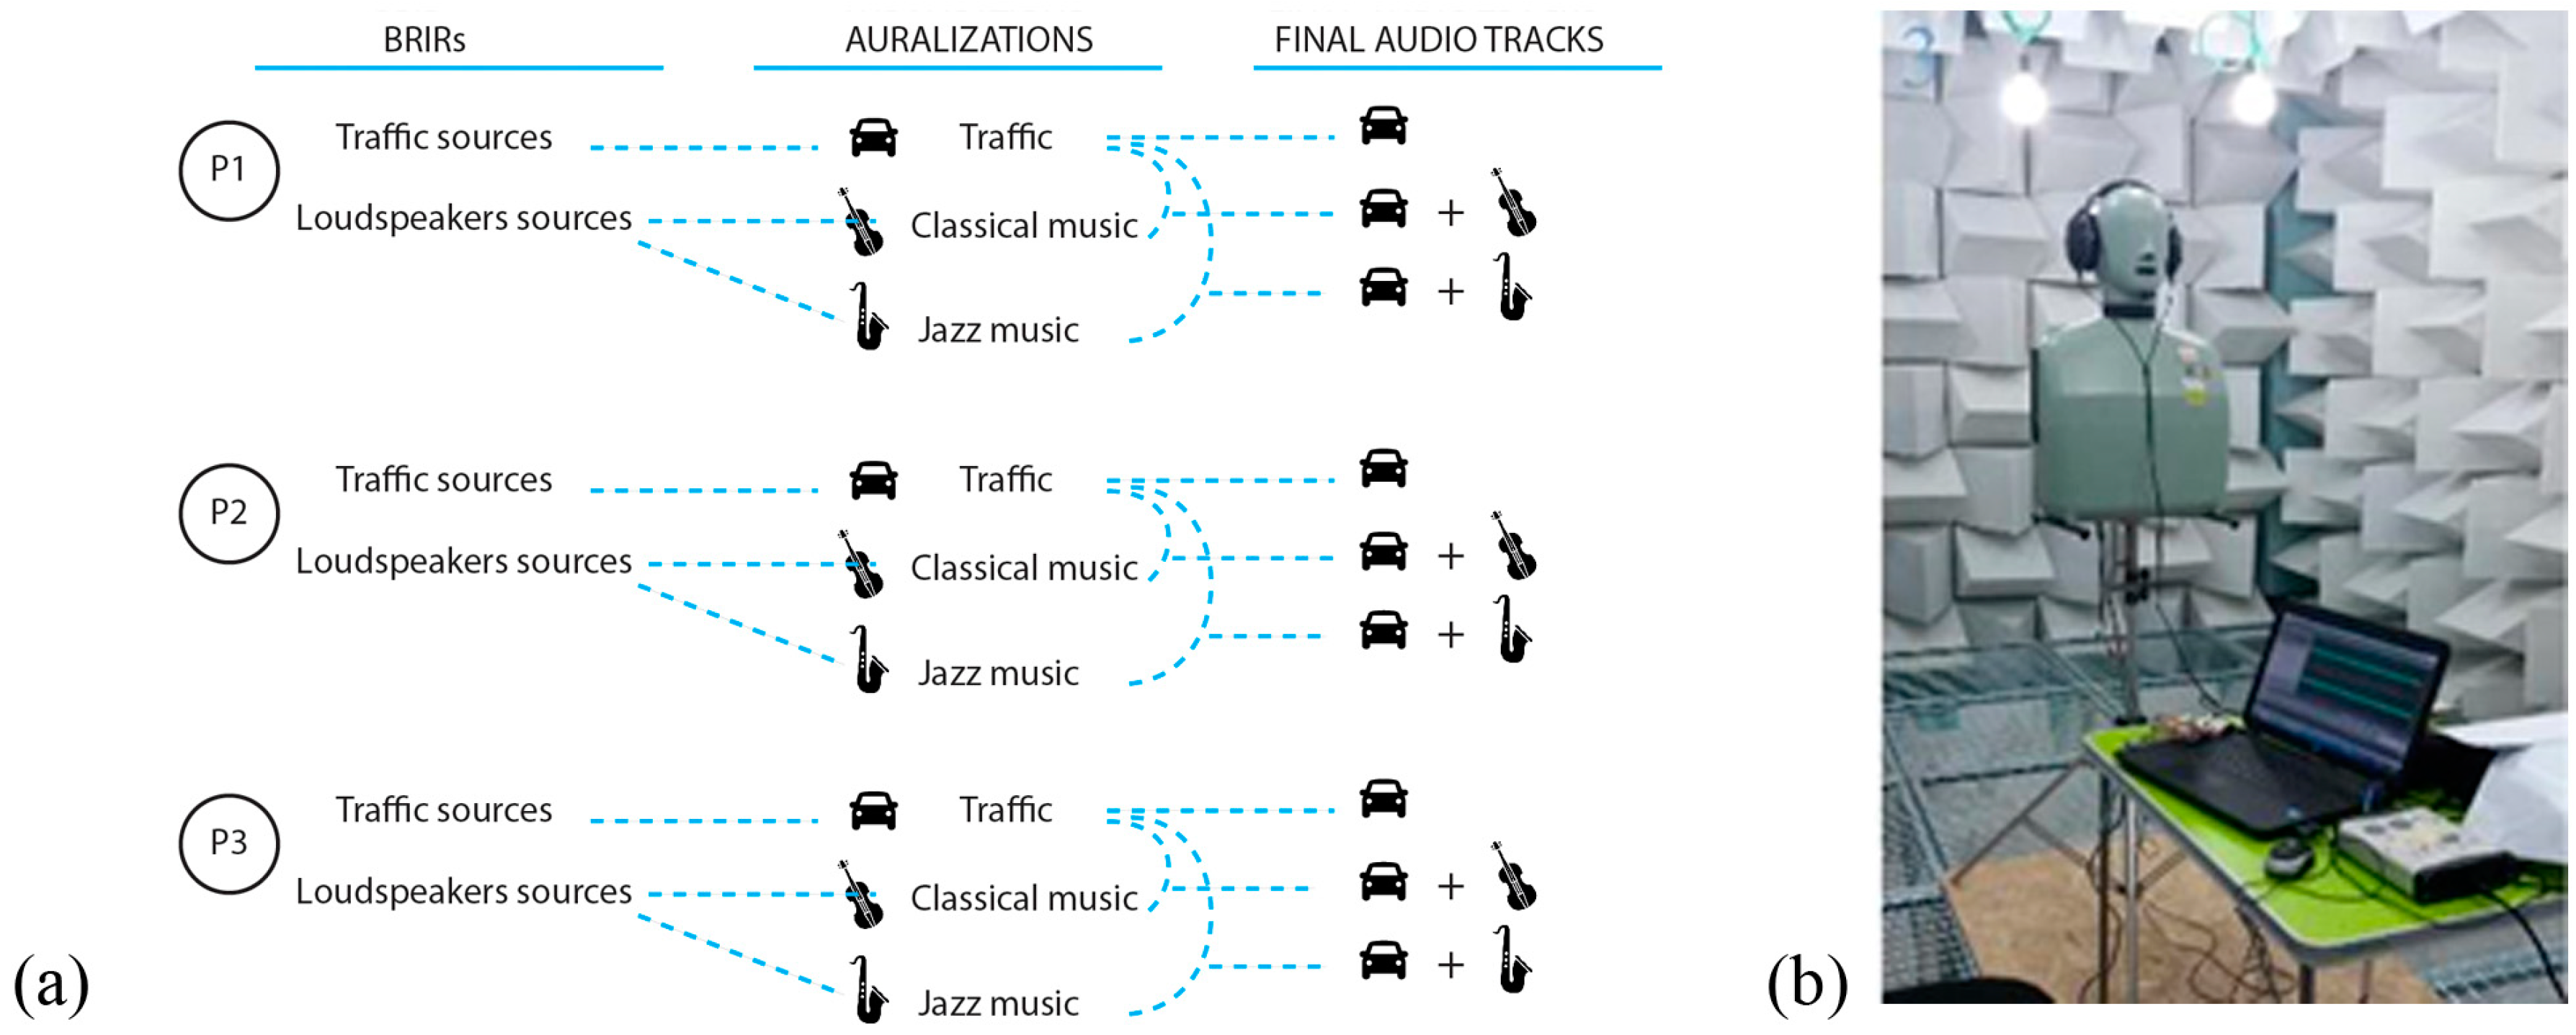
2.3. Soundscape Simulations
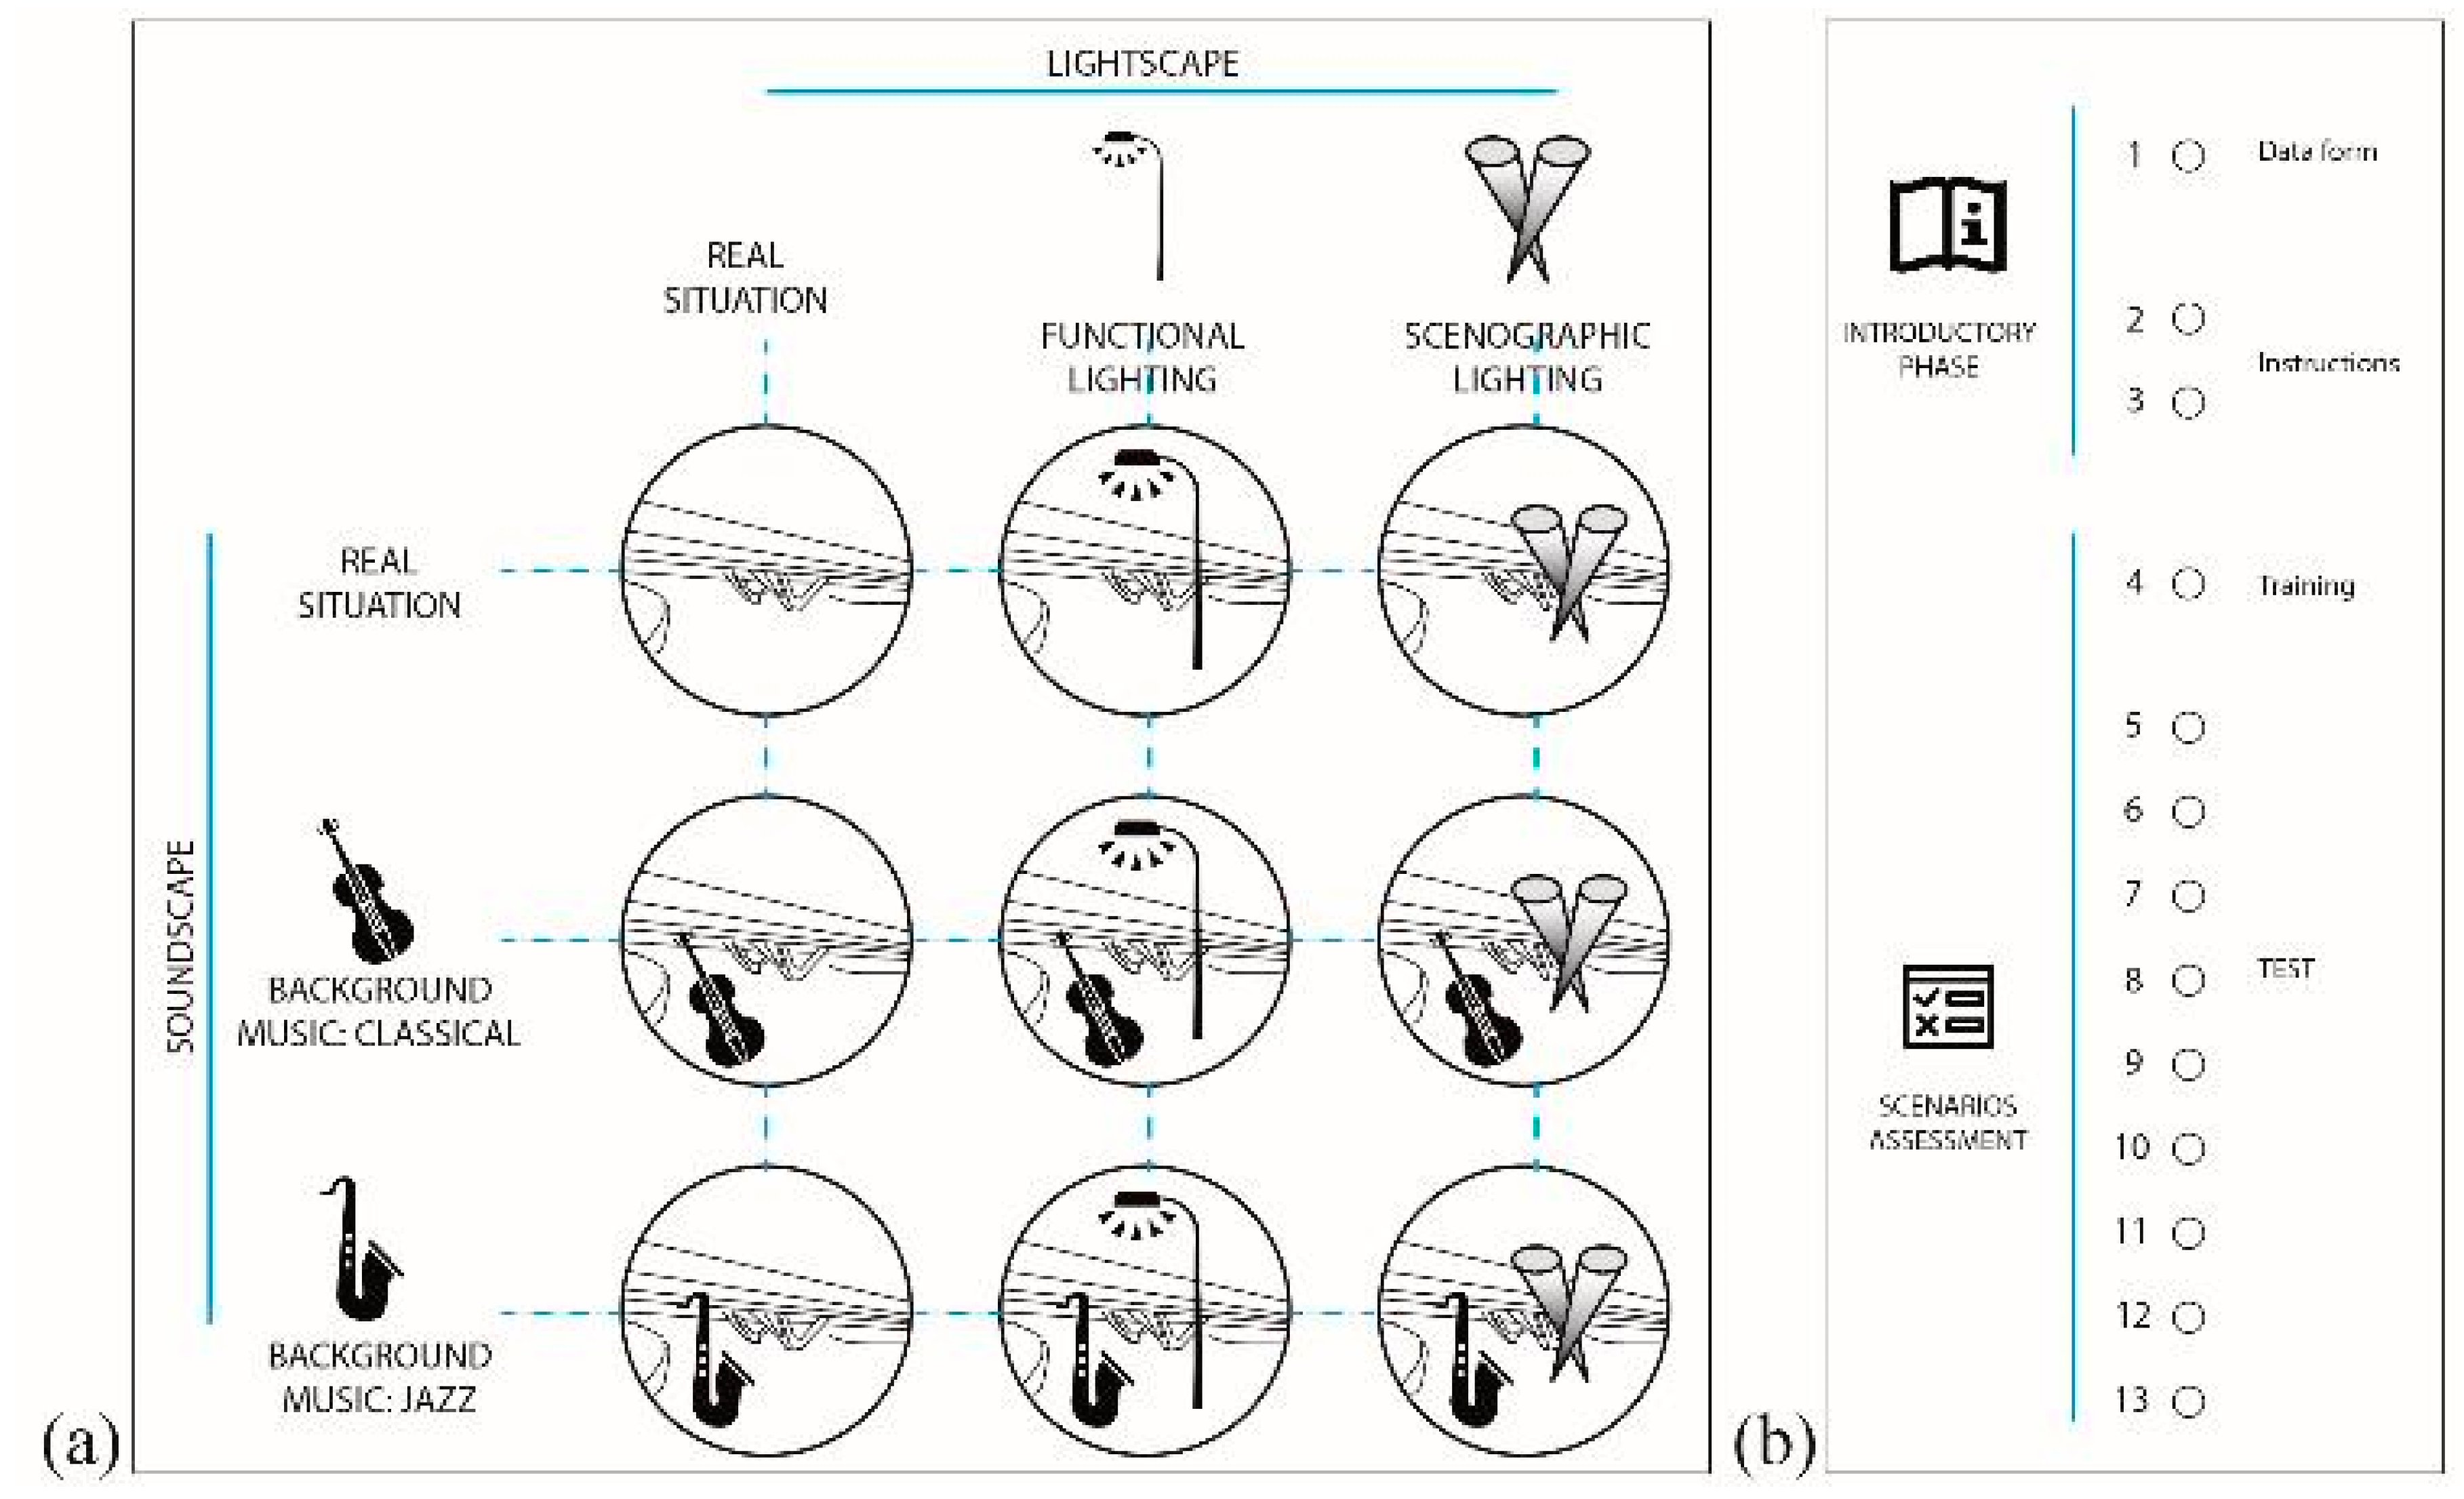
The auditory stimuli used in the test consisted of auralizations generated by means of Odeon [62]. The calibration process has been described in detail in Astolfi et al. [17], where further information can be found.
The AutoCAD model was imported in the Odeon environment and was calibrated on the basis of in situ measurements conducted in February 2015 [63]. The reverberation time, T30, was measured according to ISO 3382-1 [64]. Despite being originally conceived for indoor environments, the standard proved to also be applicable for urban outdoor spaces in previous studies [65,66,67]. Figure 4 shows the absorption coefficients (α) and the scattering coefficient (s) for all the materials considered in the model.
The set of sources inserted into the model was defined and calibrated on the basis of the in situ experiment conducted by Aletta et al. [16]. Two line sources, characterized by a normalized road noise spectrum [68], were placed on the flyover and two loudspeakers, with the same position and directivity as the ones used in the in situ experiment, were placed under the bridge (Genelec, 8030 A) [17]. A receiver was placed in the same position as where the in situ measurements had been conducted. The power of the sound sources was then calibrated in order to match the simulated A-weighted SPL (Sound Pressure Level) values to the background noise measured in situ and to the overall sound pressure level of the loudspeaker used for the in situ experiment [16].
Subsequently, three receivers were inserted into the model at the same points where the cameras P1, P2 and P3 had been placed in the 3D Studio Max software for the creation of visual renderings (see Figure 3), at a height of 1.60 m from the ground, in order to simulate the position of the ears of a standing person.
Figure 5 shows a view of the Odeon model with the above-mentioned sound sources and a plan of the area with the position of the receivers used to calibrate the sound sources.
Auralizations were conducted by convolving the binaural impulse responses (BRIRs) obtained for each receiver position (P1, P2 and P3) through Odeon simulations with an anechoic stimulus of traffic and two anechoic music tracks, namely the “Waltz of the Flower” by Tchaikovsky and “Creole Jazz” by King Oliver [17].
In order to obtain the final auditory stimuli for the perceptual laboratory test, each of the three traffic auralizations was mixed with the two background music auralizations obtained for the same listener position, using Adobe Audition (v. 3.0). Figure 6a shows a scheme of the auralizations and mixings that were performed, which led to nine different auditory stimuli (three per each listener position), which were then used in the subsequent test.
The final step was the optimization of the obtained wave stimuli at both ears in order to obtain the same SPLs calculated by Odeon. In this way, the auditory stimuli perceived by the listeners during the test were set at the same SPL level as the one that a listener positioned in P1, P2 and P3 in the real space would perceive. A detailed description of the optimization procedure can be found in Astolfi et al. [17]. Figure 6b shows the calibration setup inside the anechoic chamber at the Politecnico di Torino.

2.4. Test Structure

As stated in the introduction, nine different scenarios, resulting from a combination of three visual stimuli and three auditory stimuli, were used in the test. Each scenario was presented through a 21 s video, in which three visual renderings of the Concourse Bridge, corresponding to the three observation points P1, P2 and P3 (see Figure 3), were shown together with the auditory stimuli realized in the same position (see Figure 6). The videos were made in Windows Moviemaker (v. 6.1) software. Each sequence of three visual renderings (i.e., the real situation, functional lighting and scenographic lighting) had been combined with each sequence of three auralizations (i.e., real situations, classical background music and jazz background music), hence the study implemented a 3 × 3 level design. Figure 7a shows the experimental design.
The test was constructed with the SurveyGizmo online tool and was composed of a total of 13 pages. In the first one, the participants had to fill in a data form, where they provided information on their age, gender, occupation and previous experience in acoustics and lighting design, in order to allow the test results to be analyzed with respect to factors of potential influence. They were then given instructions on the aim and the structure of the test, in pages 2 and 3, and were also instructed not to change the audio and video settings, so that all the participants could work under the same conditions. Each of the other 10 pages presented a video corresponding to one of the scenarios. Page 4 was used as a training session in order to allow the participants to familiarize themselves with the test, and the answers to this page were then not considered in the test results. Pages 5 to 13 constituted the core of the test, in which all nine scenarios were presented to the participants. Figure 7b shows a schema that represents the test structure.
The participants were asked to evaluate each scenario and express their evaluation in a questionnaire composed of 10 items. The items were derived from previous studies on the perception of safety and social presence in public spaces [33]. The participants had to assess each item on a five-point Likert scale ranging from 1, “strongly disagree”, to 5, “strongly agree”, and were required to assess all ten items before moving on to the next scenario. The nine scenarios were presented randomly in order to avoid an order effect, and the participants could play each video as many times as needed.
Table 2 presents the 10 items that the participants were asked to assess for each scenario, together with the abbreviation that are used hereafter to indicate each item, for the sake of conciseness.

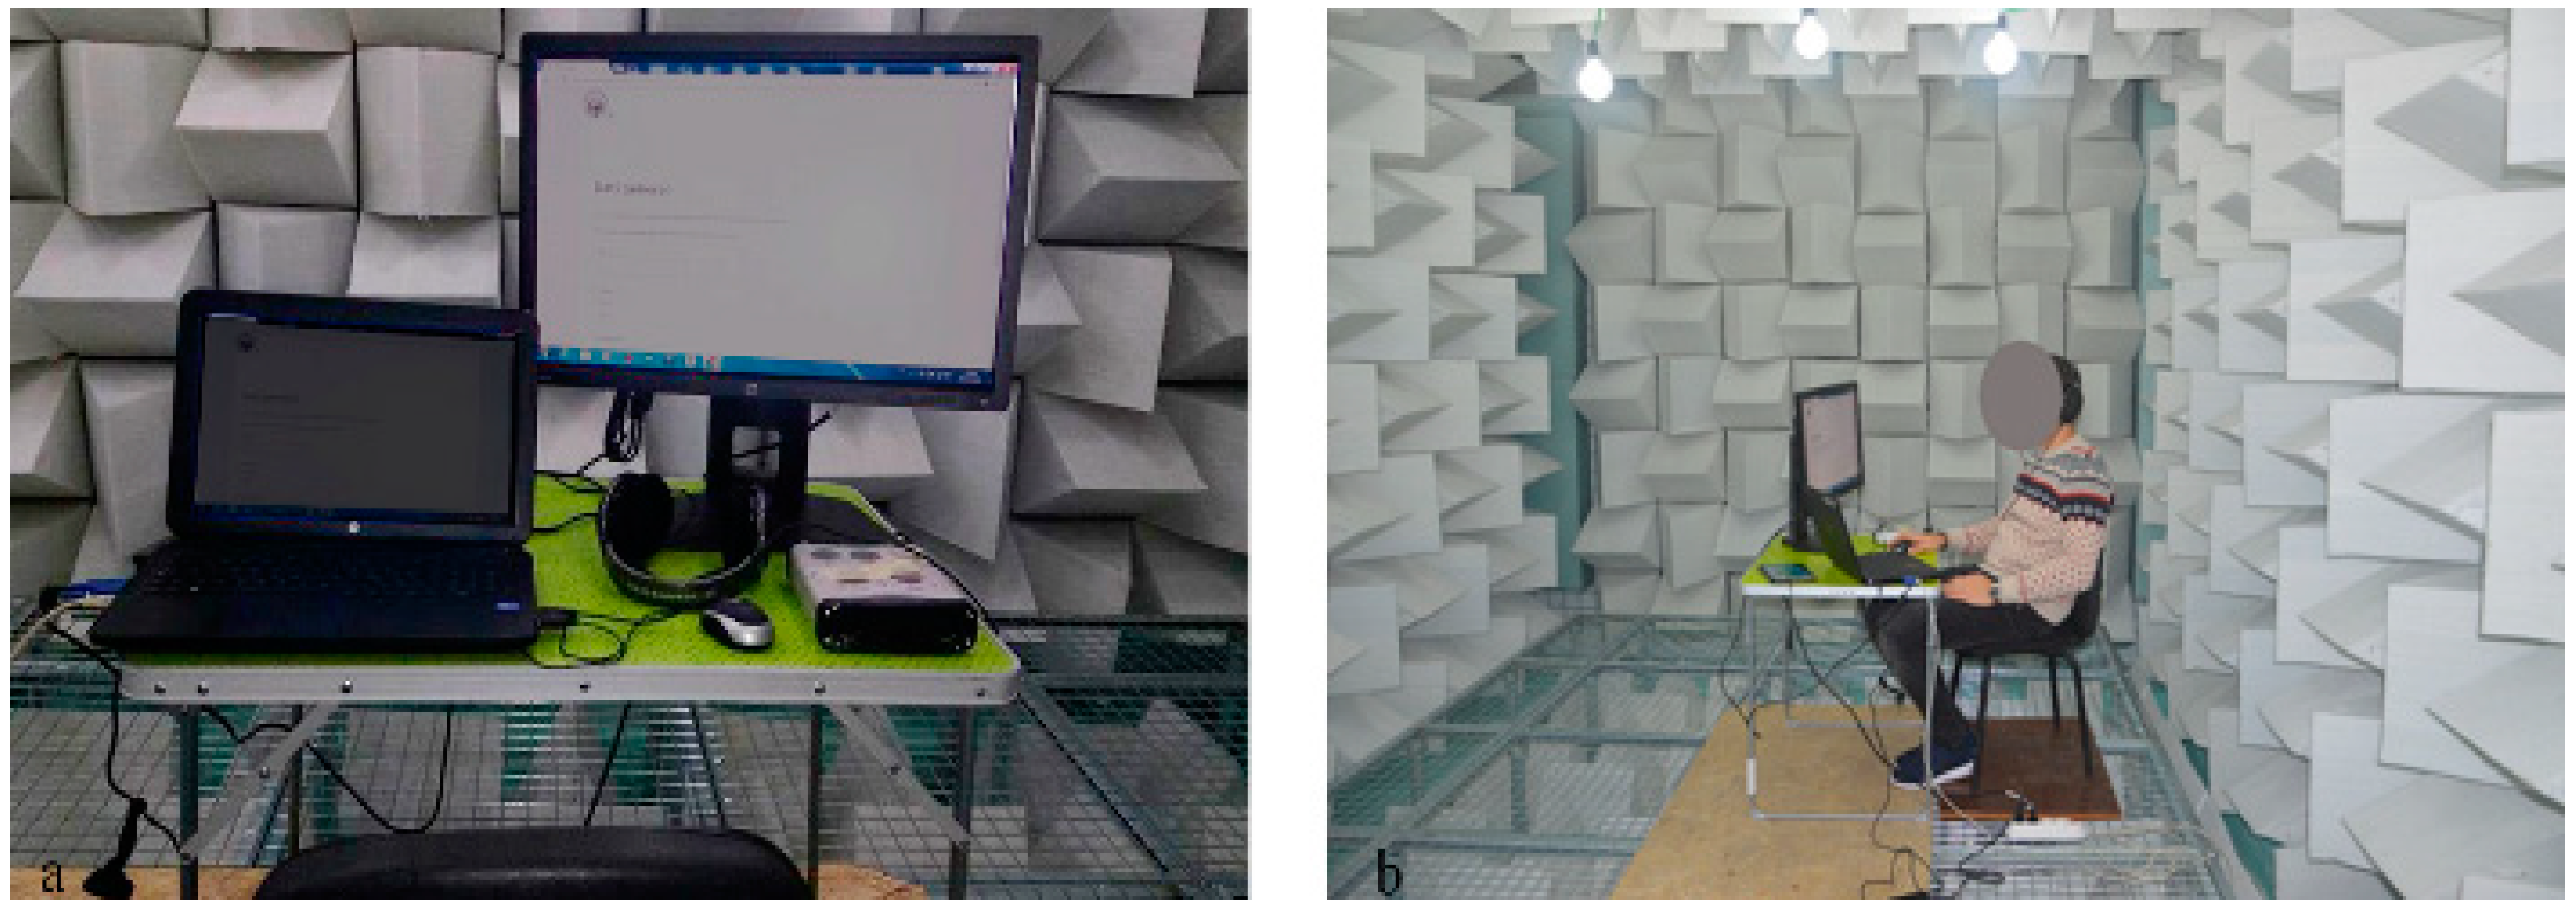
2.5. Experimental Setup

The perceptive tests were conducted in the anechoic chamber at the Politecnico di Torino (Italy), as it allows an environment with a very low background noise (17.3 dB LAeq) to be obtained. Thirty-one participants (nine males and 22 females), aged between 19 and 28 years old (Mage = 23.3 and SD = ±2.5), voluntarily took part in the experiment.
The equipment used for the test consisted of an HP 203.3G laptop connected to an HP Z24i monitor and to a pair of Sennheiser 650 HD through a TASCAM US-144 audio/MIDI interface.
Before starting the test, each participant underwent a tone audiometric test, performed using the “Loud Clear Hearing Test” windows app, developed by JPSB Software, and a simplified web version of the Ishihara test to evaluate color-blindness. The listening sound level had previously been set by the experimenter for the tone audiometric test, and each participant took the audiometry test under the same conditions. All the participants were found to have normal hearing and visual conditions, and all their answers were therefore included in the result analysis. Figure 8 shows the test setup inside the anechoic chamber.

3. Results and Discussions

3.1. Principal Component Analysis

A principal components analysis (PCA) was run on the 10-item questionnaire to measure the individual responses to the audio-visual stimuli experienced by the 31 participants. The suitability of PCA was assessed prior to the analysis. An inspection of the correlation matrix showed that all the variables had at least one correlation coefficient greater than 0.3. The overall Kaiser-Meyer-Olkin (KMO) measure was 0.89, which, according to Kaiser, has been classified as “meritorious” [69]. Bartlett’s test of sphericity was statistically significant (p < 0.001), thus indicating that the data were likely factorable.
PCA revealed two components that had higher eigenvalues than one. A visual inspection of the screen plot (reported in Figure 9a) indicated that the two components should be retained [70]. In addition, a two-component solution met the interpretability criterion. As such, the two components were retained.
The two-component solution explained 67.5% of the total variance. A Varimax orthogonal rotation was employed to aid interpretability. The rotated solution exhibited a “simple structure” [71], as reported in Figure 9b. In fact, when looking at the rotated component matrix reported in Table 3, the relatively simple structure of the solution is reflected by the fact that each item of the questionnaire (variable) has only one of the two components “loading” strongly on it, and each component loads strongly on at least three variables. For example, Component 1 loads strongly on “Worried”, “Tense” and “Safe”; while Component 2 loads strongly on “Human warmth”, “Presence of others” and “Human sensibility”.
Therefore, considering the position of each of the ten items of the questionnaire, Component 1 had attributes related to unsafe (i.e., worried, tense) at its negative end, while other attributes, related to safety, may be observed at its positive end (i.e., safe, comfortable). On the other hand, Component 2 had attributes related to a lack of presence of people (i.e., alone) at its negative end, while other attributes, related to the presence of people, may be observed at its positive end (i.e., presence of others, human sensibility). Therefore, Component 1 was interpreted as “perceived safety”, while Component 2 was interpreted as “perceived social presence”. Subsequently, the component scores extracted from the dimensional reduction were assigned to each participant and these were used to define two new variables, namely: Perceived safety and perceived social presence.
Figure 10 shows the scatterplots of the test results, with respect to the two newly identified components. As can be seen from the charts, the results of the scenarios with no background music were associated with lower perceived safety and perceived social presence scores, as a low number of test results were located in the quarter corresponding to positive scores for both factors. The number of results in this quarter pertaining to the case of jazz and classical background music increased, while there were fewer results in the quarter corresponding to negative results for both components and they were closer to a zero score for both components. Moreover, the results corresponding to scenographic lighting seemed to reach higher values for the perceived social presence component than for functional lighting and current lighting.

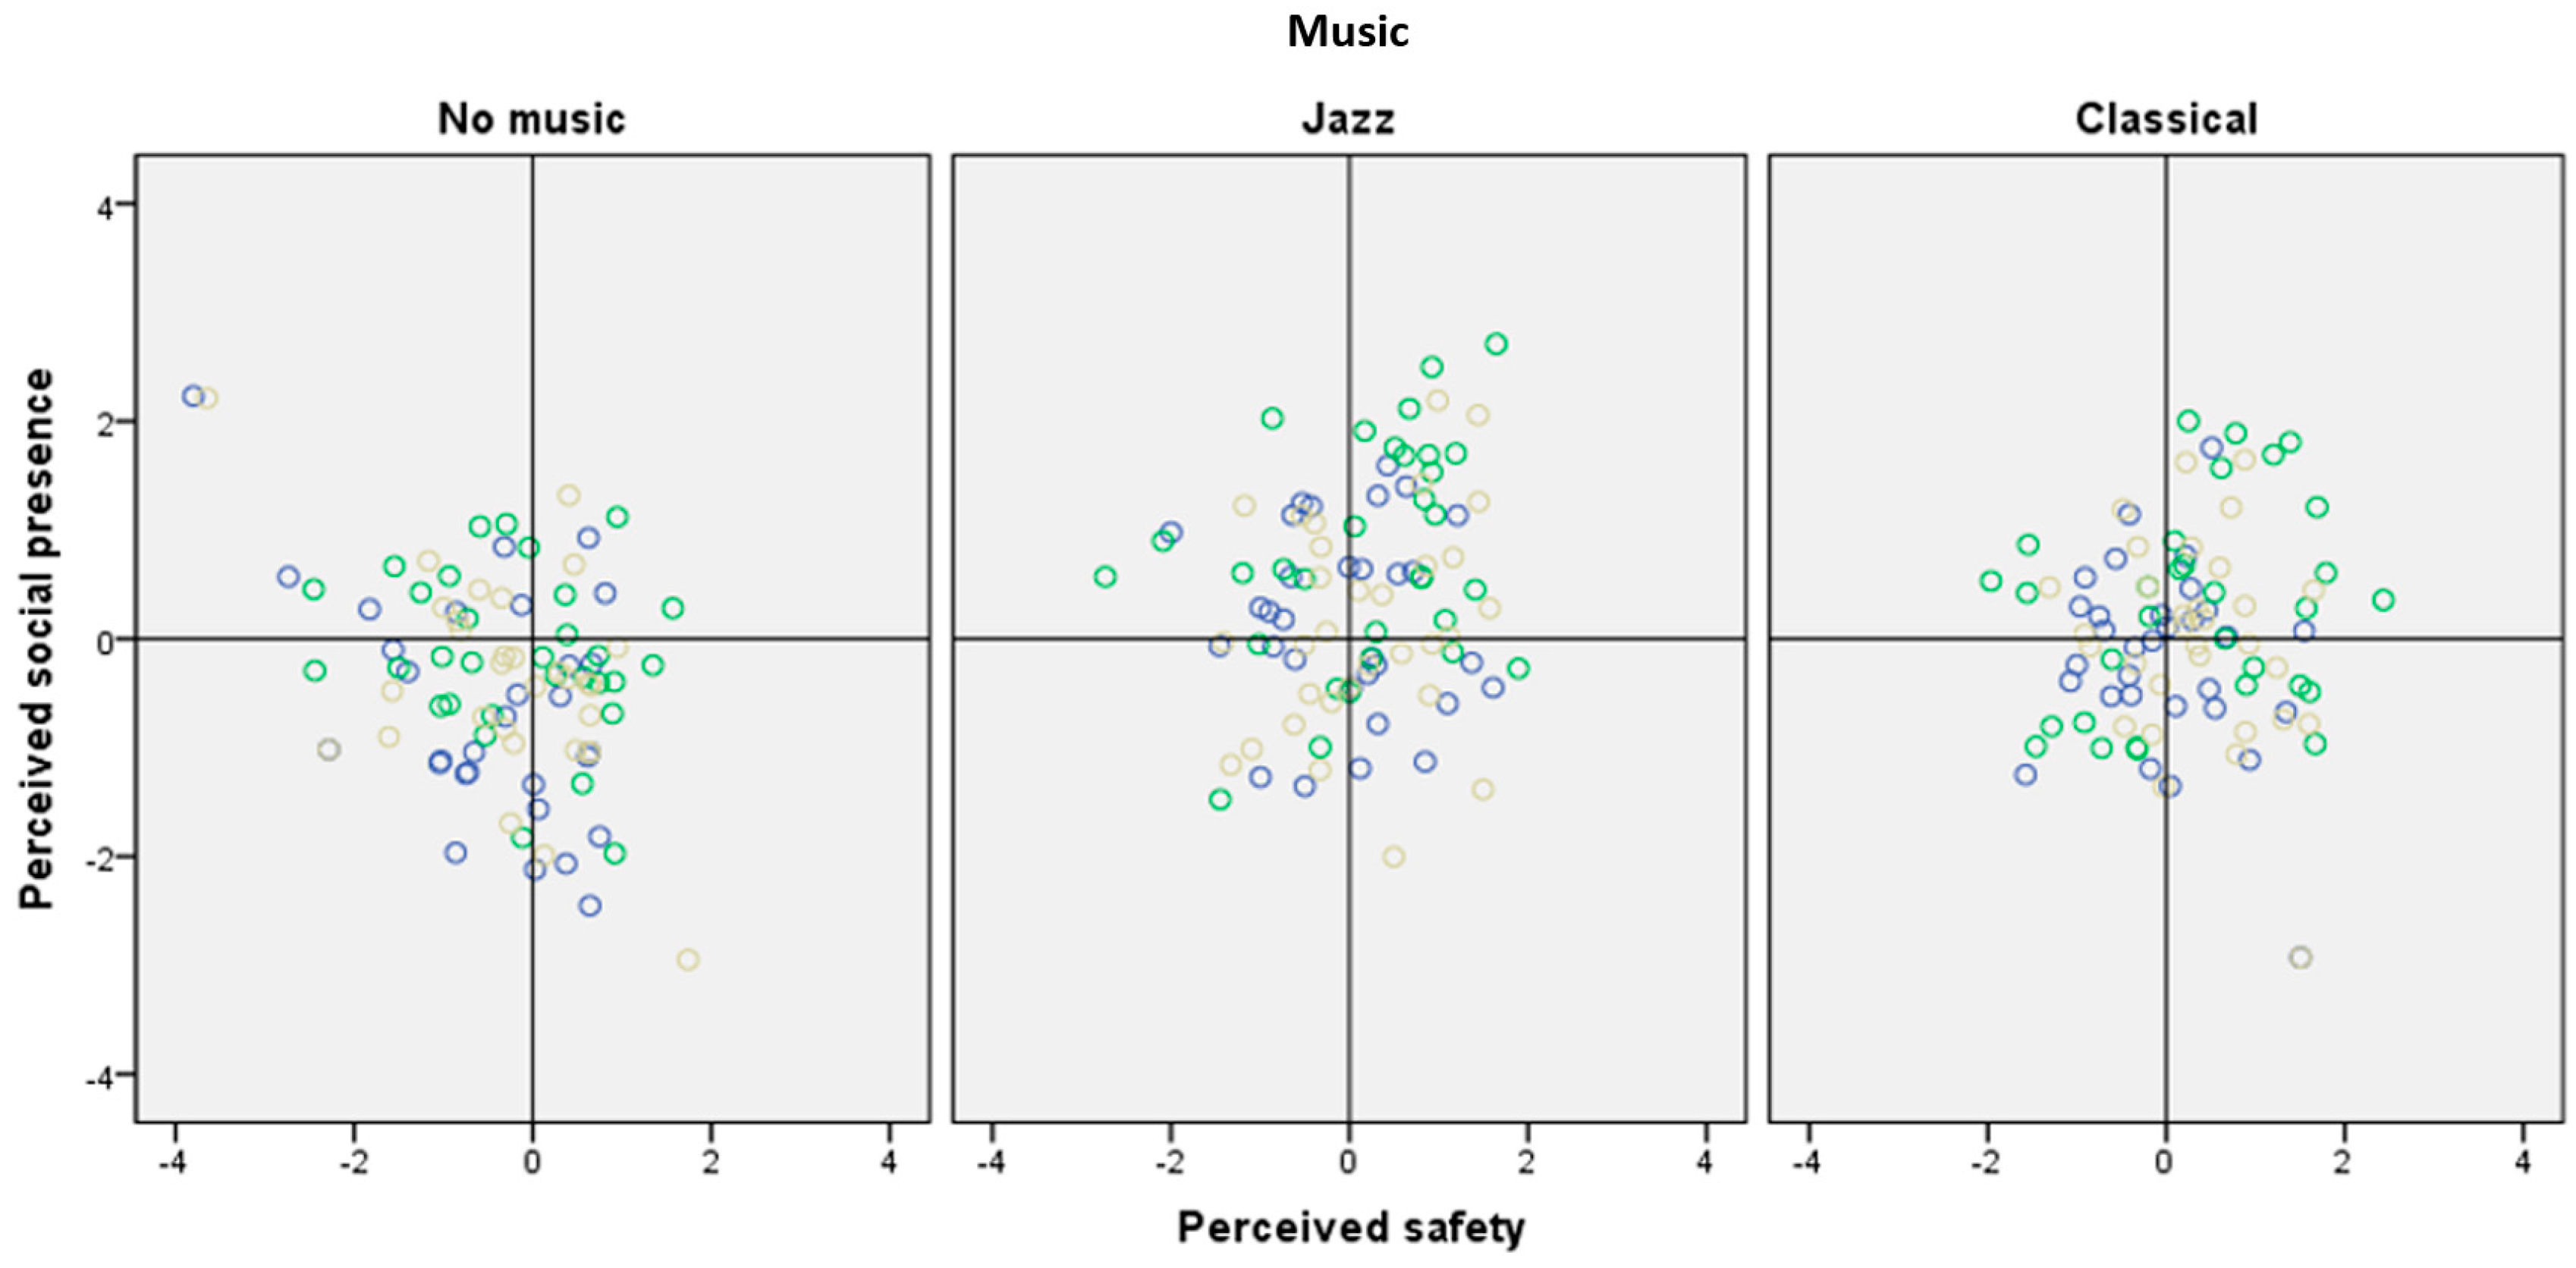
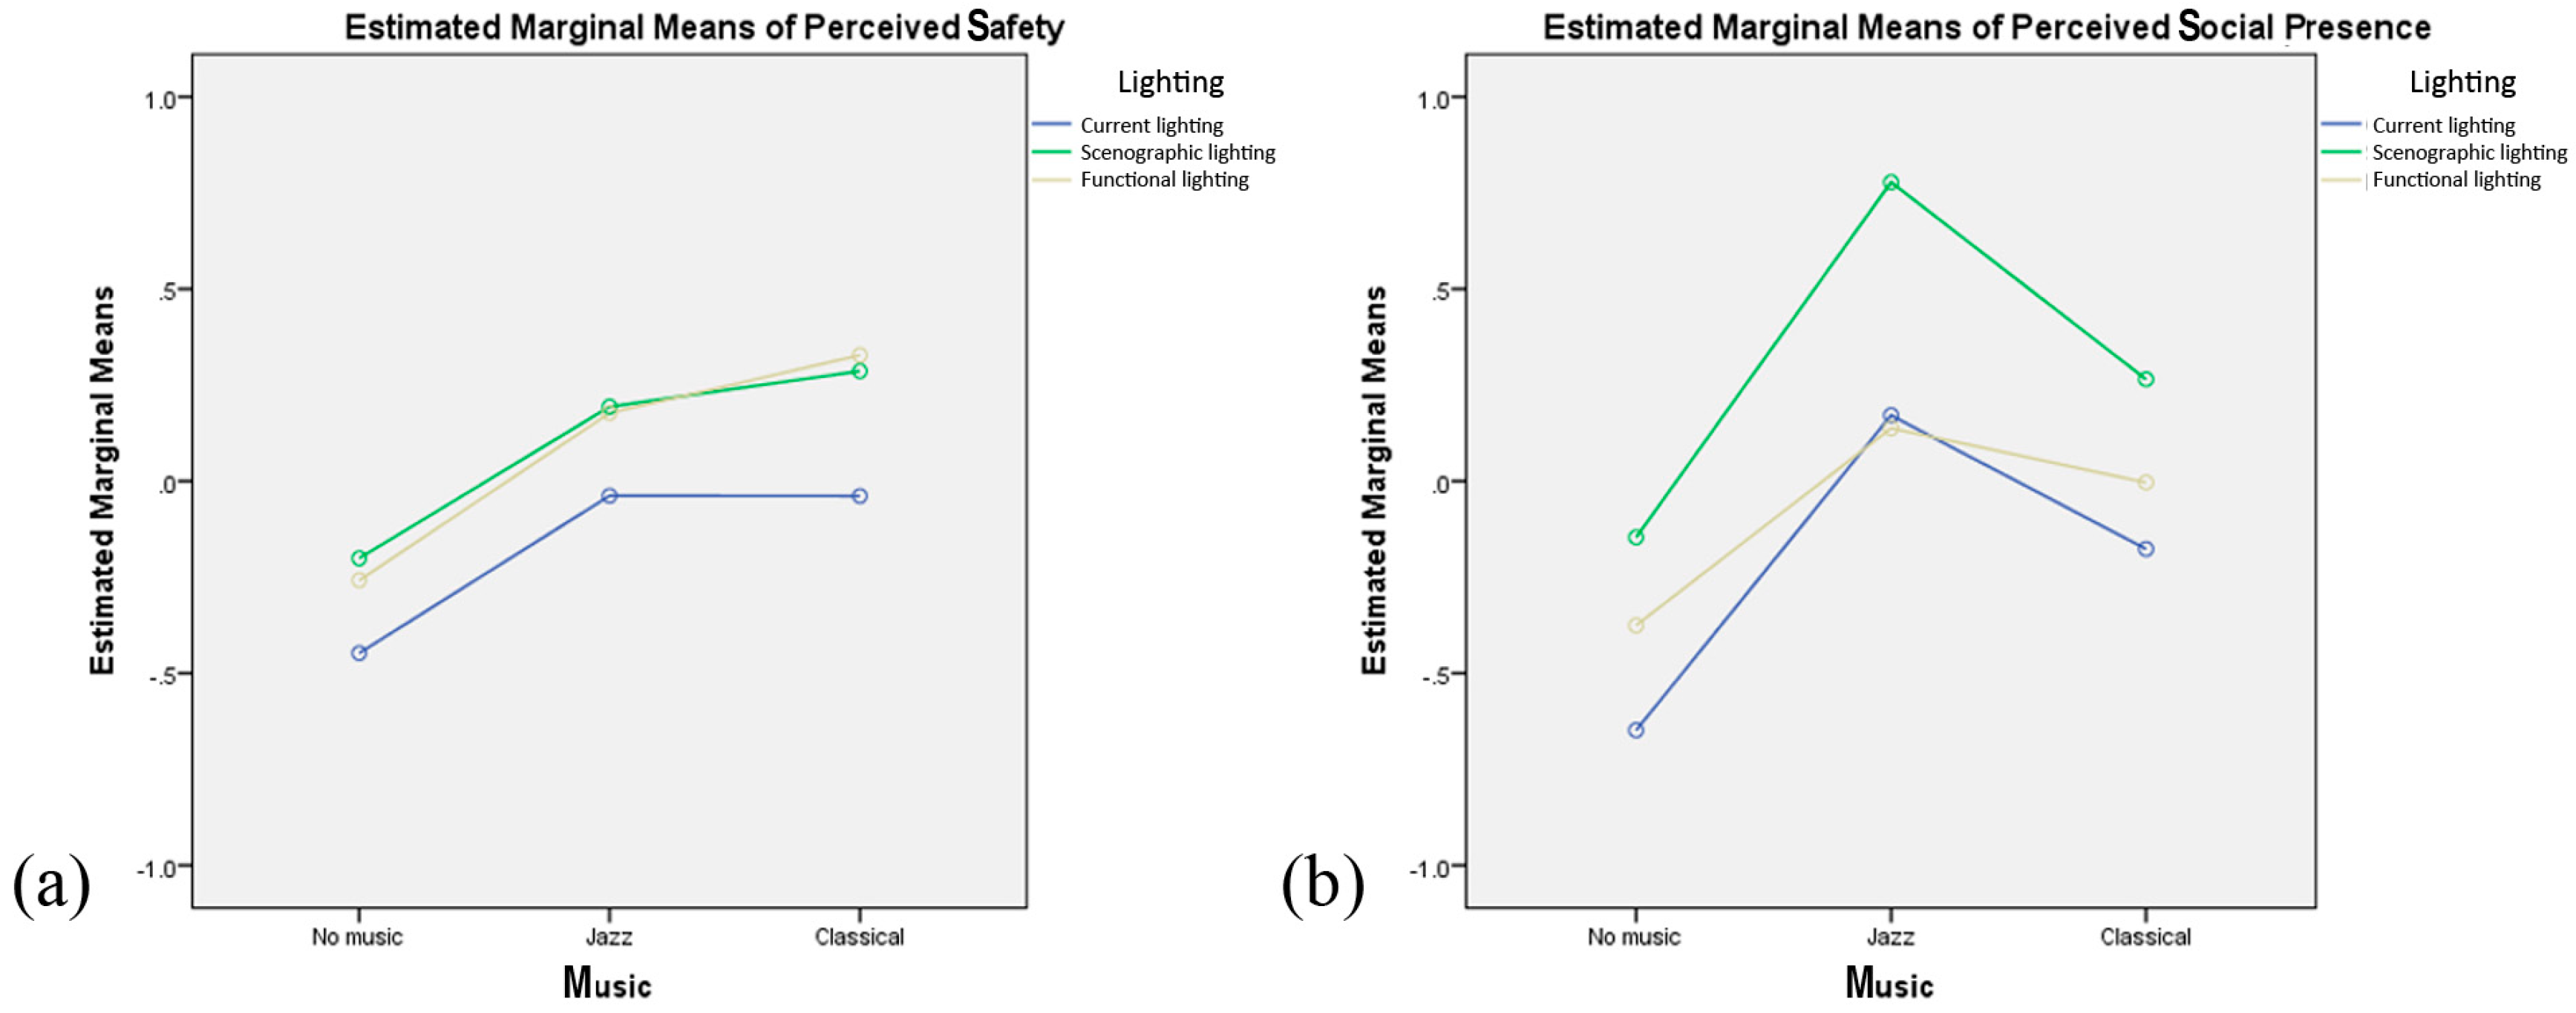
3.2. Effects of the Music and Lighting Conditions on Perceived Safety and Perceived Social Presence

A two-way repeated measures ANOVA was conducted to examine the effects of music and lighting on perceived safety. Sphericity, as assessed by means of Mauchly’s test of sphericity (p > 0.05), was observed for the interaction term. The interaction effect between music and lighting on perceived safety was not statistically significant, F(4, 120) = 0.225, p = 0.924 (Figure 11a).
Therefore, an analysis of the main effect of music was performed, and it was found to be statistically significant, F(2, 60) = 6.508, p = 0.003. Pairwise comparisons (post hoc Bonferroni adjustment) revealed that the no music condition was statistically significantly different from the classic condition (p = 0.017), but not from the jazz condition (p = 0.067), and that the latter two did not differ from each other (p > 0.05). These results are to some extent consistent with the findings of Astolfi et al. [17] in which, for all the items related to perceived safety, a significant difference was found between a no music condition and background music conditions, but no difference was found between the two background music conditions (classical and jazz).
The main effect was also analyzed for lighting, but no statistically significant differences emerged (p > 0.05) for the three analyzed lighting scenarios. Such findings might seem contradictory with previous findings on the positive influence of increased lighting [35,38] and of white lights [36] on safety perception. However, it should be pointed out that the functional and scenographic scenario did not introduce an increase of illuminance, with respect to the current lighting situation, despite the improvement in the uniformity of the illuminance distribution and the reduction of the glare effect.
A two-way repeated measures ANOVA was also conducted to examine the effects of music and lighting on perceived social presence. Sphericity, as assessed by Mauchly’s test of sphericity (p > 0.05), was observed for the interaction term. The interaction effect between music and lighting on perceived social presence was not statistically significant, F(4, 120) = 0.945, p = 0.440. Therefore, an analysis of the main effects of music and lighting was also performed separately in this case. The analysis indicated that the main effect of music was statistically significant, F(2, 60) = 12.156, p < 0.001. Pairwise comparisons (post hoc Bonferroni adjustment) revealed that the jazz condition had statistically significantly higher scores for perceived social presence than both the no music (p < 0.001) and classical music (p = 0.017) conditions, but the latter two did not differ in a statistically significant way (p = 0.073), as shown in Figure 11b. This once again is basically consistent with the results presented in Astolfi et al. [18], in which a significant difference was found between the three background music scenarios for test items related to liveliness, human warmth and human sensitivity, with jazz music providing a higher perceived social presence than classical music. A possible explanation for this is that jazz music is more likely associated with street performances than classical music (which is performed by larger groups of musicians) and the participants might have been aware of this incongruency. The effect of background music on both safety and social presence perception is also consistent with previous findings of in situ observations performed in the area [16]. However, in the case of Aletta et al. [16], classical music was reported to have a greater influence on the time spent by passers-by in the area.
Subsequently, the main effect was also analyzed for lighting, and it was reported to be statistically significant, F(2, 60) = 6.953, p = 0.002. Pairwise comparisons (post hoc Bonferroni adjustment) revealed that the scenographic lighting condition was statistically significantly different from the current lighting condition (p = 0.011), but not from the functional lighting condition (p = 0.073), and the latter two did not differ in a statistically significant way between each other (p > 0.501). A possible explanation for this is that the two retrofitting hypotheses determined a more uniformly lit environment with higher luminance on the vertical surfaces of the bridge and surrounding buildings, and this led to a more comprehensive perception of the environment. Furthermore, the scenographic solution determined a significantly higher semi-cylindrical illuminance, a condition that is recognized to be fundamental for facial recognitions and therefore for enhancing the perception of people.

3.3. Strengths and Limitations of the Study

The present research has been conducted through laboratory tests, which have allowed several different scenarios of the same place to be evaluated in one single experiment. Similar studies may help to evaluate preliminary solutions, without implementing cost-demanding solutions and without the need of enforcing too strict controls of the area.
The use of similar scenarios involves simplifications of the presented scenarios, with respect to the use of virtual reality and in situ experiments.
Previous studies [57] showed that simulated scenarios seem to lead to an overrating of such negative effects as a threat and to an underrating of such positive effects as a pleasure and overall liking, while the lack of movement may represent a limitation to simulated environments [56]. A general shortcoming of the laboratory test method is the impossibility of investigating any social cohesion, which has been reported to be one of the possible effects of soundscape design in other research [16].
Therefore, future developments of the work may involve the use of virtual reality walk-through in the area, as the use of virtual reality to evaluate the perceptual aspects of public spaces has shown congruency between real environment ratings and VR (Virtual reality) reproduction [72]. Moreover, a comparison between in situ and laboratory experiments may also be conducted, in order to gain deeper insights into how the two methodologies can contribute to the assessment of the manipulation of environmental features on the perception of safety and social presence. The need to study the comparison between in situ and laboratory experiments in more detail has also been underlined by the differences in the results of this study from those shown in the work of Aletta et al. [16].
As far as the tested scenarios are concerned, since the lighting scenario was aimed at increasing uniformity and reducing the potential glaring effect, future research may involve the investigation of lightscape effects in relation to a more consistent variation in the lighting quantity or to the modification of other visual characteristics of the scene.
Moreover, in order to make a more detailed comparison with previous studies, such as the one conducted by Sayin et al. [33], natural and vocal sounds should be considered in future investigations.

4. Conclusions

The present study has evaluated the effects of soundscape and lightscape modifications on perceived safety and perceived social presence in a pedestrian area. The research has been conducted through laboratory tests in which participants were presented with nine different scenarios of the same underpass, but with different lightscapes and soundscapes, and were asked to assess each scenario with respect to 10 items related to perceived safety and perceived social presence.
The statistical analysis conducted on the results showed that no significant correlation emerged between soundscape and lightscape modifications, for either perceived safety or perceived social presence.
An analysis of the main effects of soundscape showed that the presence of background music had an effect on the improvement of perceived safety and social presence, with respect to the control condition (no music). No differences were found between classical and jazz background music as far as perceived safety is concerned, while jazz music resulted to have a greater effect on perceived social presence than classical music.
The positive effect of the presence of music is consistent with previous studies [16,30,31,32]. Further research needs to be conducted considering different soundscape scenarios, such as natural sounds or vocal music, as used in previous studies [32,33]. The obtained results are also consistent with previous tests conducted on the same simulated outdoor area on the effects of soundscape manipulations [17].
The same analysis, conducted on the main effects of lightscape, showed no influence on perceived safety, while a significant influence was found for scenographic lighting, with respect to the current lighting, on perceived social presence. These results, which seem to contradict the results of previous studies [35,36,38], should be analyzed taking into account the characteristics of the compared scenarios. The current situation was not lighted less than the two retrofitting hypotheses, in terms of horizontal illuminance, but the area was less uniformly lit and there was less semi-cylindrical illuminance than in the scenographic lighting case, two aspects that can affect the impression of social presence. Furthermore, some laboratory settings, such as screen dimensions and light rendering settings may have influenced the subjective analysis, and further studies should be conducted to confirm the results of the present research and their relation with previous findings on the influence of lighting on the perception of safety and the fear of crime.
These types of study have relevant implications for the design and management of cities, as they may be used to evaluate the possibility of tackling security and safety issues in no-go areas with non-intrusive and cost-effective strategies, using laboratory experiments to evaluate a high number of different possible interventions with low investments, in terms of money and time. Further research should also be aimed at expanding the current results by evaluating the influence of different kinds of background sounds and the influence that other visual features of the area may have on the effectiveness of lightscape manipulation in enhancing perceived safety and social presence.

Author Contributions

Conceptualization, C.C., A.A., A.P., F.A., L.S. and E.B.; methodology, C.C., A.A., A.P., L.S., M.D.S. and P.O.; formal analysis, F.A. and L.S.; investigation, C.C., L.S., M.D.S. and P.O.; writing—original draft preparation, C.C., A.A., A.P., F.A. and L.S.; writing review and editing, C.C., A.A., A.P., F.A., L.S. and E.B.

Funding

This research received no external funding.

Conflicts of Interest

The authors declare no conflict of interest.

References

  1. Ferrando, D.T. La città come. Storia dell’idea di paesaggio urbano; Politecnico di Torino: Turin, Italy, 2012. [Google Scholar]
  2. Cullen, G. Townscape; Reinhold Pub. Corp.: New York, NY, USA, 1961. [Google Scholar]
  3. Lynch, K. The Imafe of the City; MIT Press: Cambridge, MA, USA, 1960. [Google Scholar]
  4. Lynch, K.; Hack, G. Site Planning; MIT Press: Cambridge, MA, USA, 1962. [Google Scholar]
  5. Banerjee, T.; Southworth, M. City Sense and City Design. Writings and projects of Kevin Lynch; MIT Press: Cambridge, MA, USA, 1990. [Google Scholar]
  6. Radicchi, A. Sull’ Immagine Sonora Della Città; Firenze University Press: Firenze, Italy, 2012. [Google Scholar]
  7. Southworth, M. The Sonic Environment of Cities. Environ. Behav. 1969, 1, 49–70. [Google Scholar]
  8. Rogerson, R.; Rice, G. Making sense of places: “Moral geographies” of sensory urbanism. Archit. Theory Rev. 2009, 14, 142–155. [Google Scholar] [CrossRef]
  9. Shi, S.; Gou, Z.; Chen, L.H.C. How does enclosure influence environmental preferences? A cognitive study on urban public open spaces in Hong Kong. Sustain. Cities Soc. 2014, 13, 148–156. [Google Scholar] [CrossRef]
  10. Schipperijn, J.; Ekholm, O.; Stigsdotter, U.K.; Toftager, M.; Bentsen, P.; Kamper-Jørgensen, F.; Randrup, T.B. Factors influencing the use of green space: Results from a Danish national representative survey. Landsc. Urban Plan. 2010, 95, 130–137. [Google Scholar] [CrossRef]
  11. Xue, F.; Gou, Z.; Lau, S.S.Y. Green open space in high-dense Asian cities: Site configurations, microclimates and users’ perceptions. Sustain. Cities Soc. 2017, 34, 114–125. [Google Scholar] [CrossRef]
  12. Radicchi, A.; Henckel, D. Combined Sound- & Lightwalks. A perception based method to analyze and evaluate the sonic and light environment of our cities at night. In Proceedings of the Euronoise, Heraklion, Greece, 27–31 May 2018. [Google Scholar]
  13. Newman, O. Defensible Space: Crime Prevention Through Urban Design; MacMillan Publishing Company: Basingstoke, UK, 1973. [Google Scholar]
  14. D’Alessandro, F.; Evangelisti, L.; Guattari, C.; Grazieschi, G.; Orsini, F. Influence of soundscape and other features on the soundscape assessment of a university external area. Build. Acoust. 2018, 25, 199–217. [Google Scholar] [CrossRef]
  15. Abu-Ghazzeh, T.M. Communicating behavioral research to campus design factors affecting the perception and use of outdoor spaces at the University of Jordan. Environ. Behav. 1999, 31, 764–804. [Google Scholar] [CrossRef]
  16. Aletta, F.; Lepore, F.; Kostara-Konstantinou, E.; Kang, J.; Astolfi, A. An Experimental Study on the Influence of Soundscapes on People’s Behaviour in an Open Public Space. Appl. Sci. 2016, 6, 276. [Google Scholar] [CrossRef]
  17. Astolfi, A.; Orecchia, P.; Bo, E.; Shtrepi, L.; Calleri, C.; Aletta, F. Influence of Soundscapes on Perception of Safety and Social Presence in an Open Public Space. In Handbook of Research on Perception-Driven Approaches to Urban Assessment and Design; Aletta, F., Xiao, J., Eds.; IGI Global: Hershey, PA, USA, 2018; pp. 126–149. [Google Scholar]
  18. Wu, S. Investigating Lighting Quality: Examining the Relationship between Pedestrian Lighting environment and Perceived Safety. Master’s Thesis, Virginia Tech University, Blacksburg, VA, USA, 2014. [Google Scholar]
  19. Milliman, R.E. Using Background Affect to Music Behavior of the Supermarket Shoppers. J. Mark. 1982, 46, 86–91. [Google Scholar] [CrossRef]
  20. Lesiuk, T. The effect of music listening on work performance—Lesiuk 33 (2): 173—Psychology of Music. Psychol. Music 2005, 33, 173–191. [Google Scholar] [CrossRef]
  21. International Organization for standardization ISO 12913-1:2014 Acoustics—Soundscape—Part 1: Definition and conceptual framework. Available online: https://www.iso.org/standard/52161.html (accessed on 25 October 2018).
  22. International Organization for Standardization ISO/TS 12913-2:2018 Acoustics—Soundscape—Part 2: Data collection and reporting requirements 2018. Available online: https://www.iso.org/standard/75267.html (accessed on 25 October 2018).
  23. Kang, J.; Aletta, F.; Gjestland, T.T.; Brown, L.A.; Botteldooren, D.; Schulte-Fortkamp, B.; Fiebig, A.; Bento Coelho, J.L.; Lercher, P.; van Kamp, I.; et al. Ten questions on the soundscapes of the built environment. Build. Environ. 2016, 108, 284–294. [Google Scholar] [CrossRef] [Green Version]
  24. Yang, W.; Kang, J. Soundscape and sound preferences in urban squares: A case study in Sheffield. J. Urban Des. 2005, 10, 61–80. [Google Scholar] [CrossRef]
  25. Yu, L.; Kang, J. Effects of social, demographical and behavioral factors on the sound level evaluation in urban open spaces. J. Acoust. Soc. Am. 2008, 123, 772–783. [Google Scholar] [CrossRef] [PubMed]
  26. Bild, E.; Coler, M.; Wörtche, H. Habitats Assen Pilot: Testing Methods for Exploring the Correlation between Sound, Morphology and Behavior. In Proceedings of the Measuring Behavior, Wageningen, The Netherlands, 27–29 August 2014. [Google Scholar]
  27. Steele, D.; Steffens, J.; Guastavino, C. The role of activity in urban soundscape evaluation. In Proceedings of the EuroNoise, Maastricht, The Netherlands, 31 May–3 June 2015. [Google Scholar]
  28. Steffens, J.; Steele, D.; Guastavino, C. Situational and person-related factors influencing momentary and retrospective soundscape evaluations in day-to-day life. J. Acoust. Soc. Am. 2017, 141, 1414–1425. [Google Scholar] [CrossRef] [PubMed] [Green Version]
  29. Lavia, L.; Easteal, M.; Close, D.; Witchel, H.; Axelsson, O.; Ware, M.; Dixon, M. Sounding Brighton: soundscapes practical approaches towards better. In Proceedings of the Internoise, New York, NY, USA, 19–22 August 2012; pp. 4544–4552. [Google Scholar]
  30. Easteal, M.; Bannister, S.; Kang, J.; Aletta, F.; Lavia, L.; Witchel, H. Urban Sound Planning in Brighton and Hove. In Proceedings of the Forum Acusticum, Krakow, Poland, 7–12 September 2014. [Google Scholar]
  31. Lavia, L.; Witchel, H.J.; Kang, J.; Aletta, F. A preliminary soundscape management model for added sound in public spaces to discourage anti-social and support pro-social effects on public behaviour Spaces to Discourage Anti-social and Support Pro-social Effects on Public Behaviour. In Proceedings of the DAGA, Aachen, Germany, 14–17 March 2016; pp. 1339–1342. [Google Scholar]
  32. Schafer, T.; Huron, D.; Shanahan, D.; Sedlmeier, P. The sounds of safety: Stress and danger in music perception. Front. Psychol. 2015, 6, 1–9. [Google Scholar] [CrossRef] [PubMed]
  33. Sayin, E.; Krishna, A.; Ardelet, C.; Briand Decré, G.; Goudey, A. “Sound and safe”: The effect of ambient sound on the perceived safety of public spaces. Int. J. Res. Mark. 2015, 32, 343–353. [Google Scholar] [CrossRef]
  34. Cozens, P.M.; Neale, R.H.; Whitaker, J.; Hillier, D.; Graham, M. A Critical Review of Street Lighting, Crime and the Fear of Crime in the British City in 2003. Crime Prev. Community Safe 2003, 5, 7–24. [Google Scholar] [CrossRef]
  35. Tien, J.M.; Donnell, V.F.O.; Barnett, A.I.; Mirchandani, P.B. Street lighting projects. National Evaluation Program, Phase 1 Summary Report; US Dept. of Justice NIJ: Washington, DC, USA, 1977. [Google Scholar]
  36. Peña-García, A.; Hurtado, A.; Aguilar-Luzón, M.C. Impact of public lighting on pedestrians’ perception of safety and well-being. Saf. Sci. 2015, 78, 142–148. [Google Scholar] [CrossRef]
  37. Welsh, B.P.; Farrington, D.P. Effects of Improved Lighting on Crime. 2008. Available online: http://mws-73973.mws3.csx.cam.ac.uk/people/academic_research/david_farrington/light.pdf (accessed on 27 May 2019).
  38. Fotios, S.; Unwin, J.; Farrall, S. Road lighting and pedestrian reassurance after dark: A review. Light. Res. Technol. 2015, 47, 449–469. [Google Scholar] [CrossRef]
  39. Boyce, P.R.; Eklund, N.H.; Hamilton, B.J.; Bruno, L.D. Perceptions of safety at night in different lighting conditions. Light. Res. Technol. 2000, 32, 79–91. [Google Scholar] [CrossRef]
  40. Van Bommel, W.J.M.; Caminada, E. Considerations of the lighting of residential areas for non-motorised traffic. In Proceedings of the CIBSE National Lighting Conference, Warwick, UK, 8–11 June 1982. [Google Scholar]
  41. Nikunen, H.; Korpela, K.M. The effects of scene contents and focus of light on perceived restorativeness, fear and preference in nightscapes. J. Environ. Plan. Manag. 2012, 55, 453–468. [Google Scholar] [CrossRef]
  42. Cellucci, L.; Bisegna, F.; Gugliermetti, F.; Navvab, M. Lighting distribution affects pedestrians’ sense of security. In Proceedings of the EEEIC 2016—International Conference on Environment and Electrical Engineering, Florence, Italy, 6–8 June 2016; pp. 1–5. [Google Scholar]
  43. Boomsma, C.; Steg, L. Feeling Safe in the Dark. Environ. Behav. 2012, 46, 193–212. [Google Scholar] [CrossRef]
  44. Raynham, P.; Saksvikrønning, T. White light and facial recognition. Light. J. 2003, 68, 29–33. [Google Scholar]
  45. Di Stefano, M. Lightscape e percezione dello spazio urbano: il caso del Concourse bridge a Sheffield, Politecnico di Torino. 2017. Available online: https://webthesis.biblio.polito.it/6159/ (accessed on 25 October 2018).
  46. Calleri, C.; Astolfi, A.; Pellegrino, A.; Orecchia, P.; Di Stefano, M.; Bo, E.; Shtrepi, L.; Aletta, F. On the influence of soundscape and lightscape design of public spaces on safety and social presence perception. In Proceedings of the 8th International Symposium on Temporal Design, Bologna, Italy, 14–15 September 2017. [Google Scholar]
  47. Lombard, M.; Ditton, T. At the Heart of It All: The Concept of Presence. J. Comput. Commun. 1997, 3. [Google Scholar] [CrossRef]
  48. Biocca, F.; Harms, C.; Burgoon, J.K. Towards A More Robust Theory and Measure of Social Presence: Review and Suggested Criteria. Presence Teleoperators Virtual Environ. 2003, 12, 456–480. [Google Scholar] [CrossRef]
  49. Warr, M. Dangerous Situations: Social Context and Fear of Victimization. Soc. Forces 1990, 68, 891–907. [Google Scholar] [CrossRef]
  50. Mikulincer, M.; Shaver, P.R.; Pereg, D. Attachment Theory and Affect Regulation: The Dynamics, Development, and Cognitive Consequences of Attachment-Related Strategies. Motiv. Emot. 2003, 27, 77–102. [Google Scholar] [CrossRef]
  51. Viollon, S.; Lavandier, C.; Drake, C. Influence of visual setting on sound ratings in an urban environment. Appl. Acoust. 2002, 63, 493–511. [Google Scholar] [CrossRef]
  52. Pheasant, R.; Horoshenkov, K.; Watts, G.; Barrett, B. The acoustic and visual factors influencing the construction of tranquil space in urban and rural environments tranquil spaces-quiet places? J. Acoust. Soc. Am. 2008, 123, 1446–1457. [Google Scholar] [CrossRef]
  53. Preis, A.; Kociński, J.; Hafke-Dys, H.; Wrzosek, M. Audio-visual interactions in environment assessment. Sci. Total Environ. 2015, 523, 191–200. [Google Scholar] [CrossRef]
  54. Maffei, L.; Iachini, T.; Masullo, M.; Aletta, F.; Sorrentino, F.; Senese, V.P.; Ruotolo, F. The effects of vision-related aspects on noise perception of wind turbines in quiet areas. Int. J. Environ. Res. Public Health 2013, 10, 1681–1697. [Google Scholar] [CrossRef]
  55. Maffei, L.; Masullo, M.; Aletta, F.; Di Gabriele, M. The influence of visual characteristics of barriers on railway noise perception. Sci. Total Environ. 2013, 445–446, 41–47. [Google Scholar] [CrossRef]
  56. Nasar, J.L. Assessing Perceptions of Environments for Active Living. Am. J. Prev. Med. 2008, 34, 357–363. [Google Scholar] [CrossRef]
  57. Bishop, I.D.; Rohrmann, B. Subjective responses to simulated and real environments: A comparison. Landsc. Urban Plan. 2003, 65, 261–277. [Google Scholar] [CrossRef]
  58. European Standardization Organization EN 13201-3: 2015—Road lighting—Part 3: Calculation of performance 2015. Available online: https://shop.bsigroup.com/ProductDetail/?pid=000000000030266811 (accessed on 25 October 2019).
  59. Aletta, F.; Kang, J. Towards an Urban Vibrancy Model: A Soundscape Approach. Int. J. Environ. Res. Public Health 2018, 15, 1712. [Google Scholar] [CrossRef]
  60. Tang, J.; Long, Y. Measuring visual quality of street space and its temporal variation: Methodology and its application in the Hutong area in Beijing. Landsc. Urban Plan. 2018. [Google Scholar] [CrossRef]
  61. Salesses, P.; Schechtner, K.; Hidalgo, C.A. The Collaborative Image of The City: Mapping the Inequality of Urban Perception. PLoS ONE 2013, 8. [Google Scholar] [CrossRef]
  62. Christensen, C.L.; Koutsouris, G. Odeon Room Acoustic Software, Version 13, Full User’s Manual. Odeon A/S, Lyngby (DK). 2016. Available online: http://www.odeon.dk/download/Version13/ODEONManual.pdf (accessed on 25 October 2018).
  63. Ciullo, P. Soundscape and behavioural effects of introduced music in the acoustic environment: A field experiment. Politecnico di Torino, Turin (IT). 2016. Available online: https://webthesis.biblio.polito.it/4634/ (accessed on 25 October 2018).
  64. International Organization for standardization ISO 3382-1:2009 Acoustics—Measurements of room acoustic parameters—Part 1: performance spaces 2009. Available online: https://www.iso.org/standard/40979.html (accessed on 25 October 2019).
  65. Paini, D.; Rindel, J.H.; Gade, A.C.; Turchini, G. The acoustics of public squares/places: a comparison between results from a computer simulation program and measurements in situ. Proc. Inter-Noise 2004, 66, 1–8. [Google Scholar]
  66. Thomas, P.; Van Renterghem, T.; Botteldooren, D. Using room acoustical parameters for evaluating the quality of urban squares for open-air rock concerts. Appl. Acoust. 2011, 72, 210–220. [Google Scholar] [CrossRef] [Green Version]
  67. Iannace, G. The use of historical courtyards for musical performances. Build. Acoust. 2016, 23, 1–16. [Google Scholar] [CrossRef]
  68. British Standard BS 8233: 1999 Sound insulation and noise reduction for buildings—Code of practice 1999; British Standards Institution: London, UK.
  69. Kaiser, H.F. The application of electronic computers to factor analysis. Educ. Psychol. Meas. 1960, 20, 141–151. [Google Scholar] [CrossRef]
  70. Cattel, R. The scree test for the number of factors. Multivariate Behav. Res. 1966, 1, 245–276. [Google Scholar] [CrossRef]
  71. Thurstone, L.L. Multiple factor analysis; University of Chicago Press: Chicago, IL, USA, 1947. [Google Scholar]
  72. Maffei, L.; Masullo, M.; Pascale, A.; Ruggiero, G.; Romero, V.P. Immersive virtual reality in community planning: Acoustic and visual congruence of simulated vs real world. Sustain. Cities Soc. 2016, 27, 338–345. [Google Scholar] [CrossRef]
Figure 1. Aerial view of the university campus with indication of the location of the Concourse Bridge and pictures of the passageway. Elaboration of the authors on the basis of Imagery ©2019 Google Map data ©2019 Google.
Sustainability 11 03000 g001
Figure 2. The current situation of the lighting in the “Concourse Bridge” area. (a) Picture of the current situation; (b) schematic position of the luminaires in the current situation, in the “functional” project and in the “scenographic” project.
Sustainability 11 03000 g002
Figure 3. The three camera positions and the corresponding images of the three lighting scenarios (from left to right column: Camera position; current situation; functional project and scenographic project).
Sustainability 11 03000 g003
Figure 4. Sound absorption and scattering coefficients of the materials considered in the Odeon model.
Sustainability 11 03000 g004
Figure 5. (a) Plan of the area with position of the sound sources and of the receiver (circle) used for sound source calibration. (b) Position of the sources and of the receivers used for simulations and auralizations (P1, P2 and P3) within the Odeon model.
Sustainability 11 03000 g005
Figure 6. (a) Scheme of the realization of the nine audio tracks used in the subsequent laboratory test; (b) calibration setup in the anechoic chamber.
Sustainability 11 03000 g006
Figure 7. (a) Experimental design; (b) example of a test page.
Sustainability 11 03000 g007
Figure 8. Experimental setup (a) and conduction of the perceptual test (b) inside the anechoic chamber.
Sustainability 11 03000 g008
Figure 9. (a) Scree plot resulting from the principal component analysis (PCA), in which the eigenvalues of different components are reported; (b) PCA results; plot of the two-component solution.
Sustainability 11 03000 g009
Figure 10. Scatter plots of the test results with respect to the two principal components derived from PCA. The three different charts represent the results of the scenarios with no background music and for the jazz and classical music backgrounds, respectively. The blue, green and brown circles in each chart represent the scenarios with the current lighting, scenographic lighting and functional lighting, respectively.
Sustainability 11 03000 g010
Figure 11. Interaction plots of the test results with respect to perceived safety (a) and perceived social presence (b).
Sustainability 11 03000 g011
Table 1. Results of the lighting simulations for zones P1 and P2 (as shown in Figure 2).
ParameterRequirementCurrent SituationFunctional ProjectScenographic Project
EN 13201-2P1P2P1P2P1P2
Eav(lux)≥10302617161728
Emin(lux)≥36597714
U(–) 0.20.20.50.40.40.5
Esc(lux)≥294641511
Table 2. The ten items used in the questionnaire, together with the abbreviations that are used hereafter.
ItemAbbreviation
“This area makes me feel worried”Worried
“This area makes me feel tense”Tense
“This area makes me feel comfortable”Comfortable
“This area makes me feel safe”Safe
“This area makes me feel alone”Alone
“This area is a friendly place”Friendly
“This area seems to be alive”Alive
“There is a sense of human warmth in this area”Human warmth
“I feel like there are others in this area”Presence of others
“I feel human sensibility in this area”Human sensibility
Table 3. Rotated component matrix * for the 10 items used in the questionnaire.
Component
12
Worried−0.880−0.061
Tense−0.879−0.137
Comfortable0.6930.403
Safe0.7360.271
Alone−0.596−0.283
Friendly0.6260.593
Alive0.5600.664
Human warmth0.5340.705
Presence of others0.0310.810
Human sensibility0.1800.716
* Extraction method: Principal component analysis. Rotation method: Varimax with Kaiser normalization–rotation converged in three iterations.

