Article

Indicators for Monitoring Urban Climate Change Resilience and Adaptation

1
Institute of Spatial and Regional Planning (IREUS), University of Stuttgart, 70049 Stuttgart, Germany
2
Department of Geography, Justus-Liebig University Gießen, 35390 Giessen, Germany
3
adelphi, 10559 Berlin, Germany
4
DIALOGIK, 70176 Stuttgart, Germany
*
Author to whom correspondence should be addressed.
Sustainability 2019, 11(10), 2931; https://doi.org/10.3390/su11102931
Submission received: 30 April 2019 / Revised: 17 May 2019 / Accepted: 21 May 2019 / Published: 23 May 2019
(This article belongs to the Special Issue Bridging the Gap: The Measure of Urban Resilience)

Abstract

:
In the face of accelerating climate change, urbanization and the need to adapt to these changes, the concept of resilience as an interdisciplinary and positive approach has gained increasing attention over the last decade. However, measuring resilience and monitoring adaptation efforts have received only limited attention from science and practice so far. Thus, this paper aims to provide an indicator set to measure urban climate resilience and monitor adaptation activities. In order to develop this indicator set, a four-step mixed method approach was implemented: (1) based on a literature review, relevant resilience indicators were selected, (2) researchers, consultants and city representatives were then invited to evaluate those indicators in an online survey before the remaining indicator candidates were validated in a workshop (3) and finally reviewed by sector experts (4). This thorough process resulted in 24 indicators distributed over 24 action fields based on secondary data. The participatory approach allowed the research team to take into account the complexity and interdisciplinarity nature of the topic, as well as place- and context-specific parameters. However, it also showed that in order to conduct a holistic assessment of urban climate resilience, a purely quantitative, indicator-based approach is not sufficient, and additional qualitative information is needed.

1. Introduction

Our society is facing multitudinous different challenges—in this paper we are focusing on two main challenges: climate change and urbanization. In 2015, 3.9 billion people were living in cities. By 2050, the population in cities is projected to reach up to 6.7 billion people [1]. Urban agglomerations will continue to grow and are increasingly threatened by the high uncertainty of climate change impacts [2]. In response to these impacts, cities are already implementing climate change adaptation measures in order to prepare for uncertain future changes. Adaptation to climate change and climate variability is not a new phenomenon [3]. However, steadily rising temperatures, increasing magnitude and frequencies of climate-induced extreme events, such as droughts, floods, storms or intense rainfall, as well as the growth of the global human population pose new adaptation challenges to humankind [3]. In our research, we use the term adaptation as defined by the United Nations Climate Change [4]: “Adaptation refers to adjustments in ecological, social, or economic systems in response to actual or expected climatic stimuli and their effects or impacts. It refers to changes in processes, practices, and structures to moderate potential damages or to benefit from opportunities associated with climate change”. Furthermore, the ability of adaptation is understood as part of resilience, as described by Folke et al. [5]. The concept of resilience can be attributed to Holling [6] and originates from ecology. He described resilience as the “measure of persistence of systems and of their ability to absorb change and disturbance and still maintain the same relationship between population or state variables” [6]. The original concept of resilience gained increased importance in other disciplines, whereby the definitions of resilience were steadily differentiated, broadened and deepened. There are three main understandings of the character of resilience: “bounce back” which refers to the fast return to an equilibrium state of a system after a shock event, “bounce forward” which focuses on a system which should have capacities to be adapted to uncertainty and “both” which addresses the co-occurrence of the capacities for “bounce back” and “bounce forward” [7]. Meerow et al. [2] analysed 57 academic definitions of urban resilience, with particular regard to these fundamental understandings of urban resilience. The analysis showed that 35 definitions focus on “bouncing back”, 15 on “bouncing forward” and only seven see both capacities as elementary for resilience. Figueiredo et al. [8] pointed out that the definitions shifted from an equilibrium-centred understanding of resilience towards an evolutionary/transformational understanding of resilience. Four main approaches to resilience can be identified: disaster risk reduction [9], socio-ecological [10], sustainable livelihoods [11] and the community-oriented approach [12]. Resilience can also be discussed on different scales (county, region, urban area, city, community and household) [8]. Even though it is important to take action on all scales, in this work we are focusing on cities—particularly in Germany—and are using the socio-ecological approach. Besides the definitions and understandings of resilience in academia, it is very important to also consider how practitioners interpret resilience. Practitioners and policy makers are a central part of the resilience-transformation process. Therefore, it is remarkable that the term resilience is interpreted in a much wider range of ways by practitioners than by academia [13].
Adaptation measures are implemented in different sectors of the city system. Since cities are complex and multifaceted systems, which in turn contain other systems, measuring the success of resilience-increasing activities poses a particular challenge. However, measurement is of great importance in order to be able to govern and steer the adaptation and transformation process. Every city has its specific context and needs, and its exposure to risk and vulnerability is dynamic and changes over time [8].
However, it is important to develop measurable indicators for different reasons. Indicators enable monitoring of the resilience-building process, as they provide regular and impartial feedback. They build an evidence base and make resilience more tangible for decision and policy makers as well as society at large. Furthermore, indicators can help to govern and steer the transformation process because they help to structure the new field of urban climate resilience. Clear indicators are not only important for the general measurement of resilience, but also for the analysis of whether adaptation measures were effective and whether the expected results were achieved [14]. Indicators also contribute to the credibility, transparency and accountability of the measures implemented. This in turn is very important for local policy makers to support further adaptation measures.
However, the development of indicators in this context poses particular challenges. In addition to the conceptual challenges of urban climate resilience, context specificity represents another challenge for the development of resilience indicators. Consequently, it is very important to consider how to include context specificity in the indicator set. Another fundamental consideration is in regard to the context-specific, dynamic and ever-changing nature of risk and vulnerability [8].
MONARES (monitoring of adaptation measures and climate resilience in cities), a project funded by the German Federal Ministry of Education and Research (BMBF), was initiated in order to address the main challenges of (1) developing a consistent understanding of resilience for both practitioners and academia, (2) shaping the adaptation and transformation process into a transparent process of governing and steering and (3) the use of resilience and adaptation measurements. The aim of MONARES is to create application-oriented methodologies for monitoring and evaluating local adaptation measures. As we are focusing on the special needs for cities in Germany, we are working together with 14 other projects of the funding initiative “Climate resilience through action in cities and regions” of the BMBF, who are focusing on climate change adaptation measures and urban resilience, as well as doing on-the-ground research in municipalities across Germany. These projects and cities differ considerably concerning scale (street, district, city, suburbs and region), inhabitants and type of adaptation measure (e.g., planning, physical infrastructure, capacity building or greening). Important commonalities of the projects are their interdisciplinary approach, the aim to enhance urban climate resilience and that they conduct on-the-ground research. However, the projects test many different pathways to improve resilience, and MONARES is focusing on how to measure the success and impact of these different projects and activities with a common set of indicators. In order to ensure applicability, we began to involve the projects at an early stage of our research. The first key step (Figure 1 Phase 1) before developing the indicators was to develop a framework [15] to describe urban resilience. Based on 19 frameworks described in the literature [16,17,18,19,20,21,22,23,24,25,26,27,28,29,30,31,32,33,34], our first draft was developed, which then was modified together with the projects. This process was indispensable as it resulted in a definition of urban resilience that is suitable for all projects so that there was agreement on common basic principles.
Based on steps 1 to 3 as shown in Figure 1, the final definition of urban resilience in MONARES is as follows:
The climate resilience of a city depends on the ability of its sub-systems to anticipate the consequences of extreme weather and climate change, to resist the negative consequences of these events and to recover essential functions after disturbance quickly, as well as to learn from these events and to adapt to the consequences of climate change in the short and medium term, and transform in the long term. The more pronounced these abilities are, the more resilient a city is to the consequences of climate change. All abilities are important.
Based on this preliminary work, a four-step mixed-method approach (Figure 1 Phases 4–7) was designed to develop the indicators for urban climate resilience on which this paper focuses.

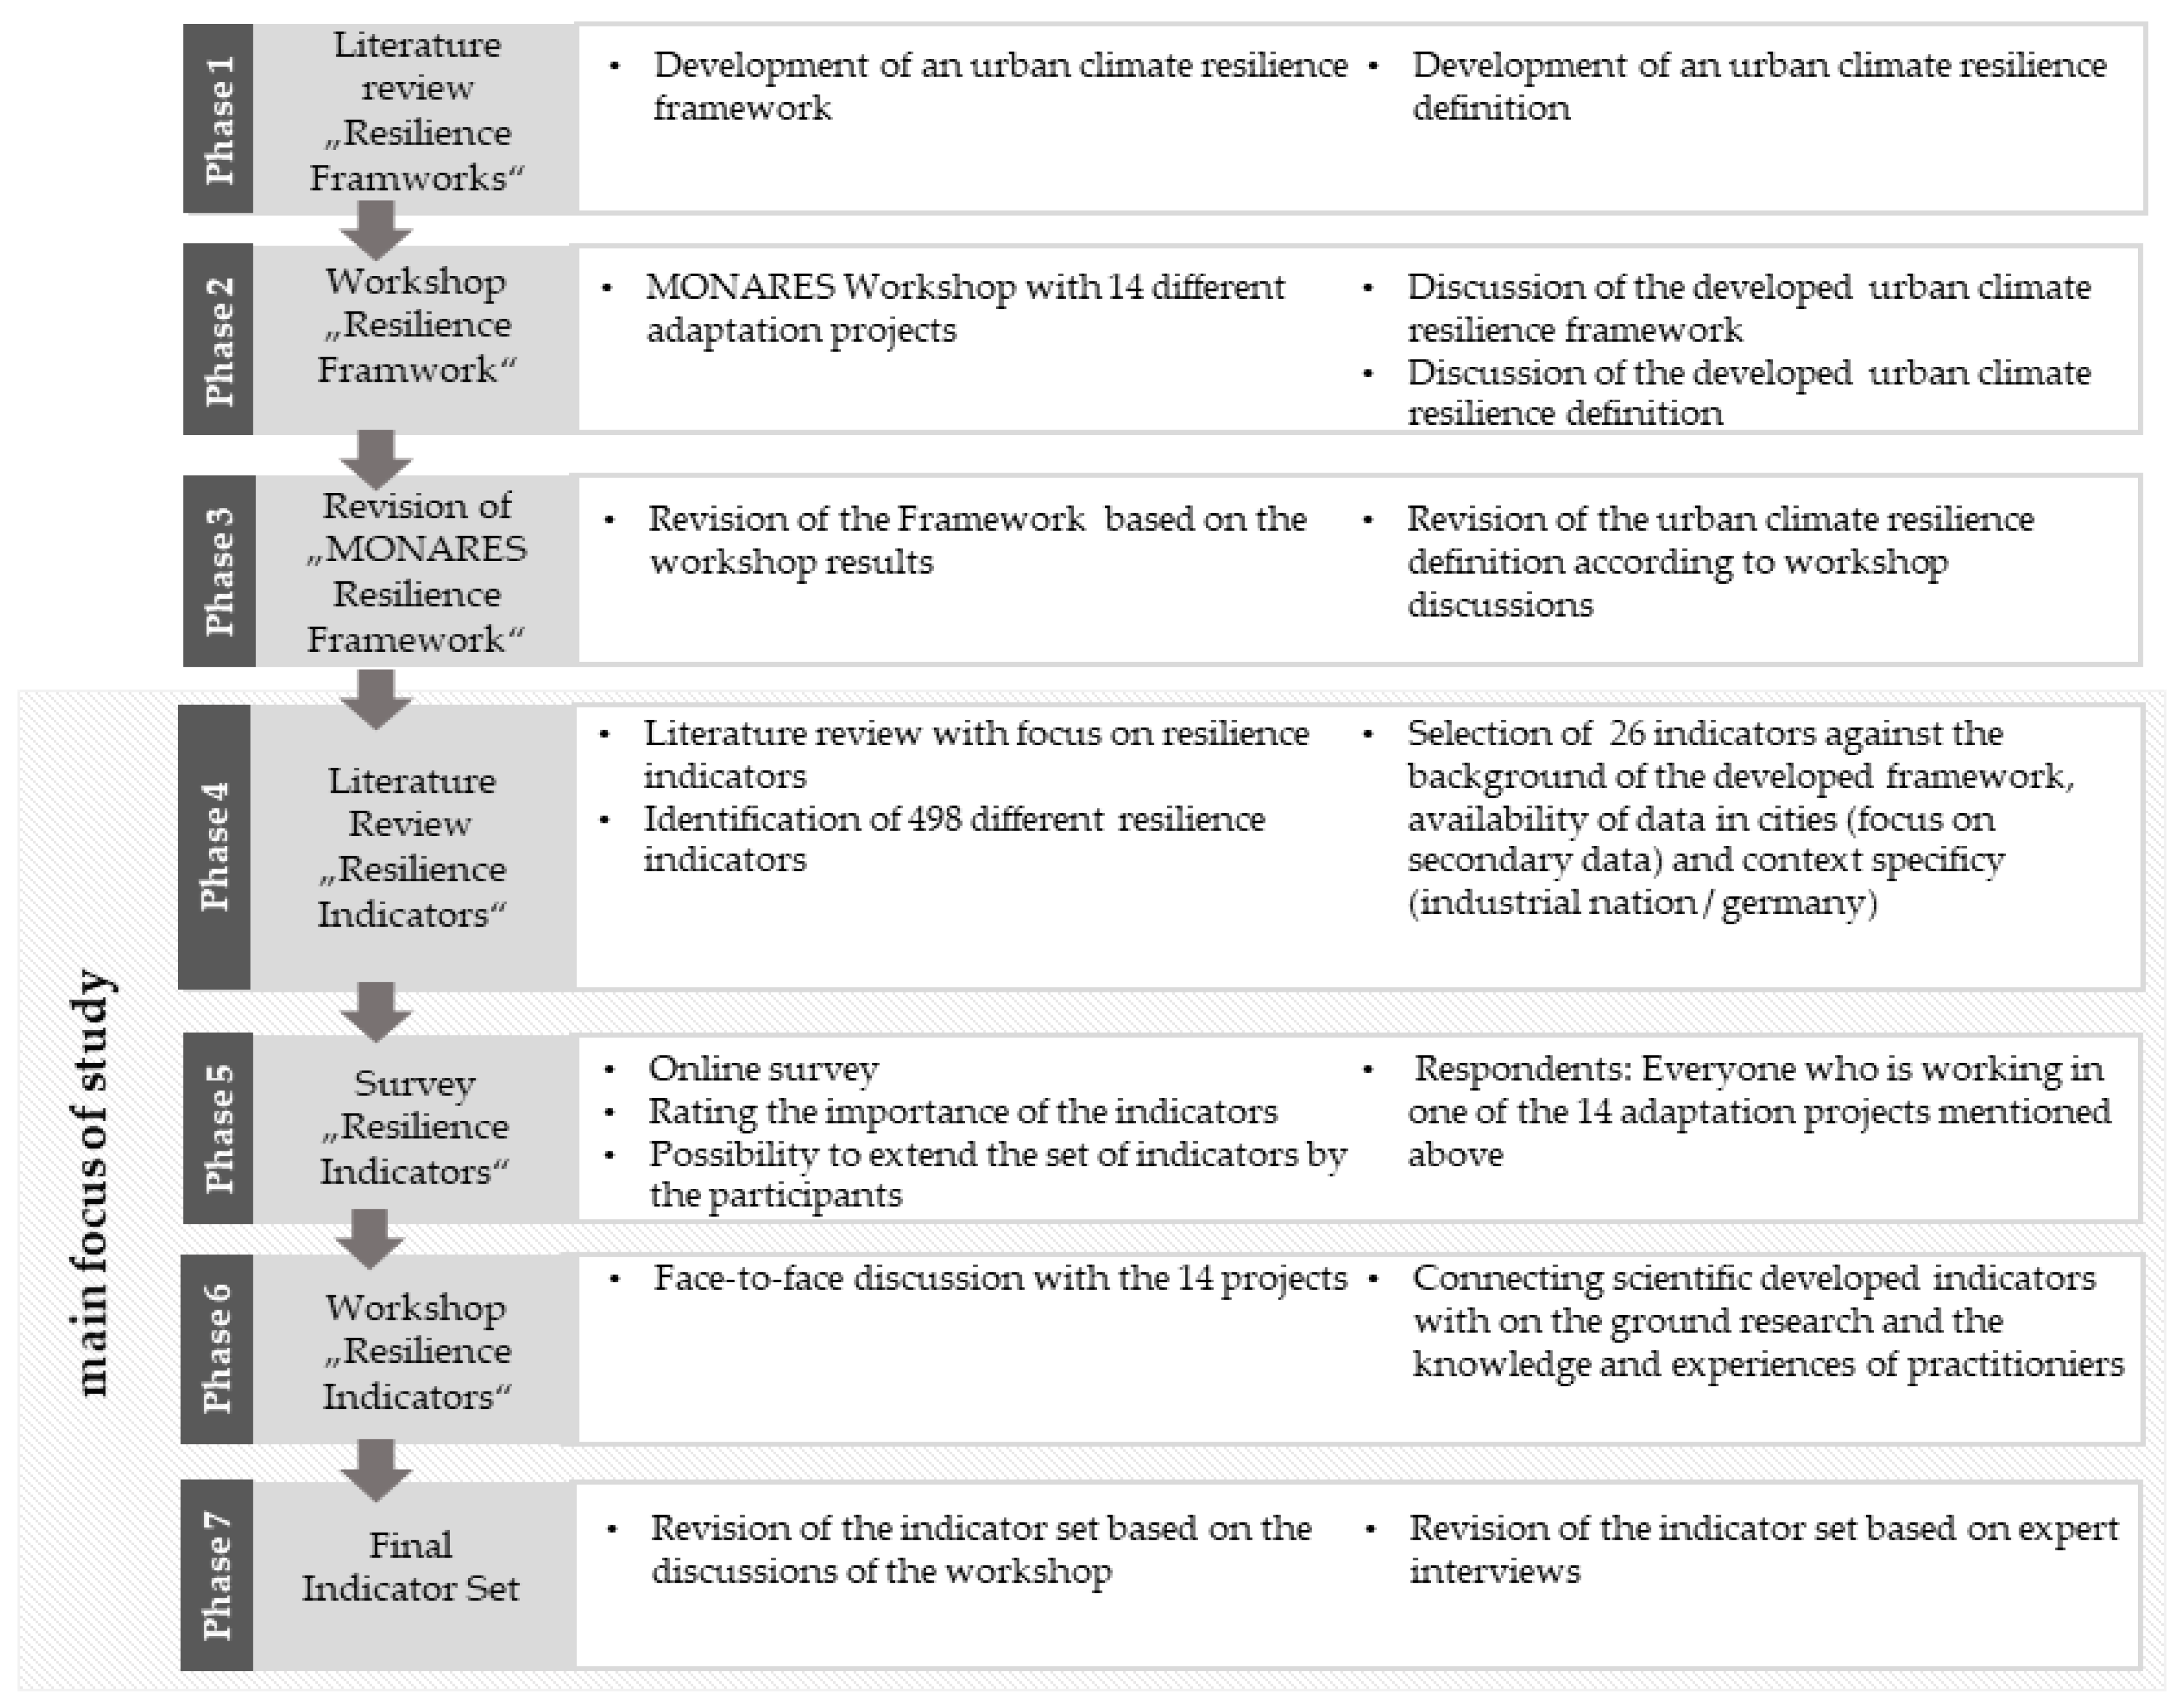
2. Materials and Methods

The exponential growth of literature concerning urban resilience contains a multitude of approaches, indicators and methods stressing the resistance of an urban system. The development of the method of this paper was guided by the questions: resilience for whom, for what and where [35]. A reflexive approach of input and feedback loops was developed in order to adapt and validate international indicators. A main challenge was to adapt the indicators to the specific context of German communities in the face of climate change.

2.1. Literature Review: “Resilience Indicators”

The selected frameworks (see Figure 1 Phase 1) were identified through an extensive literature review using the key search terms “resilience”, “urban resilience”, “climate resilience”, “adaptive capacity + urban/city”, “resistibility + urban” and “learning capacity + urban/city” (in German and English). Based on these frameworks and their operationalisation of resilience, an extensive list of indicators was deduced. These indicators were matched with the MONARES framework, developed in steps 1–3, which consists of dimensions and action fields (see Table 1).
As we have the aim to develop a user-friendly, applicable and transparent indicator set, we firstly reduced the indicators to two indicators per action-field. The two most important selection criteria were (1) context specificity of industrial nations, especially Germany, and (2) data availability. Context specificity is important because many of the indicators in the literature are suitable for the context of the Global South but not for the Global North, and even indicators that might be suitable for the Global North might not be suitable in the German context. The second criteria—data availability—is therefore important because municipalities have, on the one hand, good access to a lot of data but have, on the other hand, resource problems regarding time, finances and human resources. Action fields without literature-based indicators required the development of new ideas within the project. Given the available data, some action fields were difficult to measure without significantly neglecting the complexity of the action field.

2.2. Survey to Assimilate the Indicators for Context Specificity

Based on the literature review (see Figure 1 Phase 4) and the described selection process, an online-survey was developed (see Figure 1 Phase 5). The survey was used because, given that the indicators should be transparent and user-friendly, not only the scientific background is important, but a clear understanding of the indicators in the broad community is important also. The survey was sent to all persons who are working in one of the 14 projects mentioned above. 39 people answered the survey.
The main aim of the survey was to measure how participants assess the different indicators. They were requested to rate the importance of every indicator regarding urban climate resilience on a scale from one (low importance) to five (high importance). Each action field was represented by at least one indicator (Table 1). Besides the rating of indicators, the survey consisted of four chapters: First, some general background; Second, the context of urban climate resilience; Thirdly, the indicators; Fourthly, the possibility of extending the set of indicators by indicators without existing data sources, and some final remarks.

2.3. Workshop Following the Survey

As mentioned previously, the explanatory power of an indicator set of urban climate resilience is hugely dependent on the context, and therefore we discussed the results of the survey again with the 14 projects (see. Figure 1 Phase 6). Moreover, this feedback loop increases the transparency of the process and the robustness of the results. The workshop started with presenting the survey results and then the participants were split into two groups in order to create two independent feedback loops and cross-validation of the indicator set. For each group, a poster was prepared, listing all indicators included in the survey. The indicators that were ranked lower in the survey were written on the poster in light grey (compared to black), for an improved visualization of the survey results. Hence, both groups had the visual results to discuss and were asked to compare each pair in detail and find explanations for the survey results. In addition, the overall set remained visible, which allowed participants to keep the important question of the overall themes in mind. Therefore, indicators could be moved across the set or could become more important if they were deemed a missing piece in the mosaic. The guiding questions for this phase of the workshop were: (1) Are there enough indicators? (2) How many indicators are needed and sufficient? (3) Are the selected indicators the right ones or should they be changed? And (4) are there important gaps in the set that are yet to be filled?

2.4. Finalizing the Indicators Set

In Step 7 (see Figure 1) we analyzed the results of the workshop. Furthermore, expert interviews with practitioners were conducted with the aim to develop indicators in action fields where neither the literature review nor survey and workshop produced results. On this basis, we finalized the urban resilience indicator set.

3. Results

In our review of the academic literature, 19 indicator-based resilience frameworks were analyzed. Based on the indicators of these frameworks a list of 498 indicators (including duplicates) was generated. The indicator list was used as an important starting point for developing the MONARES Indicator Set (MIS). After screening the indicators through the lens of the MONARES-framework, some action fields remained empty and were filled by proposed indicators of the MONARES project-team. One to four indicators were selected per action field in order to cover all topics and include sufficient redundancy. Table 2 shows the selected and proposed indicators.

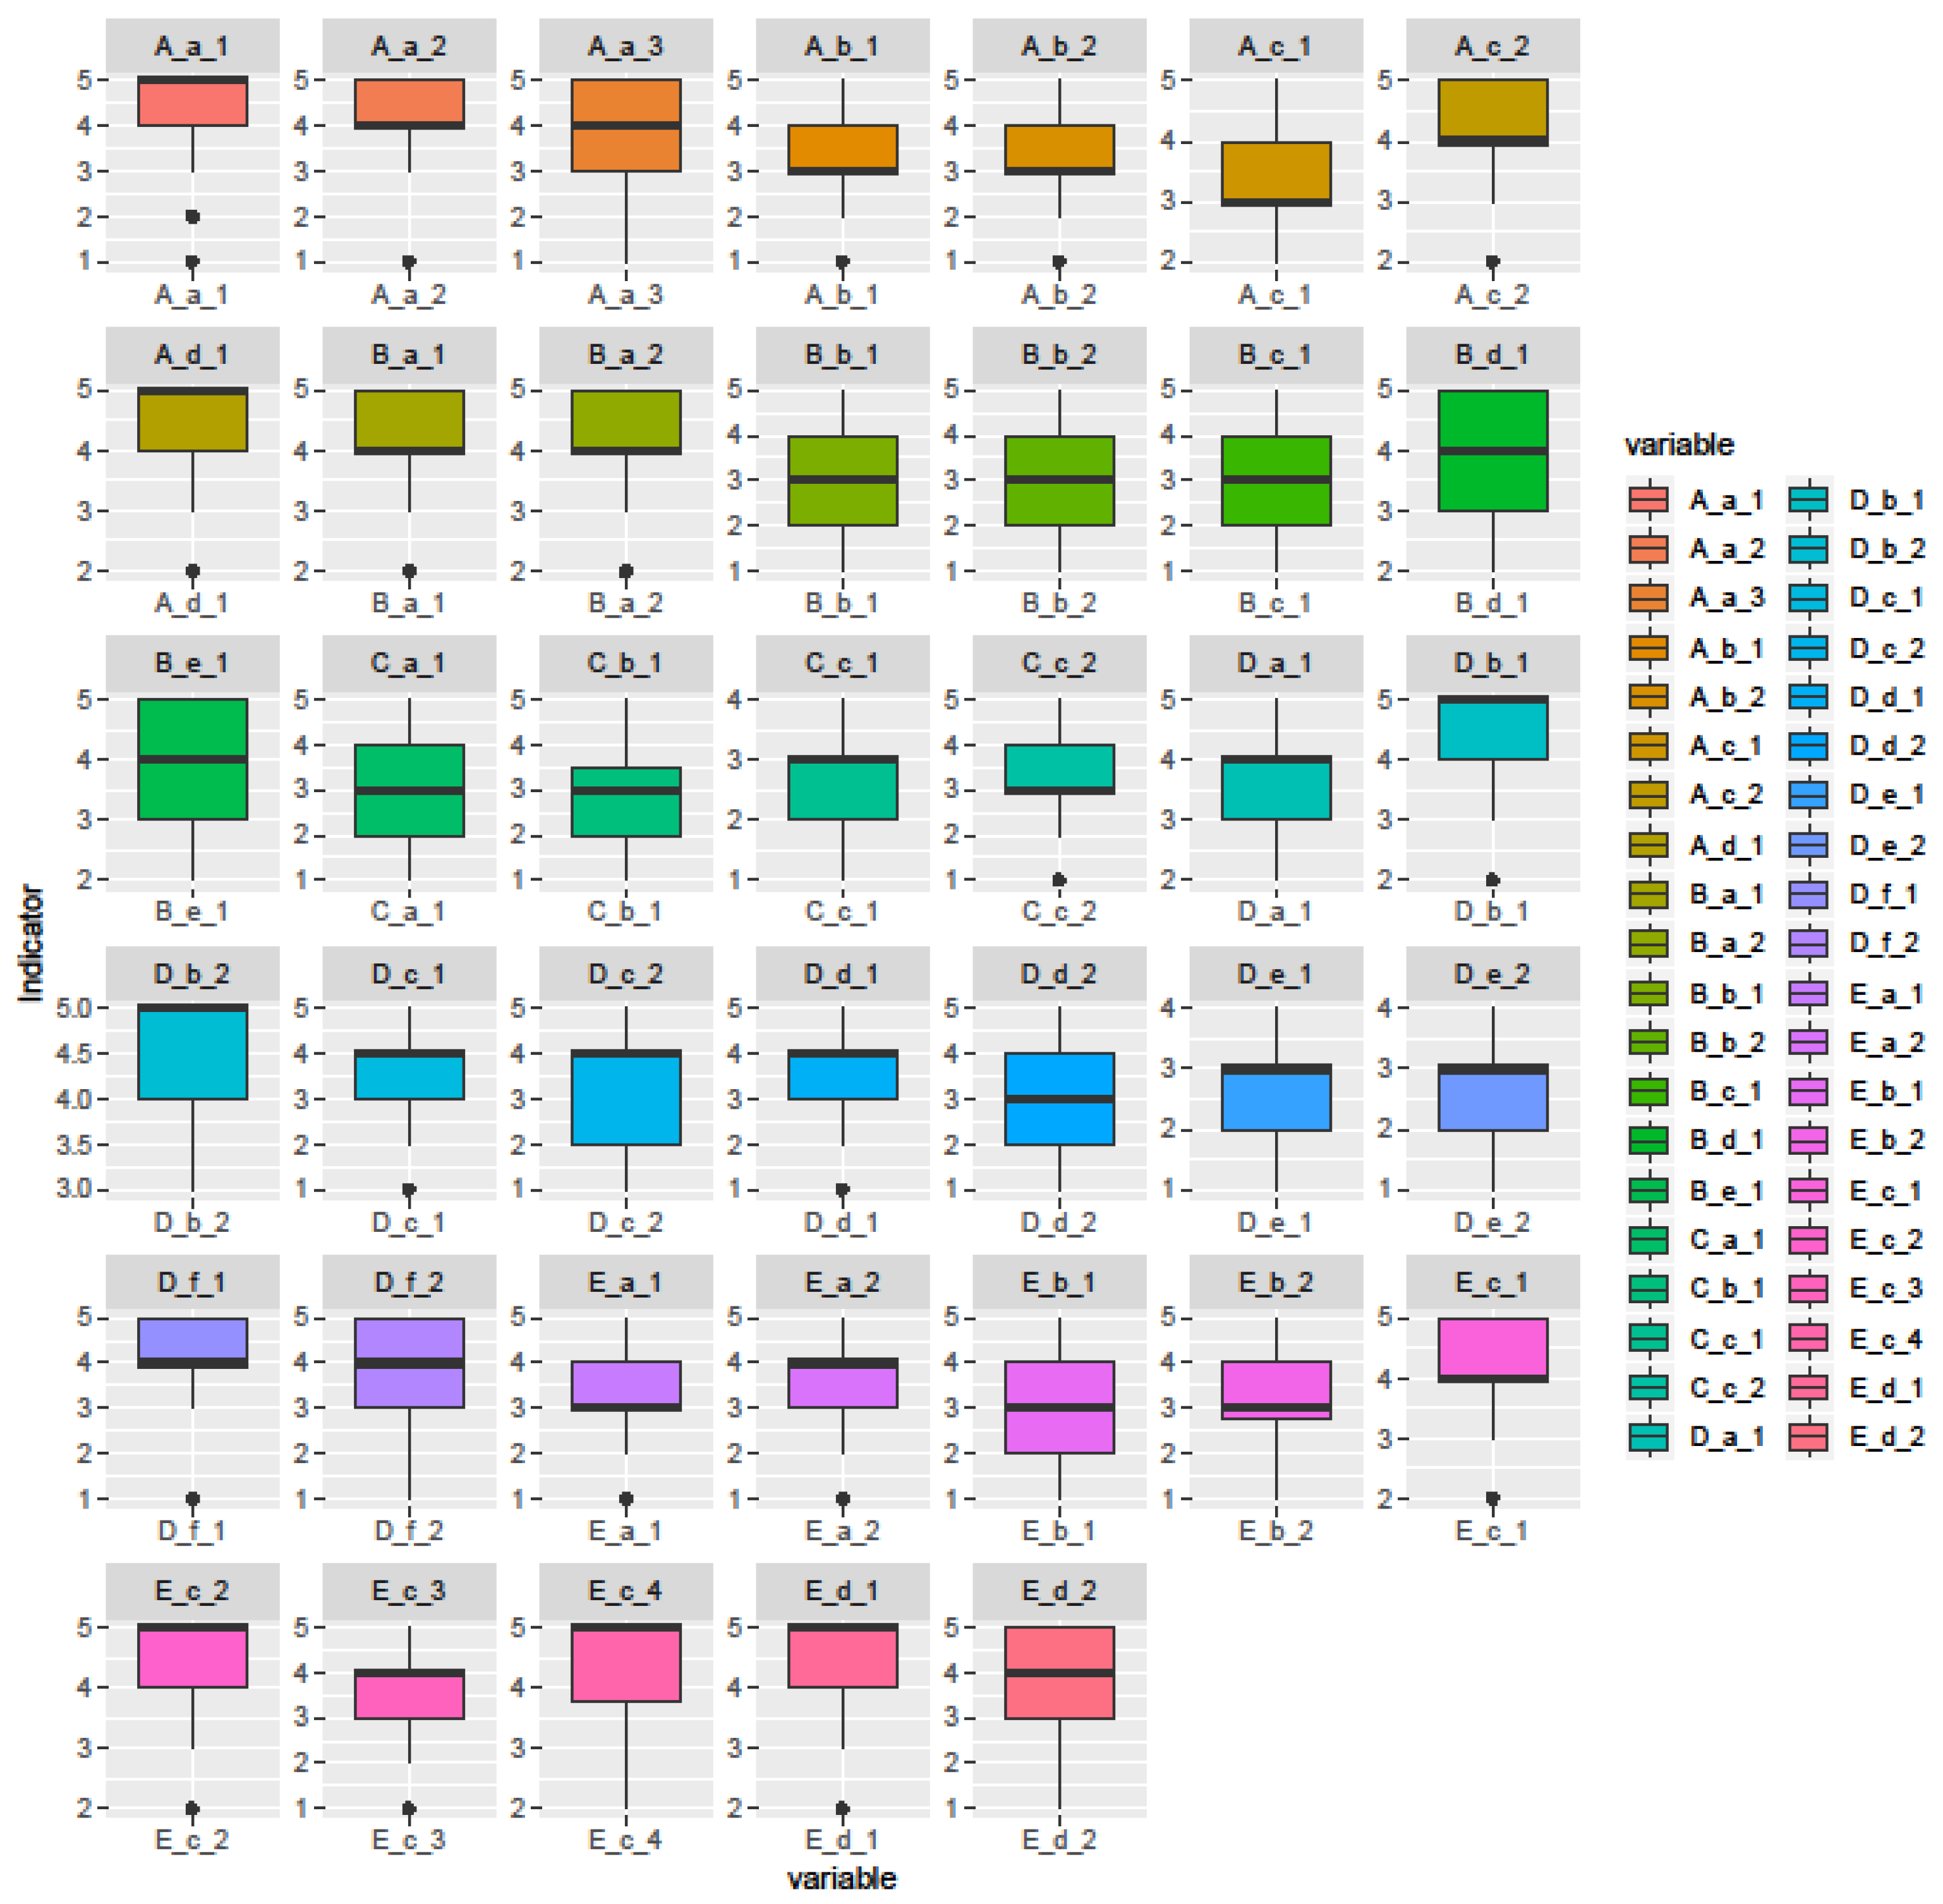
3.1. Survey about Resilience Indicators

The survey was structured based on the results of Phase 4. The survey (Figure 1 Phase 5) was filled out by 39 respondents within the funding initiative “Climate resilience through action in cities and regions” of the BMBF. The overall mean perceived importance of the indicators was 3.63 within the complete range from one to five. Considering the complexity of the urban system and the interdisciplinary character of the indicator set, this rating was regarded as high. The median of four was also high. The standard deviation of 1.17 together with the entire evaluation range reflected the diversity of interpretations. Nevertheless, despite this diversity, these core numbers show that the indicators were overall judged as important. Splitting the indicators into the five main dimensions (Figure 2), the median shows that only the indicators within the dimension of economy were rated less important, they are rated in the middle of the range, which might indicate a slight indecisiveness. Several reasons could explain this, such as that the indicators selected were not covering the dimension in a satisfactory manner or that the dimension is perceived as unrelated to urban climate resilience. Those questions were discussed in the workshop (Figure 1 Phase 6) in detail.
All top five ranked indicators had a median rating of 5. The mean values ranged from 4.4 to 4.6. Only two respectively three respondents did not rate the indicators, showing the general agreement regarding the importance. Nevertheless, regarding the minimum values, all had a large range from 2 to 5.
The set of five indicators in Table 3 shows that the three dimensions environment, governance and society were seen as particular important. The indicator rated as the most important was the environment indicator cold air parcels. Second and fourth ranked were governance indicators, namely inter-offices working groups regarding risk, climate change and resilience and strategies against heavy rain and heat in plans. Third and fifth ranked were two indicators from the dimension society. The respondents saw the importance of experience with extreme events in the last five years and citizen information about heat, heavy rain and flooding as particularly crucial for building urban resilience.
Table 4 displays the five lowest ranked indicators in context of their relevance related to urban climate resilience. The overall lowest rated indicators were both from the society dimension, namely voter turnout and number of associations. The respondents did not think that they were relevant for measuring and monitoring urban resilience. The third lowest indicator was the infrastructure indicator broadband access. Fourth and fifth were two economic indicators measuring ratio insolvencies to start-ups and share employees in largest sector.
Figure 3 displays boxplots of all indicators. The main tendency has already been shown in a more condensed form previously in Figure 2. Share of nature conservation and protection areas (A_c_1) was the lowest ranking in the dimension environment. The second indicator of the action field biodiversity, however, received high approval, which emphasised the perceived importance of biodiversity considerations for climate resilience in the urban context. Settlement structure (B_a_1&2) was seen as vital for structural climate change adaptation, similar to the first action fields of soil and green spaces (A_a_1-3).
Energy (B_b_1&2) indicators, in contrast, not only ranged from a rating of one to five, but the quartiles of the boxplot also show a comparably high range around the middle of the scale.

3.2. General Workshop Results Regarding the MIS

The discussion of the indicators during two discussion groups yielded important feedback on the overarching attributes and requirements of the MIS. They were mentioned several times from different persons and related to different indicators. Firstly, one important aspect was the size of the municipality and hence the scaling of the indicator. No universal scaling was found appropriate, since the different units and scales required indicator-specific scaling. Nevertheless, the scaling was seen as an important factor in order to reach the goal of acquiring indicators for municipalities and therefore an interpretable result on this level of administrative organization.
The overall discussion about applicability and feasibility was touched on in many ways from different angles, most prominently regarding data availability, numbers of indicators and total effort needed. The balancing of the loss of information related to simpler indicators or vice versa with more complex indicators with higher explanatory power but with an infeasibility to be handled by the target group was seen as a key challenge. Therefore, the participants agreed that the indicators should be based solely on existing data, thereby reducing the overall effort and simplifying the calculations and data management.
The idea of detailed factsheets describing the data source and calculation of the indicator and helping with the interpretation of the result was raised by participants and received wide support. Factsheets also help to communicate the meaning of an indicator to uninitiated persons, which was also mentioned as a crucial aspect.
The total number of indicators to be feasible was seen at around 25. Certain gaps were identified during the workshop due to the fact that specific expertise related to certain action fields was missing in the room, specifically regarding the action fields energy, wastewater and civil protection. Here, single expert interviews were carried out after the workshop to fill in the gaps.

3.3. Indicator Specific Workshop Results

Table 5 summarizes the process of indicator development during the three phases of the survey, the workshop and ending in the final set of indicators. The indicators highlighted in grey are those of the initial indicator set that were seen as important by survey respondents and therefore stayed on the list. The indicators highlighted in orange were updated or modified as a result of the survey and/or workshop. The yellow indicators were moved from one action field to another. The indicator degree of soil sealing was inverted to degree of unsealed ground, as sealing is not per se negative, even may even be desirable or unavoidable in urban areas. The cold air parcels was seen as an important factor of resilience but should be updated, adding cold air streams to the indicators. Biodiversity was discussed in contradictory ways, as it was not clear to the participants how it is related to climate hazards. Hence, the workshop resulted in representing urban biodiversity with the indicator wetland and retention areas in order to include flood protection arguments into the indicator of biodiversity.
Infrastructure was seen undoubtedly as a key area for achieving urban climate resilience, but also related to secondary data and its inherent complexity most difficult to quantify currently. Accessibility of green spaces was rather seen as an indicator of social justice and less as a settlement structural indicator and hence the second indicator building density, slightly lower ranked in the survey, was included instead. The share of renewable energy indicator focused strongly on climate protection and less on resilience factors, such as robustness and redundancy. These factors were seen to be better covered by the diversity of renewable energy sources. However, it was also argued that even conventional energy should be included in the indicator. This observation was followed by the consideration that no climate resilience can be achieved without climate protection in the long term. Therefore conventional energy sources cannot be regarded as a positive contribution to climate resilience in the long term. The action field of telecommunication was deleted in accordance with the participants’ perception of this as being less important than the other action fields, lacking data and having low to no influence of the municipality. Instead, the action field wastewater treatment was included, as there was agreement on its importance additionally to the supply side. No specific indicator was defined in the workshop due to missing competence in this regard. Transportation was discussed as an important action field for municipalities, but participants agreed that its complexity cannot be covered by one indicator. Therefore, the action field remained as an action field of the framework, reminding of the importance of the topic and urging municipalities to consider and discuss it qualitatively.
The discussion around the economic dimension reflected the lower ranking of its indicators in the survey. The dimensions environment and infrastructure were seen to be more naturally linked to resilience than the economic dimension. Nevertheless, discussing the importance of a resilient economy for an urban system generated acceptance for the dimension and its components. This example illustrates one very important lesson of the workshop: the need for explanation and building a common understanding. Innovation was seen to be covered best by the number of employees in research intensive companies not by the innovation index. The tax income from companies was considered an important resource for the financial ability of the municipality to adapt. This indicator was part of the action field municipal budget in the survey and has since been moved to business. Similar to energy, a diverse economy was considered more robust, flexible and redundant when facing uncertainty of climate impacts. It was also discussed whether there might be sectors with crucial or higher relevance than others, but the group agreed that no single sector could be selected.
There was a general agreement on the importance and contribution of society to urban climate resilience, but less agreement on how to measure it quantitatively. Literature shows that the experience with extreme events contributes positively to citizens’ resilience. In addition, citizen information about heat, heavy rain and flooding (Table 3) was amongst the top five rated indicators. However, regarding the spatial scale of municipalities, it was argued that information is not only provided by the local authority and therefore the indicator was not further considered. Civil society started an intense discussion on how to measure it and if the proposed indicators were adequate. In contrast to the survey, where the indicator voter turnout ranked higher, the workshop participants disliked this indicator, arguing that voter turnout nowadays cannot be seen as a proxy indicator for solidarity and community in Germany. The indicator associations was also critically reflected upon as being unable to capture civil society entirely. Still, the participants were in favour of the imperfect indicator associations instead of deleting the action field. In the survey, the dimension governance and its indicators were ranked high, and this result was confirmed in the workshop. Only one change was decided: replacing the contact point for participation processes with the number of conducted participation processes. Both were ranked very close in the survey with a mean of 3.3 and 3.4, respectively.

3.4. Urban Climate Resilience Indicator Set

Since even the diverse group of participants of the workshop did not cover all topics of the indicator set, experts were interviewed. Furthermore, the results of the survey and the results of the workshop were summarized and merged.
The final set of indicators is shown in Table 5 in the column MIS. Compared with the workshop set, the action field of biodiversity was seen crucial in its own right and better approximated by the indicator nature conservation and protection areas. Moreover, wetlands and retention areas were already covered by the state of the water bodies in line with the European Water Framework Directive regarding good ecological and chemical status. Hence, in order to create a balanced set of indicators, it was seen that the latter indicator added thematically more information and another aspect to the overall set. Secondly, the air action field was further developed, as cold air parcels and flows was difficult to interpret. The simple number or share of cold air parcels and streams were not clearly related to resulting air status. The ventilation status including the effects of air streams and cold air production parcels was therefore selected. For the wastewater action field introduced by the workshop, an expert interview recommended the indicator share of adopted sewer system. Another interview was conducted with the lower civil protection agency. The interviewee stressed the importance of volunteers across organizations, but as no data were gathered assessing the total numbers of volunteers, the most important one of the fire brigade was considered. Moreover, the municipality may have to consider this important topic even more in the future, as the principle of volunteers may be endangered due to demographic development. Finally, yet importantly, the accessibility of hospitals was interchanged with the density of doctors.

4. Discussion

The results from the work on indicators for monitoring urban climate resilience presented above yields a number of important insights and implications—with respect to previous studies but also for future research and for practitioners in this field.
Existing indicator sets are a good starting point, but adapting and extending them for the context at hand is crucial. There are numerous indicator sets for urban resilience; these provided a good basis from which the MONARES indicator set could be developed. However, many of the indicators analysed in the literature review were aimed at the context of developing countries. To adapt indicators identified in the review for the German context, four steps were important: (A) Disregarding indicators that do not allow sufficient distinction between cities, e.g., literacy rate is favoured as an indicator in many sources, but in Germany the literacy rate is rather high and differences between cities are marginal. (B) Disregarding indicators for which the data availability was rather limited in Germany. (C) Adding new indicators for action fields that are deemed important in the context of MONARES but which were not touched upon in the literature. (D) Focusing on municipalities as the key player for climate change adaptation. These level of municipalities require the set to be manageable in terms of data availability as well as size and complexity of the calculations.
Step A did not pose any major difficulties. Further, step B based on research concerning data availability did not cause problems. However, step C and D need to be examined in more detail.
First, the workshop clearly stated here the conflicting goals when discussing single action fields. It was felt that one indicator does not reflect the entirety of the topic, but at the same time all action fields were considered important and the total number of indicators should not exceed around 20, in order to stay manageable, which is far less than the proposed 52 indicators by the City Resilience Index (CRI) [22] and comparable to the core of 14 by the project Building Resilience Amongst Communities in Europe (embrace) [37] or Cutter’s [43] core of 22. Since researchers, as well as practitioners, participated in our workshop, we had the impression that researchers tended to prefer larger, encompassing indicator sets. Compared with the scientists, practitioners were more in favour of concise and compact sets. The discussions in the workshop showed that persons with a research background had numerous ideas for new indicators for all dimensions, and advocated for their inclusion. During the workshop and its aftermath, practitioners working in municipalities displayed a different tendency—their perspective tended to focus more on how to handle the indicators in practice. Hence, what some researchers considered a concise indicator set was perceived by practitioners as overwhelming and too extensive. In order to find an adequate balance between a broad coverage and good usability in practice, it is important to involve both researchers and practitioners in the development of an indicator set. This finding is consistent with the literature and is one strength of the current study. Meerow and Stults [13], for example, stress the need for including practitioners in the process. Consequently, the trade-off between practicability and completeness had to be balanced, leading to the fact that some indicators that were considered important were still sorted out in order to cover all action fields and still achieve a manageable amount of indicators.
Second, it was mentioned that the indicators just by title were not clear in terms of their effect on and relation to urban climate resilience, and were consequently rated around the middle. This fact was considered while developing the survey, but an in-depth explanation of indicators was removed from the survey in favour of including more indicators covering all action fields and in consideration of the time needed to fill out the survey. However, this lack of explanations meant that the disciplinary background of respondents affected the ratings.
Third, indicators from the dimension environment were met with relatively high consensus while indicators from the dimension economy were faced with more diverging opinions. The indicator selection was dependent on the conceptualization of urban resilience and the urban context. The results contribute to the gap between the understanding of urban resilience by scholars and practitioners [13]. This became apparent both in the survey and the workshop and shows that more research is warranted on what characterizes a climate resilience urban economy. Supporting evidence for this can be taken from the fact that much more has been published on climate resilience and environmental issues than on climate resilience and economic issues. Moreover, this discussion displayed the importance of a negotiation-focused approach for defining place-specific attributes of urban resilience and its measures [44].
Fourth, secondary data was seen as crucial for monitoring purposes in order to reduce resource expenditure by the administration. In other words, “The best indicator is inoperable if there is no feasible way to obtain the required data.” [37]. Moreover, there was a strong request from the local administrations for more provision of data from the higher administrations. They argued that data handling, data collection and finances for these activities are lacking. They stressed the need for data provision to be handled at the higher level of administration to avoid scaling and data comparability issues. Hence, data availability for indicators on a municipal level is a strong limiting factor, especially when it comes to indicators concerning infrastructure and social aspects [45]. Parts of the infrastructure related to energy, transport and communication are owned or organized by entities on a higher administrative level, such as the national government or by private entities. This tends to lead to limited data availability when it comes to data with a sufficient resolution on a municipal level. Here it would be favourable if entities in charge of the respective infrastructure made access to data easier and provided data with a resolution that is suitable for analyses on a municipal level. Moreover, the discussion centred around technical measures and physical impacts and less about social drivers and demographic changes. The latter are seen as core aspects of the community’s ability to resist unforeseen threats. Nevertheless, the intense discussion around the proxies suggested by literature displayed vividly the intricacy of social dynamics. New data and methods from the higher administration or crowd-sourced databases are needed to better understand and monitor the indicators [43].
Fifth, it is important to mention that a conflict of goals among indicators can arise and can lead to a competition for the scarce resources. These reciprocal processes cannot be completely avoided. For example: impervious surfaces are seen negative regarding heavy rain, fresh air and heat island effects, but they are necessary for a redundant infrastructure and other urban functions. Another example is provided by Meerow and Newell [35] who analysed the negative correlation of park access and stormwater management goals, concluding that resilience measures create winners and losers. This also requires transparency of the data and the method of the indicator definition to understand the root causes of the conflicting goals and find adequate solutions. Here the Rockefeller [22] approach seems like a black box because it is difficult to deduce what adaptation measures are used as a data basis, and indicator calculations are unclear. During the workshop, several practitioners mentioned consequently the necessity of transparency and the need for precise communication and non-scientific language.
Sixth, following the previous point, many indicator approaches are used to build a composite index for resilience [19,22,45,46,47], vulnerability [18,48,49,50,51,52] or risk [53,54,55]. Specifically, at the scale of urban resilience, indexing across the multitude of action fields was discussed critically. The different scales, topics and units appeared to not be logically linkable. Moreover, a combined index value was seen to not tell much about the level of resilience. It was seen as more important to see the contribution of each action field to the overall resilience. Also, considering the next step of adaptation measures, it is more relevant to have a resilience profile displaying specific topics to be addressed in the municipal context.
Working at the science-policy interface was challenging for all sides. The mixed method approach proved invaluable in finding a common language, tolerance and understanding. This created an environment that allowed for constructive criticism, which is indispensable for finding a compromise.

5. Conclusions

In this study, we developed an indicator set to measure and monitor urban climate resilience for municipalities, thereby assessing the requirements of indicators and implementing a method for adapting global approaches to the local context.
The mixed method approach proved to be essential for the process of indicator development. It provided an adequate frame and time to develop a mutual understanding across disciplines, researchers and practitioners, which is needed in order to select indicators or accept indicators from different fields of expertise. Transparency in the process and the inclusion of feedback builds acceptance and trust. The concept of resilience provided the required assembly hall and saw climate change as the imperative. Even the often-criticized ambiguity of the resilience concept was helpful as it created room for discussion. The number of 24 indicators based on secondary data balanced as well as possible the diverging interests. Amongst the indicators, conflict of goals is unavoidable. Making the conflicts visible is a helpful basis for making informed decisions, which is a strength of this indicator set. In general, the softer and more qualitative aspects of resilience are challenging. They were seen as crucial but very hard to assess by quantitative proxies based on secondary data. Still, representative surveys to cover them in more detail on a regular basis were rejected by municipalities as too expensive and labour-intensive.
Developing an indicator set tends to be easier than assessing the significance or validity of an indicator over time and it requires an extended period of observations to be able to make statements about the significance of a certain indicator. Nevertheless, in order to advance this field of research, it is necessary to pursue this path and start inquiries into the significance or validity of the numerous indicators that are permeating the ongoing discussions. In further research, the indicators need to be tested in reality, and there needs to be more research that addresses the validation of the indicators.

Author Contributions

Conceptualization: D.F., D.W., C.K., T.K., R.G., C.D., and J.B.; data curation: D.F., D.W.; funding acquisition: C.K., T.K., R.G., C.D., and J.B.; methodology: D.F., D.W.; writing—original draft: D.F., D.W.; writing—review & editing: D.F., D.W., C.K., T.K., R.G., C.D., J.B.

Funding

This research received no external funding.

Acknowledgments

The research leading to these results has received funding from the German Federal Ministry of Science and Education (BMBF) for the research Monitoring and Evaluation of climate resilience and urban adaptation measures (MONARES). The paper reflects only the authors’ views, and the German Ministry is not liable for any use that may be made of the information contained herein.

Conflicts of Interest

The authors declare no conflict of interest.

References

  1. United Nations, Department of Economic and Social Affairs. Population Division World Urbanization Prospects: The 2018 Revision; United Nations, Department of Economic and Social Affairs: New York, NY, USA, 2018. [Google Scholar]
  2. Meerow, S.; Newell, J.P.; Stults, M. Defining urban resilience: A review. Landsc. Urban Plan. 2016, 147, 38–49. [Google Scholar] [CrossRef]
  3. Biagini, B.; Bierbaum, R.; Stults, M.; Dobardzic, S.; McNeeley, S.M. A typology of adaptation actions: A global look at climate adaptation actions financed through the Global Environment Facility. Glob. Environ. Chang. 2014, 25, 97–108. [Google Scholar] [CrossRef] [Green Version]
  4. UN Climate Change. What Do Adaptation to Climate Change and Climate Resilience Mean? Available online: https://unfccc.int/adaptation/items/4159.php (accessed on 15 May 2019).
  5. Folke, C.; Carpenter, S.R.; Walker, B.; Scheffer, M.; Chapin, T.; Rockström, J. Resilience Thinking: Integrating Resilience, Adaptability and Transformability. Ecol. Soc. 2010, 15, 1–9. [Google Scholar] [CrossRef]
  6. Holling, C.S. Resilience and Stability of Ecological Systems. Annu. Rev. Ecol. Syst. 1973, 4, 1–23. [Google Scholar] [CrossRef] [Green Version]
  7. Folke, C. Resilience (Republished). Ecol. Soc. 2016, 21, 1–30. [Google Scholar] [CrossRef]
  8. Figueiredo, L.; Honiden, T.; Schumann, A. Indicators for Resilient Cities; OECD Regional Development Working Papers; OECD Publishing: Paris, France, 2018; Volume 2. [Google Scholar] [CrossRef]
  9. United Nations Report of the Open-Ended Intergovernmental Expert Working Group on Indicators and Terminology Relating to Disaster Risk Reduction 2017 A/71/644; United Nations General Assembly: New York, NY, USA, 2017.
  10. Holling, C.S.; Walker, B. Resilience Defined. Entry prepared for the Internet Encyclopaedia of Ecological Economics. Int. Soc. Ecol. Econ. 2003. [Google Scholar]
  11. Frankenberger, T.; Constas, M.; Nelson, S.; Starr, L. Current Approaches to Resilience Programming among Nongovernmental Organisations; 2020 Conference Paper 7; International Food Policy Research Institute: Washington, DC, USA, 2014. [Google Scholar]
  12. Cutter, S.L.; Ash, K.D.; Emrich, C.T. The geographies of community disaster resilience. Glob. Environ. Chang. 2017, 29, 65–77. [Google Scholar] [CrossRef]
  13. Meerow, S.; Stults, M. Comparing Conceptualizations of Urban Climate Resilience in Theory and Practice. Sustainability 2016, 8, 701. [Google Scholar] [CrossRef]
  14. Schuhmann, A. Using Outcome Indicators to Improve Policies: Methods, Design Strategies and Implementation; OECD Regional Development Working Papers; OECD: Paris, France, 2016; Volume 2. [Google Scholar] [CrossRef]
  15. MONARES-Framework. Available online: https://monares.de/publikationen (accessed on 15 May 2019).
  16. Birkmann, J.; Changseng, D.; Wolferts, J.; Setiadi, N.; Karanci, N.; Ikizer, G.; Kuhlicke, C.; Kunath, A.; Dressler, G.; Deeming, H.; Fordham, M. Early Discussion and Gap Analysis on Resilience. Building Resilience amongst Communities in Europe (Embrace). Available online: https://www.researchgate.net/publication/314188507_Work_Package_1_Early_Discussion_and_Gap_Analysis_on_Resilience_Deliverable_11_Title_Building_Resilience_Amongst_Communities_in_Europe/download (accessed on 22 May 2019).
  17. Béné, C.; Frankenberger, T.; Nelson, S. Design, Monitoring and Evaluation of Resilience Interventions: Conceptual and Empirical Considerations; IDS Working Paper; Institute of Development Studies: Brighton, UK, 2015; Volume 459, pp. 1–26. [Google Scholar]
  18. Welle, T.; Witting, M.; Birkmann, J.; Brossmann, M. Assessing and Monitoring Climate Resilience. From Theoretical Considerations to Practically Applicable Tools—A Discussion Paper; Deutsche Gesellschaft für Internationale Zusammenarbeit (GIZ) GmbH: Eschborn, Germany, 2014. [Google Scholar]
  19. Cutter, S.; Burton, C.; Emrich, C. Disaster Resilience Indicators for Benchmarking Baseline Conditions. J. Homel. Secur. Emerg. Manag. 2010, 7, 1–24. [Google Scholar] [CrossRef]
  20. ICLEI. Available online: http://smr-project.eu/tools/maturity-model-guide/ (accessed on 16 May 2019).
  21. Riedel, H.; Haubner, O.; Zumbansen, N.; Witte, K. Monitor Nachhaltige Kommune—Bericht 2016—Teil 1 Ergebnisse der Befragung und der Indikatorenentwicklung; Bertelsmann Stiftung: Gütersloh, Germany, 2016. [Google Scholar] [CrossRef]
  22. ARUP and Rockefeller Foundation. City Resilience Framework; Ove ARUP & Partners International: London, UK, 2014; Available online: https://assets.rockefellerfoundation.org/app/uploads/20150530121930/City-Resilience-Framework1.pdf (accessed on 25 July 2015).
  23. Renschler, C.; Fraizer, A.; Arendt, A.; Cimellaro, G.; Reinhorn, A.; Bruneau, M. A Framework for Defining and Measuring Resilience at the Community Scale: The PEOPLES Resilience Framework; NIST: Washington, DC, USA, 2010.
  24. Poland, C. The Resilienct City: Defining What San Francisco Needs from Its Seismic Mitigation Policies; San Francisco Planning and Urban Research Association: San Francisco, CA, USA, 2009. [Google Scholar]
  25. Oregon Seismic Safety Policy Advisory Commission (OSSPAC). The Oregon Resilience Plan: Reducing Risk and Improving Recovery for the Next Cascadia Earthquake and Tsunami; The Commission: Salem, OR, USA, 2013.
  26. United Nations Office for Disaster Risk Reduction (UNISDR). Disaster Resilience Scorecard for Cities 2017. Available online: https://www.unisdr.org/campaign/resilientcities/assets/documents/ guidelines/UNISDR_Disaster%20resilience%20scorecard%20for%20cities_Detailed.pdf (accessed on 29 April 2019).
  27. Community and Regional Resilience Institute. Steering Committee. Community Resilience System Initiative (CRSI) Steering Committee Final Report: A roadmap to Increased Community Resilience; Community and Regional Resilience Institute: Washington, DC, USA, 2011. [Google Scholar]
  28. Pfefferbaum, R.; Pfefferbaum, B.; Van Horn, R. Communities Advancing Resilience Toolkit (CART): The CART Integrated System; Terrorism and Disaster Center at the University of Oklahoma Health Sciences Center: Oklahoma City, OK, USA, 2011. [Google Scholar]
  29. Office for Coastal Management NOAA. Coastal Community Resilience Indicators and Rating Systems 2015. Available online: https://coast.noaa.gov/data/digitalcoast/pdf/resilience-indicators.pdf (accessed on 16 May 2016).
  30. Mitigation Framework Leadership Group (MitFLG). Mitigation Framework Leadership Group Draft Concept Paper; Draft Interagency Concept for Community Resilience Indicators: Washington, DC, USA, 2016.
  31. Yoon, D.K.; Kang, J.E.; Brody, S.D. A Measurement of Community Disaster Resilience in Korea. J. Environ. Plan. Manag. 2016, 59, 436–460. [Google Scholar] [CrossRef]
  32. Orencio, P.M.; Fujii, M. A localized disaster-resilience index to assess coastal communities based on an analytic hierarchy process (AHP). Int. J. Disaster Risk Reduct. 2013, 3, 62–75. [Google Scholar] [CrossRef]
  33. United Nation Development Programme (UNDP). Community Based Resilience Analysis (CoBRA) Conceptual Framework and Methodology. 2013. Available online: https://www.undp.org/content/dam/undp/library/Environment%20and%20Energy/sustainable%20land%20management/CoBRA/CoBRRA_Conceptual_Framework.pdf (accessed on 16 May 2019).
  34. Tyler, S.; Moench, M. A framework for urban climate resilience. Clim. Dev. 2012, 4, 311–326. [Google Scholar] [CrossRef]
  35. Meerow, S.; Newell, J.P. Urban resilience for whom, what, when, where, and why? Urban Geogr. 2016, 11, 1–21. [Google Scholar] [CrossRef]
  36. Burton, C. Validation of metrics for community resilience to natural hazards and disasters using the recovery from hurricane katrina as a case study. Ann. Am. Assoc. Geogr. 2014, 105, 67–86. [Google Scholar] [CrossRef]
  37. Becker, D.; Schneiderbauer, S.; Forrester, J.; Pedoth, L. Report Work Package 3 Guidelines for Development of Indicators, Indicator Systems and Provider Challenges; Building Resilience Amongst Communities in Europe (Embrace) Rep. Work Package 3; EURAC Research: Bozen, Italy, 2015. [Google Scholar]
  38. Bach, C.; Birkmann, J.; Kropp, J.; Olonscheck, M.; Setiadi, N.; Vollmer, M.; Walther, C. Assessing Vulnerability to Heat Waves and Heavy Rainfall at a Community Level. Pract. Exp. Civ. Prot. 2014, 11, 1–164. [Google Scholar]
  39. Adger, W.N. Social and Ecological Resilience: Are They Related? Prog. Hum. Geogr. 2000, 24, 347–363. [Google Scholar] [CrossRef]
  40. Norris, F.H.; Stevens, S.P.; Pfefferbaum, B.; Wyche, K.F.; Pfefferbaum, R.L. Community Resilience as a Metaphor, Theory, Set of Capacities, and Strategy for Disaster Readiness. Am. J. Community Psychol. 2008, 41, 127–150. [Google Scholar] [CrossRef]
  41. Auf der Heide, E.; Scanlon, J. Health and Medical Preparedness and Response. In Emergency Management: Principles and Practice for Local Government; Waugh, W.L., Tierney, K., Eds.; International City Managers Association: Washington, DC, USA, 2008; pp. 183–206. [Google Scholar]
  42. Morrow, B. Community Resilience: A Social Justice Perspective; CARRI Research Report 4; Community and Regional Resilience Institute: Oak Ridge, TN, USA, 2008. [Google Scholar]
  43. Cutter, S.L. The landscape of disaster resilience indicators in the USA. Nat. Hazards 2016, 80, 741–758. [Google Scholar] [CrossRef]
  44. Sharifi, A.; Chelleri, L.; Fox-Lent, C.; Grafakos, S.; Pathak, M.; Olazabal, M.; Moloney, S.; Yumagulova, L.; Yamagata, Y. Conceptualizing dimensions and characteristics of urban resilience: Insights from a co-design process. Sustainability 2017, 9, 1032. [Google Scholar] [CrossRef]
  45. Suárez, M.; Gómez-Baggethun, E.; Benayas, J.; Tilbury, D. Towards an urban resilience Index: A case study in 50 Spanish cities. Sustainability 2016, 8, 774. [Google Scholar] [CrossRef]
  46. Chen, K.F.; Leandro, J. A Conceptual Time-Varying Flood Resilience Index for Urban Areas: Munich City. Water 2019, 11, 830. [Google Scholar] [CrossRef]
  47. Keating, A.; Campbell, K.; Mechler, R.; Michel-Kerjan, E.; Mochizuki, J.; Kunreuther, H.; Bayer, J.; Hanger, S.; McCallum, I.; See, L.; et al. Operationalizing Resilience against Natural Disaster Risk: Opportunities, Barriers, and a Way Forward; Zurich Flood Resilience Alliance: Zurich, Switzerland, 2014; Available online: http://opim.wharton.upenn.edu/risk/library/ZAlliance-Operationalizing-Reslience.pdf (accessed on 16 May 2019).
  48. Depietri, Y.; Welle, T.; Renaud, F.G. Social vulnerability assessment of the Cologne urban area (Germany) to heat waves: Links to ecosystem services. Int. J. Disaster Risk Reduct. 2013, 6, 98–117. [Google Scholar] [CrossRef]
  49. Sorg, L.; Medina, N.; Feldmeyer, D.; Sanchez, A.; Vojinovic, Z.; Birkmann, J.; Marchese, A. Capturing the multifaceted phenomena of socioeconomic vulnerability. Nat. Hazards 2018, 1–26. [Google Scholar] [CrossRef]
  50. Karagiorgos, K.; Thaler, T.; Heiser, M.; Hübl, J.; Fuchs, S. Integrated flash flood vulnerability assessment: Insights from East Attica, Greece. J. Hydrol. 2016, 541, 553–562. [Google Scholar] [CrossRef]
  51. Balica, S.F.; Douben, N.; Wright, N.G. Flood vulnerability indices at varying spatial scales. Water Sci. Technol. 2009, 60, 2571–2580. [Google Scholar] [CrossRef]
  52. Jamshed, A.; Rana, I.A.; Mirza, U.M.; Birkmann, J. Assessing relationship between vulnerability and capacity: An empirical study on rural flooding in Pakistan. Int. J. Disaster Risk Reduct. 2019, 36. [Google Scholar] [CrossRef]
  53. Welle, T.; Birkmann, J. The World Risk Index: An approach to assess risk and vulnerability on a global scale. J. Extrem. Events 2015, 2, 1550003. [Google Scholar] [CrossRef]
  54. Birkmann, J.; Welle, T. The World Risk Index 2016: Reveals the necessity for regional cooperation in vulnerability reduction. J. Extrem. Events 2016, 3. [Google Scholar] [CrossRef]
  55. Marin-Ferrer, M.; Vernaccini, L.; Poljansek, K. Index for Risk Management INFORM Concept and Methodology Report; JRC Science for Policy Report; Publication Office of the European Union: Luxembourg, 2017. [Google Scholar] [CrossRef]
Figure 1. MONARES—research process.
Sustainability 11 02931 g001
Figure 2. Median importance of indicators grouped into five dimensions.
Sustainability 11 02931 g002
Figure 3. Box-plots of all indicators included in the survey (see Table 2 for indicator codes).
Sustainability 11 02931 g003
Table 1. Dimensions and action field of the resilience framework.
DimensionAction Field
EnvironmentSoil and green spaces
Water bodies
Biodiversity
Air
InfrastructureSettlement structure
Energy
Telecommunication
Traffic
Drinking and wastewater
EconomyInnovation
Business
Economic structure
SocietyResearch
Knowledge and risk competence
Healthcare
Socio-demographic structure
Civil society
Civil protection
GovernanceParticipation
Municipal budget
Strategy, plans and environment
Administration
Table 2. Delineated indicators and action fields.
DimensionAction FieldIndicatorCodeLiterature
EnvironmentSoil and green spacesDegree of soil sealingA_a_1[31]
Land consumptionA_a_2[21]
Recreational areaA_a_3[21]
Water bodiesShare of water bodiesA_b_1[36]
State of water bodiesA_b_2[23]
BiodiversityShare of nature conservation and protection areasA_c_1[23]
Wetlands and retention areasA_c_2[36]
AirCold air parcelsA_d_1[23]
InfrastructureSettlement structureDensity of buildingsB_a_1[37]
Accessibility of green spacesB_a_2[38]
EnergyShare renewable energyB_b_1[18]
Diversity renewable energyB_b_2[18]
TelecommunicationBroadband accessB_c_1[37]
TrafficConcept for sustainable trafficB_d_1[21]
Drinking and wastewaterNumber of springsB_e_1[8]
EconomyInnovationInnovation indexC_a_1[37]
BusinessRatio of insolvencies to start-upsC_b_1[22]
Economic structureShare of employees in largest sectorC_c_1[39]
Employees in research intensive companiesC_c_2[40]
SocietyResearchNumber of research projectsD_a_1[18]
Knowledge and risk competenceCitizen information about heat, heavy rain and floodingD_b_1[37]
Experience with extreme events in last five yearsD_b_2[37]
Health careAccessibility of hospitalsD_c_1[41]
Doctors per 10,000 citizensD_c_2[40]
Socio-demographic structureShare of citizens ABV6/U65D_d_1[42]
Share of employeesD_d_2[30]
Civil societyVoter turnoutD_e_1[42]
Number of associationsD_e_2[42]
Civil protectionFire brigadeD_f_1[37]
Citizens in honorary positionsD_f_2[31]
GovernanceParticipationNumber of participation processesE_a_1[37]
Contact point for participationE_a_2[37]
Municipal budgetDepth per citizenE_b_1[21]
Tax incomeE_b_2[21]
Strategy, plans and environmentRisk and vulnerability analysisE_c_1[26]
Strategies against heavy rain and heat in plansE_c_2[26]
Landscape plan legally bindingE_c_3[37]
Climate change adaptation part of urban development planE_c_4[30]
AdministrationInter-office working group regarding risk, climate change and resilienceE_d_1[37]
Climate managerE_d_2[37]
Table 3. The five indicators rated as most important in the survey.
DimensionAction fieldIndicatorMin.1st QuartileMedianMean3rd QuartileMaxN/A
EnvironmentAirCold air parcels2454.6553
GovernanceAdministrationInter-offices working group regarding risk, climate change and resilience2454.5552
SocietyKnowledge and competenceExperience with extreme events in last five years3454.5553
GovernanceStrategy, planned and environmentStrategies against heavy rain and heat in plans2454.5553
SocietyKnowledge and competenceCitizen information about heat, heavy rain and flooding2454.4552
Table 4. Five lowest rated indicators.
DimensionAction fieldIndicatorMin.1st QuartileMedianMean3rd QuartileMaxN/A
SocietyCivil societyVoter turnout1232.4341
SocietyCivil societyNumber of associations1232.6342
InfrastructureTelecommunicationBroadband access1232.8453
EconomyBusinessRation insolvencies to start-ups1232.83.554
EconomyEconomic structureShare Employees in largest sector1232.8346
Table 5. Indicator set after the survey, workshop and final set.
DimensionAction FieldSurvey ResultWorkshopMIS
EnvironmentSoil and green spacesDegree of unsealed groundDegree of unsealed groundDegree of unsealed ground
Water bodiesState of water bodiesState of water bodiesState of water bodies
BiodiversityWetlands and retention areasWetlands and retention areasNature conservation and protection areas
AirCold air parcelsCold air parcels and flowsVentilation status
InfrastructureSettlement structure Accessibility of green spacesBuilding densityBuilding density
EnergyShare renewable energyDiversity of renewable energyDiversity of renewable energy
Per capita energy consumptionPer capita energy consumption
Water supply and wastewater treatmentNumber of springsNumber of springsNumber of springs
(Including wastewater indicator)Adapted sewer system
EconomyInnovationInnovation indexEmployees in research intensive companiesEmployees in research intensive companies
BusinessRation insolvencies to start-upsCommercial tax per capitaCommercial tax per capita
Economic structureEmployees in research intensive companiesDiversity of businessDiversity of business
SocietyResearchNumber of research projectsNumber of research projectsNumber of research projects
Knowledge and risk competenceHistory with extreme eventsHistory with extreme eventsHistory with extreme events
Health careAccessibility of hospitalsAccessibility of hospitalsNumber of doctors
Sociodemographic structureShare of citizens ABV6/U65Share of citizens ABV6/U65Share of citizens ABV6/U65
Civil societyVoter turnoutAssociations per 10000 capitaAssociations per 10000 capita
Civil protectionFire brigadeFire brigadeFire brigade volunteers
GovernanceParticipationContact point for participationNumber of participation processesNumber of participation processes
Municipal budgetDepth per citizenDepth per citizenDepth per citizen
Strategy, plans and environmentRisk and vulnerability analsysisRisk and vulnerability analsysisRisk and vulnerability analsysis
Strategies against heavy rain and heat in plansStrategies against heavy rain and heat in plansStrategies against heavy rain and heat in plans
AdministrationInter-offices working group regarding risk, climate change and resilienceInter-offices working group regarding risk, climate change and resilienceInter-offices working group regarding risk, climate change and resilience
updatedswitched action fieldno change

