1. Introduction
Today, oil-derived fuels account for around 94% of final energy demand in the transport sector and almost three-quarters is used by road transport [
1]. Predictions foresee a further energy increase for road transport sector of 50% until 2030 and 80% until 2050 [
1]. In order to promote the security of energy supply and a reduction of greenhouse gases (GHG) emissions, as well to help urban areas meet European Union (EU) air quality obligations, the European Commission has adopted the “Clean Power for Transport package”—a Communication laying out a comprehensive alternative fuels strategy for the long-term substitution of oil as energy source for transport [
2]. Under this strategy, the adoption of alternative sources of energy, which include electricity, hydrogen, biofuels, natural gas, and liquefied petroleum gas (LPG), will play an important role in achieving the EU objectives.
Additionally, the EU published the first Directive (2003/30/EC) [
3] on the promotion of the use of biofuels or other renewable fuels for transport in 2003, which was replaced by the Renewable Energy Directive (RED Directive, 2009/28/EC) [
4] in 2009 and then updated by the Directive (EU) 2015/1513 [
5]. Recently, the EU commission published a revised Renewable Energy Directive (RED II—Directive (EU) 2018/2001) to ensure that the target of at least 27% renewables in the final energy use in the EU by 2030 is met. Until now, the EU has established a binding 10% minimum target for renewable energy in transport fuels that are used in land transport to be achieved by each Member State in 2020. While electric vehicles can contribute to this target, it is also established that the main share is expected to be covered by biofuels [
4]. However, the maximum contribution of biofuels that are produced from food and feed crops will be frozen at 2020 consumption levels, plus an additional 1% with a maximum cap of 7% of road transport fuel in each Member State. Motivated by European strategies, Portugal intends to meet the RED Directive goals for road transports using biofuels, where about 6.6% of road transport energy is expected to be biodiesel in 2020, and 2.2% to be bioethanol [
6].
Biofuels, namely bioethanol and biodiesel, have thus been considered as a sustainable energy source and the major alternative to petroleum-based road transport fuels in the short- and medium-term, thus addressing concerns over the security of oil supply and GHG emissions, while revitalizing agricultural development [
7,
8,
9,
10]. Although the use of biofuels in transport is being encouraged by several policy initiatives, their effects on urban traffic-related air pollutants of concern, such as nitrogen oxides (NO
x) and particulate matter (PM), are rarely addressed and uncertainties remain, thus requiring additional research on the application of biofuels as a sustainable alternative fuel, as evidenced by the literature review that is presented in
Section 2.
This study intends to be a step forward in this regard, aiming to evaluate at urban scale the potential effects of biofuels on air pollutant emissions and energy use. For this purpose, an integrated and flexible approach was developed and proposed, as described in
Section 3. Emissions and energy use from the use of bio-fuelled vehicles are estimated through a modelling study that involves the city of Coimbra (Portugal). Two biofuels demand scenarios (with different blends of bioethanol and biodiesel) relative to a reference situation (
Section 4) are considered. These scenarios were designed to allow for a full assessment of the range of particulate matter with an aerodynamic diameter smaller than 2.5 µm (PM
2.5) and NO
x emission effects that may be expected from biofuels in the coming years, given the current fuel standards, vehicle fleet technology that is projected for 2020, and the uncertainties in the future biofuel developments, as presented and discussed in
Section 5. A brief summary of the main results is carried out and
Section 6 presents the final remarks.
2. Literature Review
The effects of diesel/biodiesel and gasoline/bioethanol blends use on road traffic emissions have been analysed in several studies. However, such efforts are mainly conducted to assess the potential of biofuels to mitigate climate change by assessing the impacts on GHG emissions [
11,
12]. While GHG have global effects, the location and magnitude of other air pollutant emissions have a potentially important local effect on air quality and human health [
13,
14,
15,
16,
17,
18]. The effect that biofuels or fuel blends use on the so-called regulated air pollutants emissions, which represent a key role on urban air pollution, is not straightforward [
19,
20,
21]. This issue has been explored in several experimental studies, mostly under laboratory conditions, but some on-road measurements are also available [
18,
22,
23,
24,
25]. For the two most environmentally important regulated pollutants—PM and NO
x, there seems to be a trade-off that is shown by the test data, where an increase in NO
x will occur with a larger decrease in PM emissions [
20,
26]. The literature review suggests that the experimental results on the effects of biofuels on vehicle emissions are inconclusive, showing a high degree of variability both for PM and NO
x [
21]. Therefore, additional research is still needed to establish the potential impact at the urban scale, and this could be accomplished by modelling techniques.
To the best of our knowledge, very few studies have used modelling approaches to evaluate the effects of bioethanol and biodiesel on NO
x and PM road transport emissions, particularly at the urban scale. The insights that are gained from the review of this literature and its major gaps are described in this section. A literature review on the modelling approaches at the urban scale to estimate the effect on NO
x and PM emissions from different blends of bioethanol and biodiesel with gasoline and diesel, respectively, was conducted based on journal articles that were published in English from 2000 to 2018 and index by ISI and/or SCOPUS (
Table 1). The studies solely aimed to quantify the impacts of biofuels production on pollutant emissions and life-cycle analysis was not considered in the literature review.
In order to examine the impact on cancer, mortality, and hospitalization related with bioethanol fuelled vehicles use in Los Angeles, Jacobson [
27] estimated the PM and NO
x emissions from future vehicle fleets (2020 year) fuelled by gasoline and by E85 (85% bioethanol/15% gasoline, v/v) bioethanol blend. Future emission inventories for bio-fuelled vehicles were obtained based on a very simplified approach by applying percent changes from measurements to baseline gasoline emissions. Additionally, 2020 baseline gasoline emissions were calculated as 40% of the 2002 U.S. National Emission Inventory [
27]. As concluded by the authors, the replacement of all on-road gasoline vehicles with E85 vehicles would lead to a significant decrease of 30% in NO
x emissions, but no consistent change was estimated for PM emissions. Another study focused on the E85 bioethanol blend [
28,
29] estimates a decrease of about 50% and 90% in NO
x and exhaust PM emissions, respectively, within the Oslo urban area. Two scenarios were compared: a baseline scenario corresponding to the current situation (i.e., gasoline, diesel cars, and one bus line running on E85); and, a scenario that is characterized by exclusive use of bioethanol as transport fuel, so named E85-fleet. The exhaust emissions from E85 fuelled vehicles were estimated based on aggregated traffic information that was provided by the Norwegian road administration’s database, including the annual average daily traffic, the average speed limit of circulation, and the heavy duty fraction of the traffic. However, the authors do not address information regarding NO
x and PM emission factors considered.
Focusing on the effects of lower blends of bioethanol on road traffic emissions, García et al. [
30] carried out an emission modelling study for the Mexico City comparing the future fleets (2030 year) fuelled by current available gasoline and two alternative biofuels scenarios (E6 (6% bioethanol/94% gasoline,
v/
v) and E10 (10% bioethanol/90% gasoline,
v/
v)). The authors justify the consideration of these possible future scenarios, and the Mexican Biofuel Instruction Program motivates them. All of the scenarios were simulated using the Long-Range Energy Alternatives Planning model (LEAP) to obtain the evolution of the vehicle fleet and future annual particulate matter with an aerodynamic diameter that is smaller than 10 µm (PM
10) and NO
x emissions [
30]. Traffic information on the total number of vehicles and the annual mileage for each vehicle type and fuel, as required by the model, were obtained from the national database based on the vehicles registered. The required emissions factors were independently calculated using the adapted US-EPA aggregated emission factor model MOBILE6-Mexico [
31]. Therefore, the model uses a single emission factor to represent a particular broad category of vehicle and a general driving condition (urban roads, rural roads, and highways). The authors predicted that the effects of E6 and E10 ethanol fuel are to decrease NO
x emissions but they tend to increase PM emissions.
Regarding biodiesel use, a study that was carried out by Pino-Cortés et al. [
32] assessed the use of five biodiesel blends in diesel motors on PM and NO
x exhaust emissions over two Chilean urban areas. The emission scenarios that were evaluated consider the introduction of 1%, 4%, 8%, 12%, and 20% of biodiesel for all diesel vehicles. For this purpose, the Motor Vehicle Emission Simulator (MOVES) was used to estimate the annual PM and NO
x road traffic emissions [
33]. The spatial and temporal resolution of the activity data introduced in the model was annual values for the studied area, including fleet age distribution and the fraction of light- and heavy-duty vehicle miles travelled. Thus, as a final outcome, the model generates total emission rates (in gram per mile units) within the all of the study area for vehicle types under various operating conditions. When considering all scenarios, the authors point out to a maximum reduction in PM emissions of about 15%, and an increase of 2% in the NO
x road traffic emissions [
32].
When considering the impacts on human health due to biodiesel use, Hutter et al. [
34] presents an assessment of the potential risks as a result of the use of B10 (10% biodiesel/90% diesel,
v/
v) and B100 (100% biodiesel) for two regions in Austria. By comparing with a scenario with conventional fossil fuels scenario, Hutter et al. [
34]) present a reduction of about 5% and 50% on PM emissions for B10 and B100 scenarios, respectively, and an increase of about 10% (B10) and 25% (B100) on NO
2 emissions. To achieve this, the authors indicate that the emissions of different types of diesel vehicles were determined by the Environmental Agency Austria. However, information on methodology for emission estimation, as well its reference, is missing.
Recently, Ribeiro et al. [
35] estimated PM and NO
x emissions for a Portuguese urban area (Oporto). A biodiesel emission scenario was designed for the road transport sector when considering that a B20 biodiesel fuel would power all of the diesel vehicles. The authors justified the evaluation of B20 as a biodiesel blend based on its higher combustion efficiency and lower emissions reported in literature [
35]. For each emission scenario (baseline and B20), the atmospheric pollutant emissions were individually estimated for each road segment using the Transport Emission Model for Hazardous Air Pollutants—TREM-HAP [
14] while considering total traffic volume from counting points and average speed limit of circulation. Moreover, the emission factor that was obtained from experimental studies was used in aggregated form for two driving modes (urban and extra-urban). The authors concluded that the PM emissions for B20 would be about 10% lower than for the baseline scenario over the analysed urban area. Additionally, an increase of about 3% on NO
x total emissions would be predicted with B20 biodiesel blend use, as concluded by the authors.
The review of this literature makes clear that there is not enough understanding on how the adoption of biofuels will help in reducing traffic-related emissions in urban areas, and its effectiveness is somewhat inconsistent. Overall, the emission modelling is not clearly addressed since the majority of results present insufficient temporal and spatial resolution for urban scale studies, which contribute to the uncertainties in the modelled benefits. Consequently, the design of new modelling approaches for the evaluation of the potential effect of bio-fuelled vehicles on traffic-related emissions in urban areas is an urgent need. The research that is proposed and described in the
Section 3 aims to respond to this urgent need.
3. QTraffic: Emission and Energy Use Modelling System
In the scope of this work, the Traffic Emission and Energy Consumption Model (QTraffic) has been developed to support the quantification of atmospheric emissions induced by road traffic and its fuel/energy use at different spatial and temporal scales.
The QTraffic model is a mesoscopic emission model that is based on the updated European guidelines for emission factors [
36], following an average speed approach. This approach considers that the emission factor for a certain pollutant and a given type of vehicles vary according to the average speed. For each road segment, an average vehicle speed that is representative of the driving conditions is considered. The QTraffic model treats roads as line sources and, consequently, estimates the emissions and energy use at road segment level when considering detailed information regarding transport activity. Therefore, the QTraffic model has the ability to provide results in a range of scales: (a) spatial-from national emissions inventories down to the emissions of an individual road network; and, (b) temporal—short-term (hourly) to long-term (annual) emission inventories.
In order to estimate the atmospheric emissions induced by road traffic, QTraffic requires information on three main input data: (1) the road network of the study area (type, length, and gradient of each road); (2) the vehicle fleet composition (emission reduction technology, engine capacity, engine age, and fuel type); and, (3) transport activity for each road (traffic volume and average vehicle speed). In QTraffic, the spatial information on transport activity data is requested in GIS (Geographic Information Systems) format and is, therefore, potentially compatible with GPS data and with the transportation models that are able to export traffic data to GIS. In this study, a link between QTraffic and the VISUM transportation modelling software [
37] was implemented. The VISUM software package is a comprehensive, flexible system for transport planning, travel demand modelling, and network data management, thus being one of the most used to provide the traffic volume estimation. Through this model, it is possible to estimate the traffic volume and vehicle speed in each road segment, which is the key information that is necessary in the emissions and energy consumption model. The data exchange between QTraffic and VISUM is performed through a VISUM exported table containing information for each road segment (link ID, number of private cars, vehicle speed, etc.) that is required for the emission quantification.
The traffic-related emissions (
Ei) for each road segment for the pollutant
i [g/km] are estimated by the QTraffic model based on the emission factor
EFik [g/km.veh] for pollutant
i and vehicle technology
k, and
Nk is the number of vehicles [veh] of technology
k, as following:
This Equation has to be applied for each vehicle category, since the emission factors and the activity are different. The emission factor is primarily related with average vehicle speed, fuel type, engine capacity, and emission reduction technology.
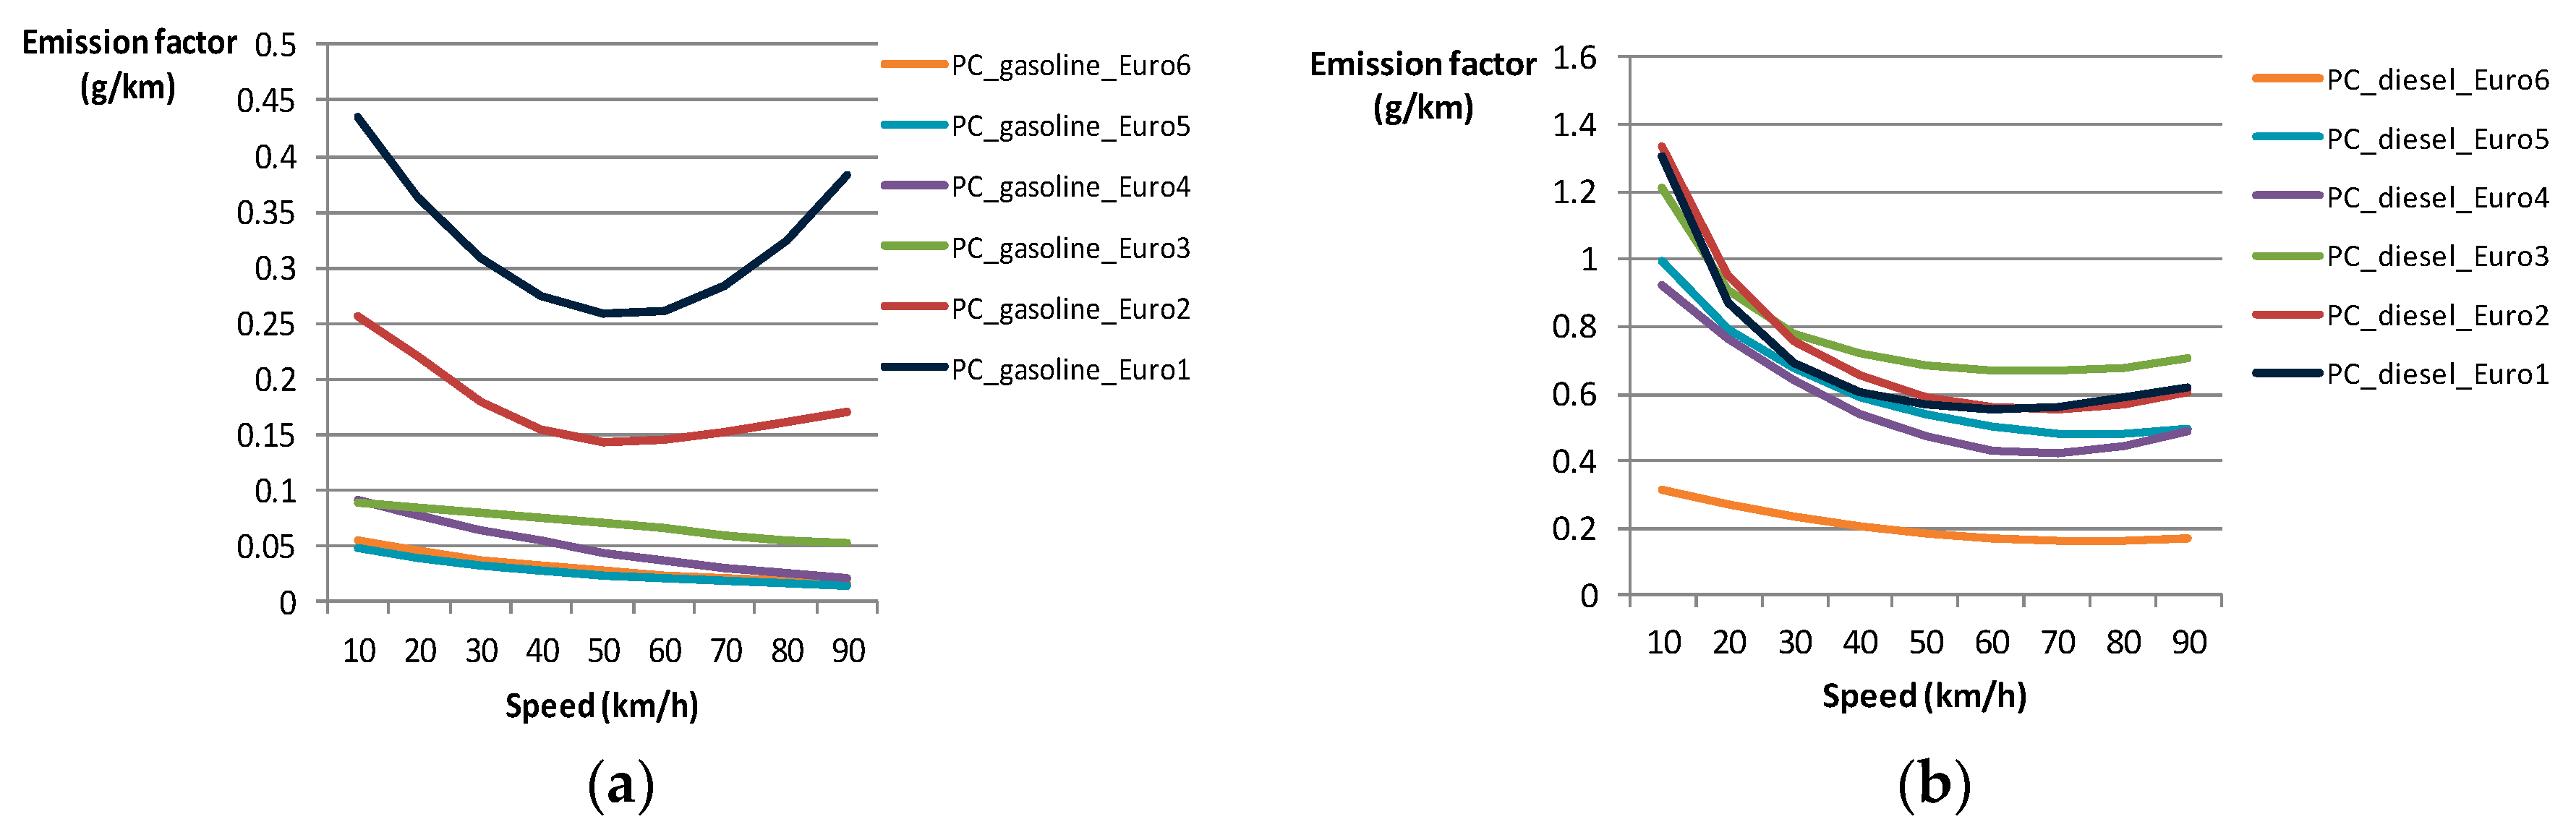
Figure 1 presents an example of hot exhaust NO
x emission factors calculated for gasoline and diesel passenger cars as a function of average speed for different Euro technologies.
The current version of the QTraffic model is prepared to calculate the road traffic hot emissions for several pollutants, including (i) ozone precursors (Nitrogen Oxides (NOx), Non-methane volatile organic compounds (NMVOC), Carbon monoxide (CO),); (ii) greenhouse gases (carbon dioxide (CO2), methane (CH4), nitrous oxide (N2O)), (iii) acidifying substances (sulphur dioxide (SO2), ammonia (NH3)); (iv) particulate matter (PM2.5); and, (v) carcinogenic species (benzene (C6H6)). Additionally, the model calculates (vi) fuel and energy use, usable for different types of applications.
The developed QTraffic model is currently implemented as a plugin for open-source QGIS (a Free and Open Source Geographic Information System) and integrates the D3.js library with the Python programming language. The model integrates a user-friendly graphic interface that has been developed based on and a novel technology for producing dynamic interactive data visualization in order to simplify the processing of the required input data. One of the additional functions of the QTraffic graphical interface is related with the flexibility that is provided for the quantification of traffic emissions from alternative transport fuels. Therefore, QTraffic is able to evaluate how the changes on emission factors ensuing from the implementation of alternative-fuel vehicles affect the related pollutant emissions at the urban scale. For this purpose, QTraffic is designed in a very open and flexible manner, allowing for the user to introduce emissions factor for an alternative fuel (in g/km) in the graphical interface by vehicle age and technology and for several pollutants. A built-in database (NewFuelFormulas.json) is considered by the model providing default values of emissions factor for Compressed Natural Gas (CNG) fuel collected from EMEP/EEA [
36]. These default data could be replaced/updated by the user if deemed to be necessary for improving the modelling result accuracy.
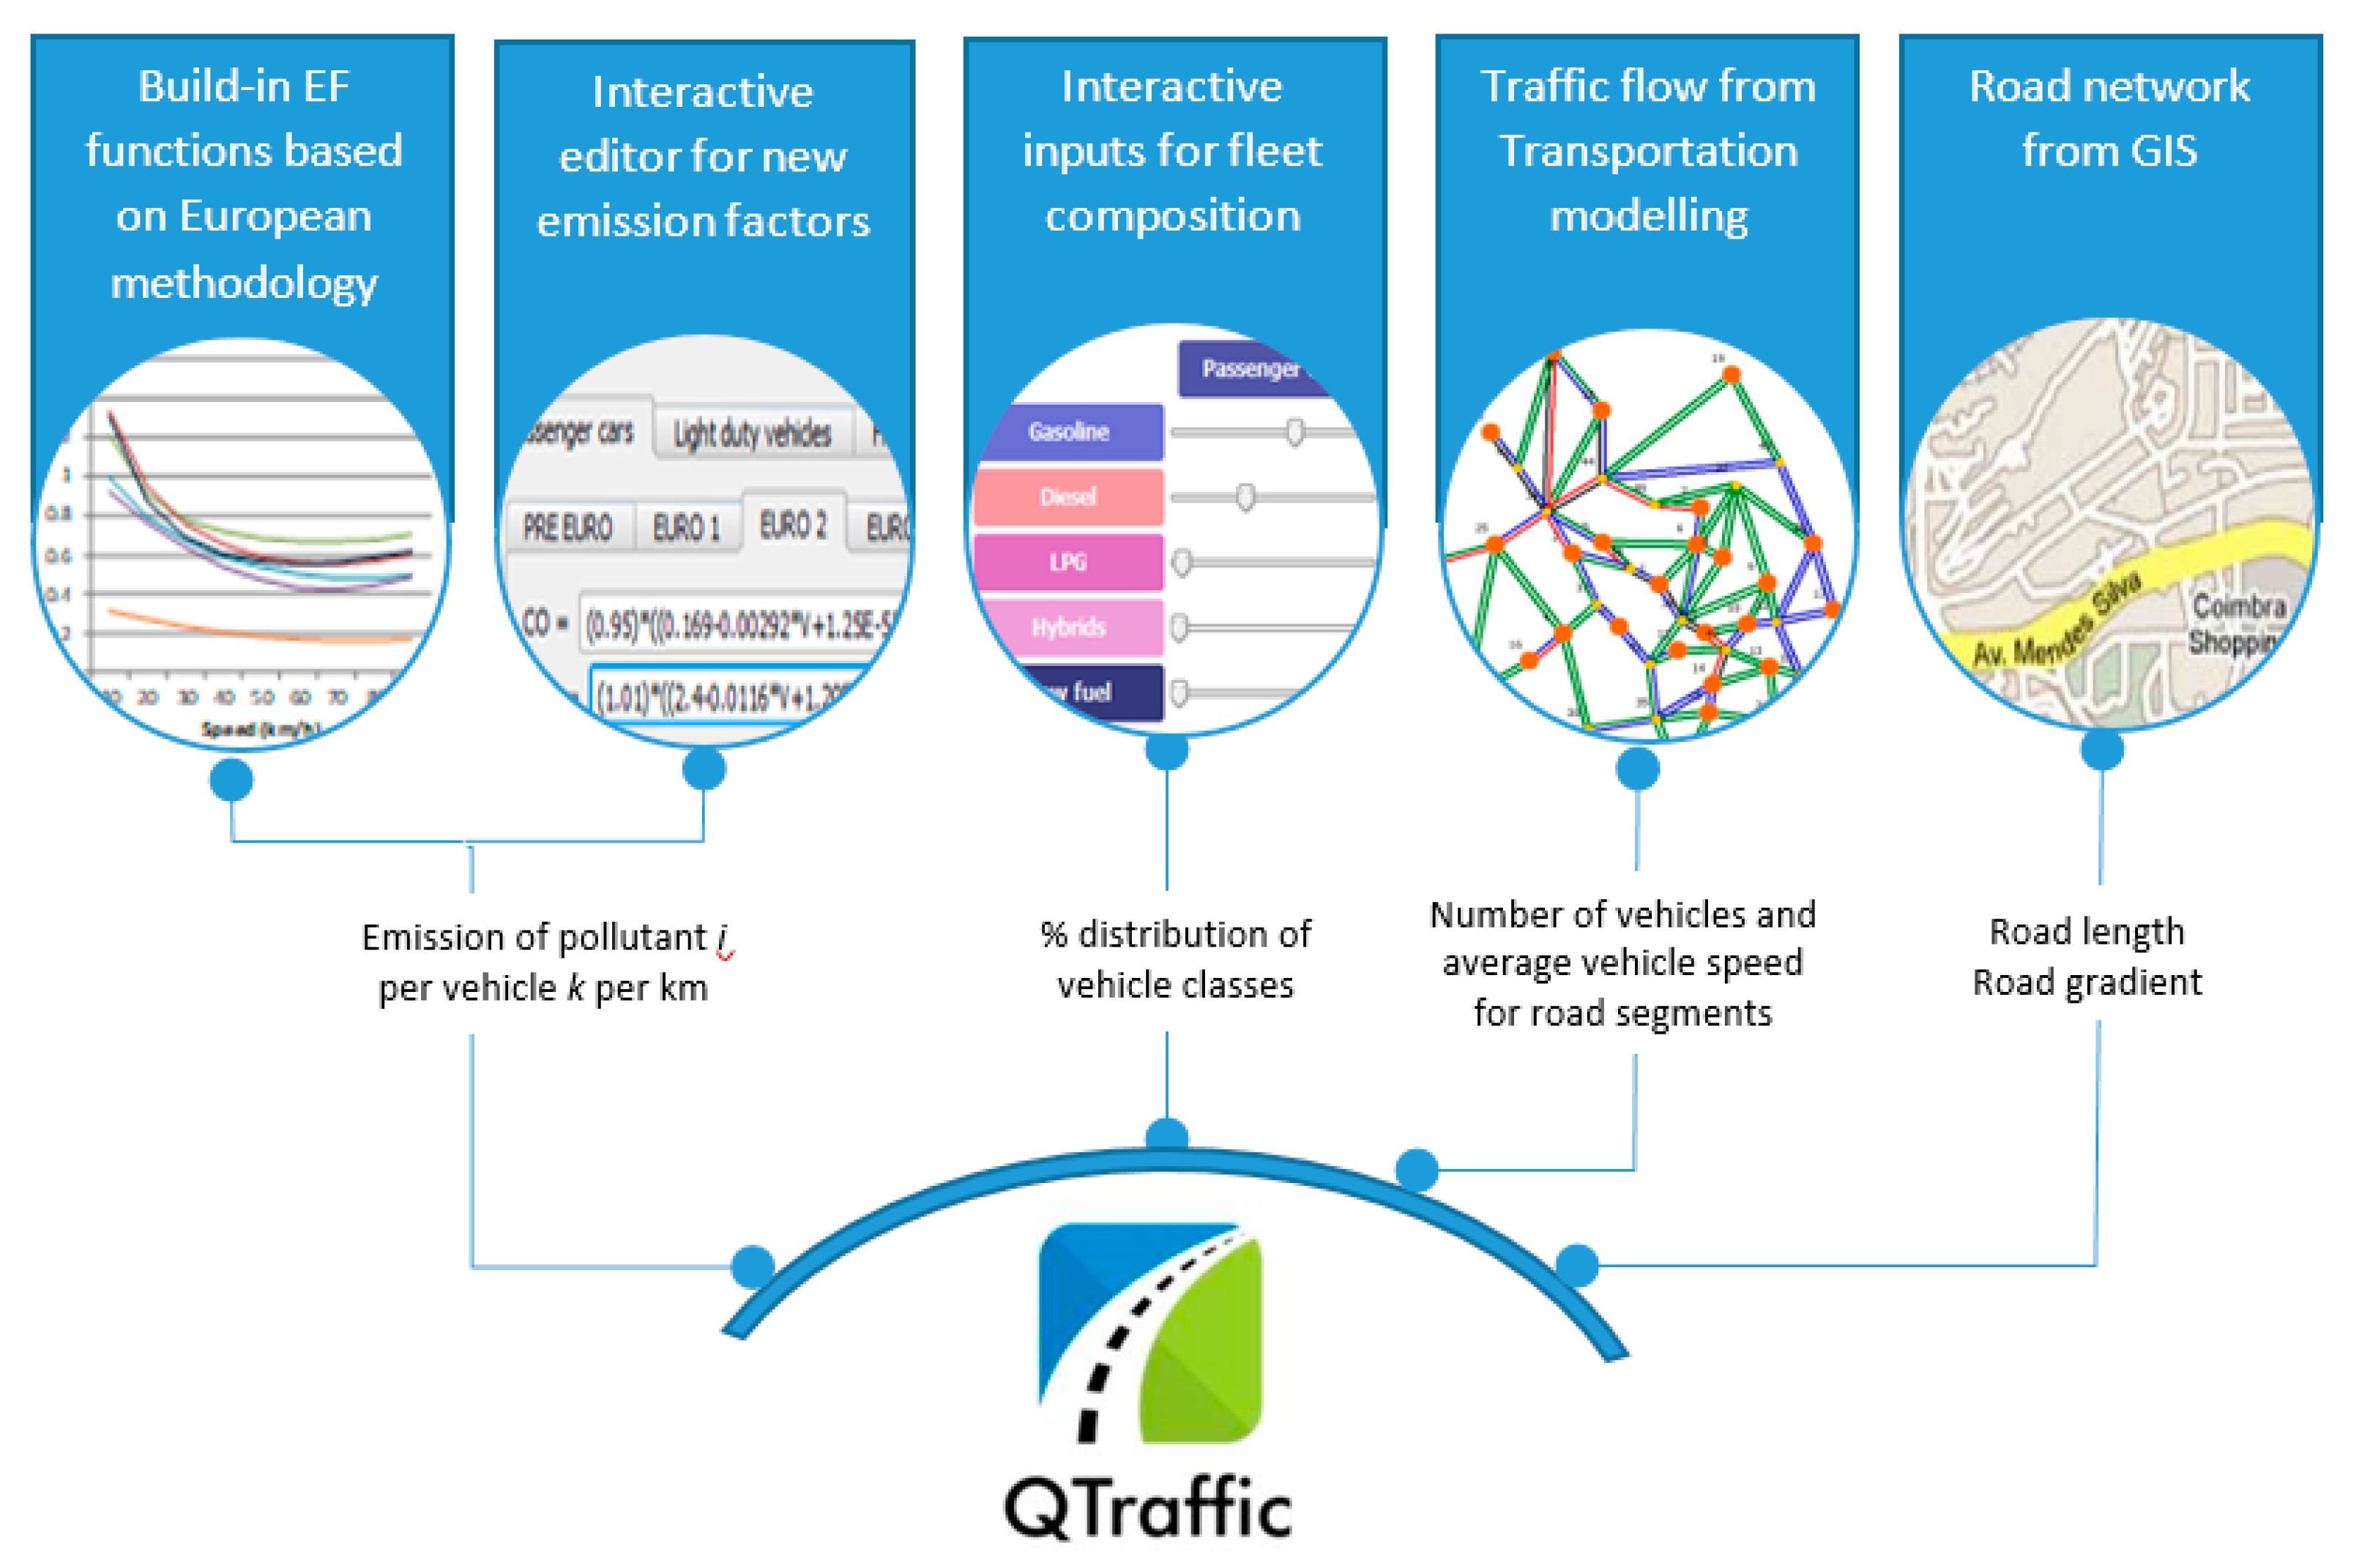
Figure 2 schematically presents the QTraffic modelling approach that was developed and applied in this study. Emissions and energy use from the use of bio-fuelled vehicles are estimated for the city of Coimbra (
Section 4).
5. Results and Discussion
The analysis of the potential effects of biofuels use on emissions and energy use is performed relative to the situation with 2020 projected private cars fleet fuelled by the conventional fuels and B7 fuel blend (reference situation).
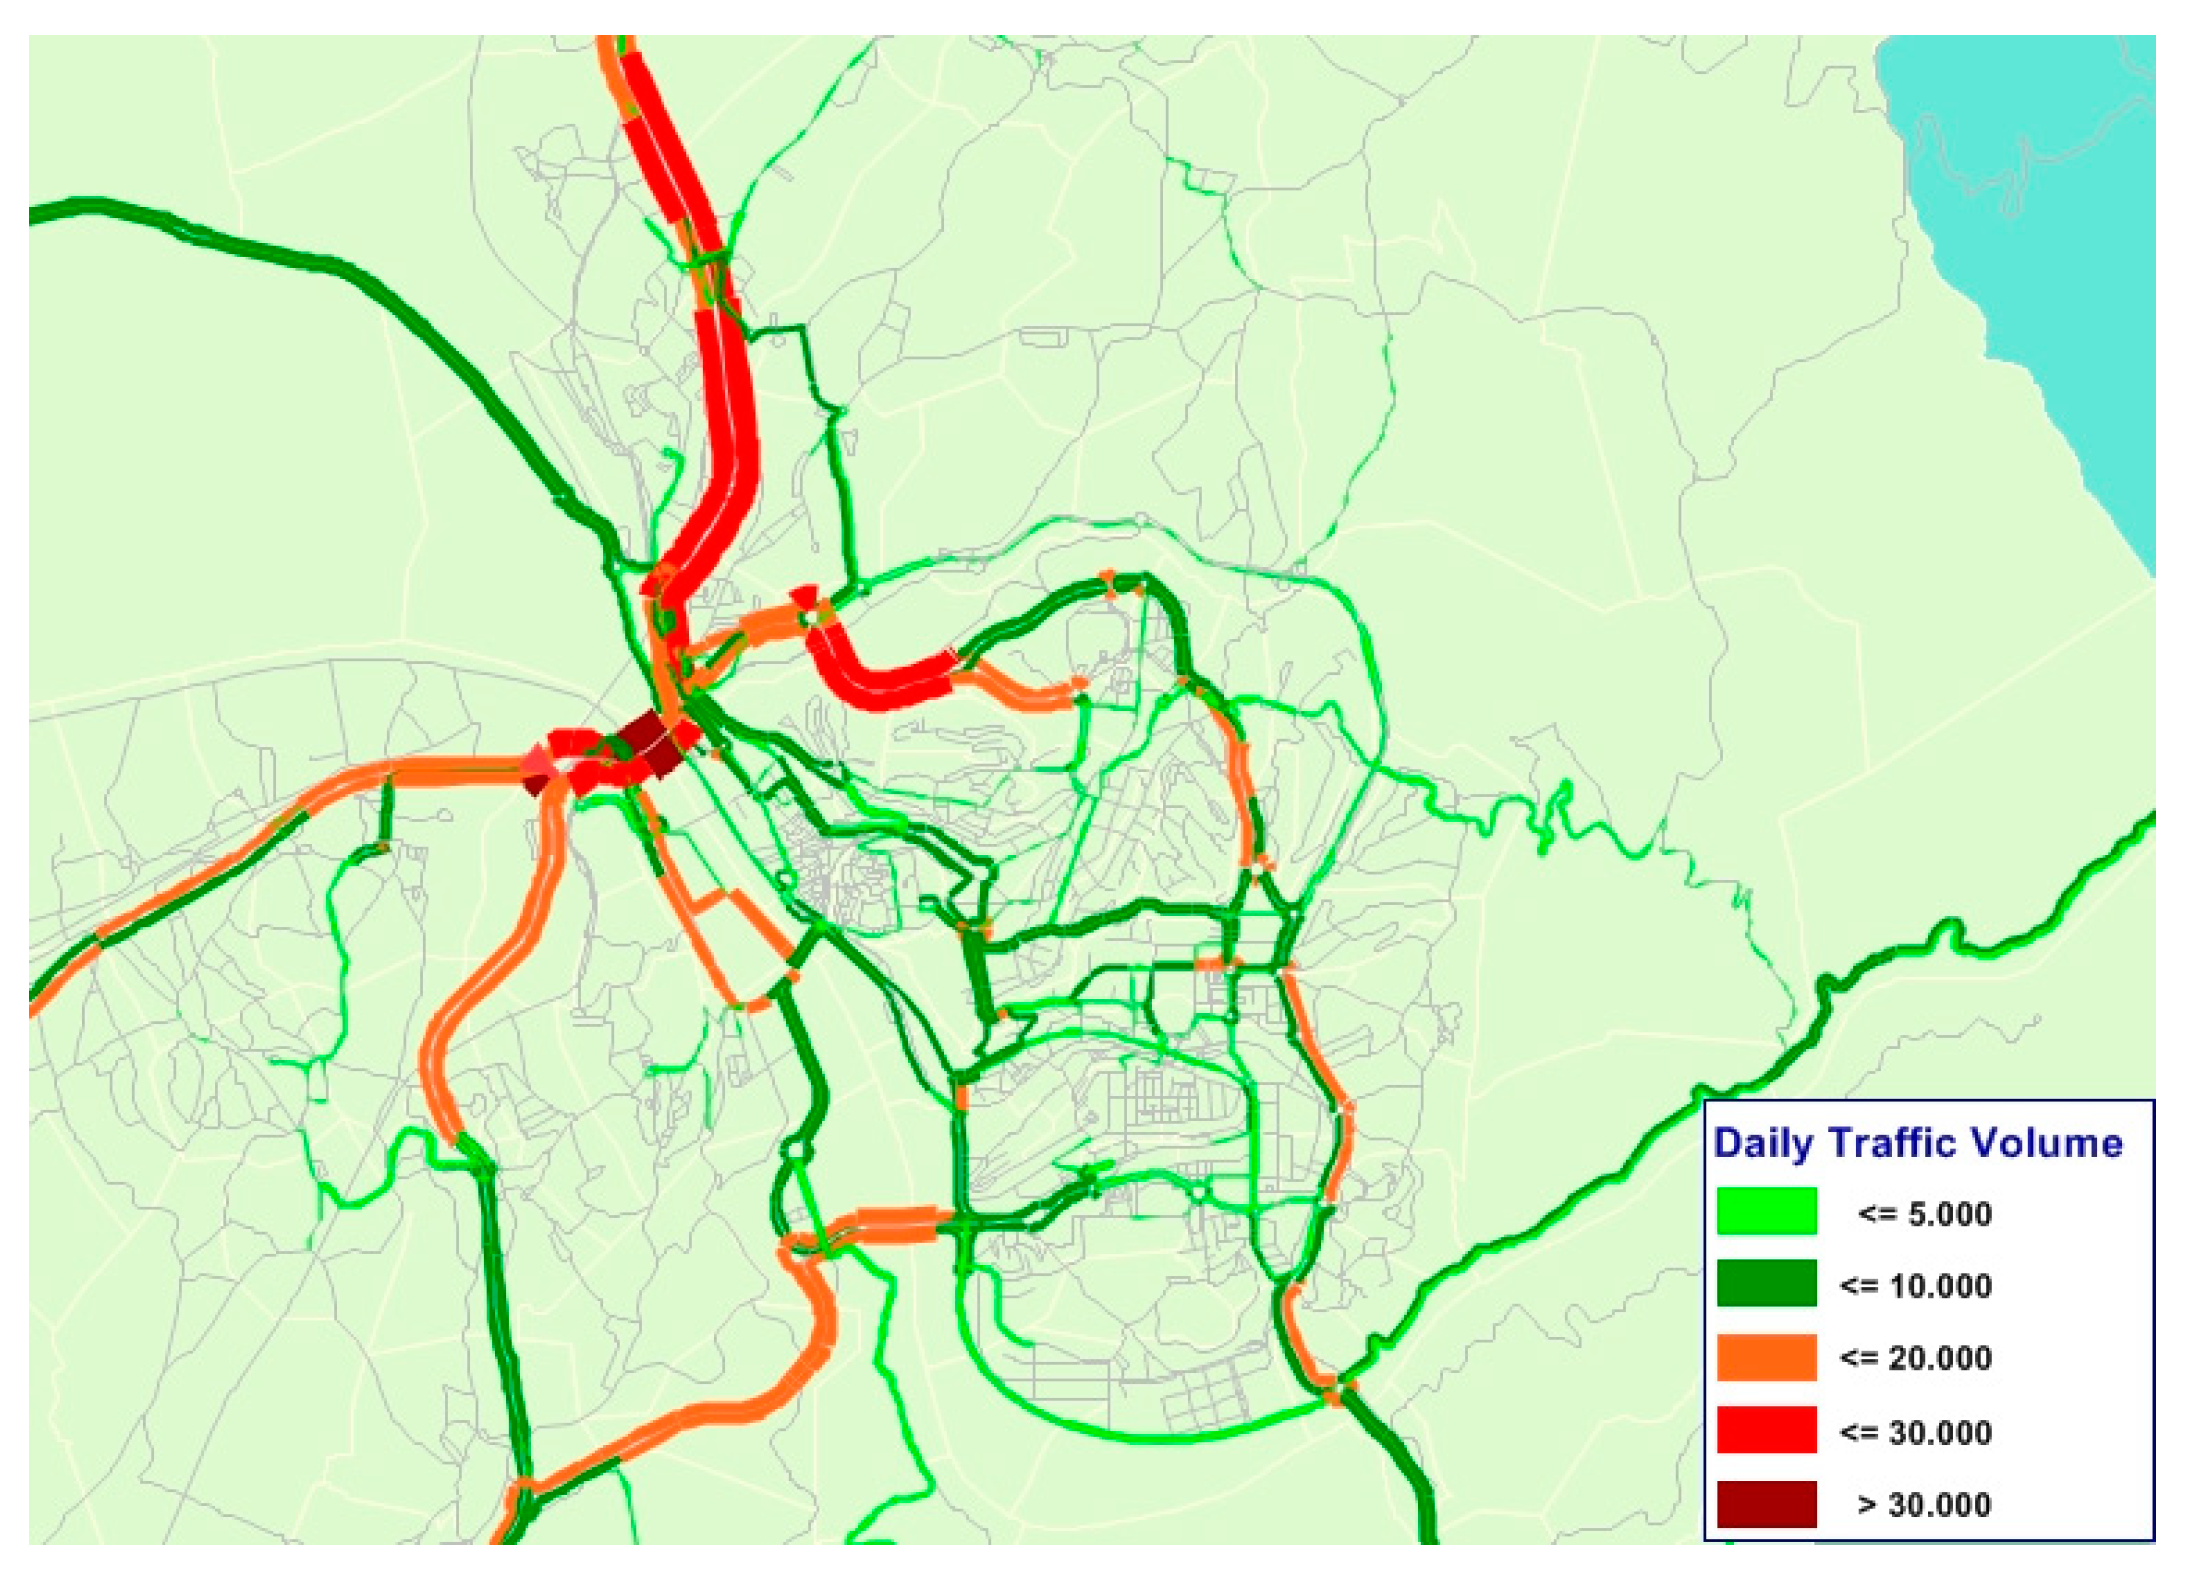
The spatial variations in traffic flows that were obtained from the VISUM software and considered for traffic emissions estimation for the selected scenarios are presented in
Figure 4, which correspond to about of 1,420,000 vehicle*kilometres travelled (VKT) per day within the Coimbra’s urban area.
The user-friendly QTraffic interface for new fuel emission calculation was used to facilitate the modelling of alternative fuels impacts at the urban scale. According to the results that were obtained through the developed QTraffic emissions model, the implementation of bioethanol, and biodiesel fuelled private cars leads to a global increase in NO
x emissions, while there is no noticeable reduction being observed in atmospheric PM
2.5 emissions for Coimbra (
Table 4).
Table 4 shows the results on percentage emission reduction as compared to the 2020 reference situation for the two biofuels scenarios, while taking into account the biofuels average emission factors and their uncertainty ranges that were obtained from experimental studies (
Section 4). It is important to note that emission factors are commonly recognised as the main source of the uncertainties in emission inventories [
35]. Therefore, in this study, the uncertainty ranges of the emission factor was considered, thus allowing to analyse how variations in emission factors data estimated by several experimental studies affect the emission estimations from biofuelled vehicles. Moreover, the quantification of the uncertainty range for the emissions is essential to open a possibility to implement air pollution modelling for the study area while using the probabilistic approach in a future research.
For both biofuels scenarios, the results indicate that the average changes on PM
2.5 emissions are very close, but the expected largest emission reduction of 3.8% occurs for Scenario 2, as evidenced in
Table 4, which accounts for the additional contribution of biofuel share. For NO
x, the maximum expected reduction is about 0.8%, while an increase of about 1% occurs, as observed under a strong introduction of biofuels (Scenario 2). With the increase in percentage of biofuels fuelled vehicles, an average increase of about 2% in NO
x emissions is also observed.
In order to better understand the outcomes that were achieved in our study, a comparison of the obtained results (% variation by g/km) for the optimist biofuels introduction scenario (Scenario 2) with similar research studies that are presented in
Section 2 has been performed. The potential effects of lower blends of biodiesel (B7 and B10) on the emissions that were obtained in the current study for Coimbra (for PM: −15% [−35% to 1%]; for NO
x: 1% [−2% to 2%] by g/km) are within the range of the values reported by similar study results, such as Pino-Cortés et al. [
32] (B8 scenario: −6% for PM and 1.2 for NO
x) and Hutter et al. [
34] (B10 scenario: −5% for PM and 10% for NO
x), this evidencing a beneficial effect on PM
2.5 emissions and a negative effect on NO
x emissions. However, it should be noted that in our study, only private cars were analyzed instead of all gasoline/diesel vehicle fleet. Moreover, the distinct results that were obtained indicate the sensitivity of the emission modeling to the emission factors defined by the user. In terms of bioethanol effects, the emissions changes (for PM: −51% [−60% to −36%]; for NO
x: 2% [−10% to 11%] by g/km) obtained for Coimbra are not directly comparable with similar research studies, since the results of the single study reviewed in
Section 2 (Garcia et al. [
30]) are reported in different units (% variation by kg).
Figure 5 illustrates the pattern of spatial variation in daily NO
x emissions that are expected to occur after the implementation of biofuels, when considering the average differences between Scenario 1 and the reference situation. A spatial distribution of the emissions across the study domain is directly obtained by the QTraffic model due to its flexible link to open-source QGIS maps. The effects of the penetration of biofuels that are considered in Scenario 1 are to increase NO
x emissions mainly along the urban roads at Coimbra’s central area and main city entrances (
Figure 5). Under this scenario, the maximum NO
x increases occur in the north section of the Coimbra’s central area, reaching up to 9.5 kg/km per day. Overall, when considering a moderate introduction of biofuels, the expected variations in NO
x atmospheric emissions for the entire urban area are about 0.33kg, with uncertainty that is related to emissions factor range from −2.98 kg to 2.13 kg and in PM
2.5 atmospheric emissions are −0.38 kg with an uncertainty range from −0.44 kg to −0.27 kg.
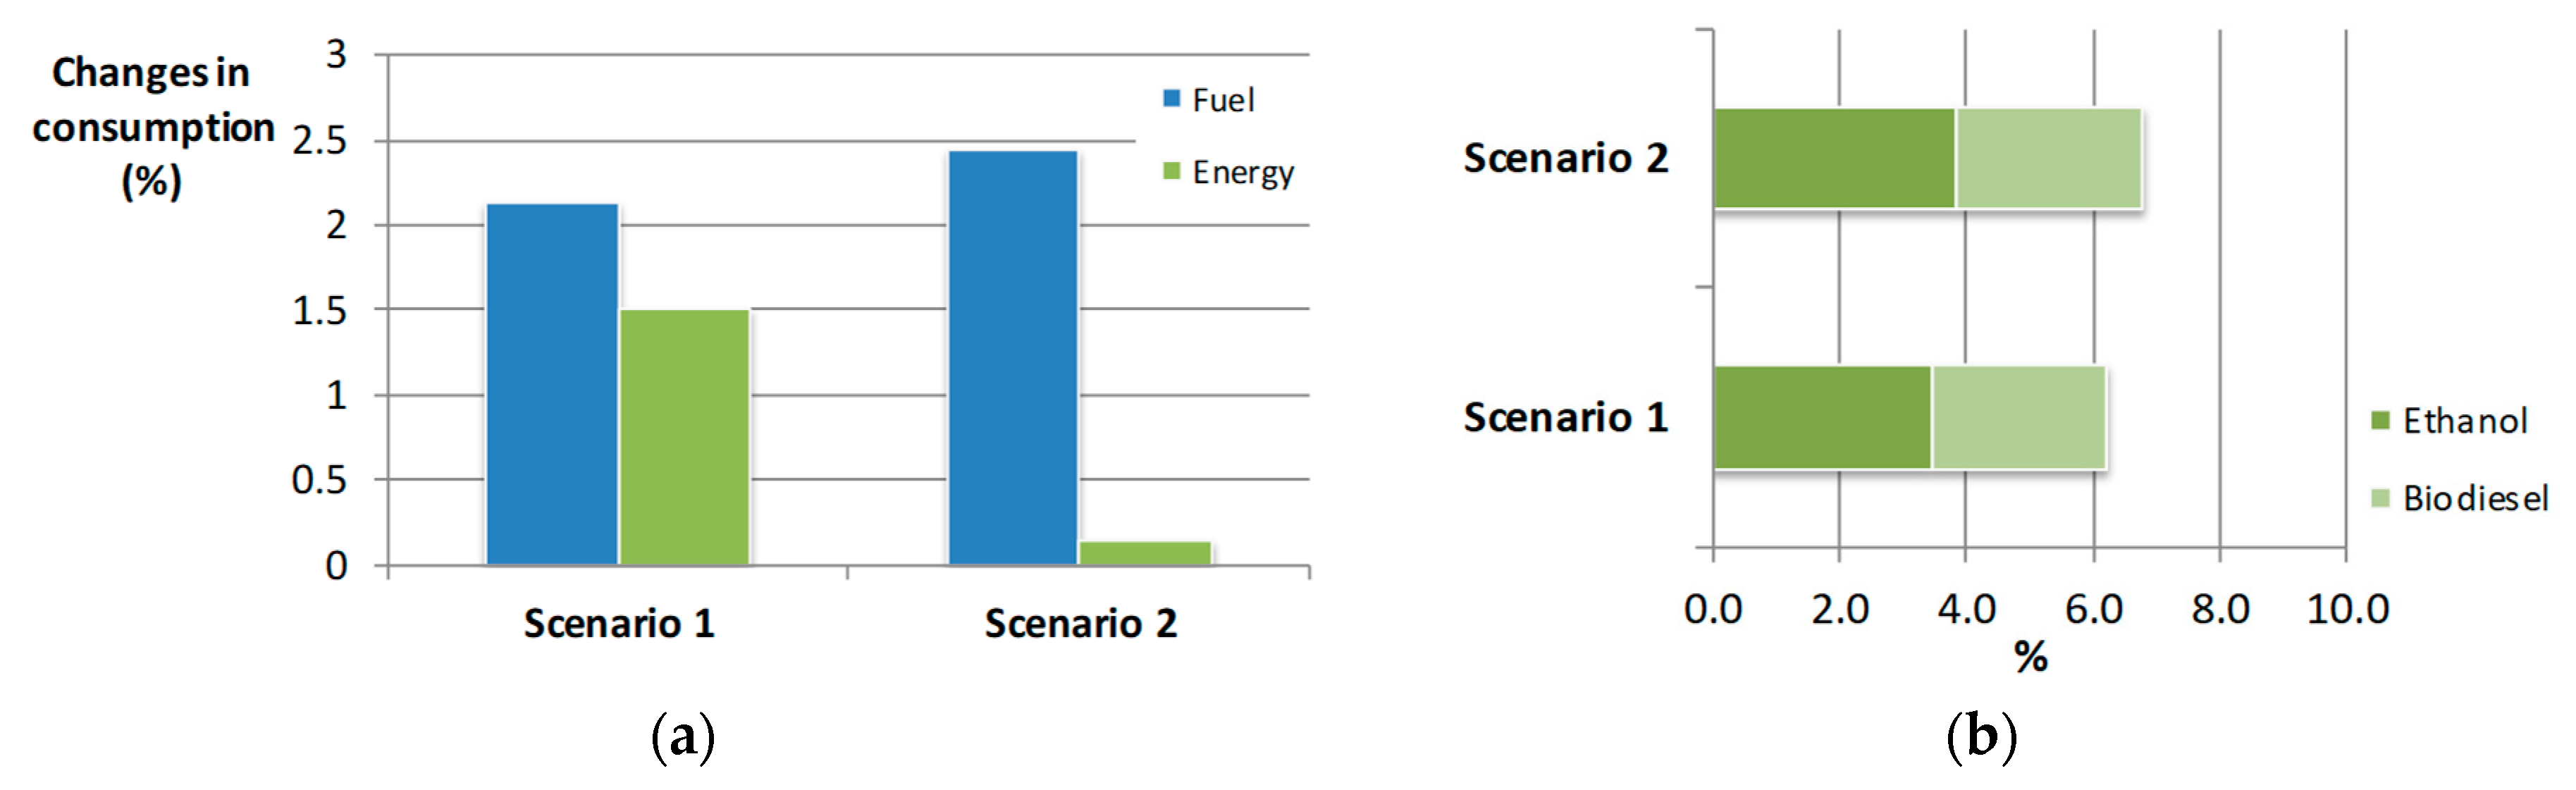
Figure 6a presents the variations in fuel and energy consumption for the city of Coimbra between the biofuels demand scenarios and the reference situation estimated through the QTraffic model. As illustrated in this figure, due to the lower calorific value of biofuels, the results indicate that fuel consumption is increased by over 2.1% and 2.4% when considering Scenario 1 and Scenario 2, respectively. Moreover, as expected, the maximum contribution in the transport energy use from renewable sources (biofuels) is observed for Scenario 2, which corresponds to about 7%, due to the increase of bioethanol (4%) and biodiesel (3%) share (
Figure 6b).
6. Conclusions
The present research was performed to quantify the effects of the potential use of biofuels on traffic-related air pollutant emissions and energy use. For this purpose, the Traffic Emission and Energy Consumption Model—QTraffic—was developed and designed in a very open and flexible manner to estimate the impacts of alternative transport fuels at the road segment level.
The proposed approach was applied to the city of Coimbra to assess the EU’s and Portuguese policy initiatives related to transport strategy on road transport emissions at urban scale. Specifically, given the current fuel standards, vehicle technology projected for 2020 and the uncertainties in future biofuel developments, two biofuels demand scenarios were designed with the aim of predicting the influence of biofuels blends use on vehicle exhaust PM2.5 and NOx emissions and on energy use.
Overall, we concluded that the increase of biofuels blends on private cars vehicles would have a beneficial effect on PM2.5 emissions, although relatively small. In the two biofuels demand scenarios, it is about 3% difference with the 2020 reference situation. However, the modelling results suggest that the increasing introduction of bioethanol and biodiesel fuels in road transport has a globally negative effect on NOx emissions on the urban level, which is mainly due to the bioethanol uptake (E10 and E20). We also concluded that, at the same time, fuel consumption would increase due to the introduction of the selected biofuels, while energy use tends to greatly decrease with the increase in the percentage of biofuels blends.
Overall, for alternative transport solutions, not only GHGs reductions are requested, but also benefits with respect to exhaust emissions that affect local air quality. However, this research work highlights that several uncertainties concerning both emission and energy use are still evident in urban areas, which makes the evaluation of the sustainability of bioethanol and biodiesel as transport fuels a challenging task that needs additional research, especially in the design of new integrative approaches. The modelling tool that was developed and applied in the present work is intended to be a key component of a decision-support tool for the complex decision-making processes concerning the sustainability of alternative fuels, which also provide valuable input to air pollution models to assess human health outcomes and climate impacts.
Finally, some limitations and future research must be considered. The proposed methodology was applied when only considering private passenger vehicles. Thus, as future research, the modelling of emissions and energy use from biofuel fuelled light duty vehicles and buses at urban scale should be assessed. Moreover, the integration of the proposed modelling approach with an air quality model and the validation of the modelling cascade should be addressed in a future work.


