1. Introduction
Regional and local planning (whether territorial of developmental), as well as decision-making, should take account of the threats and risks that are specific to an individual municipality or region. Neglecting them or failing to anticipate them results in damage caused to people, property and natural systems. Therefore, it is an essential condition of governance to understand the threats and their causes, the scenarios in which they could possibly occur and develop, their anticipated local impact, and to have a clear strategy for prevention, response, impact mitigation and adaptation. We also need to understand the situations where the individual threats materialise and become shocks that the individual affected regions need to deal with. Specific economic shocks may, according to [
1], come from the internal environment (shocks which the management of the region can partially or entirely anticipate and influence, such as an increase in the number of cars and the associated adverse effects, technological disasters, population ageing, emigration of a qualified workforce from the region, etc.). There are also shocks that come from the external environment, whose occurrence and intensity is difficult to anticipate and over which regional public administration has no control (e.g., climate change and its effects, economic risks such as high inflation, deflation, economic crisis, changes in energy prices, natural non-climatic disasters, terrorism, influx of immigrants, etc.).
The concept of resilience has become respected and used mainly in the context of adverse events (external shocks) that have a critical or even catastrophic impact, such as terrorist attacks, financial crises, epidemics, natural disasters, etc. Moreover, such effects of threats are often shaped by their global character. The need for studying resilience arises from the general feeling of instability and uncertainty further intensified by the multiplication and interconnectedness of various threats [
2]. Resilience can be defined as the ability of a system to absorb the impact of shocks while maintaining its essential functions and structure [
3]. In other words, resilience is the capacity to change for the sake of preserving identity [
4]. In addition to the general ability to overcome shocks, resilience with respect to socio-economic systems also involves the idea of adaptation, learning and self-organisation [
5].
Resilience and vulnerability are closely related to sustainability. Both approaches can be classified as being part of the scientific field of environmental management as well as the quality of life management. The concepts of sustainability and resilience share many similar elements, which are often applied without a clear distinction, also because of the perspectives of different fields of study. Sustainability and resilience are sometimes regarded as identical concepts [
6,
7,
8] because they both pursue a future with a high quality of life and resilience to adverse events. Both apply to a state of a system or function in time, focusing on its preservation and survival. However, they are often regarded as distinct and unrelated [
6]. This is because the sustainability of towns and regions focuses on increasing the quality of life for the present as well as future generations, taking into account economic, environmental and social factors [
9,
10]. By contrast, resilience focuses on studying and influencing the future response of economic, environmental and social systems to external shocks [
11].
In the event of an economic shock, businesses in towns and regions become insolvent, which leads to reduced production and job losses. Vulnerability to recessive shocks varies, so it is necessary to identify the factors that interrupt the trajectory of sustainable development, causing reduced resilience and adaptive capacity.
Examination of three critical domains of resilience capacity: (1) entrepreneurial capacity; (2) socio-demographic capacity; and (3) community resilience enables us to anticipate vulnerability and adaptive capacity, which is studied in the border regions of Eastern Slovakia and Transcarpathian Ukraine.
What makes this cross-border framework of the research even more important is that the border acts as a barrier to any transfer of a response, as there are a language and cultural barrier, insufficient mutual understanding of processes and legislation, and fewer available resources for the economy. The limiting factors of economic development result in reduced resilience due to substantial migration for work to other regions of the country and abroad, which reduces resilience even more due to weakened human capital and sudden jumps in population ageing.
The research aims to create a model of adaptive capacity in the cross-border region that enables measures to be proposed particularly on the Schengen border to increase regional resilience and sustainable development.
2. Literature Review
Regional or urban resilience is considered to be the capacity of the economy, firms, institutions, citizens and the community to be prepared for, to respond, mitigate and accommodate the devastating effects of the external shocks and hazards they deal with [
12,
13]. The system is either expected to return to the previous equilibrium after a shock (engineering resilience), or an idea of adaptivity is applied to study more the absorption of the external shock (ecological resilience) resulting in a new equilibrium [
14,
15]. Among the various definitions and measurements in the literature, also the third concept of adaptive resilience is considered [
16], emerging from the theory of complex adaptive systems. Adaptive resilience denotes the system’s ability to rearrange its organization, with a view to generating new ways and means of operation, and also mitigating the extent of the shock [
17].
External stresses can be classified as sudden or long-lasting, but also local or global. The primary focus of research into economic resilience is to understand the mechanism and the modus and the means how the local and regional economies respond to disturbances and perturbations. The first part of resilience is the capacity to absorb external shock. Subsequently, resilience relates in the second phase to adaptation acquired through the system’s self-organisation and consequent recovery. The second phase leads in the best case to the system’s self-transformation into an adapted system with improved core functions, or even to a new identity, organisation and feedback loops [
18]. Therefore, several effective measures to enhance the resilience capacity of the region’s economy to absorb disruptions and maintain its essential functions and properties (production, employment, innovation performance) need to be designed and tested.
The concept of close vulnerability is more related to the sensitivity and exposure of the regional economy experiencing the harmful effects of external pressures [
19]. Economic vulnerability implies changes in the established stability caused externally explained by three features—exposure, sensitivity and capacity to respond. Therefore, economic vulnerability is an endogenous state of the region or city in the relation to exogenous shocks, while economic resilience corresponds to actions to resist a negative shock and/or adapt to it [
20]. External shocks, such as the global financial crisis, have an uneven impact on businesses and labour markets.
The resilience element is present significantly in entrepreneurship studies as a synonym of preparedness, persistence, overcoming difficulties and prevent possible threats and problems [
21]. Resiliency in entrepreneurship may be in simple words defined as the ability to adapt to change [
22,
23], respectively resilience is rather defined as a process of using resources leading to creating resilience capacity capitalised in productive outcomes. The substantial presence of resilient entrepreneurial behavioural and cognitive traits, as well as prospective social entrepreneurs in a region, are the basis of the capacity of firms and population to adjust to new circumstances and to recover quickly from difficulties. Thus, in an integrated model on entrepreneurial resilience capacity in a city or region, both internal (personal characteristics of entrepreneurs), and external (companies, environment and process) factors are momentous. The regional innovation capacity has been shown to be strongly related to its propensity to be resilient to economic shocks [
24].
Communities in the same manner as entrepreneurs need a high resilience capacity to deal with the external shocks and to overcome critical situations. Entrepreneurship is, therefore, more emphasized in regional resilience capacity construct in this paper, not only understood as a capacity of mitigation or absorption of the shock but rather a possibility to emerge stronger than before from failures and critical situation [
25].
Entrepreneurship is highlighted in the model as the first and key dimension of regional resilience capacity named as the entrepreneurial capacity. Youth entrepreneurship is increasingly pursued during recent years, for the sake of exploiting youth personality traits, high skills, ambition and creativity [
26]. Even more than in the past, the digital transformation of the economy and society inevitably requires ICT skills that are identified with the younger population. The second dimension of regional resilience, therefore, includes variables denoted together as the socio-economic capacity. Therefore, the resilience relies on entrepreneurship capacity including internal factors of personality traits and external environment of place and economy. The second socio-economic capacity underlines human capital and a need for new skills. To meet the full picture of regional resilience, a third dimension both dimensions of regional resilience require a third dimension of the community resilience is subjoined, representing links networks, and the social capital of population and entrepreneurs. Namely it is not possible to respond to shocks that have hit the wider community without a high density of links, effective communication, high trust, and collaboration capabilities.
Empirical studies indicate the persistence of regional entrepreneurship culture over long periods of time. A regional culture of entrepreneurship can outlast splitting and disruptive environmental conditions, such as the Second World War and forty years of a socialist regime in the case of East Germany [
27]. Nevertheless, the entrepreneurship culture has a different history in Ukraine or Slovakia compared to Germany, therefore, it is not entirely possible to generalise its persistence [
28]. Ukraine has survived for a much longer period in a collectivist and totalitarian regime than East Germany. Entrepreneurial ventures were a part of the unofficial economy and even after economic transition and privatisation entrepreneurship has still had an image of a necessary evil. Both Slovakia and Ukraine still show lower rates of entrepreneurial activity [
29,
30]. Even less developed is entrepreneurship in rural areas [
31] as agglomeration economies make it possible to generate inter-industrial interactions and knowledge spillovers. The integration of Slovakia into the EU, single market and free movement of labour, goods, services and capital, can be assumed to cause an even more increased diversion from Ukraine also due to raising urban concentration [
32,
33]. At the same time, it can be assumed that the border regions of Slovakia and Ukraine studied in this paper have the common attribute of peripheral and borderline position. Therefore, both the difference and similarity factors should be manifested in the differences in resilience capacity.
The concept follows the line designed by K. Foster [
34] as the Resilience Capacity Index (RCI), although local entrepreneurship and demographic change are more accentuated in this paper. These are both vital for adaptation, recovery and transformation. The reason is that border regions often suffer from an outflow of young people and rapid ageing of the population, reducing both the response capacity and the entrepreneurial ability to transform the region. The dynamics and adaptation to change of regions is not only related to industries and firms, but also to regional policy and governance as well as the wider institutional environment [
35]. While resilience is mostly studied in conjunction with unexpected external shocks and natural disasters, at the same time, there are parallel “slow burn” disturbances, i.e., slowly developing challenges, such as de-industrialisation, urban sprawl and also depopulation [
22,
36]. Resilience capacity will continue to reduce over the years if not addressed, due to the continuous emigration of the skilled workforce and resulting depopulation.
To sum up, in order to assess resilience in regions/towns, we can either study their performance in their response to past external shocks, or estimate their capacity for resilience in relation to future shocks on the basis of assessment of the dynamics of entrepreneurial activity, infrastructure, structure of the economy, and of the adaptive capacity of human resources and public administration. This paper aims to apply the latter method, i.e., to assess the resilience capacity of districts in the Slovak-Ukraine border regions. The method uses a composite index approach based on three types of resilience and indicators justified by empirical studies. In addition, this research is unusual due to its studying the border districts around a Schengen border, which are therefore disadvantaged by the strong border barrier.
3. Materials and Methods
A useful way to take account of the socio-ecological dimension of regional resilience is to apply the concept of adaptive resilience, which can be characterised in three main points [
21]:
The size of the shock the system is capable of absorbing while remaining in its original state;
The extent to which the system is capable of self-organisation;
The capacity to build and increase the capacity for learning and adaptation.
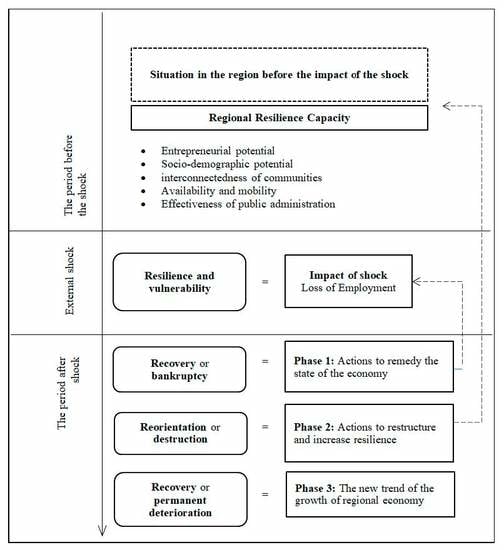
The concept of “adaptive resilience” refers to the ability of a town or region to reorganise its structure (in terms of its pre- and post-crisis states) to minimise the force of a shock acting on the municipality or to use the shock to achieve growth [
17]. This approach emphasises a municipality’s ability to undergo a modification of its structure or to modify a function to minimise the impact of an unfavourable change, either preventively or in response to a sudden change. The main emphasis is placed on the system’s adaptive capacity. The whole mechanism developed by the authors is shown in
Figure 1.
According to [
17,
22], several basic steps can be recommended for a region:
(a) First and foremost, the main priority for a region is to determine its resilience capacity, which enables its initial situation to be estimated before a potential external shock. This makes it possible to estimate the expected vulnerability or resistance to such a shock. A high resilience capacity does not, however, guarantee that the region will respond effectively to an external shock or that it will recover from its impact.
(b) Resistance or vulnerability expresses the sensitivity of a regional economy to external shocks and the extent of the impact of an external shock. In addition to resilience capacity, it is also influenced by other factors which, however, depend on the specific shock.
(c)The local administration and residents then need to take measures to remedy the damage caused by a negative shock. The effectiveness of these measures determines the degree of recovery achieved by a municipality and its areas afflicted by an external shock. This is a matter of short-term measures (e.g., public investment in maintaining employment rates).
(d) The next step that the municipality representatives should take is reorientation. As part of this step, the regional government plans and applies measures to increase the overall resilience capacity (for example by initiating changes in the regional economic structure) so that the region can respond more effectively to possible future external shocks.
We may say that the recovery phase and the reorientation phase together form adaptability, i.e., a region’s adaptive capacity. This comes down to the ability of regional players to build and maintain regional resilience. The resilience capacity investigated in this paper is an estimate of adaptive resilience when an external shock occurs.
We assess therefore the resilience capacity of the Slovak-Ukrainian border region at the lowest possible territorial level with respect to the availability of statistical data from the Regional Database of the Statistical Office of the Slovak Republic and the State Statistical Service of Ukraine, Department in Transcarpathian region.
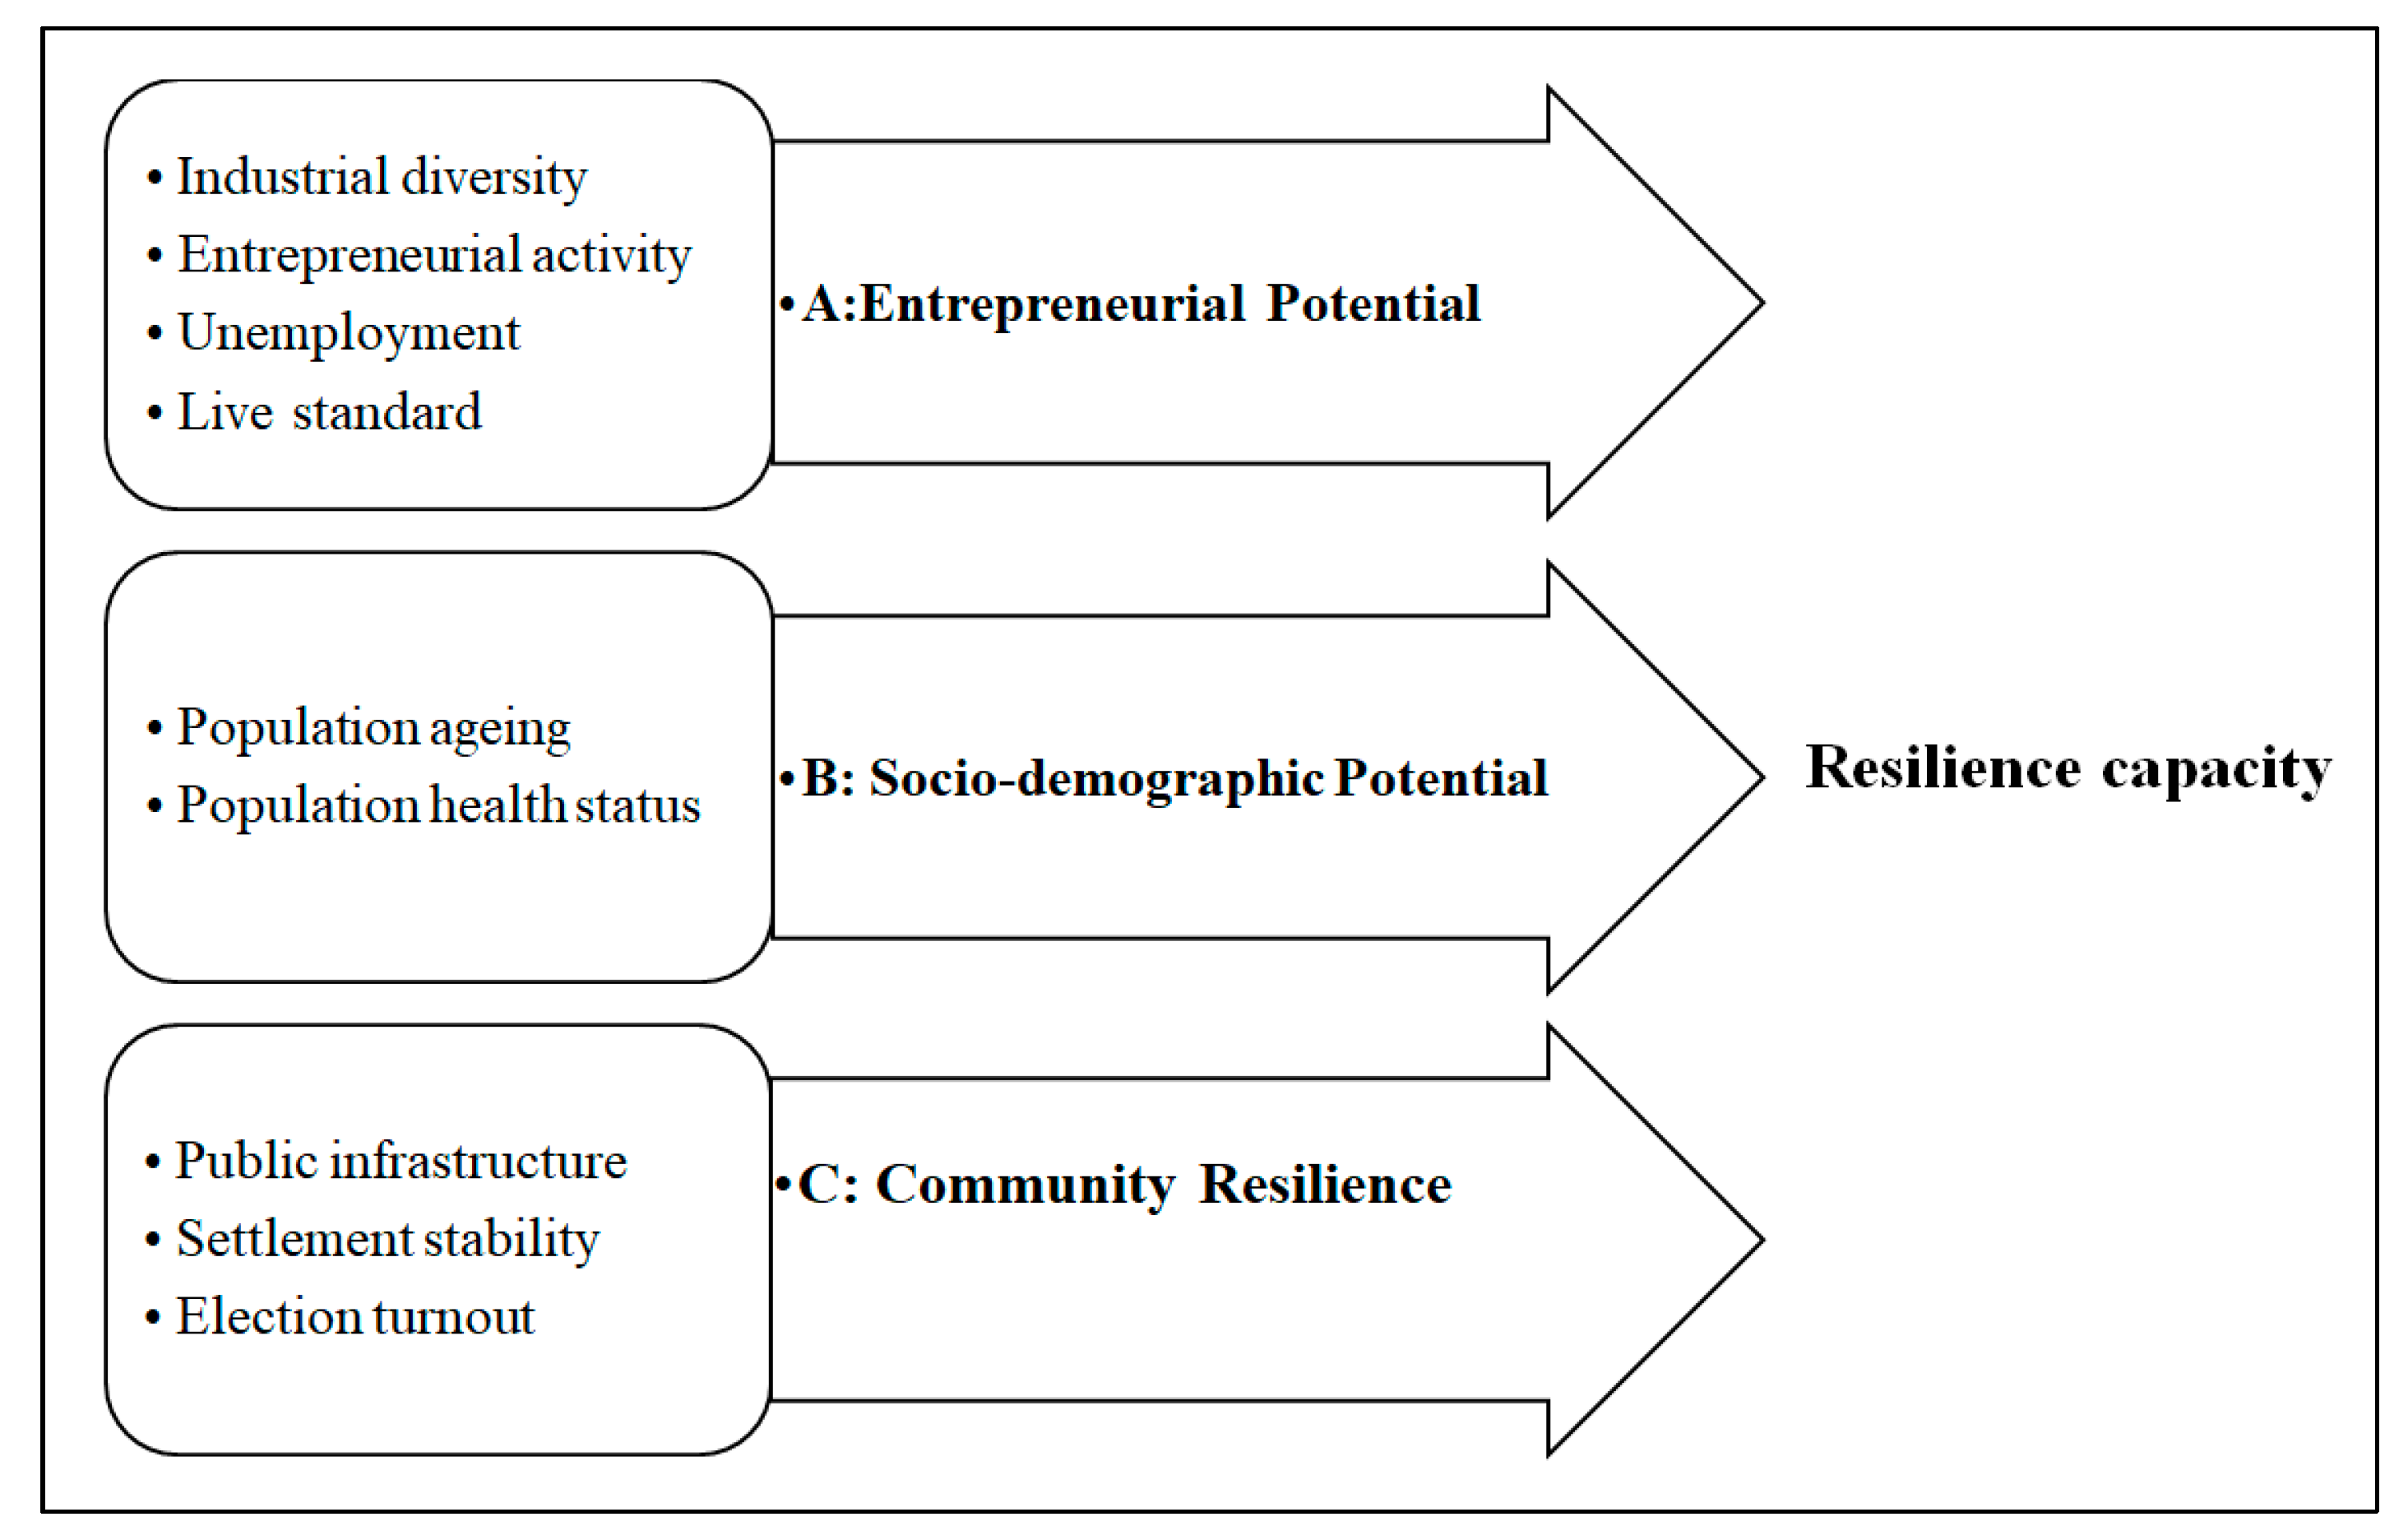
From the original set of 17 indicators, 9 indicators were selected and divided into 3 types of resilience capacity based on correlation analysis (
Figure 2). Ideally, the model would have another two resilience capacity domains (effective local administration and availability domains). However, a comparison of two border territories was not possible due to the unavailability of comparable data. The justification of all indicators used in the model is provided in
Appendix A. The values of the variables are stated in
Appendix B.
It is not applicable to test the responses of regions or towns to shocks very well. However, at least partially is possible to assess the factors that turned out to be essential to high resilience and adaptability during past economic crises. According to this reasoning, we can estimate the pre-shock capacity of regions and towns and to use the experience to anticipate the future, i.e., expected resilience to future shocks. The examination of resilience capacity relies on the identification and assessment of local conditions necessary for the best possible response to an external shock and for recovering from it. Resilience capacity can be measured at the level of regions using the Regional Resilience Index (RRI), which is based on a set of indicators summarising the regional or local capacity using factors expected to have an impact on a region or town’s ability to adapt to a future unknown or known shock. As explained in the previous section, this index is based on the RCI approach [
34], although it emphasises more significantly the factors of adaptability, the demographic dimension, population decline and entrepreneurship. In the new approach introduced in this paper, the resilience capacity indicators are divided into three domains:
The indicators are designed to achieve consistent logic, according to which a high value means a higher hypothetical level of resilience capacity. The index relies on the same weights in the case of every resilience capacity indicator. To be able to use all the indicators with various scales and metrics, we need to specify unified scaling for each indicator. These specified scales are referred to as the z-score, which quantifies the standard degree of deviation of a region’s or municipality’s performance from the examined region’s average. The index for any region or municipality is calculated as the average of the z-scores of all of its indicators.
The range of the
z-score includes the ±3σ interval, which means that this approximation covers more than 99.7% of the probability distribution. The
z-score has positive values (better than the average) or negative values (worse than the average). The
z-score is calculated using Equation (1):
where
z is the standard score;
X—measured value;
μ—average value;
σ—standard deviation.
The z-score, as a dimensionless variable, enables indicators measured using different scales to be combined into one RRI index. Having a higher resilience capacity implies that a municipality has the capacity to recover more effectively after an external shock. On the other hand, low resilience capacity implies that a municipality does not have enough of the factors needed to recover effectively after an external shock unless external help is provided. The three domains of resilience are selected so as to represent different dimensions of resilience capacity. Each of the dimensions is relatively autonomous, although all three dimensions are inevitable for the overall picture of resilience capacity.
Moreover, the capacity in one domain does not guarantee high values in the other two resilience domains. Just as an individual may stand out in terms of his income and yet be in poor health, regions/towns can also be in a contrasting situation with respect to each of the three resilience types. The border districts of Slovakia and Ukraine were used in the analysis by means of the proposed resilience capacity index. A border between two countries is often a border between two regions that are centres of economic activity, shaped by different history, culture and legislation. We can, therefore, expect that there will be differences between two border regions in Slovakia and Ukraine due to the national border. The systems of collecting and evaluating data in Ukraine and Slovakia differ in many respects, so it was necessary to carry out an in-depth comparison of various types of indicators and of their values in order to maintain the philosophy of the concept of the index.
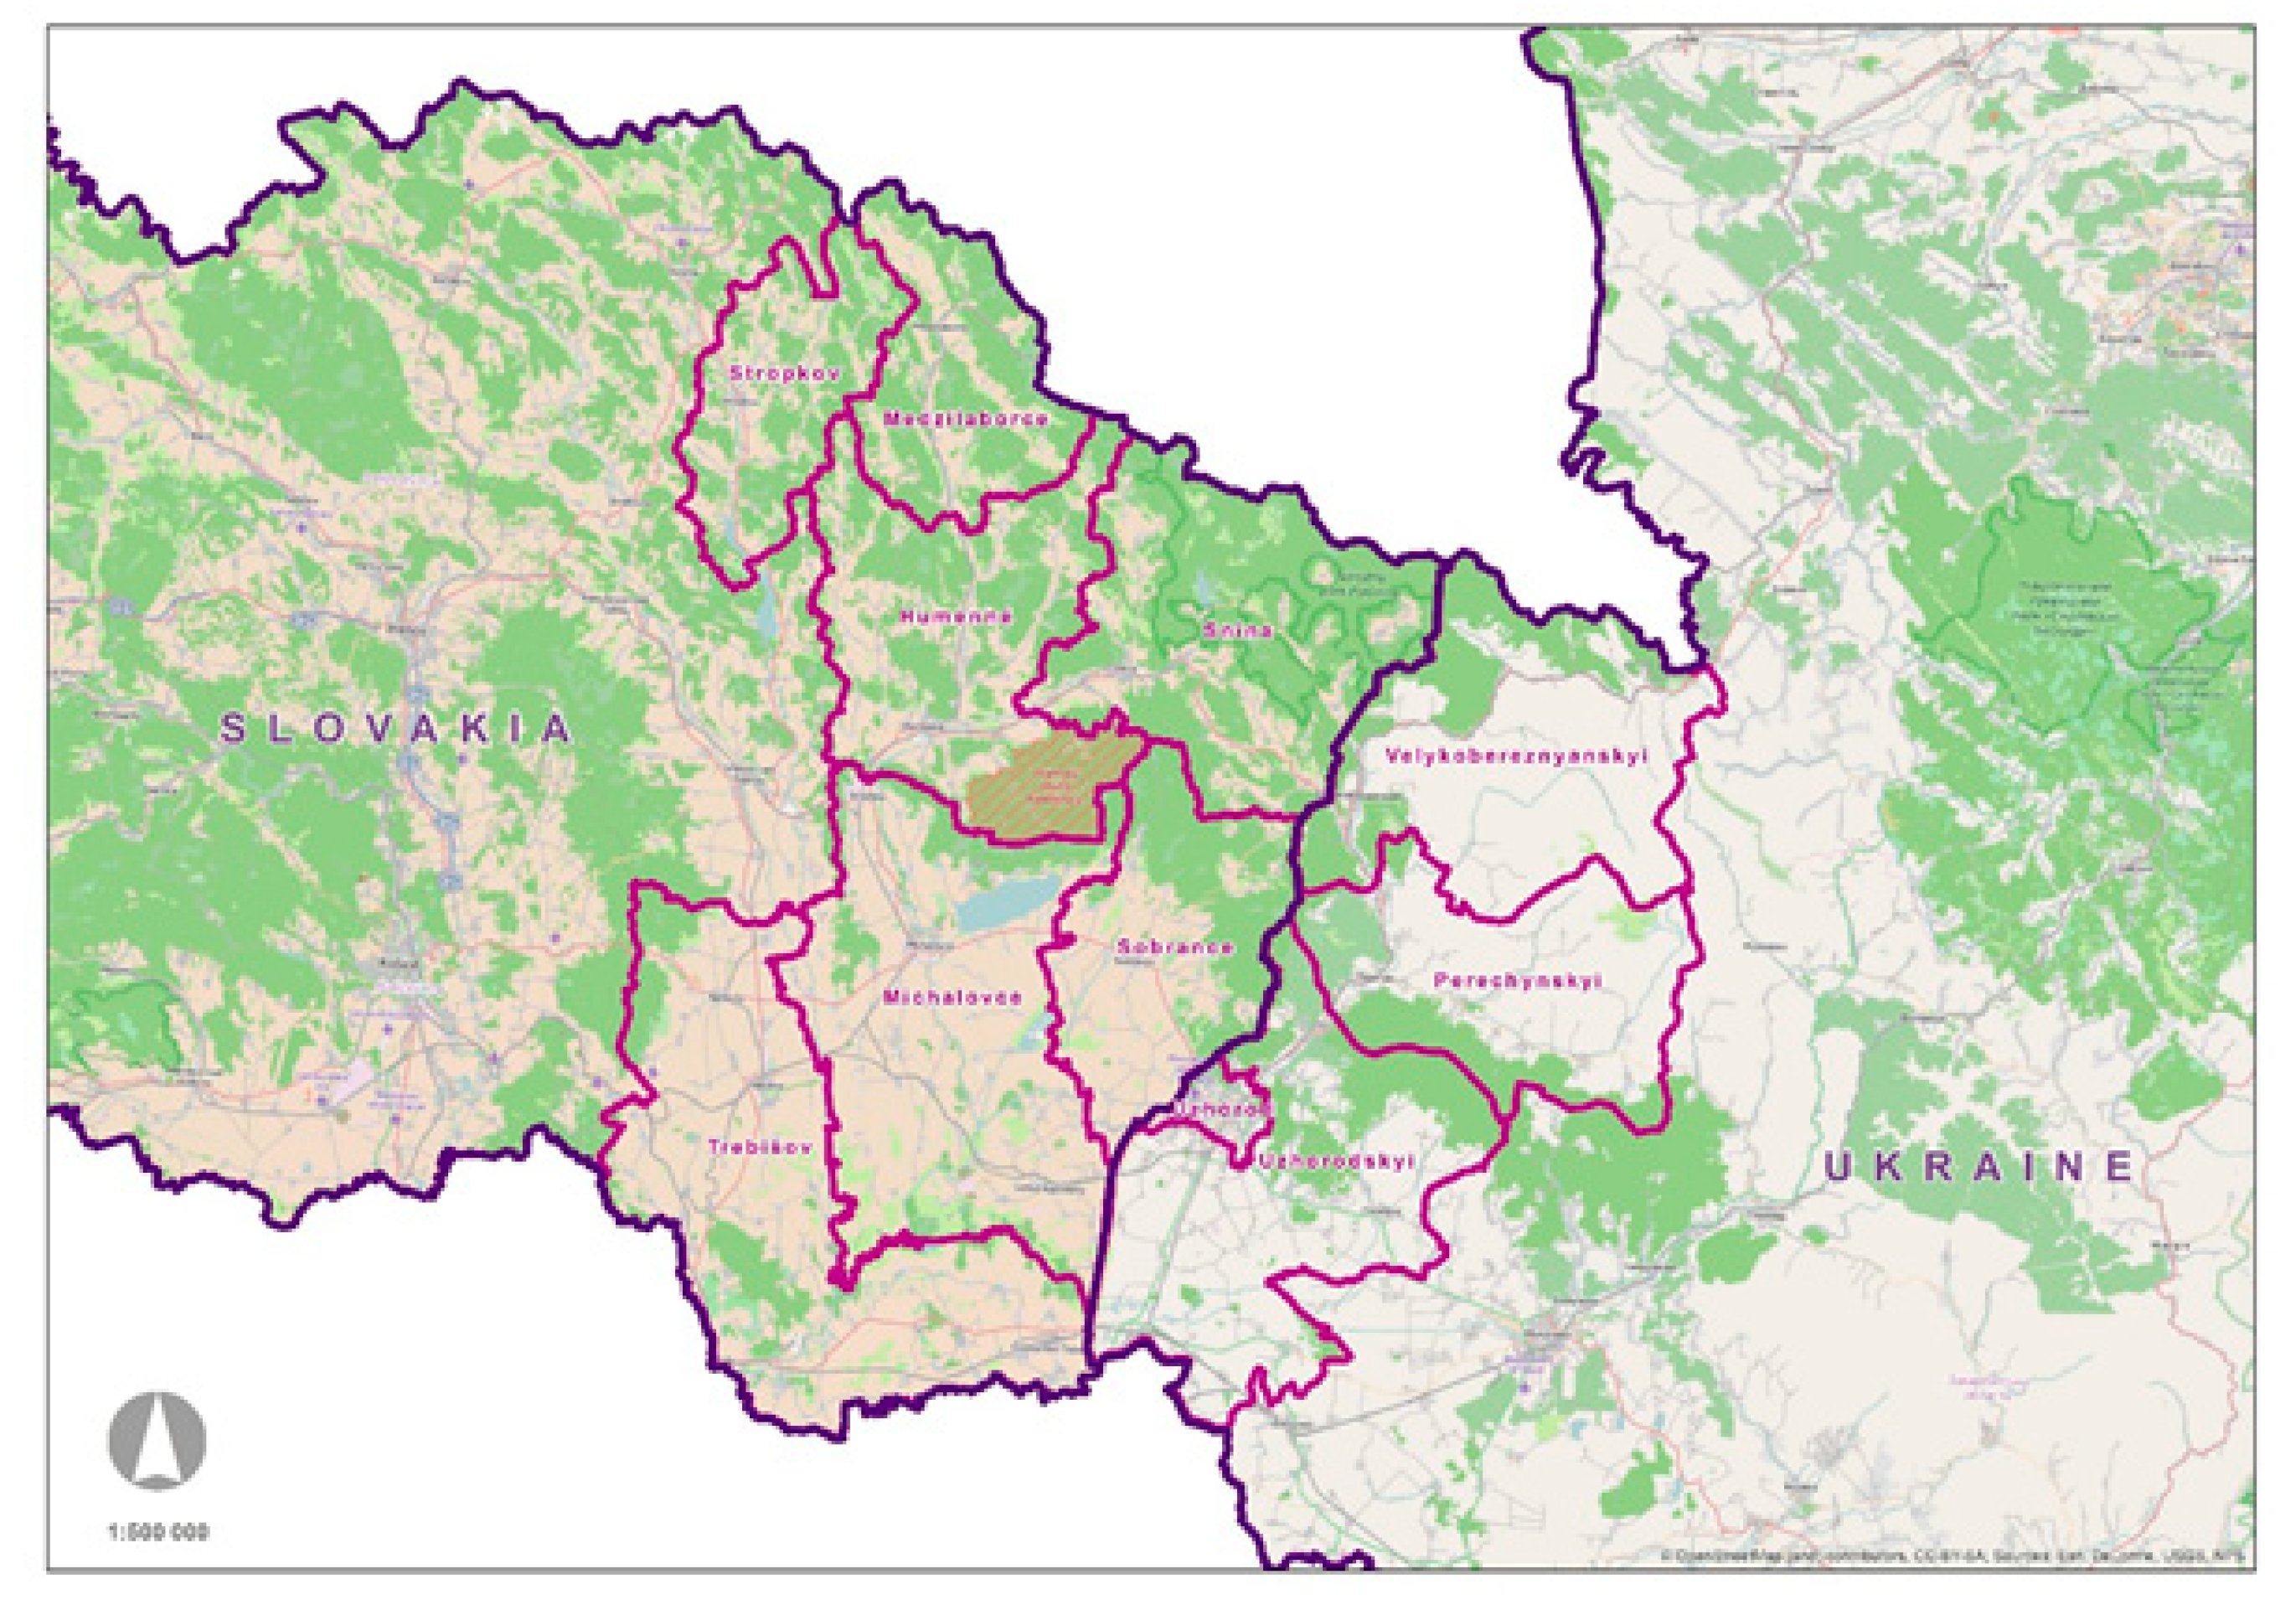
The examined regions (
Figure 3) consists of seven districts in Slovakia (called “okres” in Slovak) and four districts in Ukraine (called “rajon” in Ukrainian).
4. Results
The purpose of the research was to develop the concept of resilience capacity, which highlights entrepreneurial dynamics, the socio-demographic aspect and the interconnectedness of communities. This enabled us to gain an essential approach for measuring preparedness for external shocks and of revealing weaknesses in the resilience of regions and towns in the case of a crisis. The results of the research are summarised in three main areas examined: (1) entrepreneurial capacity; (2) socio-demographic capacity; and (3) resilience capacity in terms of the interconnectedness of communities.
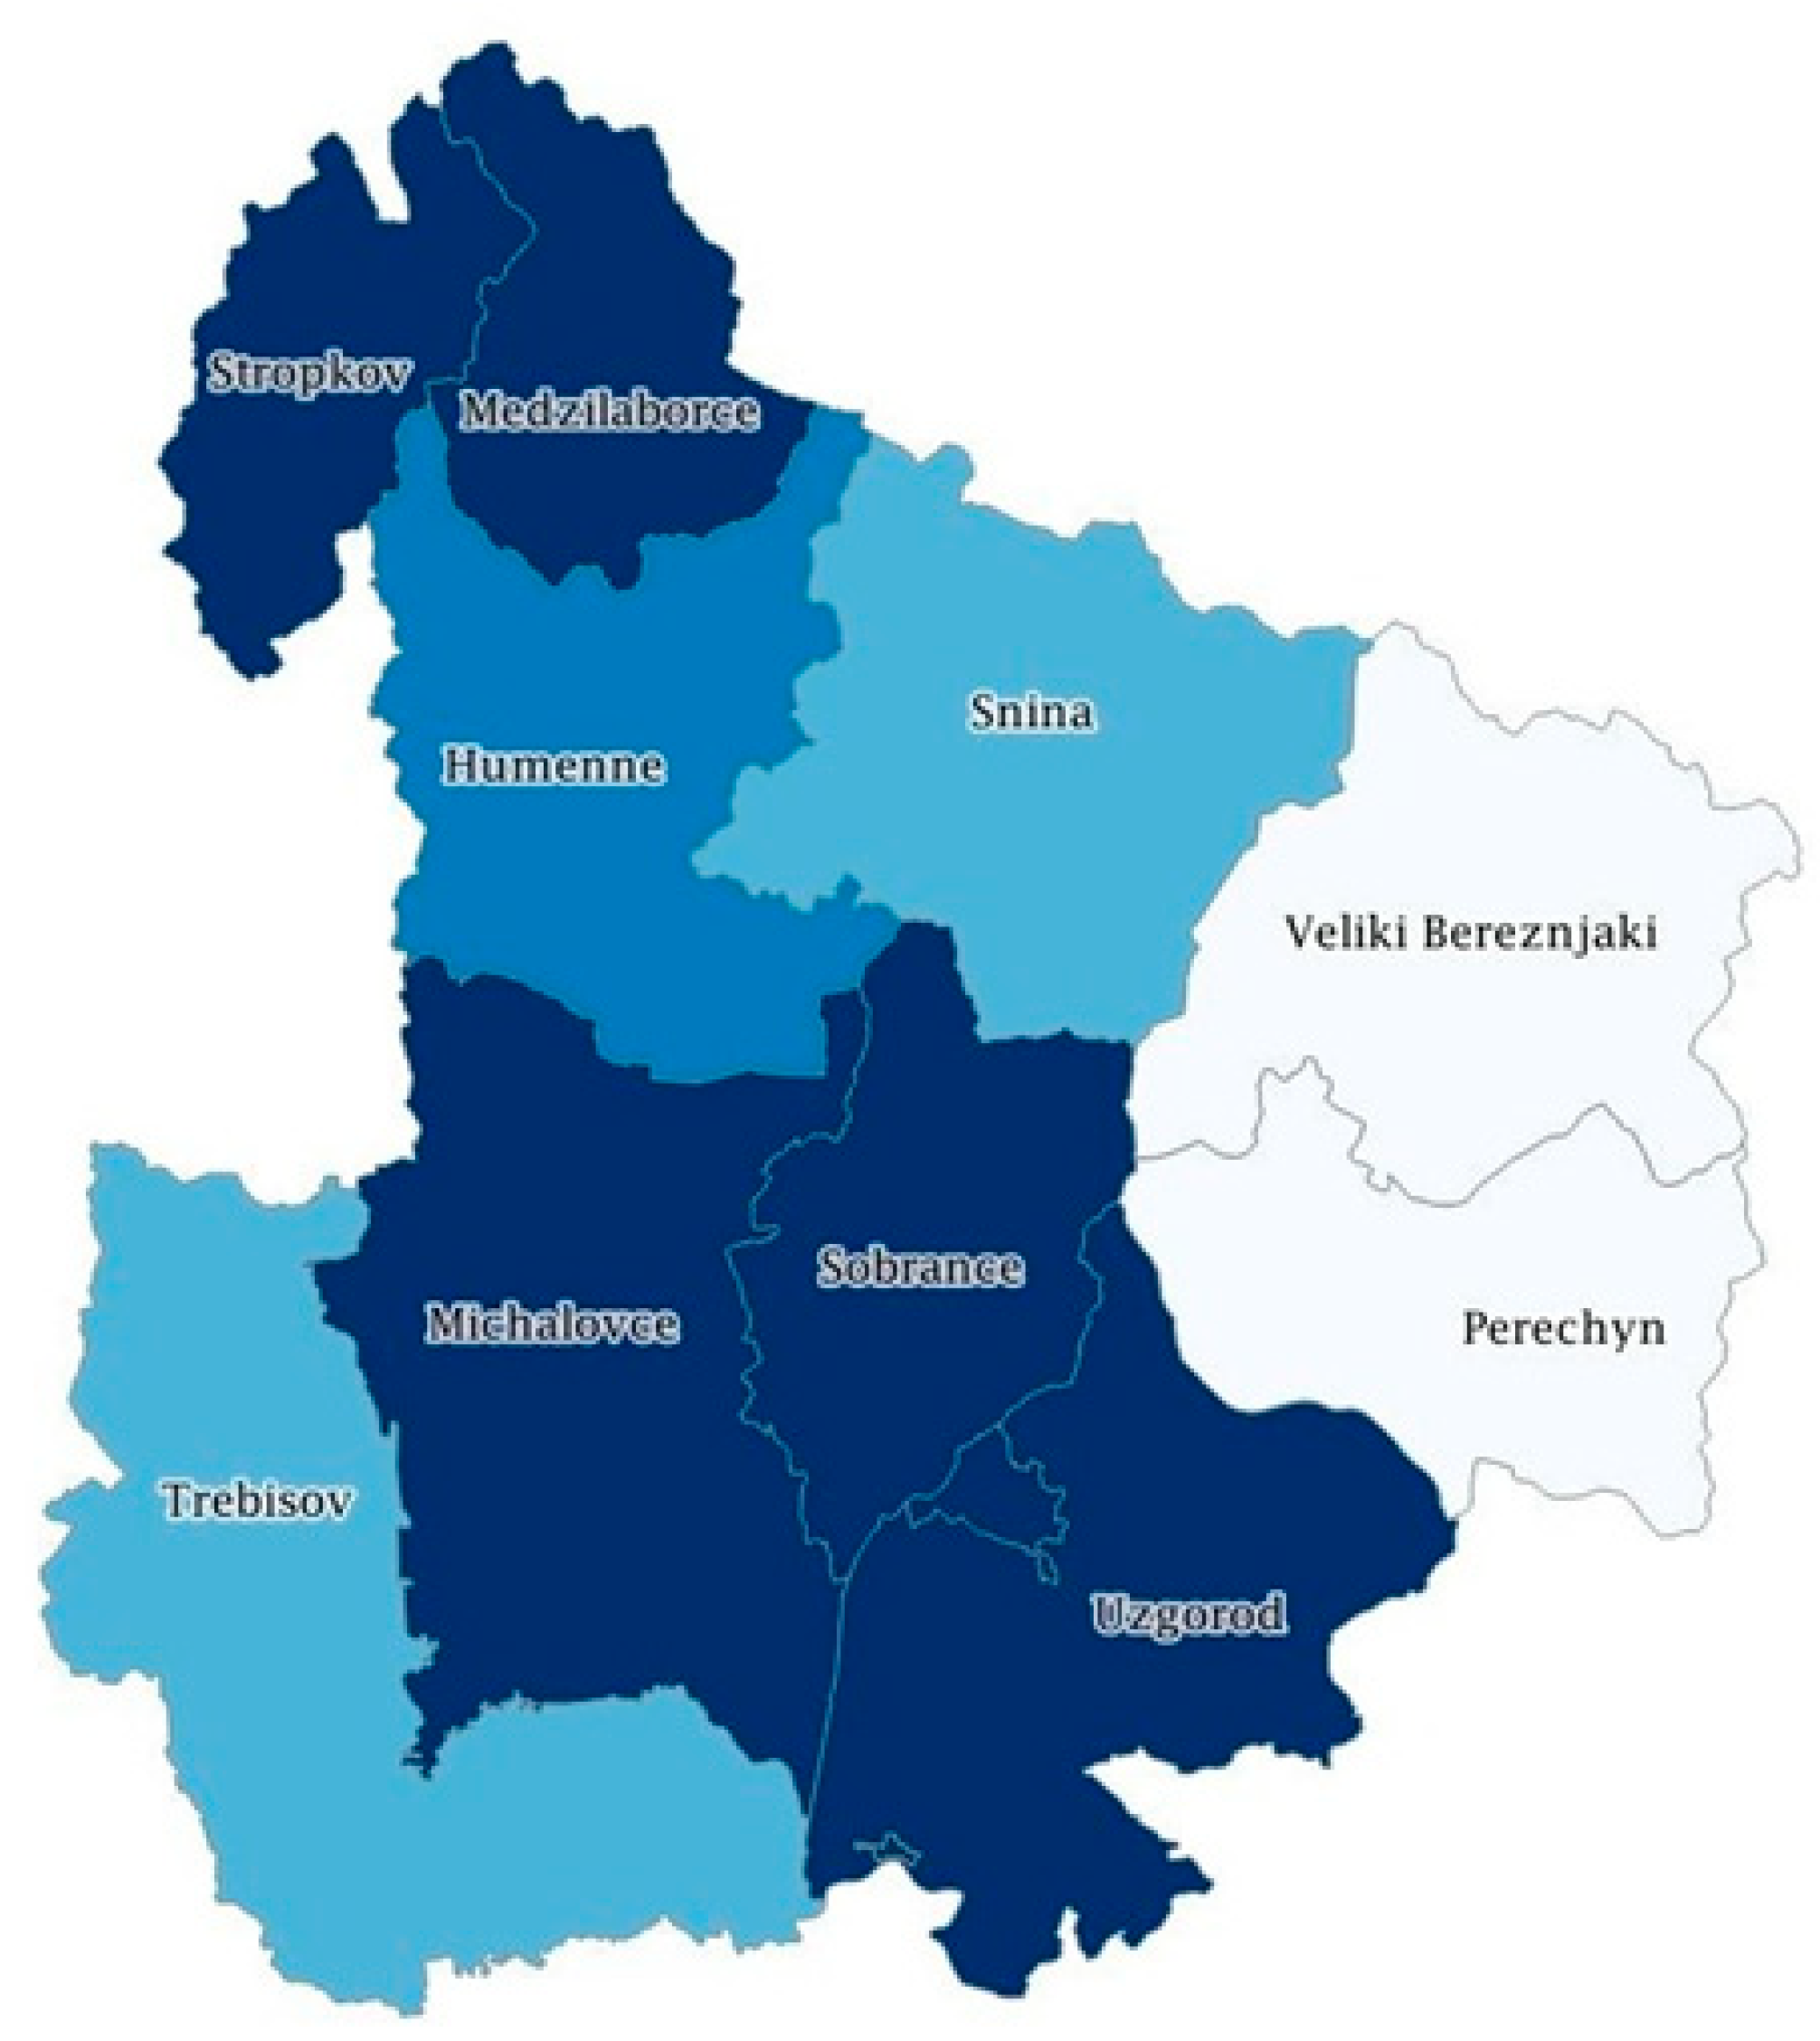
(1) Entrepreneurial capacity summarises the structure of an industry in each district and the degree of specialisation or diversification of the economy. Although suitable specialisation in progressive export industries increases the capacity for economic growth, a diversified industry structure reduces a district’s vulnerability and increases resilience. Entrepreneurial activity is key to a dynamic response in the event of a crisis. The rate of unemployment, the standard of living and the amount of savings are also critical factors during a crisis. The higher the amount of savings, the higher the flexibility of households in the relation to alternative investments during a crisis.
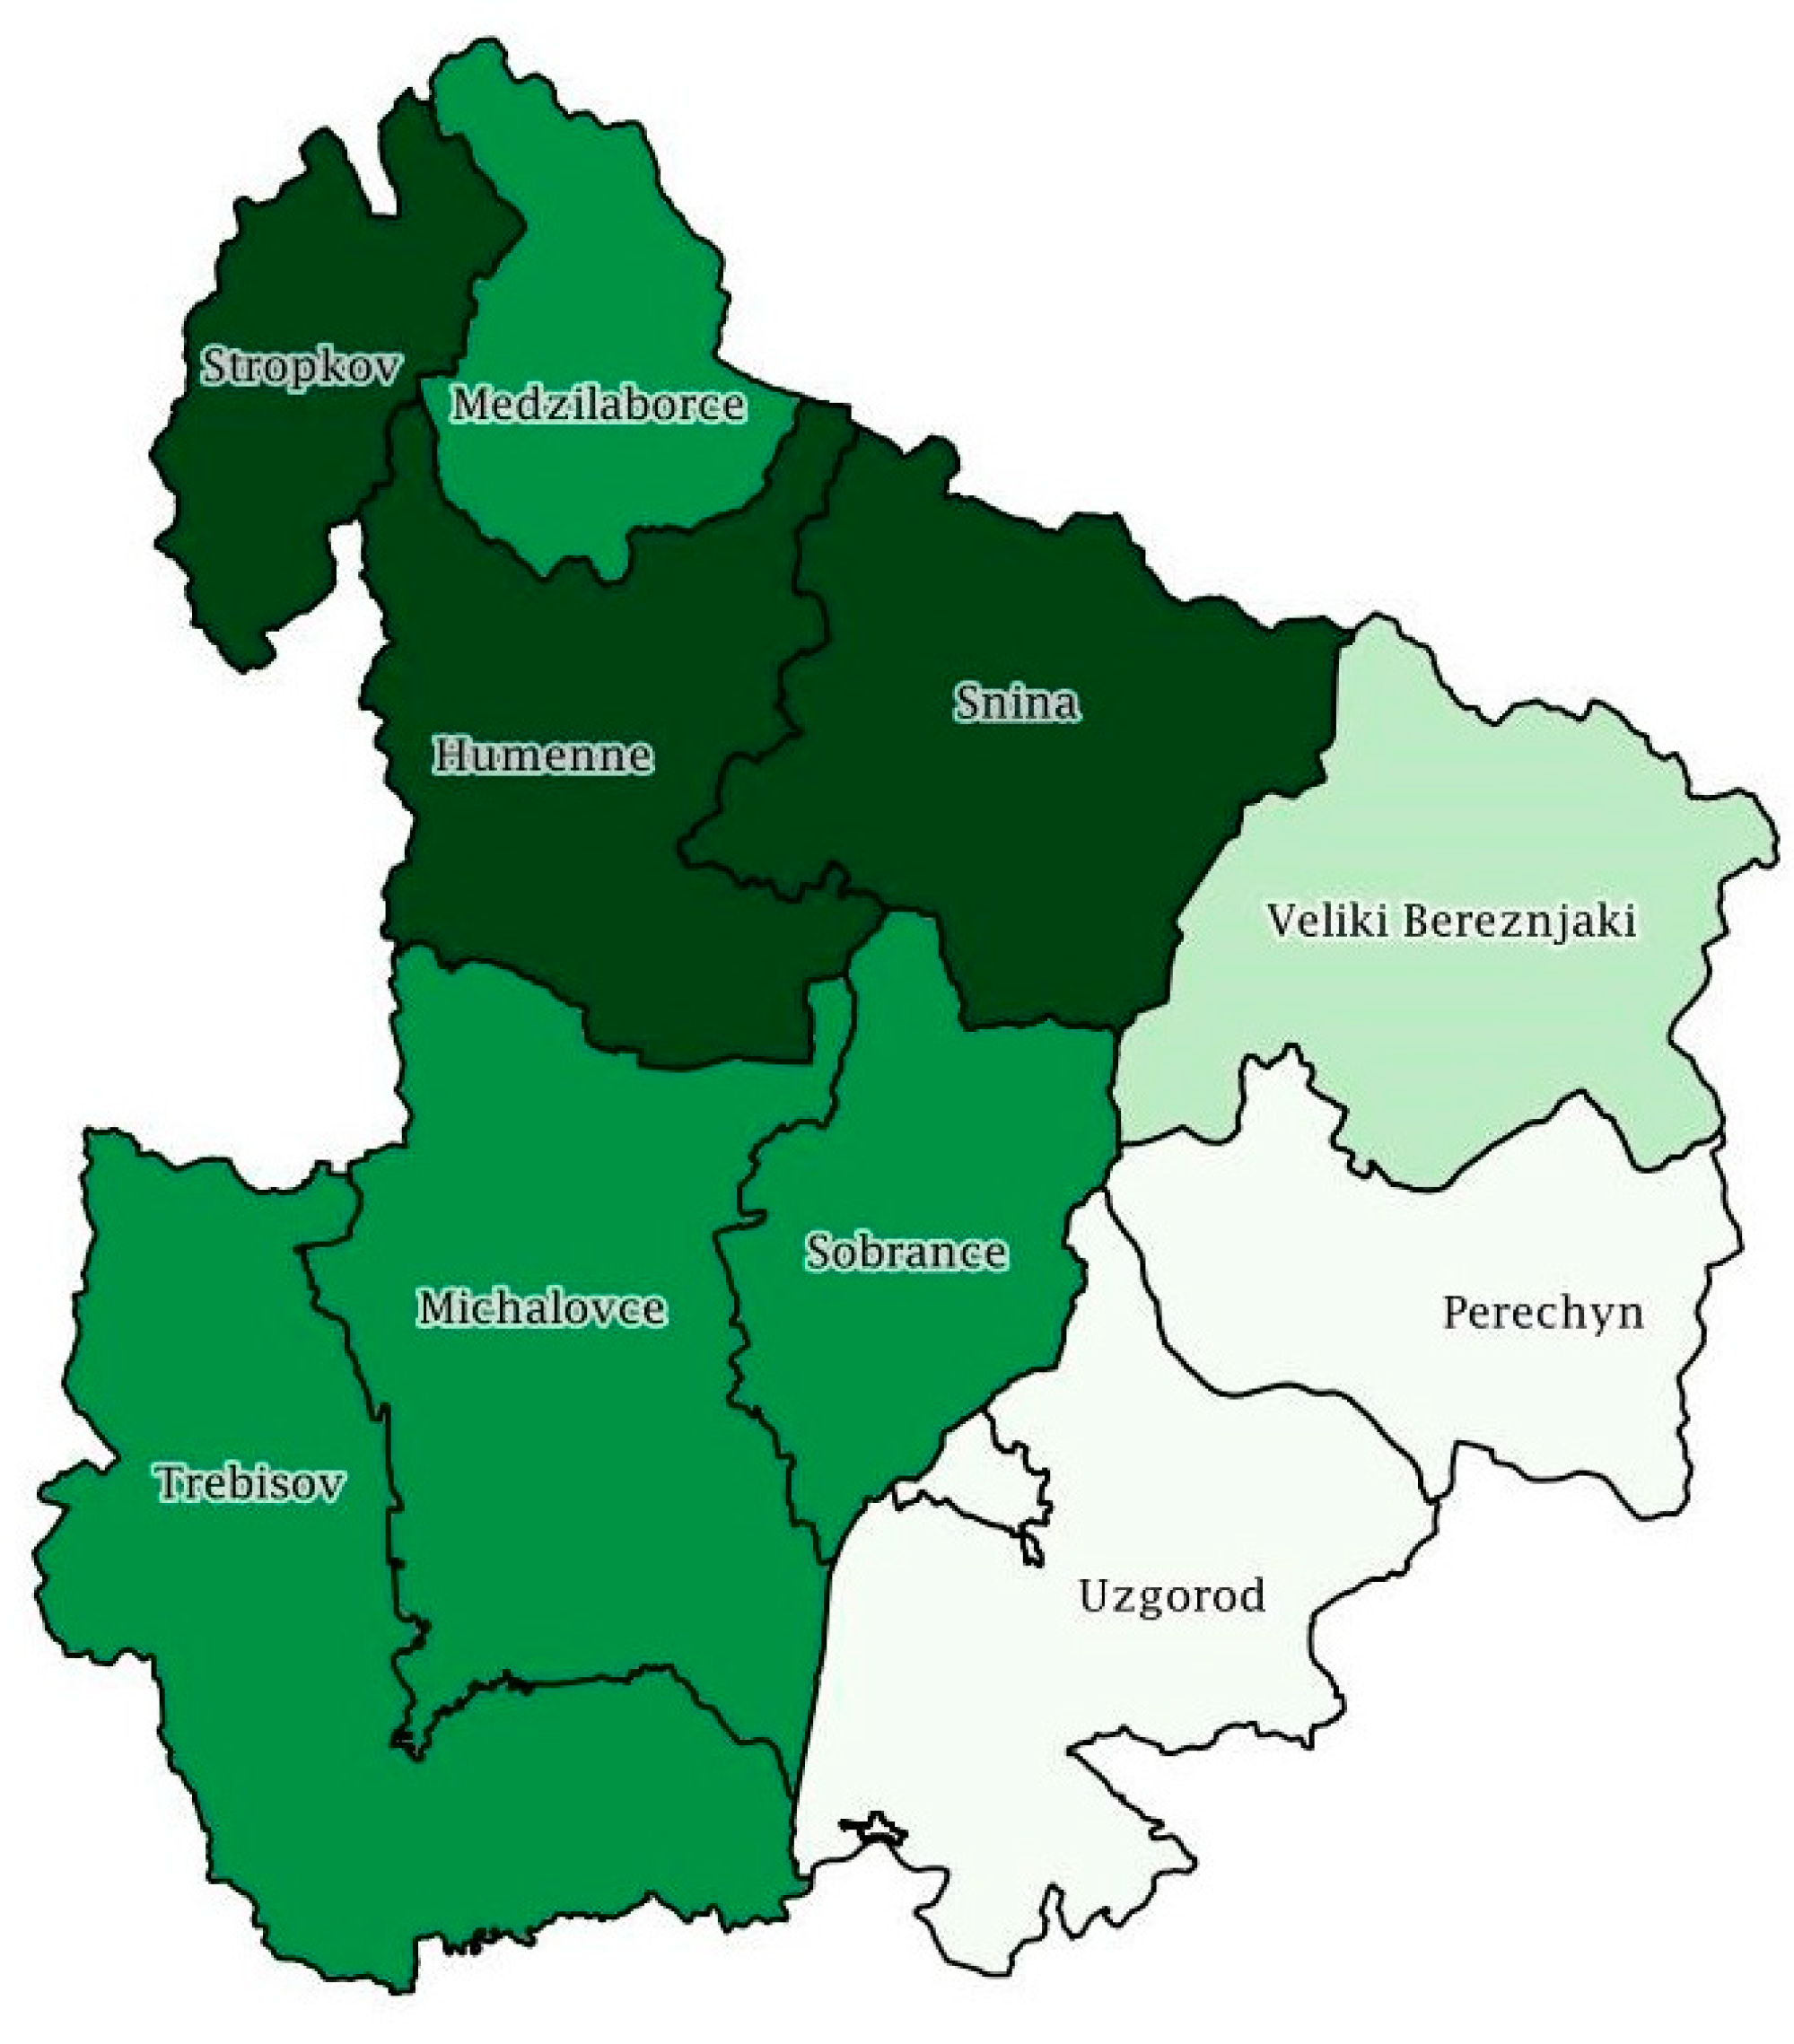
The following map (
Figure 4) shows the values of the entrepreneurial capacity in districts. The lowest values are in the Ukrainian districts of Veľike Bereznije and Perechin, which is due to their rural character and unsuitable economic structure. If the border were to become more open, Michalovce, Sobrance and Uzghorod would create a strong economic core attractive for investment. In the current situation, however, both sides suffer from the low degree of openness of the border to goods, services and implementing business ideas.
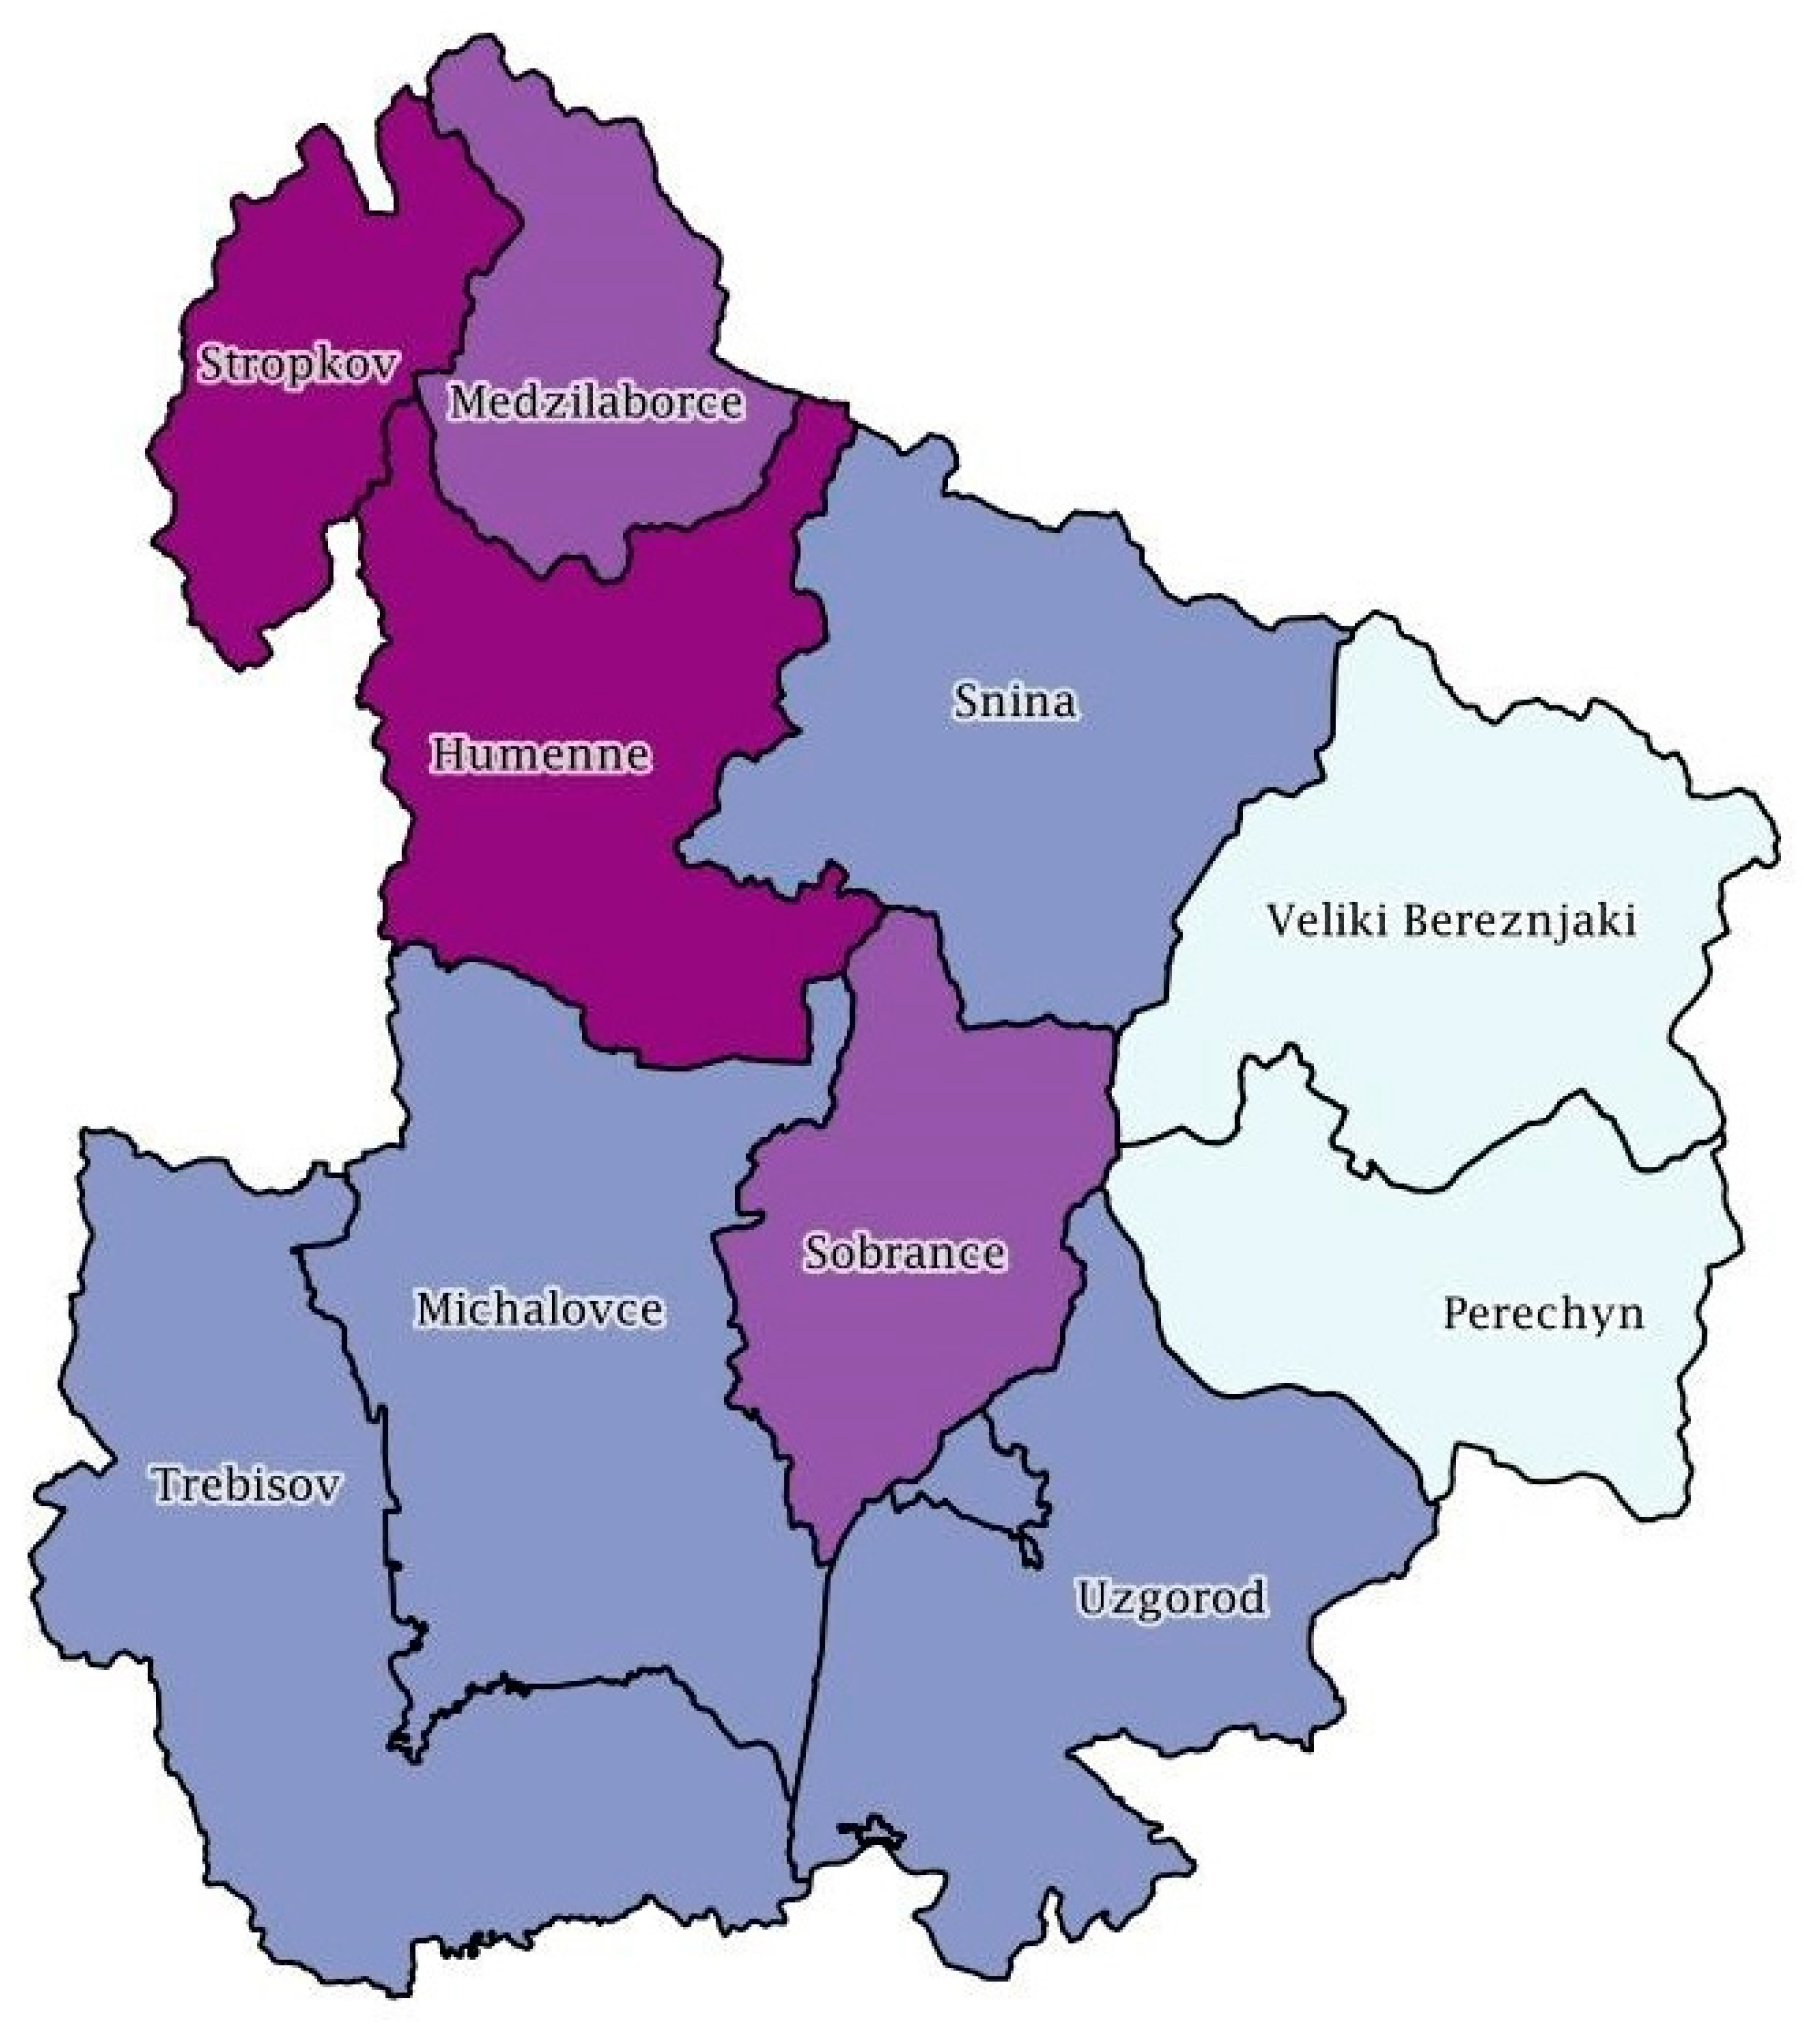
(2) Socio-demographic capacity relies on data on population ageing in a district and the health of its population because these factors influence the ability and the possibility to respond to external shocks. The following map (
Figure 5) shows the second type of resilience capacity, i.e., the socio-demographic capacity. A darker colour indicates worse socio-demographic capacity and vice versa.
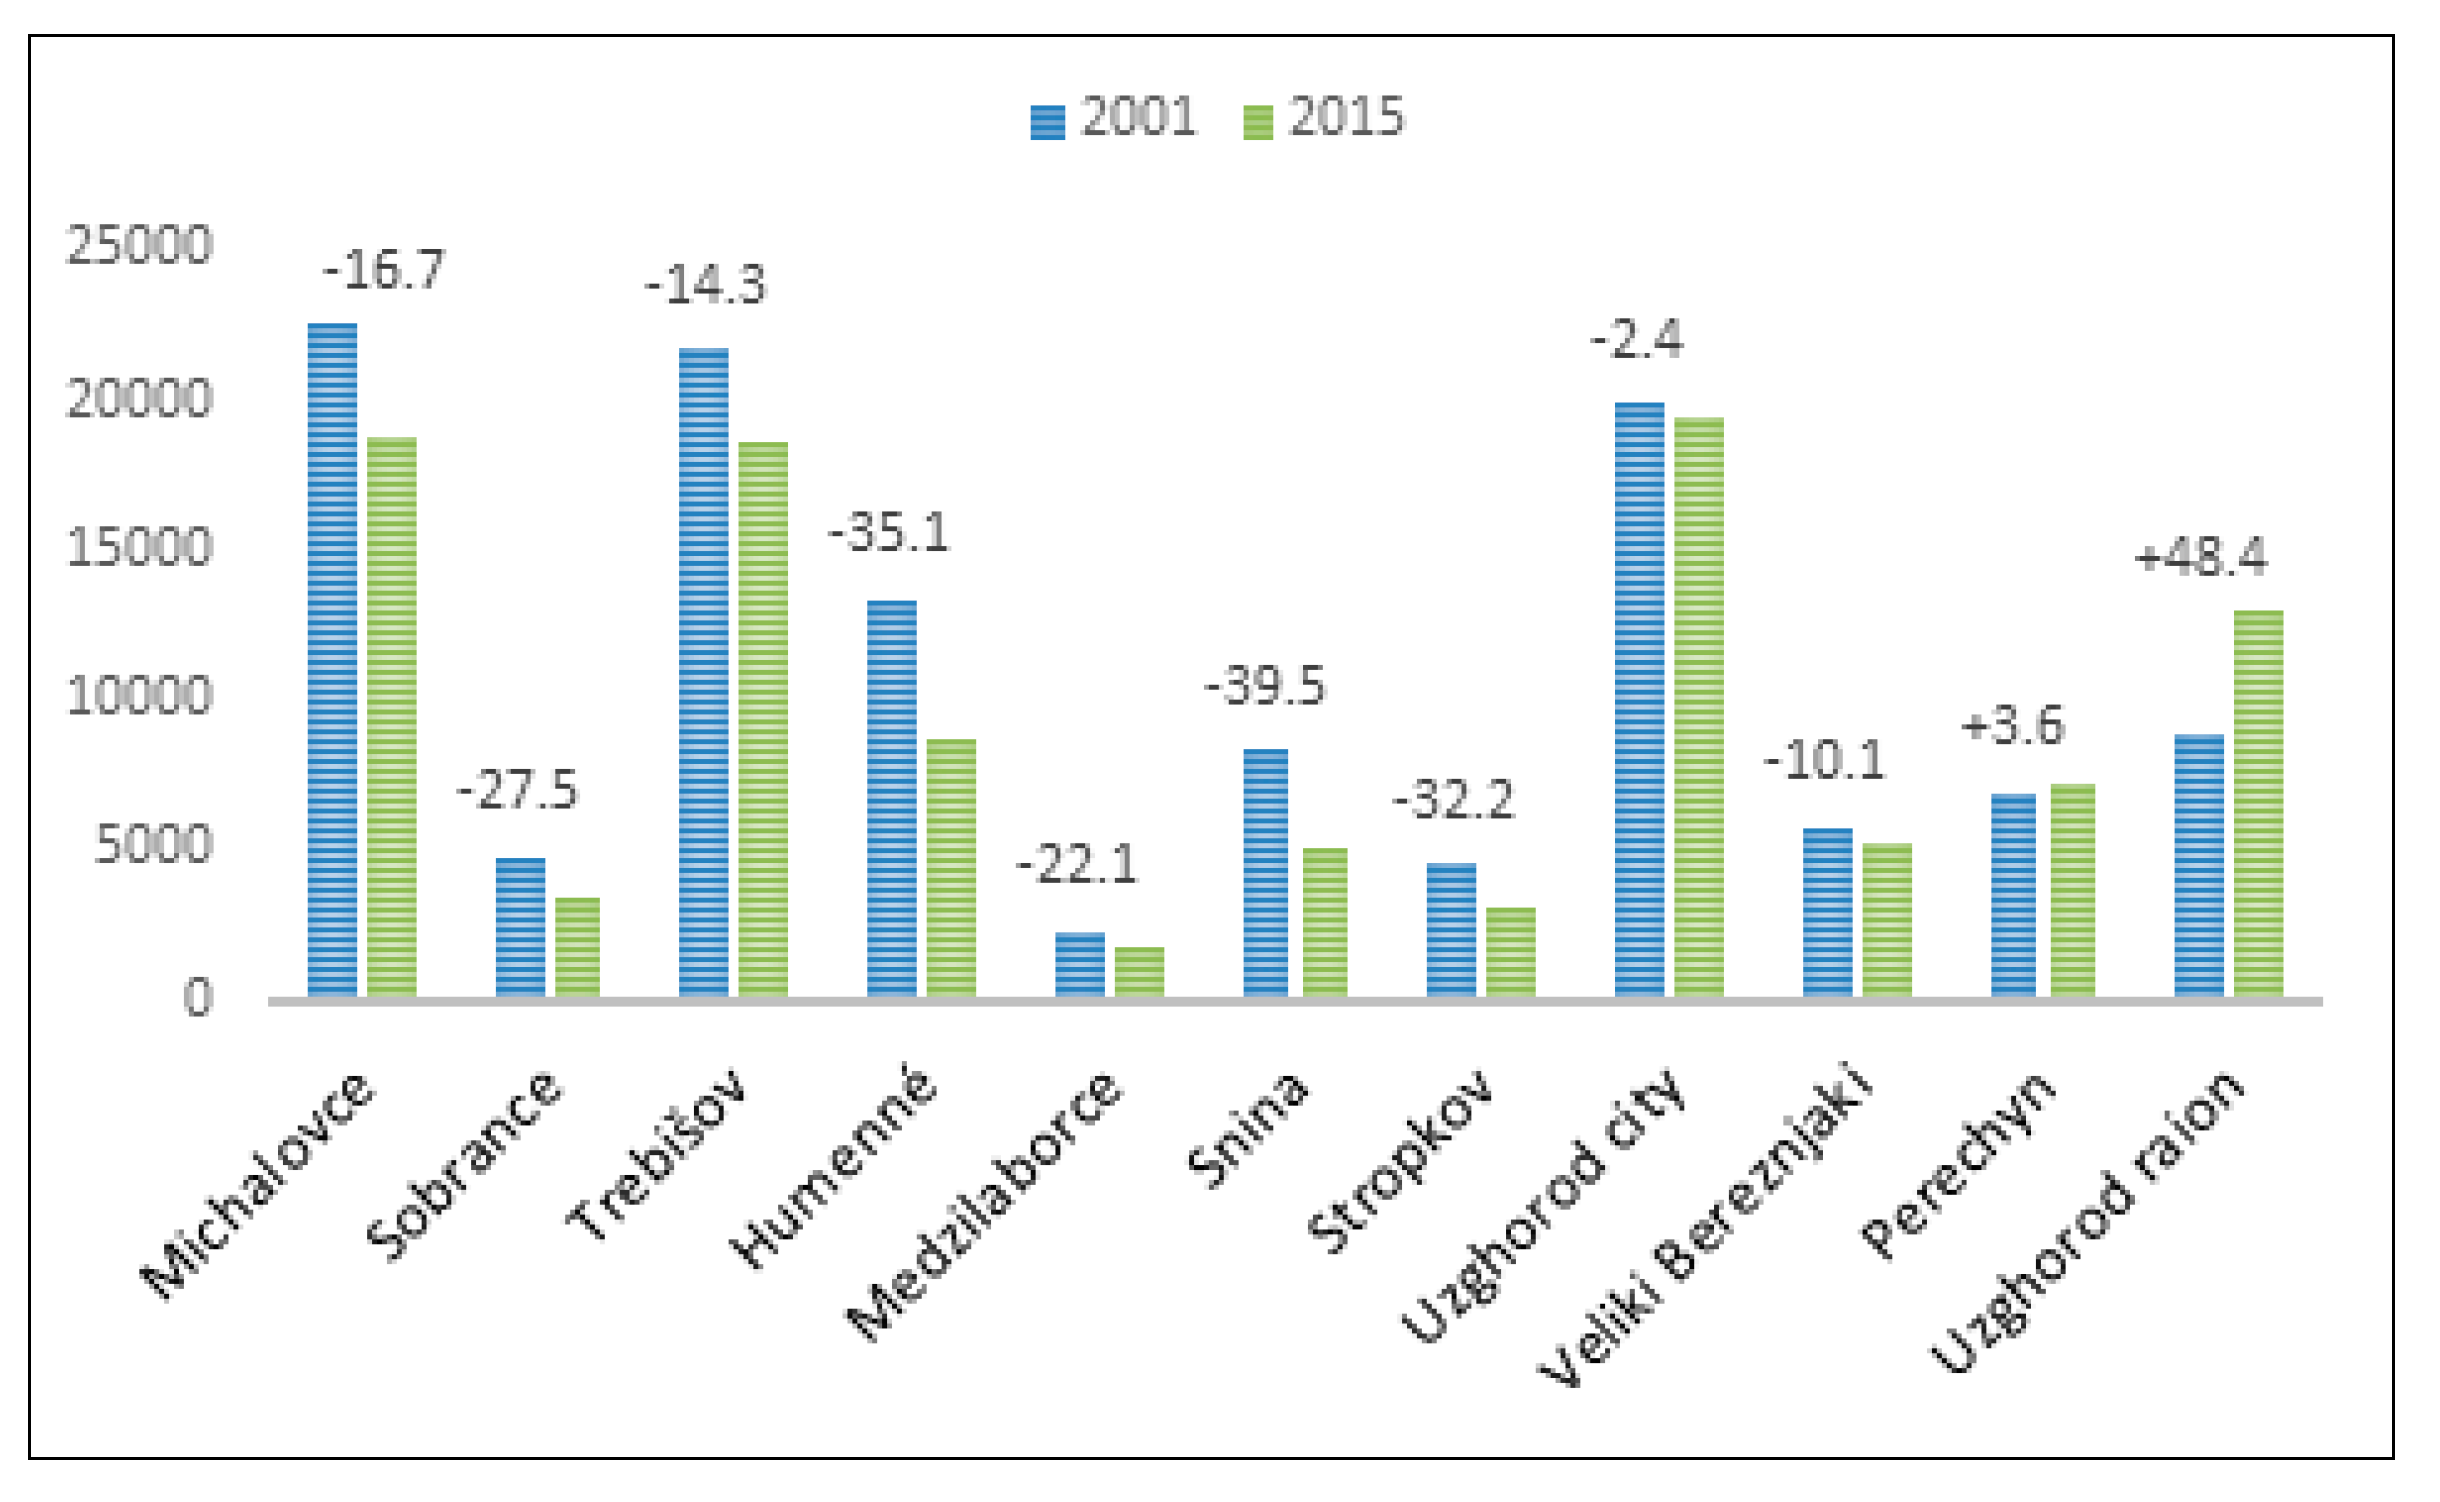
The socio-demographic capacity is higher in the Ukrainian districts, which have a younger population and a better health condition of the population. The ageing population in the Slovak districts is a secondary effect associated with the mass emigration of qualified young people to more developed districts of Slovakia and abroad. The ageing population represents a key factor in social risks and reduced resilience. In the 2001–2015 period (
Figure 6), there was a significant reduction in the number of children (aged 0–14) from the Slovak districts (Snina −39.5%; as much as −35.1% in Humenné). Migration for work in the case of Ukraine did not result in the same reduction in the number of children due to its higher fertility rate.
A similar difference between the Slovak and Ukrainian districts exists in the category of the post-productive age of over 65 (
Figure 7). In the 2001-2015 period, the Slovak districts saw a sharp increase in the number of older people (Humenné +34.6%; Stropkov +22%).
(3) Resilience capacity in terms of the interconnectedness of communities takes into account the number of non-governmental organisations per inhabitant in a district, information about the number of inhabitants who are permanently resident in a given location for at least three years and the percentage of inhabitants who vote in elections. The functional interconnectedness of communities and the willingness of people to help each other during various crises are a necessary condition of a given area’s resilience to external threats. The following map (
Figure 8) shows the results of the values of the third type of resilience capacity, i.e., interconnectedness of communities.
The low values for the districts of Michalovce, Snina, and Trebišov are due to low election turnouts in the districts. The problem in the district of Snina is weakened stability of settlement of residents, as only a relatively low percentage of them stay to live in the district for a long period of time, which is due to population migration. Although the residents in the Ukrainian districts stay to live in their districts for a long period of time and their election turnout is mostly high, there is; however, a lack of community life in the districts and there are few non-governmental organisations and a low degree of organised cooperation and mutual help there.
Combining the three types of resilience capacity (entrepreneurial, socio-demographic and interconnectedness of communities) provides the overall resilience capacity of districts (
Figure 9). It is high unemployment and the migration of a qualified and young workforce that present the main barrier to the resilience and development of districts. The villages in the Slovakia-Ukraine border region have an unsuitable location for business due to low accessibility, territorial fragmentation and the barrier of the border. The situation on the Ukrainian side of the Slovakia-Ukraine border is characterised by the sparse population, especially in the districts of Velykyi Bereznyi and Perechyn, and by the long distances between villages. These factors hinder mutual cooperation of villages within countries and even more so between cross-border regions. The situation is more positive only in the city district of Uzhgorod, being the most urban part of the border region.
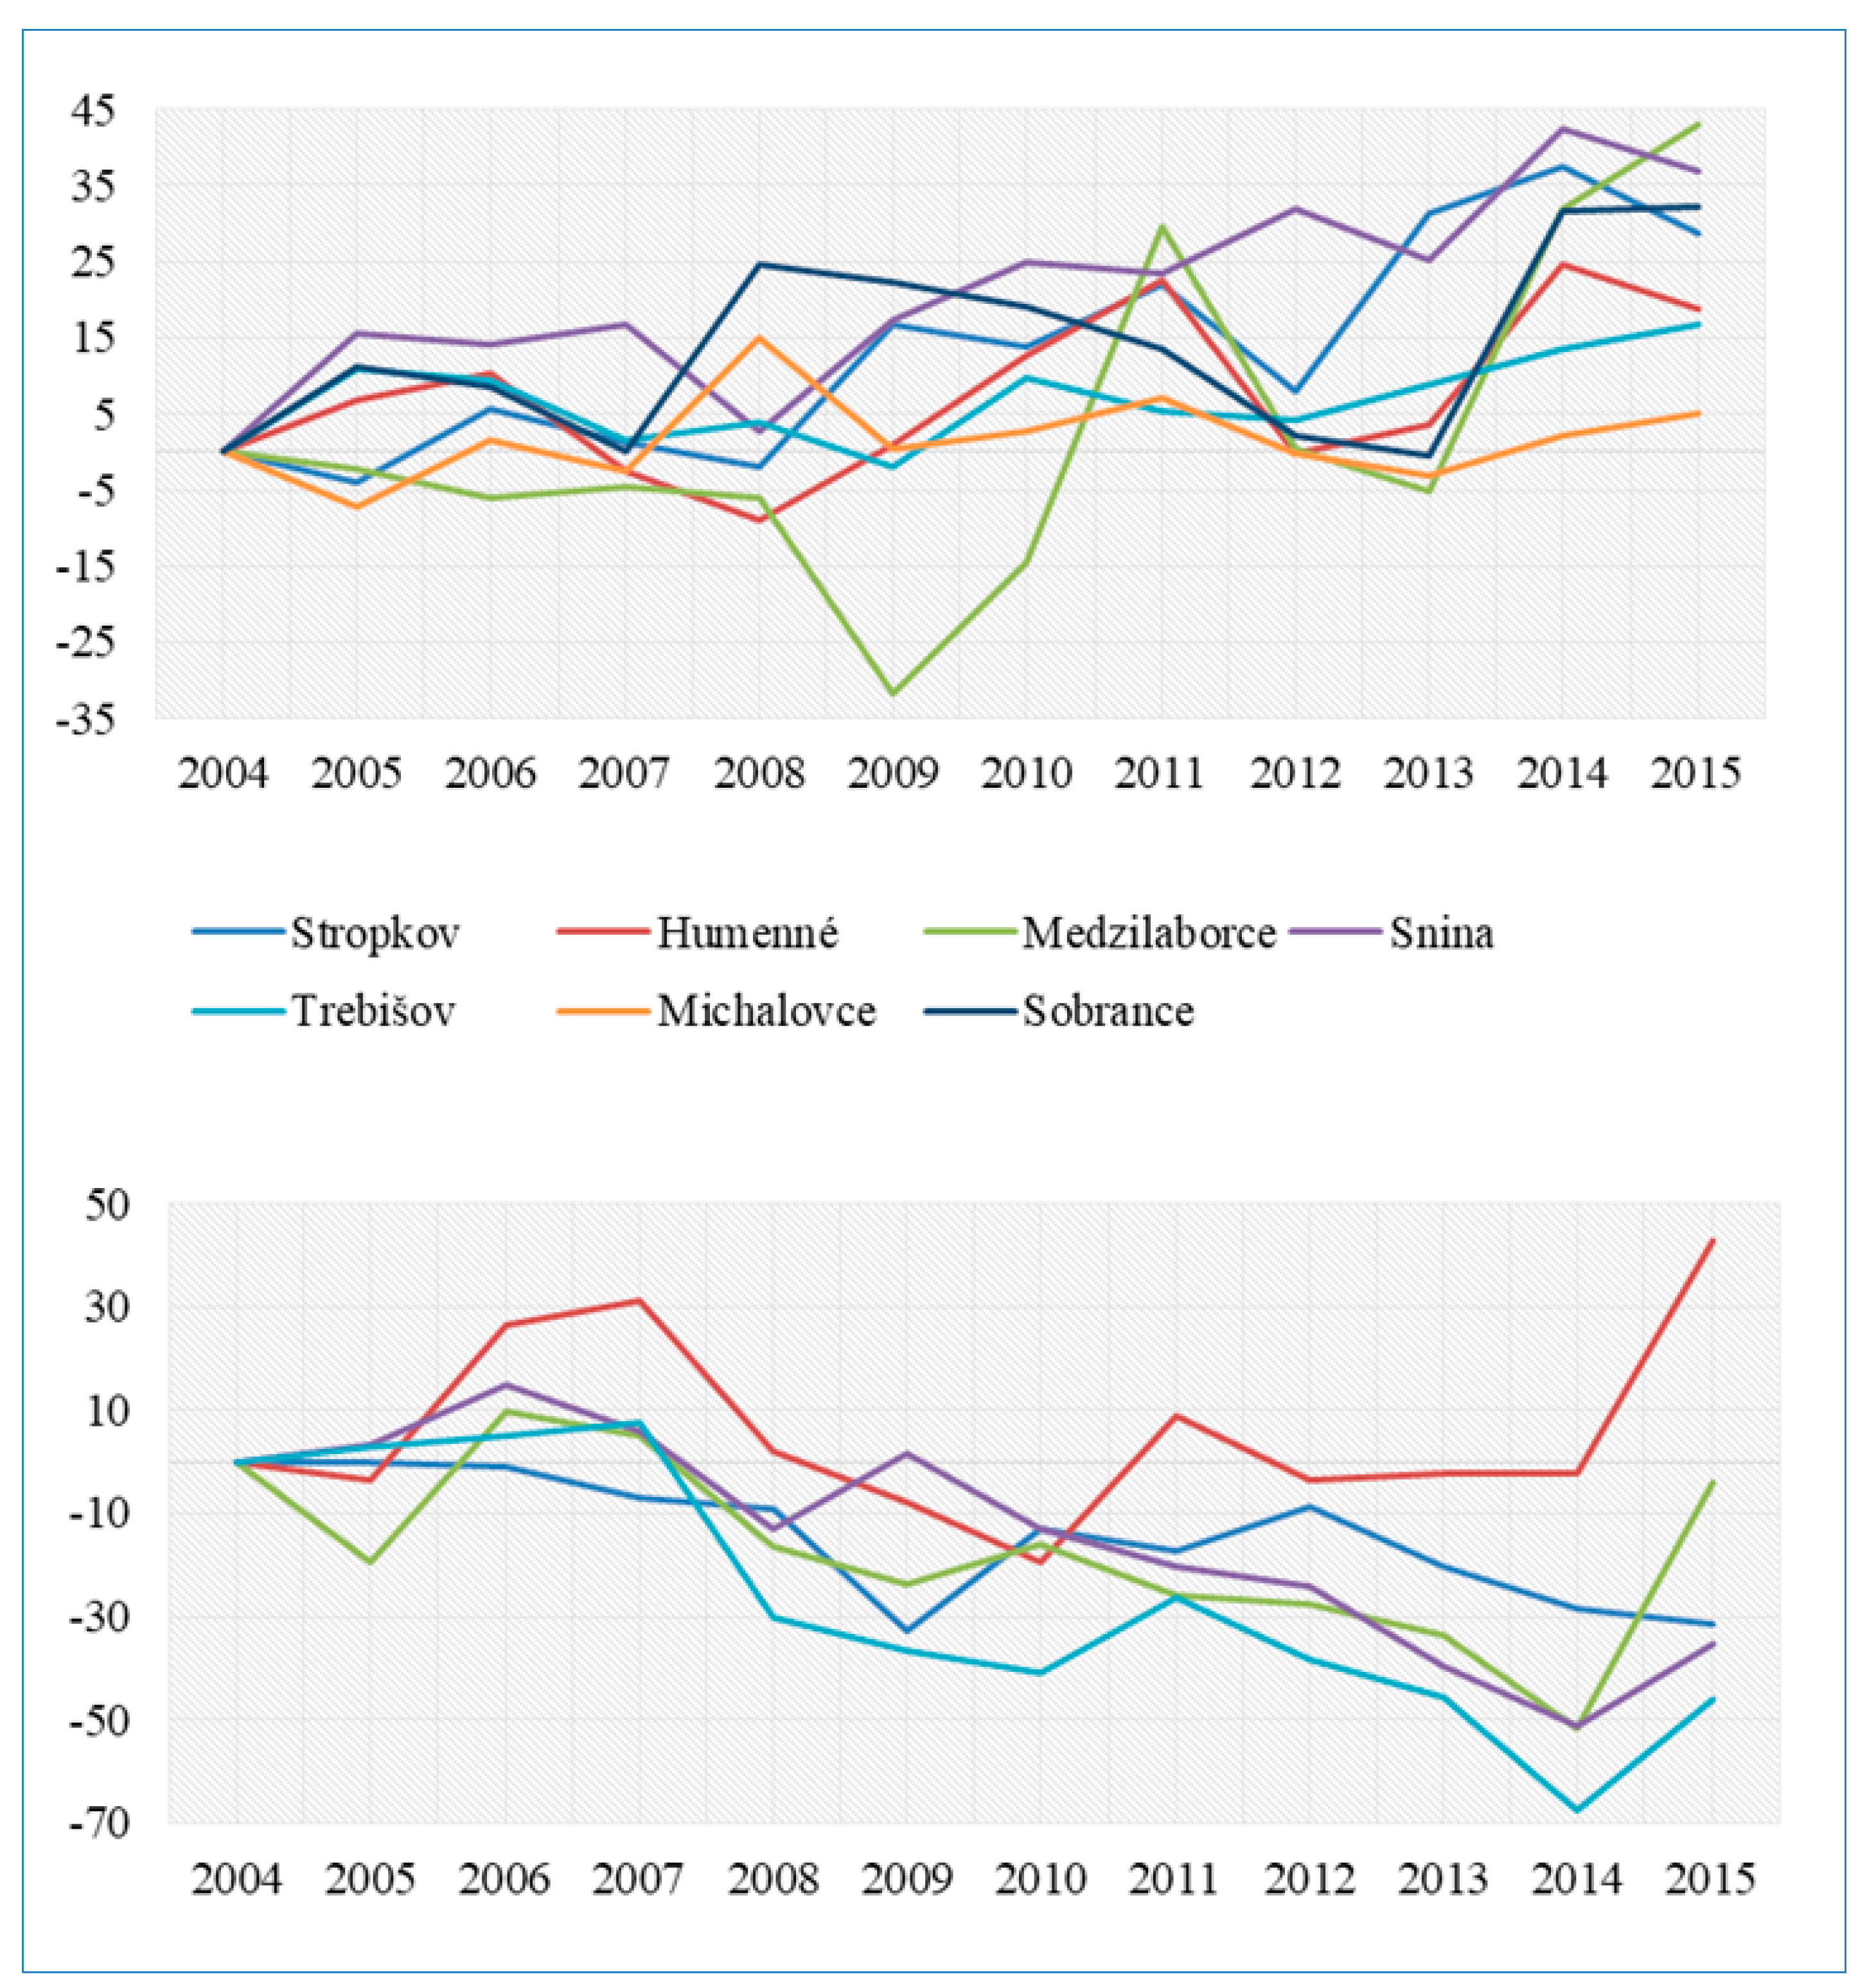
The problem of depopulation in the Slovakia-Ukraine border region is associated mainly with the emigration of the qualified workforce for better work and better pay and living conditions. Because the population decline is one of the biggest factors of decreasing adaptive resilience, a few additional explanations follow. The graphs (
Figure 10) show the 12-year history of emigration from the districts included in the project between 2004 and 2015. 2004 was chosen because since then separate statistical records have been maintained for the town of Chop, rather than as part of the Uzhgorod district, since that year. Each of the districts shows bigger or smaller variations in the number of emigrants in time, such as the sharp increase in the number of emigrants from Humenné in 2011, or the districts of Michalovce and Sobrance in 2008. The 2007–2011 crisis caused an outflow of population from the border districts of Slovakia. The reverse is true of Ukraine, where the number of emigrants decreased except for Chop. An increase in emigration only occurred in 2014.
The additional primary survey enabled us to create an overview of the target countries that are most frequently chosen as destinations for people leaving the whole monitored border regions for work. Altogether different situations can be seen on the Slovak and Ukrainian sides. While the United Kingdom, the Czech Republic, Austria and Germany are major destination countries in Slovakia, residents from the Ukrainian districts move for better work to the Russian Federation, Slovakia, the Czech Republic, Hungary and Poland. In this, behaviour is completely different on the two sides of the border.
5. Discussion
Resilience involves the ability of a region/town to withstand various external shocks (both sudden fluctuations and slow adverse processes). Local resilience can be seen as an explanation of the essence of why specific territorial units respond more flexibly to threatened economic, social, political or ecological changes, while others experience long-term deterioration of prior development and a weak ability to recover from a crisis and initiate positive changes.
Resilience capacity index customisation: Resilience measurement models should be able to evaluate the adaptive resilience capacity to deal with future sudden external shocks. However, estimating the future response of regions to shocks is relatively challenging. In any case, the inherent characteristics can be estimated and evaluated as the adaptive resilience capacity or predisposition. The actual reaction in the case of meeting an unexpected disaster is, however, the result of predisposition and capacity, combined with the influence of many unpredictable factors. Resilience capacity, as defined by K. Foster and operationalised as the Resilience Capacity Index has become one of the conventional and respected approaches. In this paper, the idea of RCI is shifted further as resilience adaptive capacity based on the created adaptivity diagram and subsequently developed modified domains and indicators. Given that any two communities rarely feature the same conditions, customisation to specific needs and priorities is appropriate [
37]. Border and peripheral regions often face low accessibility, job shortages, skilled labour outflows and inadequate connections to major transport routes. Therefore, the RRI index proposed in this paper is derived from the RCI and adjusted to highlight the weakened resilience capacity due to a low entrepreneurship rate and ageing populations based on the out-migration of the skilled population.
Separative effect of the border and wakened resilience capacity: The paper provides a new perspective on regional resilience capacity in the border regions, revealing the differences caused by the separative Schengen border between the two countries. The rural border regions suffer from low entrepreneurship and investment, population decline and ageing, and become secondary even more vulnerable and less resilient. The effect of the Schengen boundary has caused the separation of entrepreneurial environments, and failed to allow the interconnection and development of cross-border business activities and knowledge spillovers. The concentration of entrepreneurial capacity in the cross-border divided agglomeration of Michalovce, Sobrance and Uzhgorod has been shown, but due to its division, the potentially strong economic core is not investment-attractive for local or foreign investors. Although the variables and methodology for collecting statistical data in both countries are slightly different, the detailed analysis has allowed the comparison of different undernourished data sets. The aspect of data also represents a limitation of the analysis. However, the methodological result of adjusting the index focusing substantially on entrepreneurship and ageing has proven important for the evaluation of resilience capacity.
The border acts as a separative barrier and weakens the possibilities of linking innovation and economic development in a broader entrepreneurial environment. At the same time, it keeps border regions in peripheral captivity and worsens the quality of human capital. These factors cause a significant weakening of resilience capacity.
Increase of diversity and resilience capacity: In comparison to border effect on resilience capacity, a border does not limit the spread of the adverse effects of an external shock. It is, therefore, inevitable to develop effective cross-border communication and cooperation, and the resilience of border municipalities to future potential threats can be increased following the resilience capacity analysis. The RRI index and its variables can serve as a stepping stone to create an adaptive resilience strategy. Support of structural diversity is needed, whether with respect to the economic, ecological or cultural aspect [
38]. The more diverse the individual local and regional systems become, the more resilient they will be. If one part of a system is affected, the municipality still has various segments which can compensate for losses and which can take over activities as a backup resource. For example, if the agricultural production sector is dominant in a region and a destructive external shock hits it, it has minimal possibilities to overcome the situation if there are no other industries that would support the regional economy during a crisis. Diversified industry structure is advantageous in cases of natural disasters or economic decline. If one industry is hit, it enables economic losses to be compensated by strengthening other industries that were not hit directly, until measures for the recovery of the affected branch of agriculture become effective.
Promoting diversity should be applied in the same way to energy resources, entrepreneurial activities, human resources, transport links, water resources and food. Redundancy is an essential characteristic of resilient systems, as it has a larger number of different backup resources than necessary, which increases stability and resilience to breakdowns. If one resource or system is under threat, redundancy in the overall system enables another resource to be used until the damaged resource or economic system can be repaired. Besides having their capacities for increasing diversity and redundancy, it is crucial to create microregional and transregional partnerships—joint construction of backup resources and the creation of industrial clusters. Border territories need indeed form innovative cross-border clusters [
39,
40] integrating municipalities from both countries. A single municipality is not sufficiently equipped with many resources, but the integration of resources and activities increases competitiveness and resilience.
Modularity and independence of system components is an equally important aspect of diversity. Damage or failure of one part, such as an energy or water resource, key employers or economic activities should be set up so as to minimise the likelihood of a failure in one part causing the failure of other related segments of the whole system.
Prediction system: Prediction and evaluation of risks associated with strategic and territorial planning is a necessary approach concerning extraordinary events and minimisation of consequences. Establishing an integrated system of risk evaluation for all areas of human life can be regarded as a strategic objective for the future.


