Article

Application of Machine Learning in Predicting Performance for Computer Engineering Students: A Case Study

by
Diego Buenaño-Fernández
1,*,
David Gil
2 and
Sergio Luján-Mora
3
1
Facultad de Ingeniería y Ciencias Aplicadas, Universidad de Las Américas, Av. de los Granados E12-41 y Colimes, Quito EC170125, Ecuador
2
Departamento de Tecnología Informática y Computación, Universidad de Alicante, San Vicente del Raspeig, 03690 Alicante, Spain
3
Departamento de Lenguajes y Sistemas Informáticos, Universidad de Alicante, San Vicente del Raspeig, 03690 Alicante, Spain
*
Author to whom correspondence should be addressed.
Sustainability 2019, 11(10), 2833; https://doi.org/10.3390/su11102833
Submission received: 7 April 2019 / Revised: 2 May 2019 / Accepted: 14 May 2019 / Published: 17 May 2019
(This article belongs to the Special Issue Big Data Research for Social Sciences and Social Impact)

Abstract

:
The present work proposes the application of machine learning techniques to predict the final grades (FGs) of students based on their historical performance of grades. The proposal was applied to the historical academic information available for students enrolled in the computer engineering degree at an Ecuadorian university. One of the aims of the university’s strategic plan is the development of a quality education that is intimately linked with sustainable development goals (SDGs). The application of technology in teaching–learning processes (Technology-enhanced learning) must become a key element to achieve the objective of academic quality and, as a consequence, enhance or benefit the common good. Today, both virtual and face-to-face educational models promote the application of information and communication technologies (ICT) in both teaching–learning processes and academic management processes. This implementation has generated an overload of data that needs to be processed properly in order to transform it into valuable information useful for all those involved in the field of education. Predicting a student’s performance from their historical grades is one of the most popular applications of educational data mining and, therefore, it has become a valuable source of information that has been used for different purposes. Nevertheless, several studies related to the prediction of academic grades have been developed exclusively for the benefit of teachers and educational administrators. Little or nothing has been done to show the results of the prediction of the grades to the students. Consequently, there is very little research related to solutions that help students make decisions based on their own historical grades. This paper proposes a methodology in which the process of data collection and pre-processing is initially carried out, and then in a second stage, the grouping of students with similar patterns of academic performance was carried out. In the next phase, based on the identified patterns, the most appropriate supervised learning algorithm was selected, and then the experimental process was carried out. Finally, the results were presented and analyzed. The results showed the effectiveness of machine learning techniques to predict the performance of students.

1. Introduction

Quality education is one of the Sustainable Development Goals (SDGs) approved by the United Nations forum in 2015 [1] and is a fundamental challenge to support sustainable development worldwide. A key element that must be taken into account when talking about sustainable development is the principle of equal opportunities. In the educational field, this principle consists of guaranteeing every person the same possibilities in terms of access and completion of studies [2]. Student desertion in higher education is a critical issue that requires a global analysis. The dropout rates of university students generate a waste of resources for all actors in the education sector and even affect the evaluation processes of the institutions. In fact, the dropout rate is higher among engineering students [3]. In the present study, it is proposed to carry out predictive analysis of the final grades (FGs) of computer engineering students that will support the processes of academic quality and thus mitigate the student dropout rate. Efforts to transform our societies must prioritize education. Teachers and educational administrators must develop their understanding of sustainability and their ability to improve the curriculum and implement systems that allow for expanded learning opportunities [4].
In this sense, higher education institutions need to work on the development of educational models that emphasize the use of information and communication technologies (ICT), which could function as support tools for equal opportunities and social responsibility.
From this perspective, the application of ICT in educational environments is imperative because it can contribute significantly to the improvement of the teaching and learning process, as well as encourage the process of knowledge construction [5]. The application of technology in teaching-learning processes is known as Technology-enhanced learning (TEL). This term is used to describe the use of digital technology aimed at improving the teaching-learning experience. TEL has become relevant due to the emergence of a huge number of technological resources that help the development of critical thinking in students [6]. TEL incorporates many emerging technologies, including learning management systems (LMS), mobile learning applications, virtual and augmented reality interventions, cloud learning services, social networking applications for learning, video learning, robotics, data mining, and so forth [7].
According to the results of a study about the sustainability of higher education and the TEL [6], we must be very cautious when defining the necessary conditions for technology to serve as a benefit and not as an obstacle to teaching and learning. For instance, training teachers and educational administrators to develop predictive analytical competence is vital for measuring the potential results of the use of technology [8].
All the technologies mentioned above, which are being applied with ever greater impact on the educational field, generate and store a vast amount of data that is ubiquitously available [9]. This amount of data has exceeded the capacity for processing and analysis through conventional means. To fulfill the task of data analysis, it is necessary to work with new specific technologies, such as big data, intelligent data, data mining, and text mining, among others. The convergence of these technologies with educational systems will allow the analysis of these data and transform it into useful information for all stakeholders [10].
Educational data mining (EDM) and learning analytics are emerging disciplines that guide the process of analyzing educational data. This analysis is done through a variety of statistical methods, techniques, and tools, including machine learning and data mining. The objective of learning analytics is to provide an analysis of the data that originates in the educational repositories, as well as in the LMS, in order to understand and optimize the learning process and the environments in which it occurs [11].
There are several studies [9,11,12,13,14] that have proposed different classifications related to the use of data mining in educational environments. Among the most representative classifications are the following: Analysis and Visualization of Data; Providing Feedback for Supporting Instructors; Recommendations for Students; Predicting Student’s Performance; Student Modeling; and Social Network Analysis. In the present work, we focused on the Predicting Student’s Performance, one of the most popular EDM applications. The objective of the prediction is to estimate an unknown value of a variable from historical data related to it. In the present work, this variable is related to the grades and performance of students. That is, the estimation or prediction of student grades proposed is based on multiple historical academic characteristics that describe the student’s behavior [15].
Based on these principles, the main objective of this work was to predict the grades of the students according to several characteristics of their academic performance. This was done by establishing dashboards to track the students individually, by subject, by area, etc. The expected consequence of this tracking is to decrease the dropout rate, as well as provide real-time student follow-up to improve the education system. The early identification of vulnerable students who are prone to drop out their courses is essential information for successfully implementing student retention strategies. The term student retention rate refers to the rate of students in a cohort who have not abandoned their studies for any situation. This rate is increasingly important for university administrators, as this directly affects graduation rates [16]. Once these students have been identified, through different prediction techniques, it will be easier to provide them with proper attention to prevent these students from abandoning their studies. Even early warning systems can be planned and designed to support student retention rates [17].
The case study analyzed in the present work will allow evaluating the effectiveness of the proposed method since educational administrators will obtain a validated alternative to replicate it in all the faculties of the university. By scaling the project for all the university’s careers, the total data to be analyzed would be 16,000 students, each with an average of eight subjects and with three PGs (PGs) for each subject. This amount of data, together with the need for immediate visualization, puts us in front of two problems that are referenced when talking about big data issues: “volume” and “velocity” [18]. In other words, we are faced with such a large amount of data that traditional data processing applications cannot capture, process, and—finally—visualize the results in a reasonable amount of time. Big data emerged with the aim of covering the gaps and needs not met by traditional technologies [19]. In higher education, it is fundamental that both teachers and students have updated information, preferably in real time, to make timely decisions and corrective actions. The scaling up in the magnitude of data analyzed will lead in the future towards the design of a big data project.
The document is organized as follows. Section 2 presents the related studies that contribute to the conception of the problem and an evaluation of the techniques and methodologies used. Section 3 describes the materials and the method used. The first phase of the method emphasizes the data collection and the preprocessing process; the second phase presents the selection of the machine learning method; the third phase corresponds to the experimental process and results analysis; in the fourth phase the process of data visualization is described. Finally, Section 4, includes the discussion and conclusions of the contributions presented in this research.

2. Related Work

There is an extensive range of EDM-related work, where many interesting approaches and tools are presented that aim to fulfill the objectives of discovering knowledge, making decisions and providing recommendations. Below, we describe some of them that have served as a source of information for the present work.
In a study concerning the application of big data in the educational field [20], it can be seen that big data techniques can be used in various ways to support learning analytics, such as performance prediction, attrition risk detection, data visualization, intelligent feedback, course recommendation, student skill estimation, behavior detection, and grouping and collaboration of students, among others. In this study, the functionality of predictive analysis is emphasized, which is oriented to the prediction of student behavior, skill and performance.
In a study carried out at the university Northern Taiwan [21], the learning analytics and educational big data approaches were applied with the objective of making an early prediction of the final academic performance of the students in a course of calculation. This study applied principal component regression to predict students’ final academic performance. In this work, variables external to the course, such as video-viewing behaviors, out-of-class practice behaviors, homework and quiz scores, and after-school tutoring, were included.
In a study about the factors that impact on the correctness of software [22], it is concluded that, when working with data mining in educational environments, two types of data analysis are generally used: approaches based on predictive models and approaches based on descriptive models. Predictive approaches generally employ supervised learning functions to estimate unknown values of dependent variables [23]. By contrast, descriptive models often use unsupervised learning functions in order to identify patterns that explain the structure of the extracted data [24].
The methods of collaborative filtering have become a novel technique to predict the performance of a student in future academic years, depending on their grades. In the educational field, collaborative filtering methods are based on the hypothesis that student performance can be predicted from grade history of all courses or modules successfully completed. An evaluation of grade prediction for future academic years is presented in Reference [25] using collaborative filtering methods based on probabilistic matrix factorization and Bayesian probabilistic models. The prediction model was evaluated in a simulated scenario based on a set of real data of student grades between the years 2011 to 2016 in a higher education institution in Macedonia.
In another work [26], the application of collaborative filtering methods was also identified, where the objective was to predict the performance of students at the beginning of an academic period, based on their academic record. The approach is based on representing student learning from a set of grades of their approved courses, in order to find students with similar characteristics. The research was conducted on historical data stored in the information system of Masaryk University. The results show that this approach is as effective as using commonly used machine learning methods, such as support vector machines.
In other research, the authors propose the development of methods that use historical datasets of student grades by courses, with the objective of estimating student performance [27]. Their proposal was based on the use of dispersed linear models and low-range matrix factorizations. The work evaluated the performance of the proposed techniques in a set of data obtained from the University of Minnesota that contained historical grades of a 12.5-year period. This work showed that focusing on course-specific data improves the accuracy of grade prediction.
In Reference [28], a novel approach is proposed that uses recommendation systems for the extraction of educational data, especially to predict the performance of students. To validate this approach, recommendation system techniques are compared with traditional regression methods, such as logistic or linear regression. An additional contribution of the work is the application of recommendation system techniques, such as matrix factorization in the educational context, in order to predict the future performance of students.
In one research study [29], academic data were collected from different secondary schools in the district of Kancheepuran, India. They used decision trees and naïve Bayes algorithms to run the classification of students. The study concluded the following:
  • The parents’ occupation, and not the type of school, played an important role in predicting the FG.
  • The decision tree algorithm was best for student modeling.
  • The FG for upper secondary students could be predicted from the students’ previous data.
Regarding big data, the opportunities and benefits that it offers for education have recently been studied. An analysis of the relationship between big data and educational environments has been presented in Reference [30]. The work focuses on the different methods, techniques, tools, and big data algorithms that can be used in the educational context in order to understand the benefits and impact that can cause in the teaching and learning process. The discussion generated in this document suggests that the incorporation of an approach based on big data is of crucial importance. This approach can contribute significantly in the improvement of the learning process, for its implementation must be correctly aligned with the learning needs and the educational strategies.
A smart recommendation system based on big data for courses of e-learning is presented in Reference [31]. In this article, the method of rules of association is applied in order to discover the relationships between the academic activities carried out by the students. Based on the rules extracted, the most appropriate course catalog is defined according to the behavior and preferences of the student. Finally, in this work, a recommendation system was implemented using technologies and big data tools, such as: Spark Framework and Hadoop ecosystem. The results obtained show the scalability and effectiveness of the proposed recommendation system.

3. Materials and Methodology

In the present work, a methodology guided by the steps described in Figure 1 is used:
  • The collection and data cleansing of historical datasets of student grades takes place.
  • The methods of machine learning and data mining are selected.
  • The model for predicting student grades is generated from previously processed data.
  • The results obtained are analyzed and visualized.

3.1. Data Description

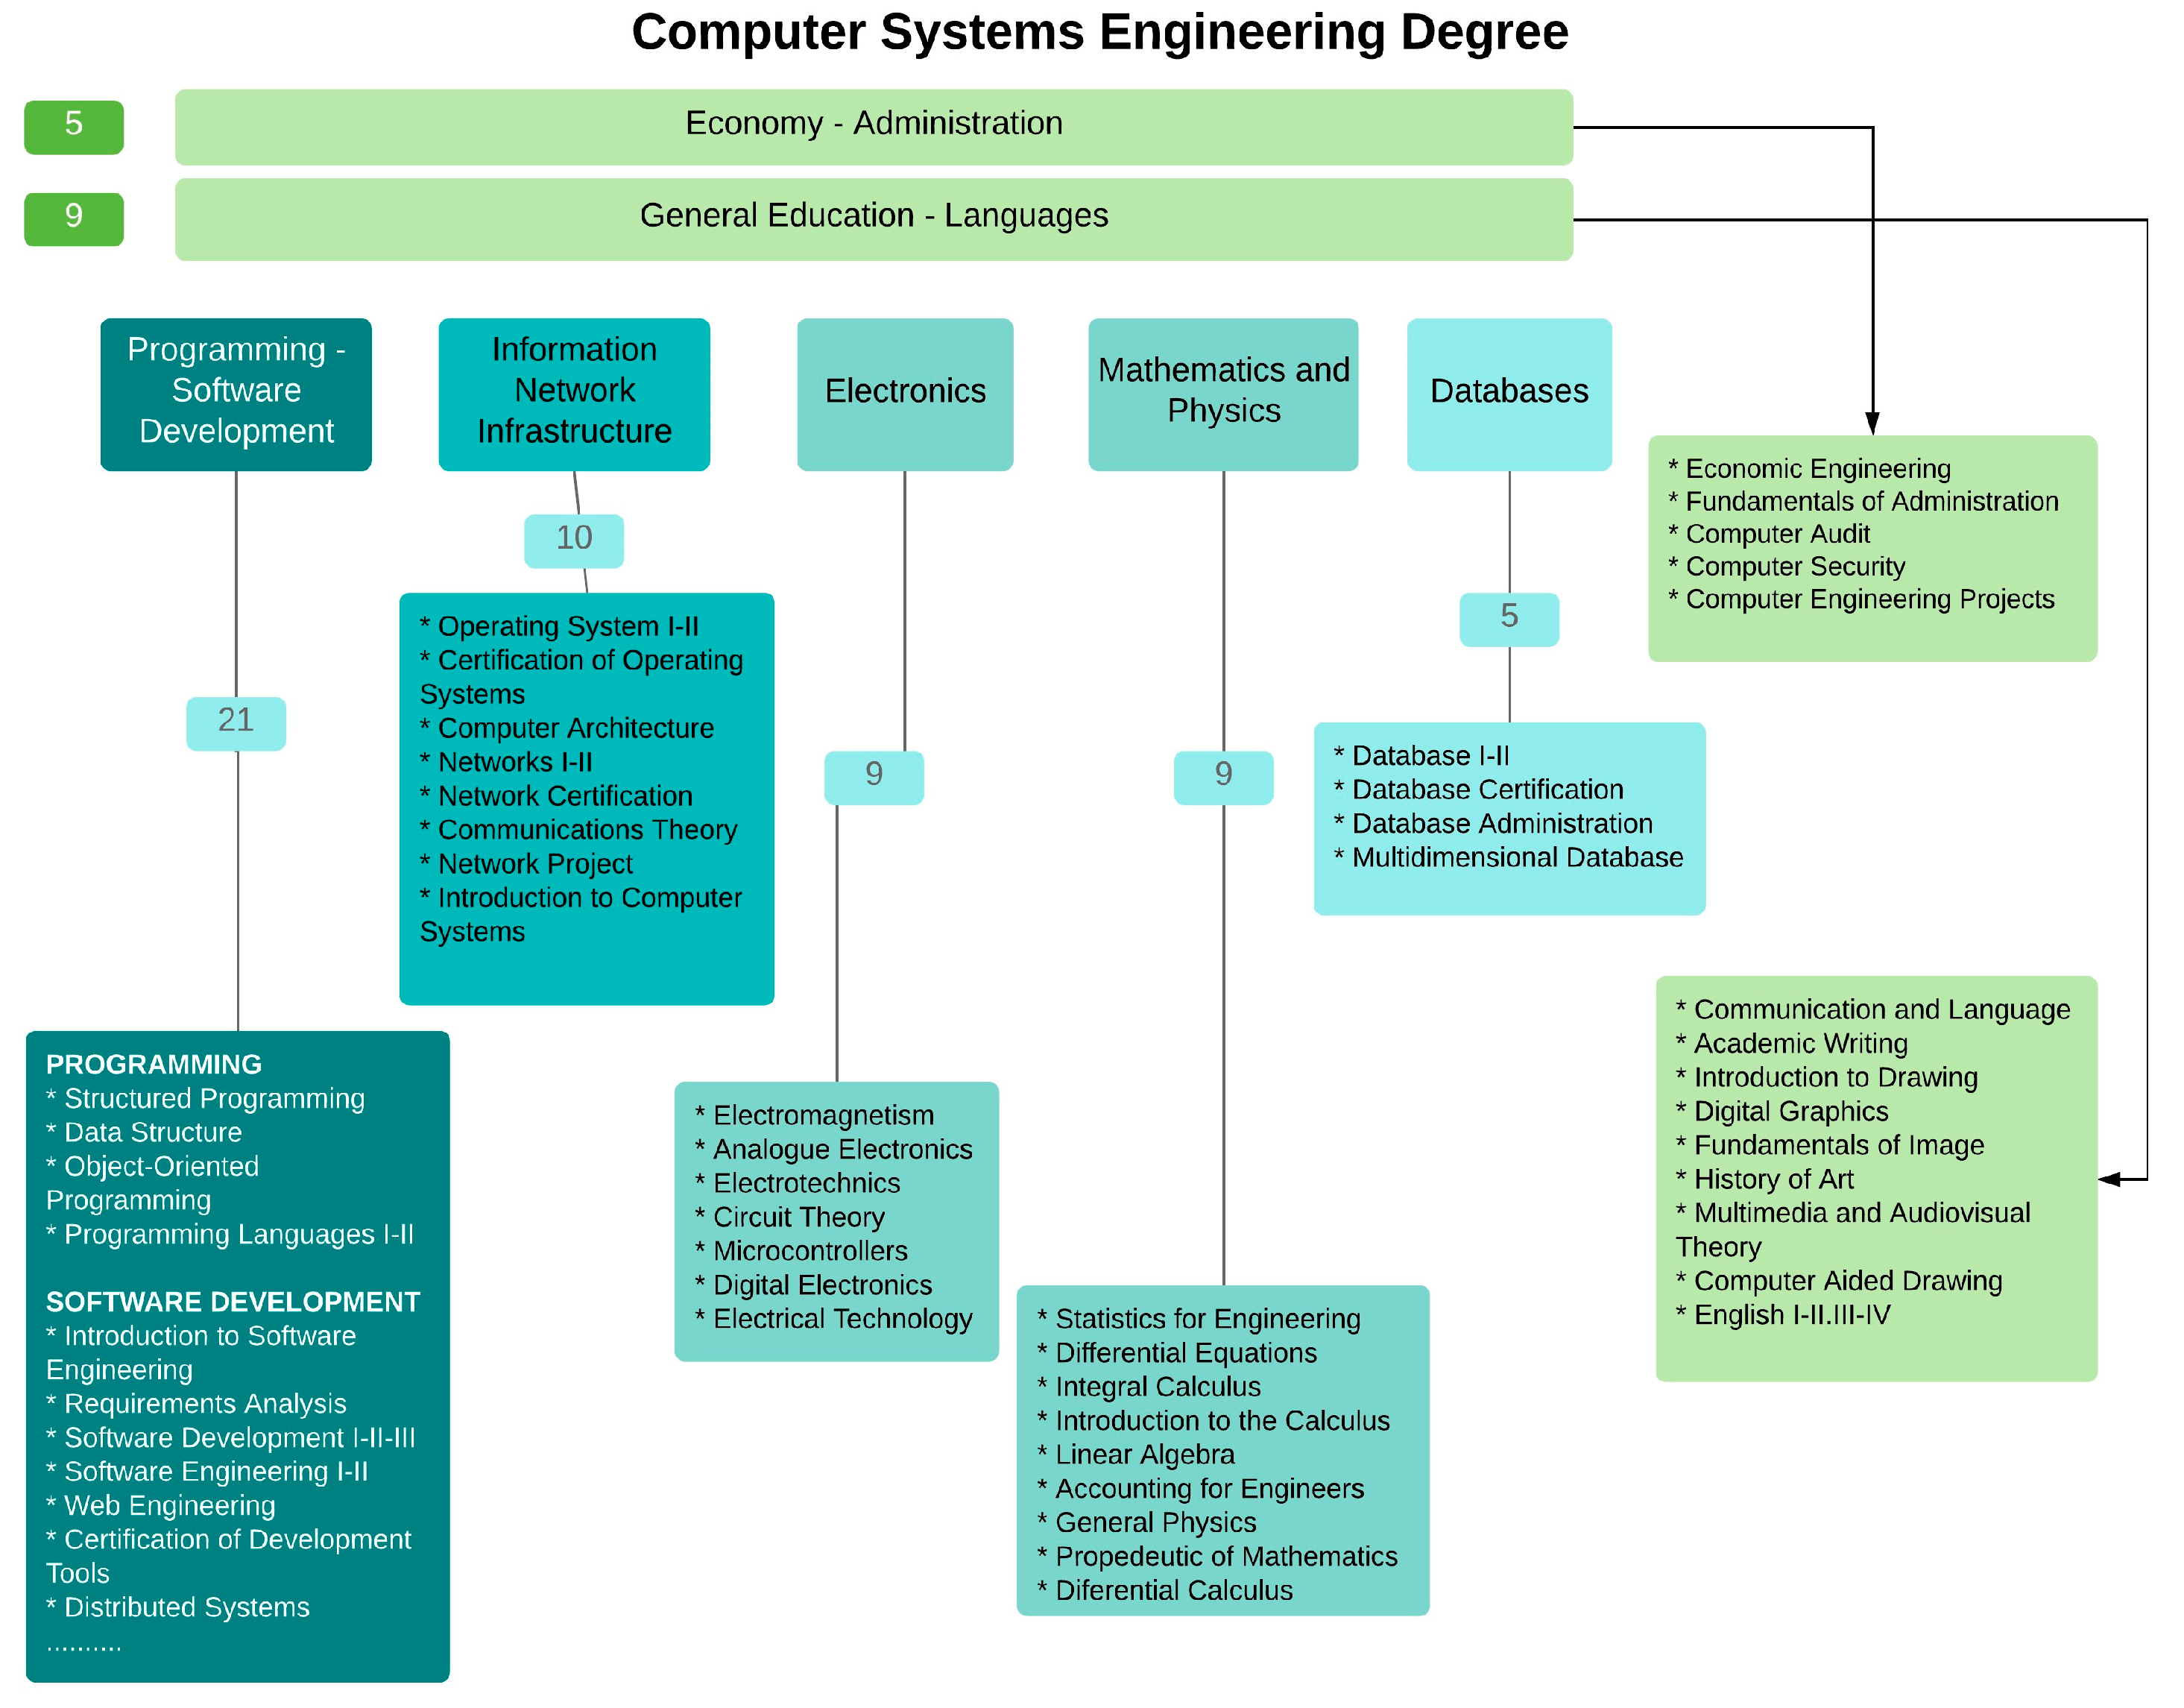
The dataset used for the present work is composed of the academic records of 335 students. The total number of historical records of students’ grades was 6358, which corresponds to all the subjects taken by this group of students. The periods analyzed were from the semester 2016-1 to the semester 2018-2 in the Computer Systems Engineering Degree of a university in Ecuador. In addition, the dataset comprises a total of 68 subjects organized into seven knowledge areas (Programming and Software Development, Mathematics and Physics, Information Network Infrastructure, Electronics, Databases, Economy—Administration, General Education—Languages), as can be seen in Figure 2. In addition, Figure 2 shows the number of subjects by areas of knowledge. According to the educational model used by the university, curricular coherence is vertically aligned in each of the seven areas of knowledge, that is, what students learn in the course or module is used as the basis for the next academic course. However, it is important to point out an exception, since the transversal knowledge areas, such as Economics—Administration and General Education are more aligned horizontally, where there are no such strong dependencies in different subjects and academic years.
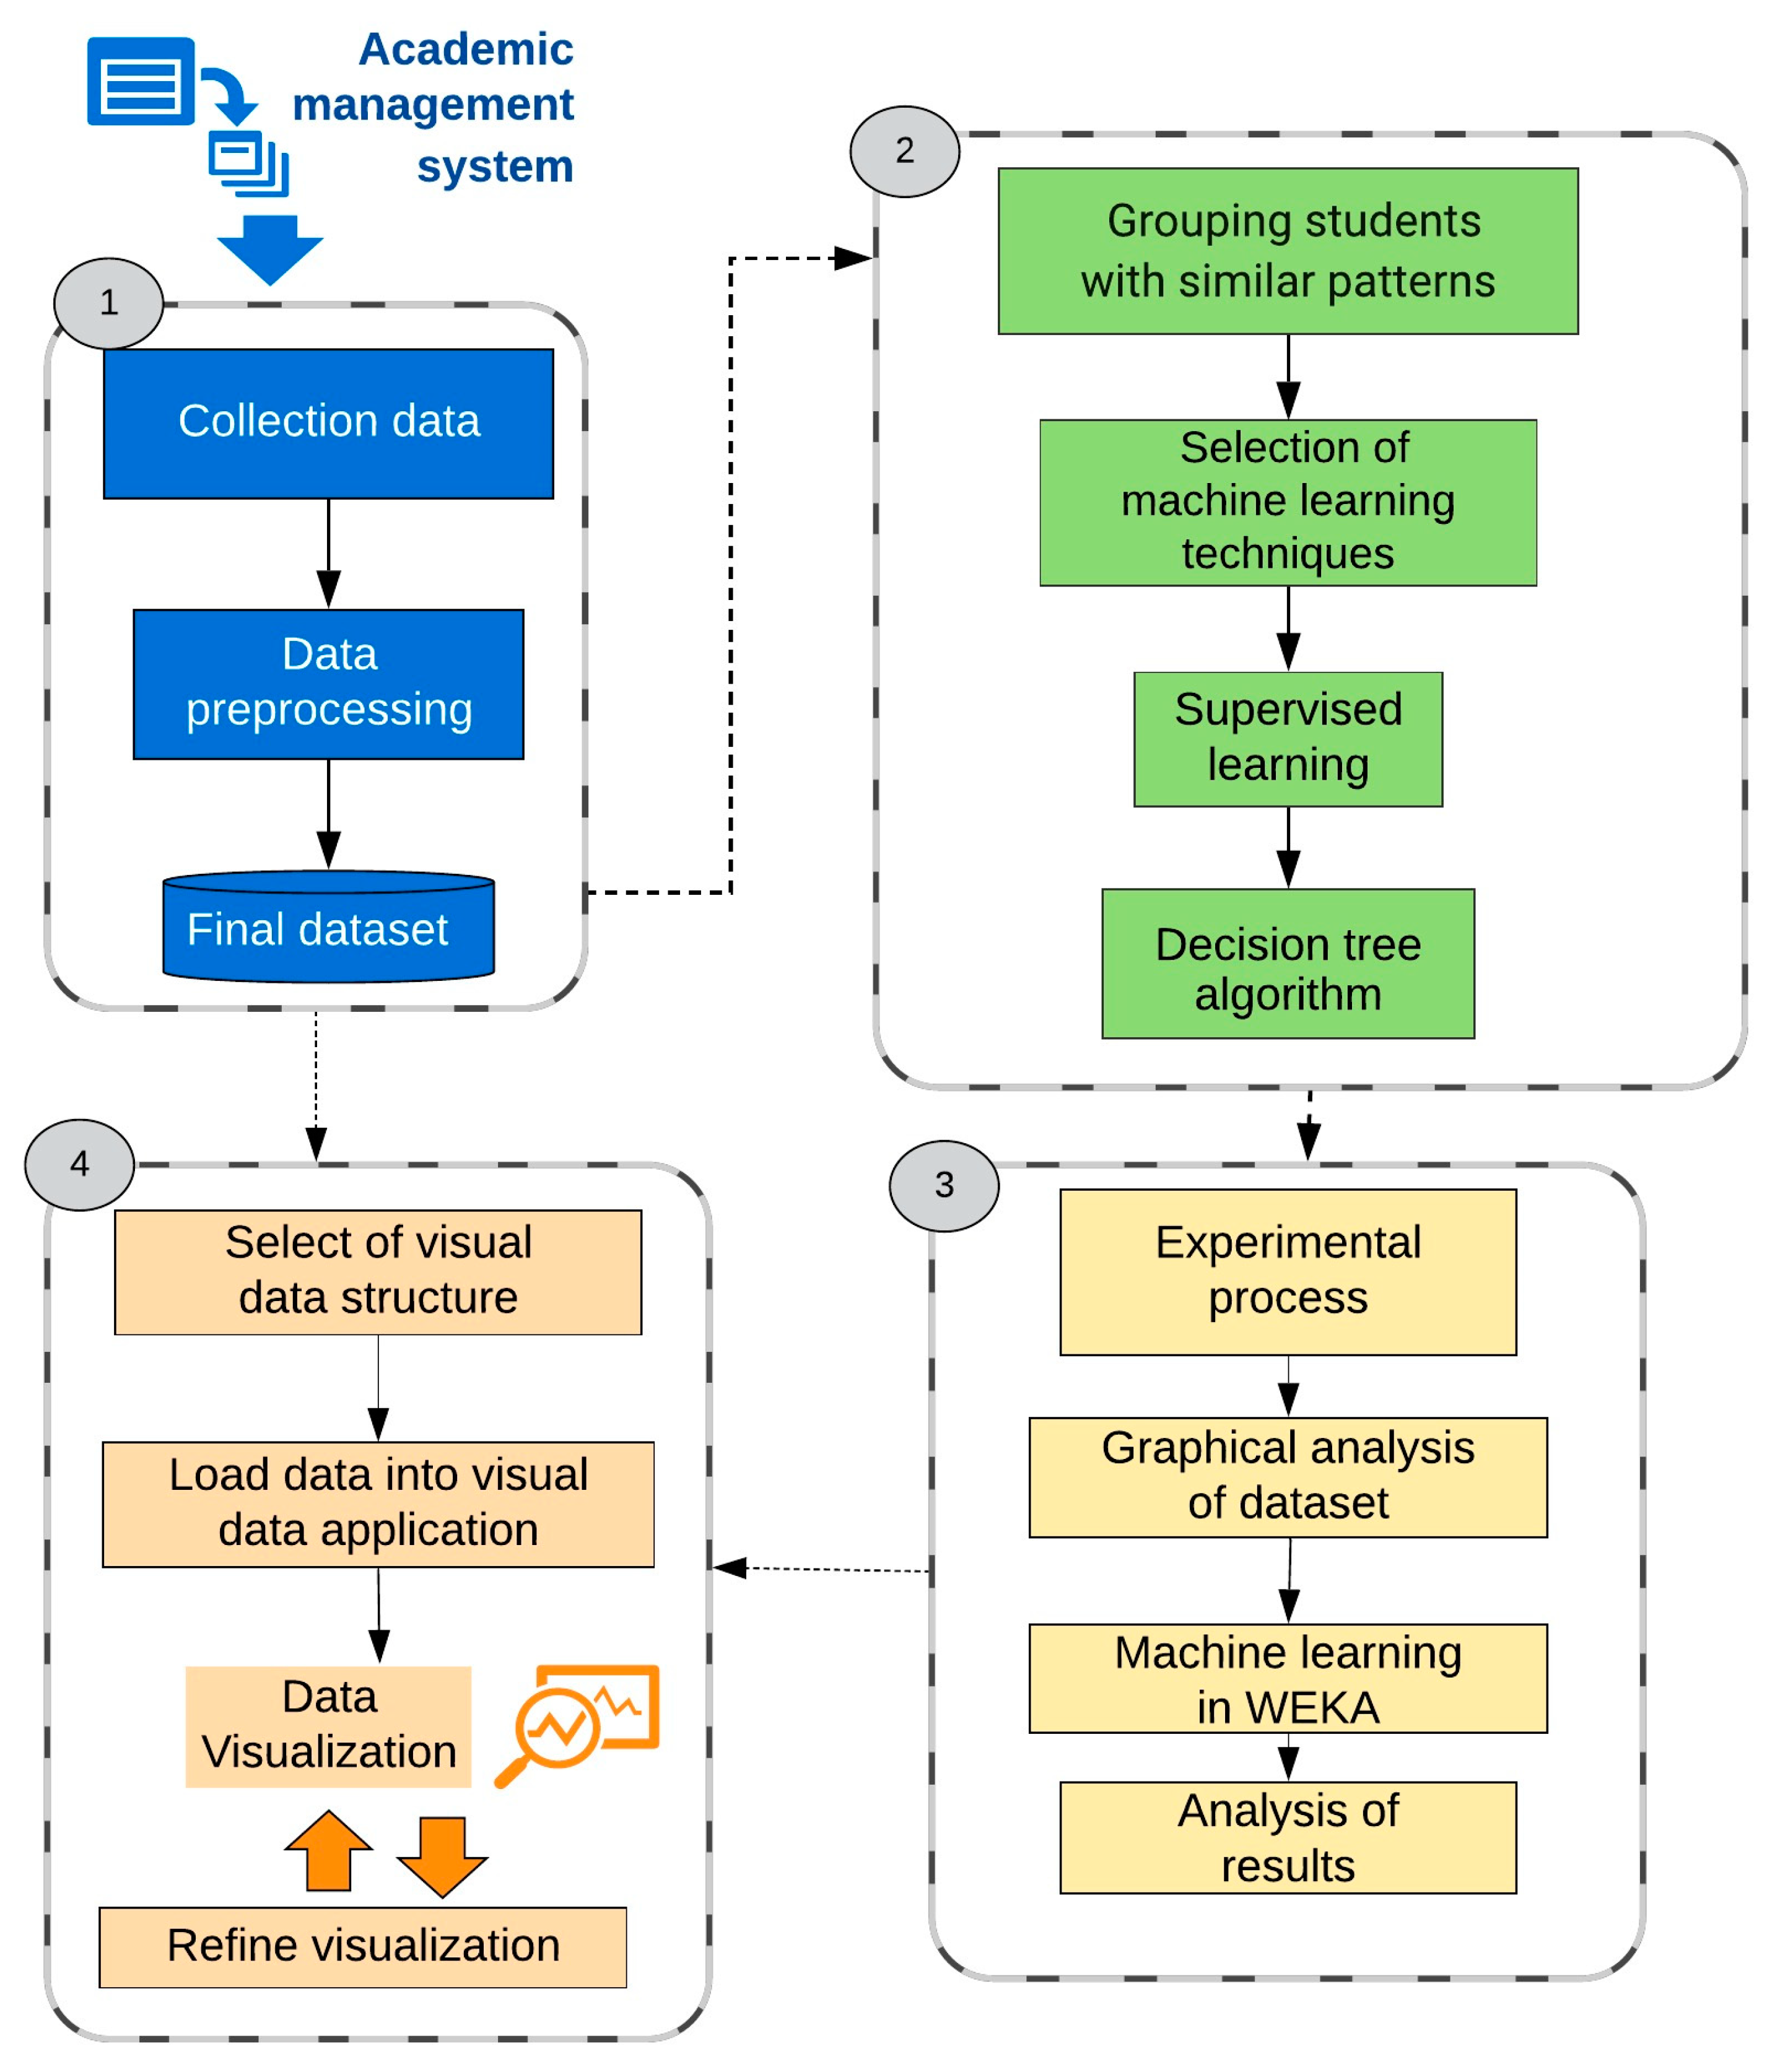
The data were extracted from the institution’s academic management system and stored in CSV format file. This information was periodically retrieved from the university’s grades system and stored in an integrated data repository. From this repository, some dashboards useful for the stakeholders were built. 
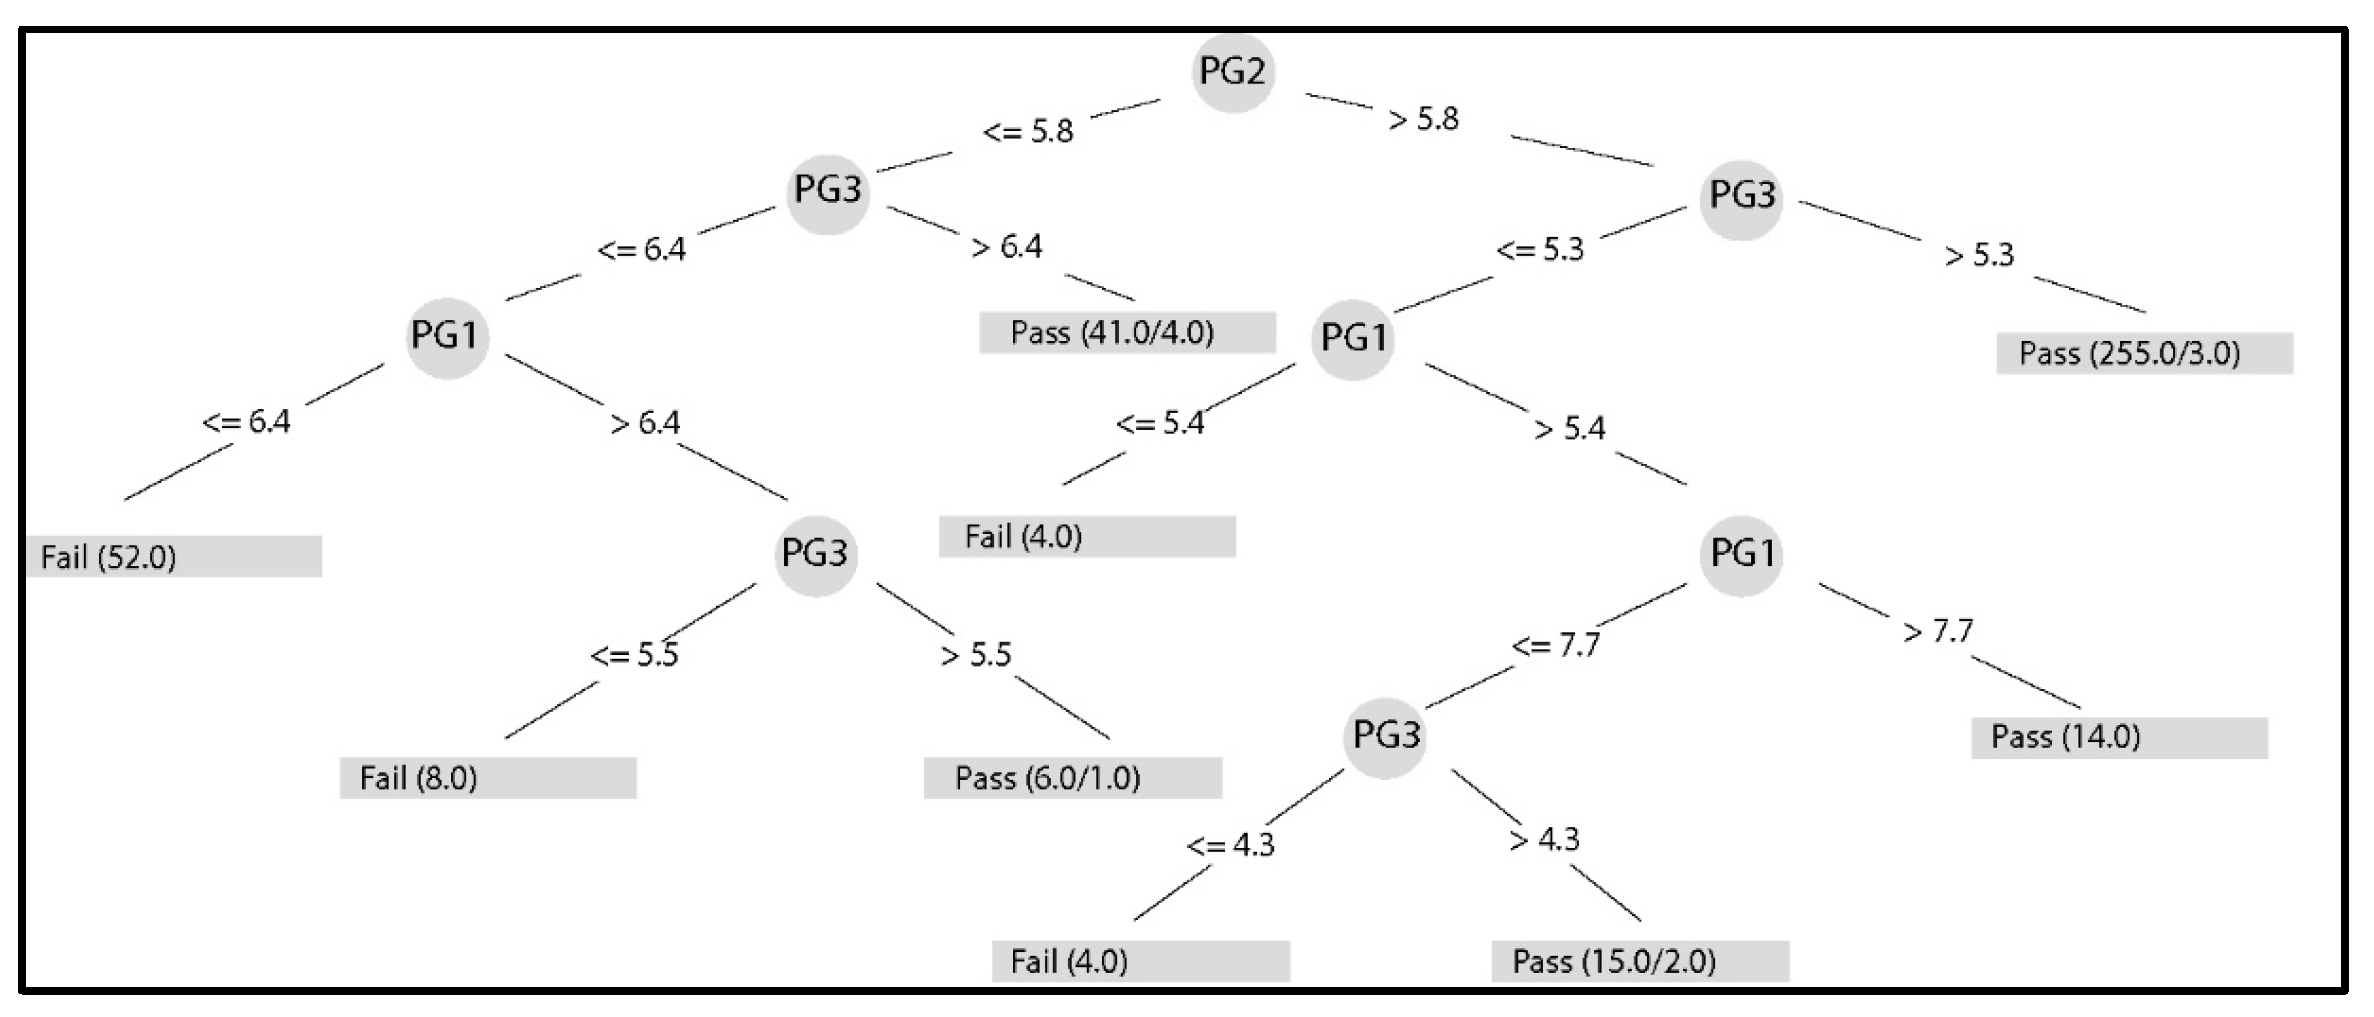
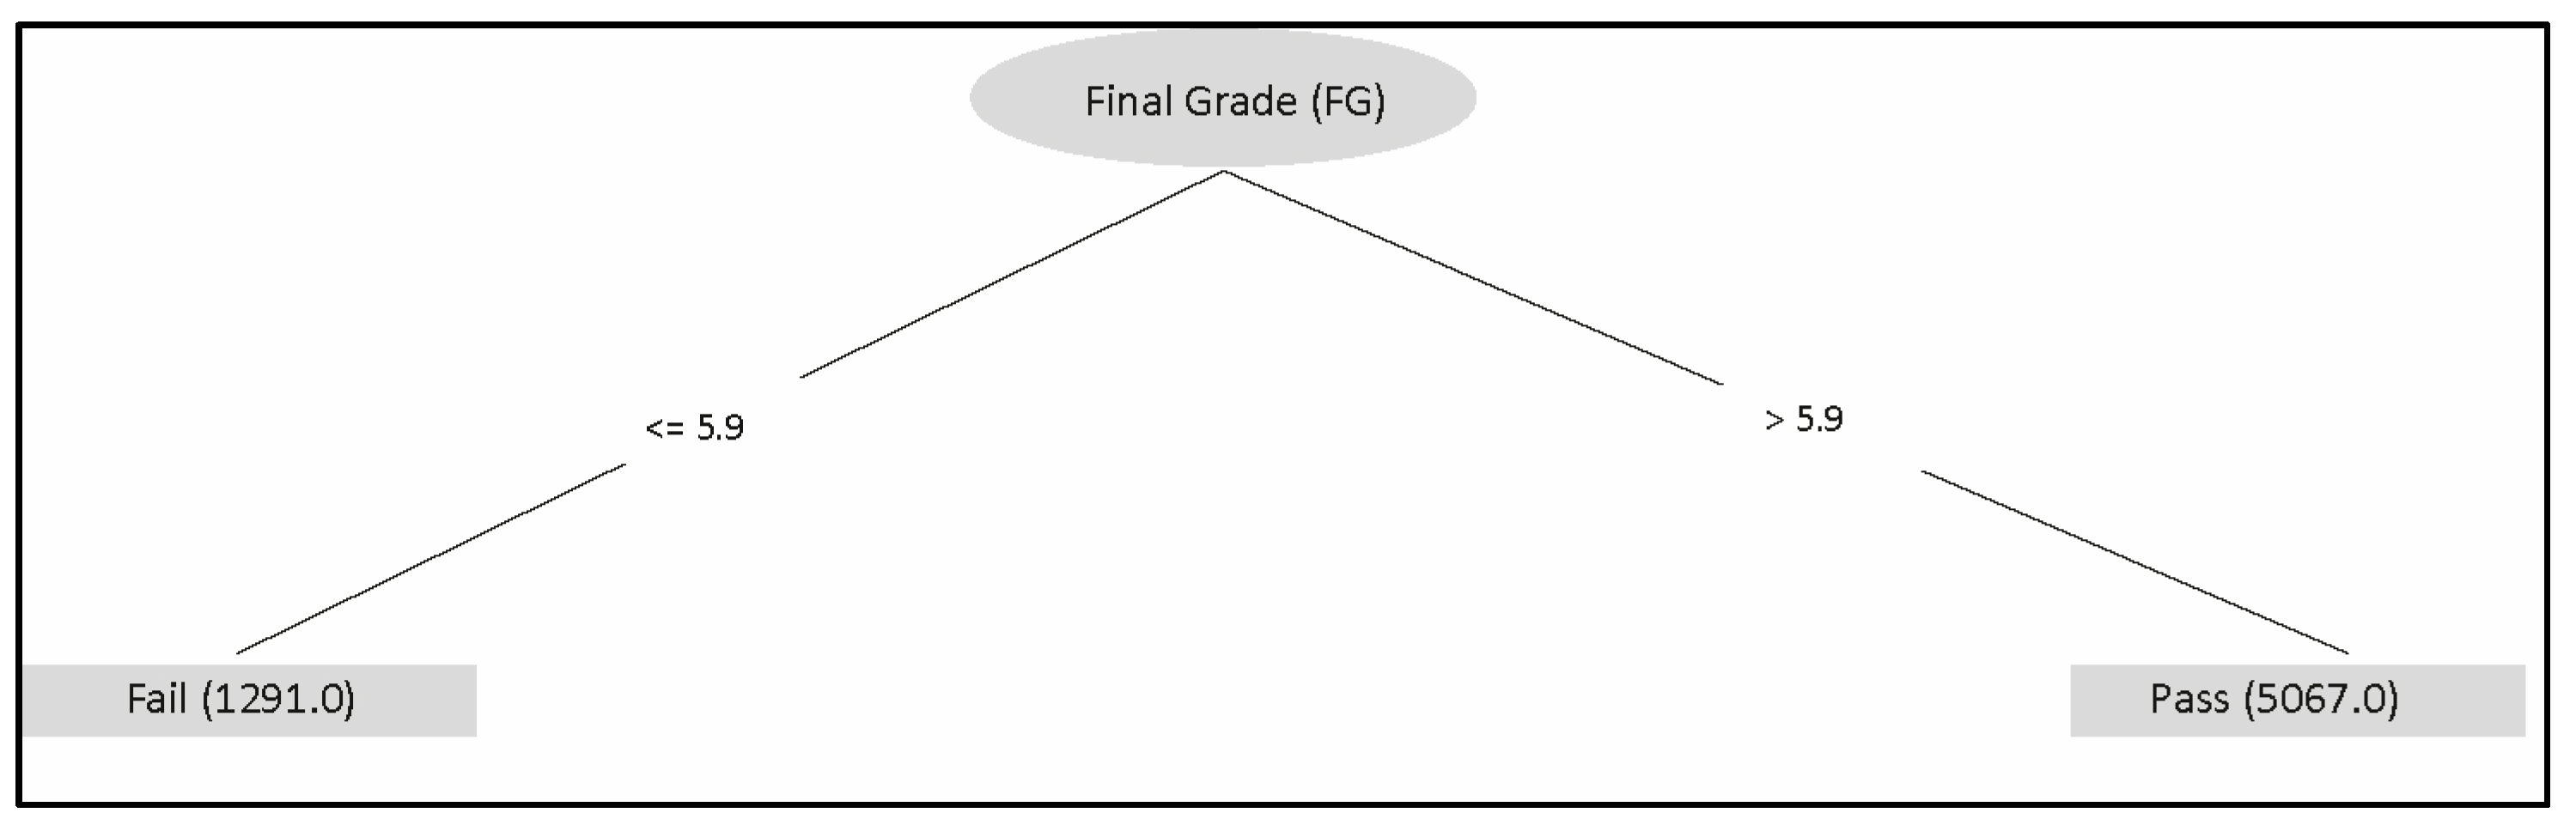
Table 1 shows a sample of the dataset. In order to pass a subject, the student must obtain a FG (FG) equal to or higher than 6. The FG is composed of three partial components (i.e., PG) weighted differently: PG1 is 35%; PG2 is 35%; and PG3 is 30%. This formula applies equally to all subjects and is a curricular definition for the entire university.
In the data preprocessing phase, duplicate records and null value records in components PG1, PG2, and PG3 were eliminated. In addition, in this phase the subjects of the knowledge areas Economy—Administration and General Education—Languages were eliminated. Another important task was executing a process to anonymizing the data that was carried out to comply with international data protection standards. This process consisted of eliminating or substituting the personal data fields (identification number, names, and surnames) of both students and teachers.
Before the dataset was loaded into the WEKA (https://www.cs.waikato.ac.nz/ml/weka/) (Waikato Environment for Knowledge Analysis) machine learning software to carry out a series of experiments, it was of interest to observe and study the dataset in terms of visual graphs. 
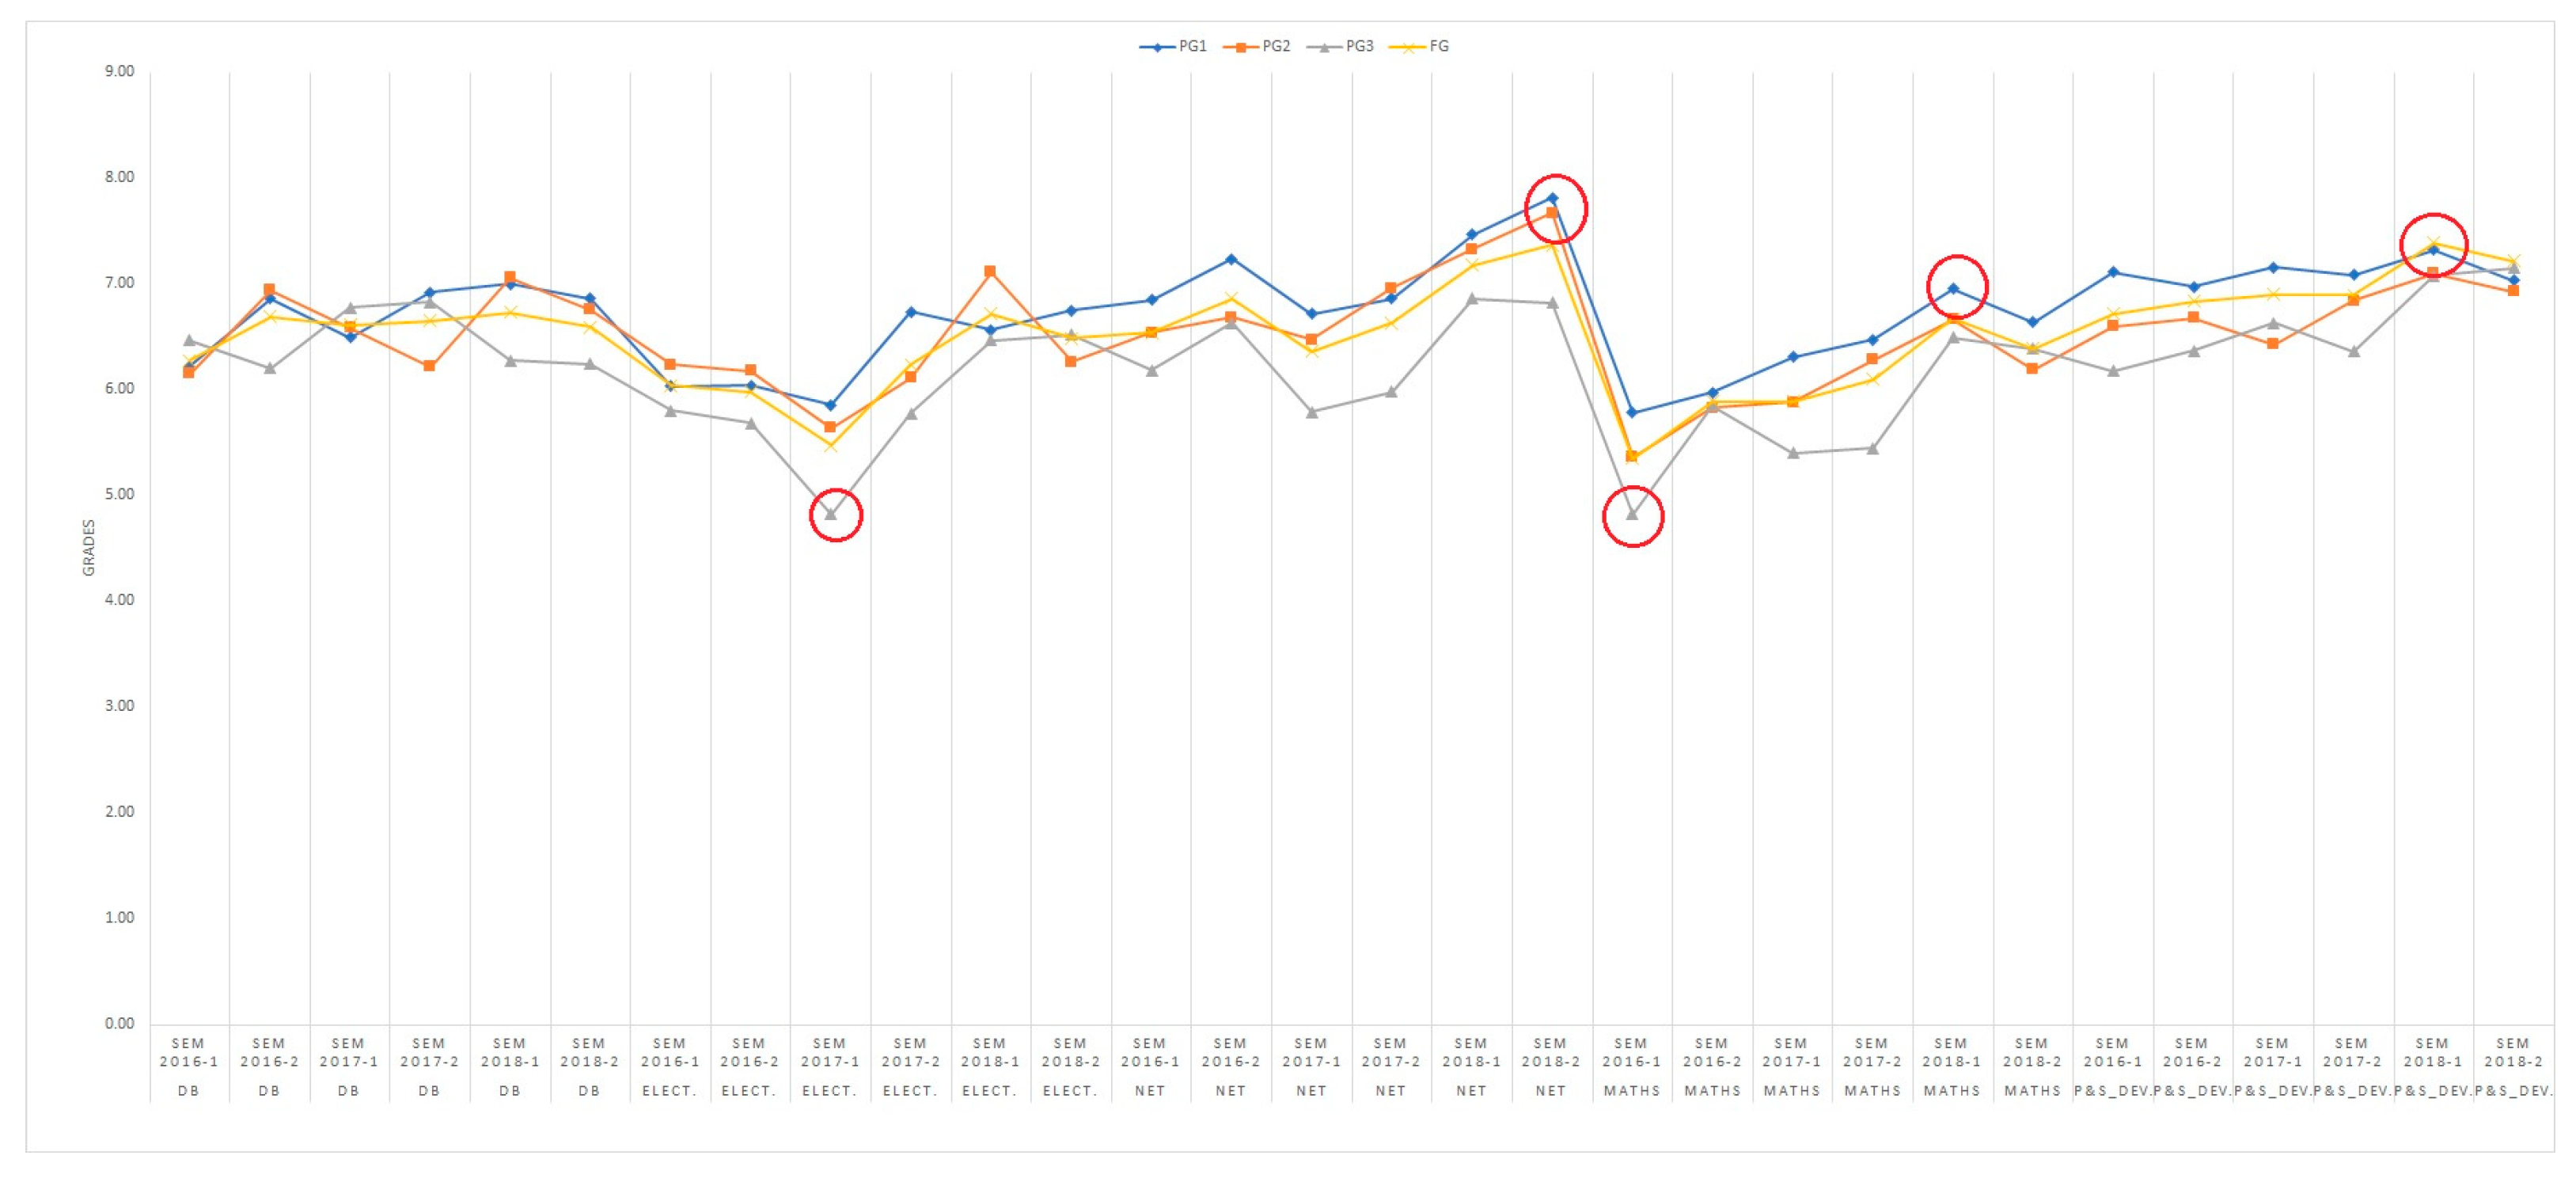
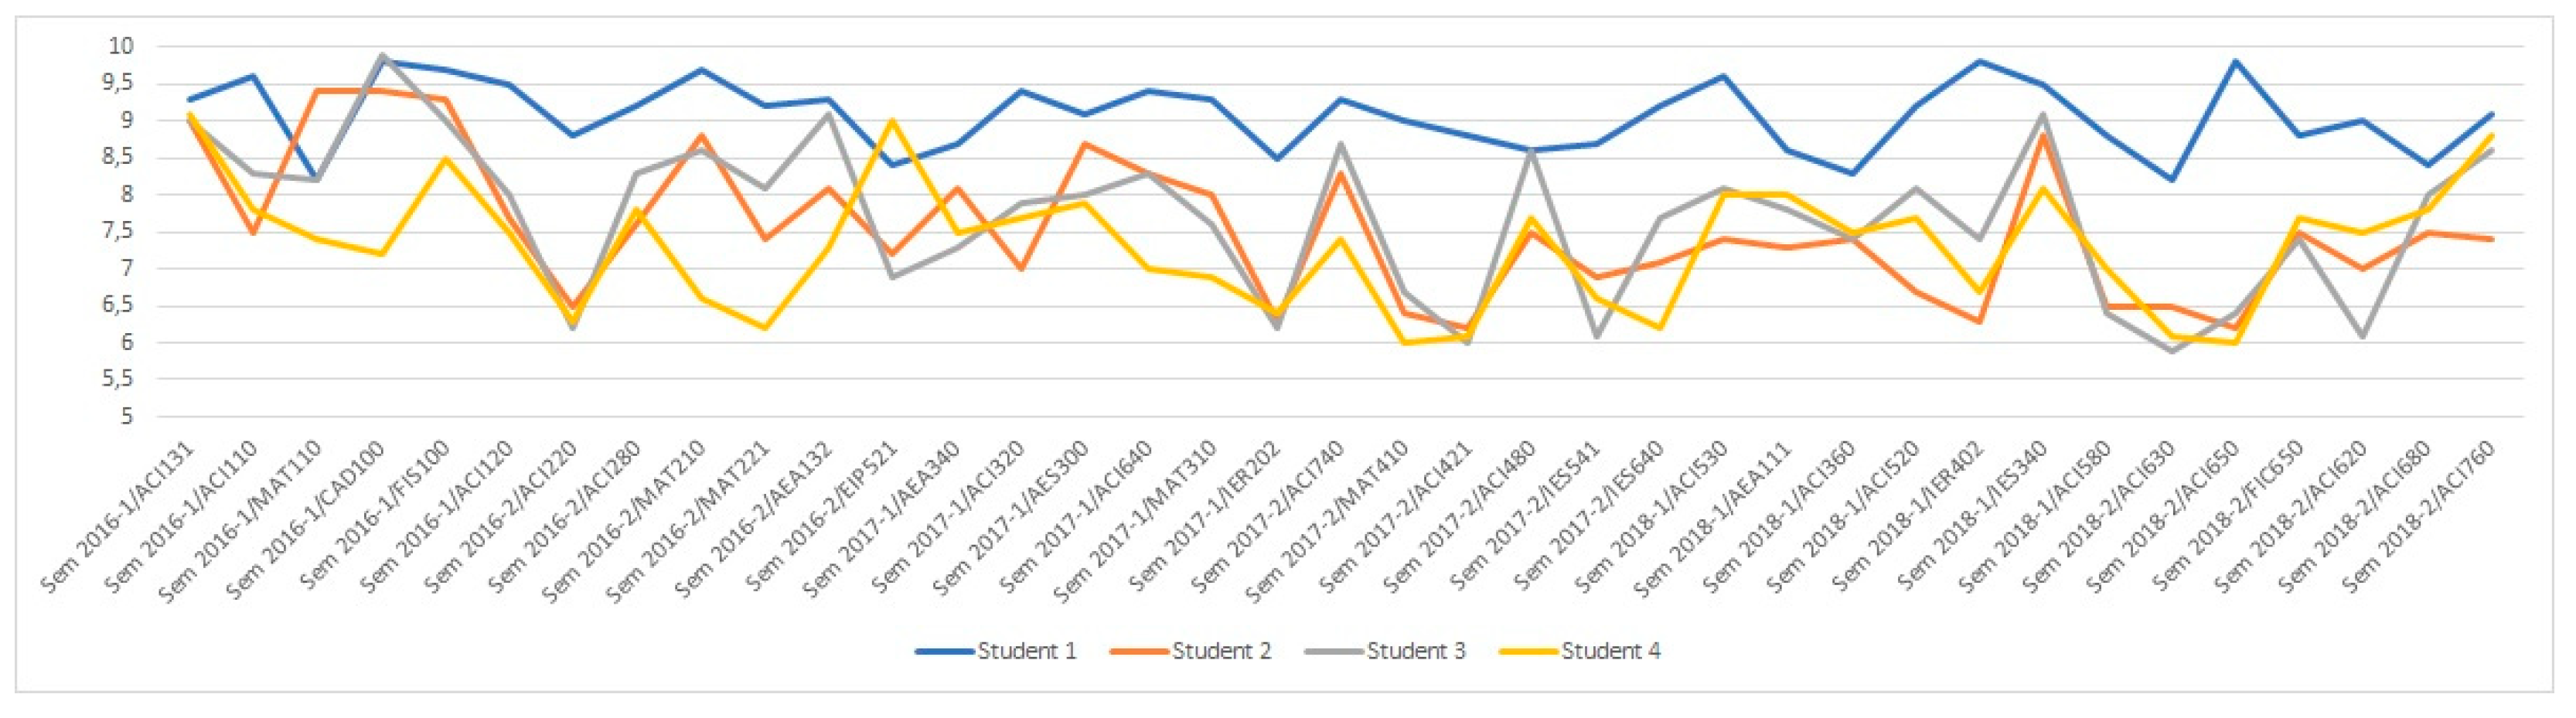
Figure 3 shows the evolution of student grades from the first semester of 2016 to the last semester of 2018, showing the four-color lines for every grade PG1, PG2, PG3, and FG.
It is striking to verify that in general, there is a trend of similar grades by area. Inclusive, as can be seen in some interesting deviations that have been highlighted with a red circle. These peaks represent ascending and descending trends in grades by area of knowledge. It is possible to think that this could be due to virtual groupings (similar grades are obtained in the same area) by professors of subjects within the same area. Or, it could even be due to similar criteria in the evaluation of these professors who belong to the same area.
It is interesting to deepen the analysis, since, after consulting the course coordinators of the knowledge area, at first glance, it seems that these similar peaks of grades graphed in Figure 3 respond to a coincidence. For the analysis, it must be taken into account that a subject, in a certain area of knowledge, can be taught by different professors. In addition, in spite of the fact that the evaluation criteria are uniformly managed in the university, each teacher applies the academic freedom in their evaluation methods.
In Figure 3, some interesting deviations are highlighted with a red circle, with first highly descending peaks and then two others as highly ascending. It is worthwhile studying what these situations might be due to. At first, it seems the explanations could have to do with students attaining good grades in their first tests and then their grades deteriorating as the course advances. That might be the reason why PG3 decreased and vice versa with the last two red circles that show that the students at the end studied harder to get a better FG. In addition, there is an important factor that, since the semester 2018-1, the percentage weightings of each PG changed:
From 2016-1 to 2017-2, the FG was calculated as follows:
FG = PG1 × 0.35 + PG2 × 0.35 + PG3 × 0.30
In these periods, students put their greatest interest (and effort) at the beginning of the course, PG1 and PG2. In many cases, just with these two PGs, they were able to pass the subject (although with the minimum mark required) and, therefore, neglected their academic performance in the PG3. For this reason, as of semester 2018-1, the FG is calculated as follows:
FG = PG1× 0.25 + PG2 × 0.35+ PG3 × 0.40
From this semester, it was observed that students improved their grades in PG3. 
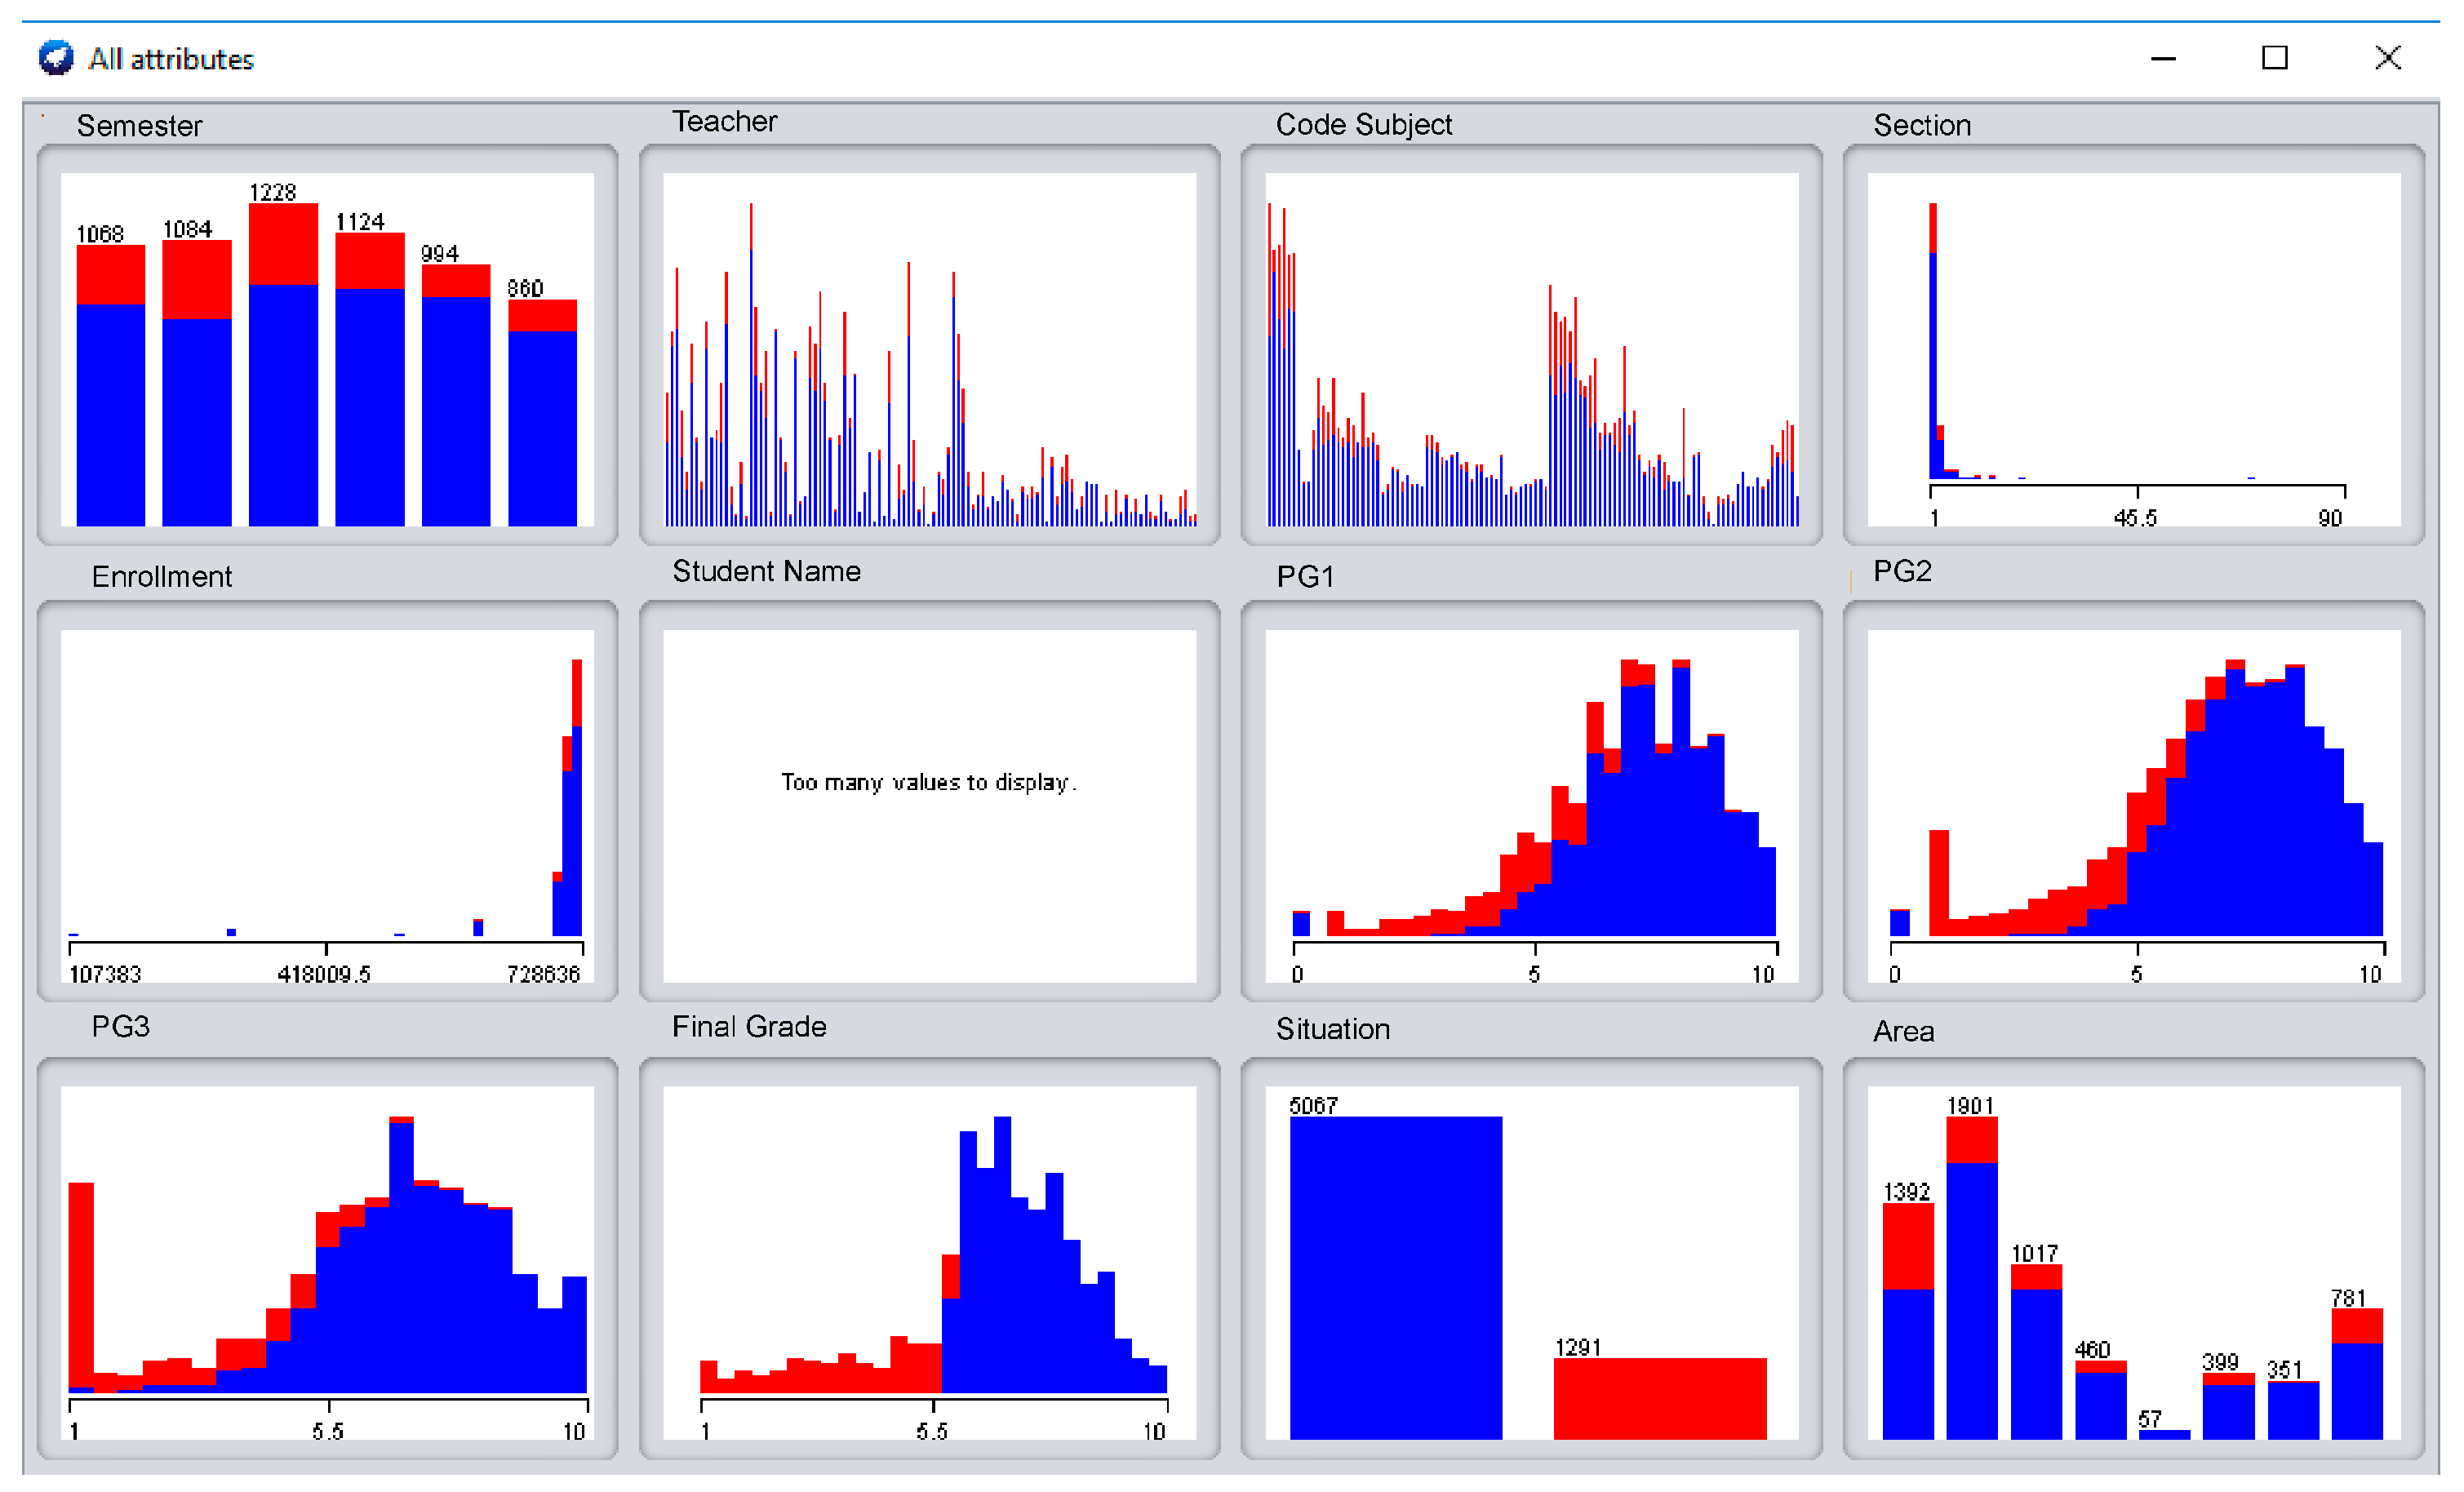
Figure 4 shows all the data loaded graphically to more easily appreciate the correlation between all the columns with respect to the final result (pass or fail the course, column “Situation”; red = “fail”, blue = “pass”). The aim of this figure is to show dashboards where it is possible to measure the influence of and relationship between every particular feature regarding the FG (Situation). Evidently, there are cases where that correlation is clearly identifiable. This FG, named “Situation”, shown in Figure 4, clearly identifies (almost with a perfect line) that up to 5.6, the FG will be “fail”, whereas over this value, the FG will be “pass”.
Most of the remaining dashboards are not as straightforward to interpret. They often show mixes of “red & blue” to confuse the correlation. Of course, there are general signs of these indicators, like the PGs (PG1–PG3), which indicate a trend to blue when the value increases, and they are red when the value is low. In fact, this is the clear objective of an indicator, obvious and concise.
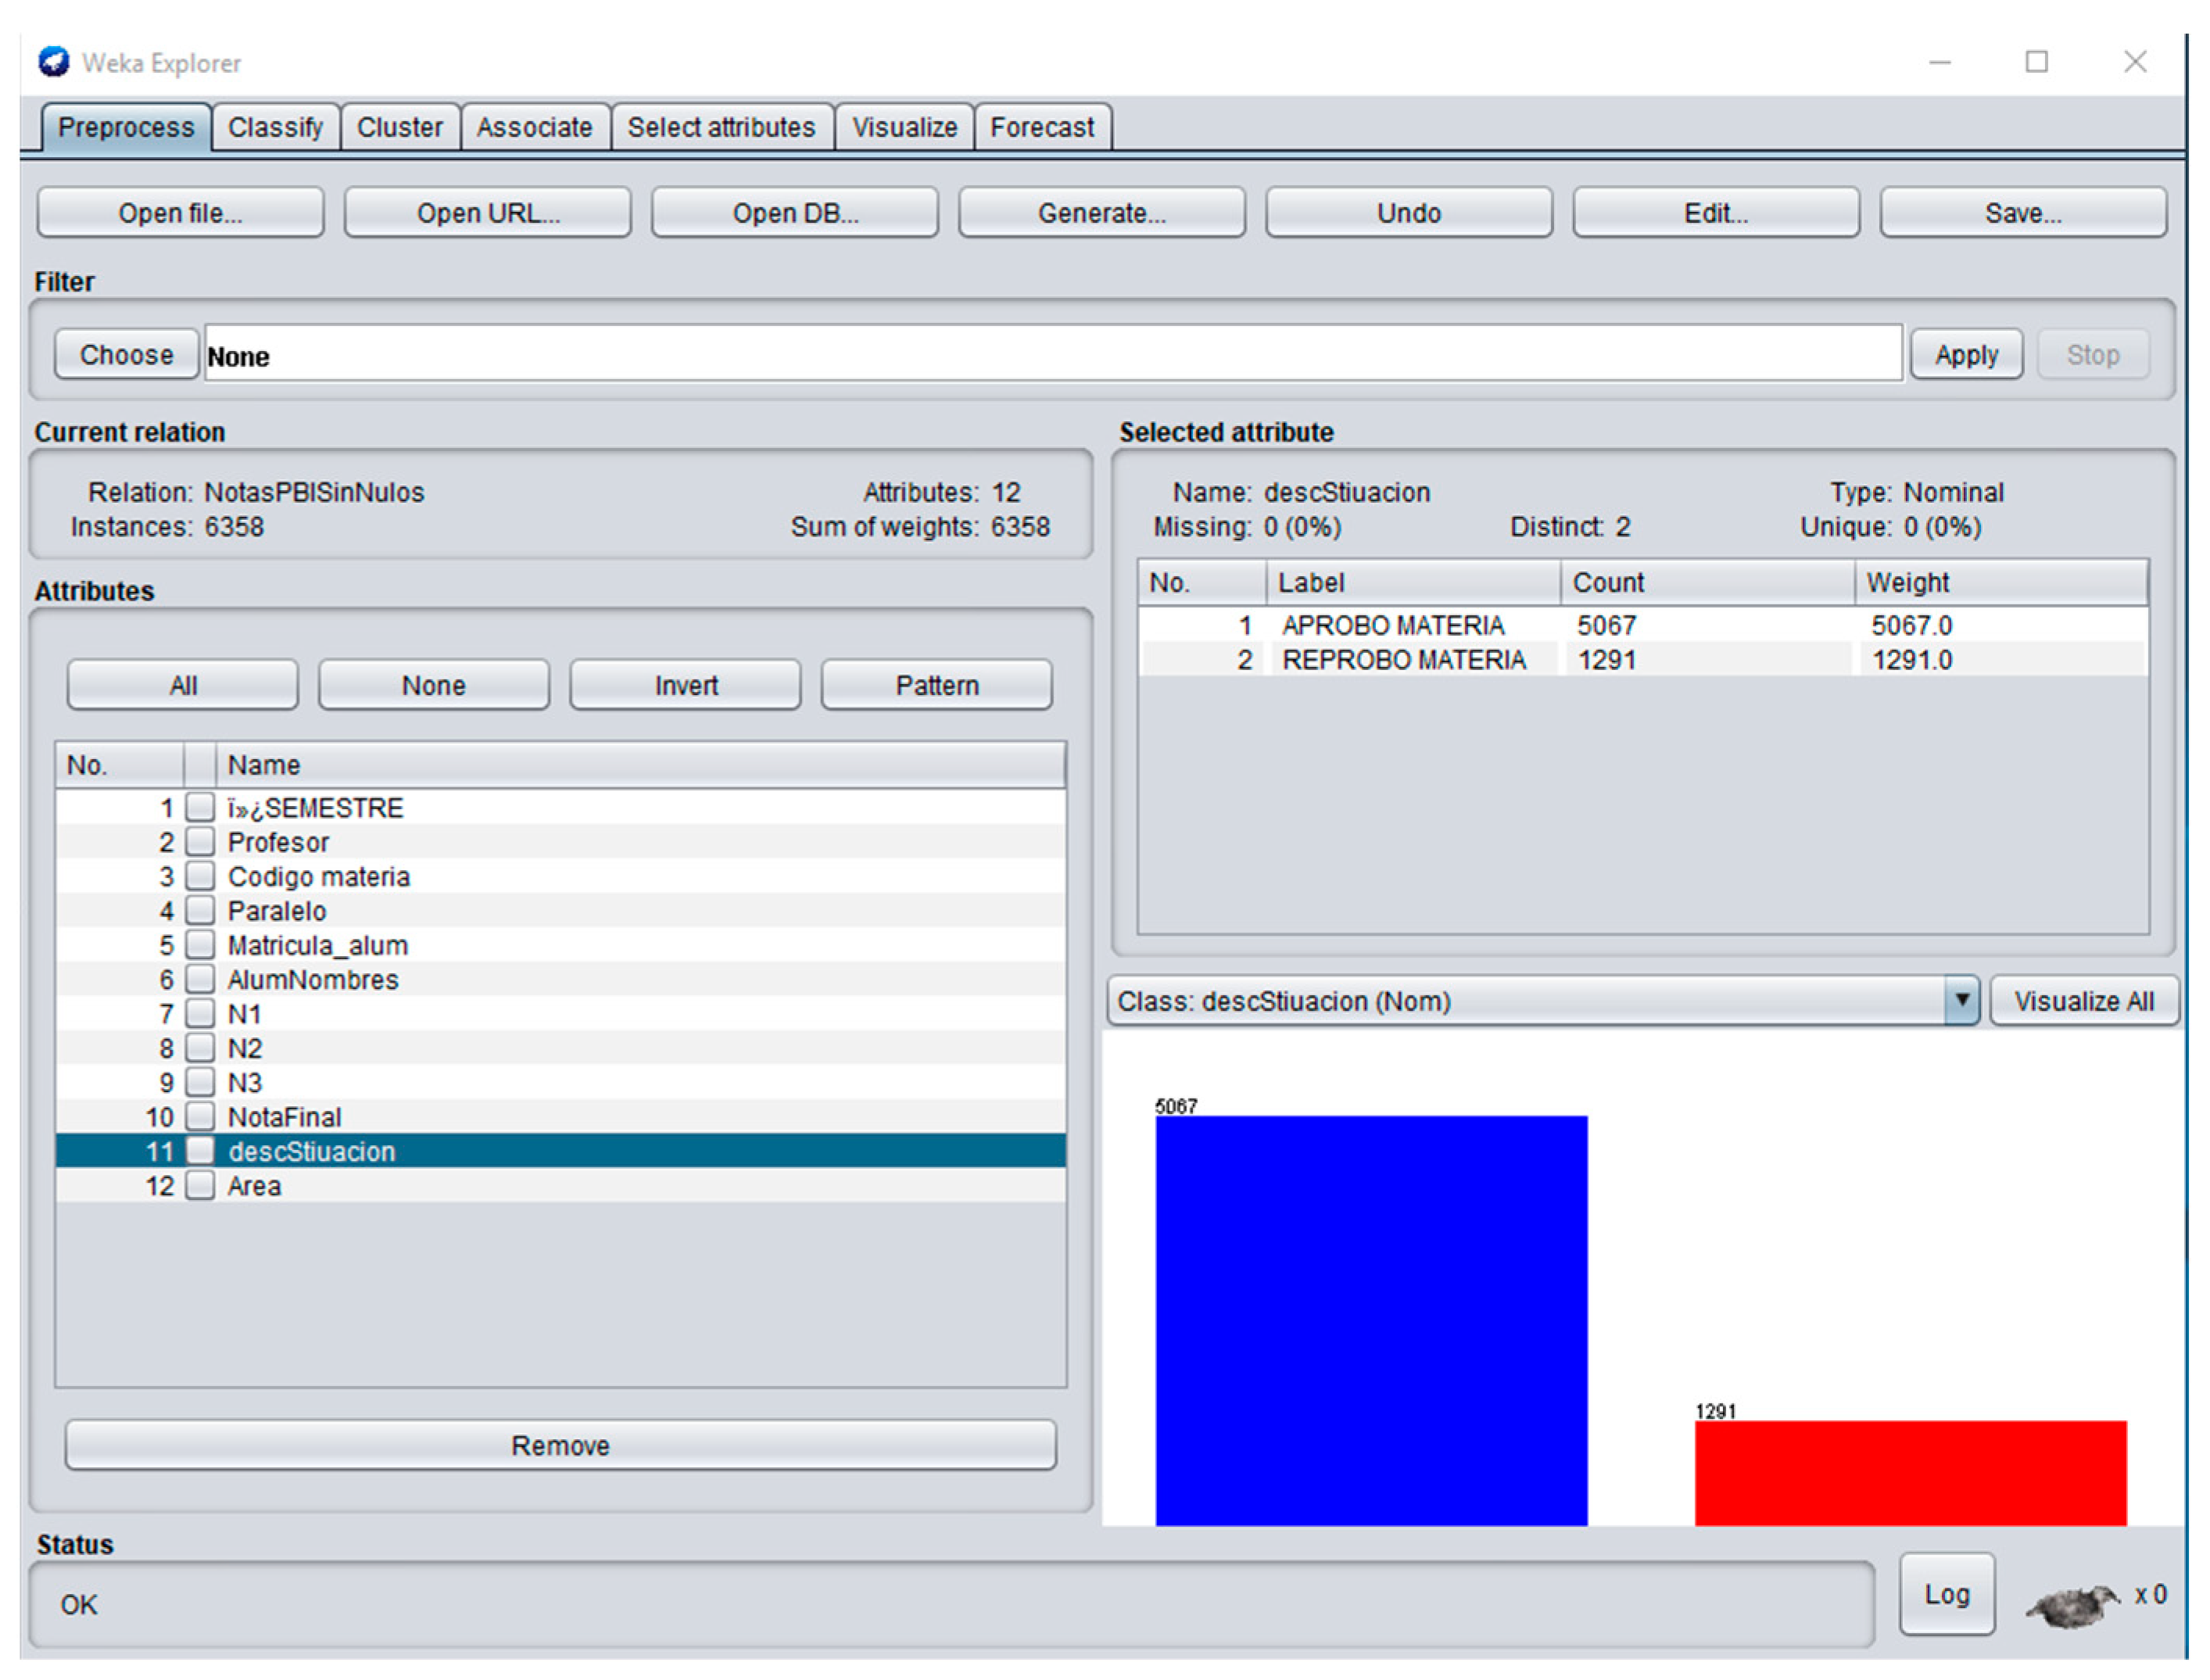
It is also worthwhile mentioning the variables “Area” and “Code Subject”, as it is widely believed that a particular area, as well as a specific subject, have a direct connection with the FG. The dashboard of “Code Subject” is harder to explain due to the high number of subjects. We could appreciate higher concentration of red in the central area, whereas at the beginning and just after the middle, there is a good proportion of blue. Nevertheless, there will be always a majority of blue as the classes (pass and fail) are totally unbalanced (5067 vs. 1291, respectively), as can be seen in Figure 5.

3.2. Selection of Machine Learning Techniques

In this research, we used data mining and machine learning techniques to provide an accurate prediction method for historical dataset of student grades. On the historical dataset of the student grades in the Computer Systems Engineering Degree, supervised learning techniques were applied to determine a predictive model that would lay the foundations for the future development of a system of recommendations for the students. Predicting the academic performance of students is considered one of the most common problems and, at the same time, represents a complex task of educational data mining.
Classification is the most widely used data mining technique, and this technique is applied over pre-classified data records in order to develop a predictive model that can be used to classify unclassified data records. This technique can be executed through the application of the decision tree algorithm. The process includes two steps: learning and classification [29]. In the learning step, the training dataset is analyzed using the chosen classification algorithm. The main benefit of applying the decision tree algorithm is that its results can be easily interpreted and explained, thanks to its graphical representation that summarizes a model of implicit decision rules.

3.3. Experimental Process

In the experimental phase, before applying machine learning tools, a study was carried out to group the information in order to identify groups of students with a certain pattern of behavior. The task of grouping data is particularly important since it is usually the first step in data mining processes. From this task, it is possible to identify groups with similar characteristics that can be used as a starting point to explore future relationships.
In a second phase, using the decision tree algorithm, some tests were done with the students’ grades. For example, in a first test the grades of the (PG3) were eliminated in order to make a prediction of the (FG). With this test it was expected to identify the number of students who passed the subjects without this component. Then a prediction was attempted with the PG2 component eliminated. The results found are shown in the following section.

3.4. Data Visualization

The main purpose of data visualization is to present all the characteristics of the dataset through graphical representations. The visualization of data in a graphical format constitutes an element of support, so that the results of a process of data analysis are shown in an intuitive way for students, teachers or educational administrators. The data visualization process can be described in general terms in the following steps: obtain and debug the data; select the data visualization structure; load the data into the selected application; display the data in dashboards; and, finally, refine the process of visualization [32].

4. Results

In engineering degrees, it is not common to find regular students, that is to say that they pass consecutively all the subjects of various academic levels planned in the curriculum. With the historical dataset of student grades, a combination of variables was performed in order to obtain a group of students that have common attributes and on which some type of analysis can be carried out before applying machine learning algorithms. After combining student grades, subjects, and academic years, only four regular students were identified who have taken and passed the same subjects up to 6th semester; this is 37 subjects, which is equivalent to 62% of the total subjects (68) of the curriculum. As previously explained, 19 subjects were eliminated from certain knowledge areas of transversal training. Figure 6 shows the variation of the FG of the four students over six semesters and 19 subjects.
These four students belong to the group that started the degree in the 2016-1 semester (2016-1 cohort). The number of students identified is very low, considering that in this cohort there was a new enrollment of 67 students, as can be seen in Table 2. That is, only 6% of students have managed to advance in the curriculum without failing any subject until the sixth semester (37 subjects). Table 2 shows the cumulative number of students who have dropped out of their studies corresponding to some cohorts, the attrition analysis is done at 6, 12, 18, 24, 30, and 36 months. The student dropout rate represents the number of students who drop out of their studies for different reasons. These reasons can be of an academic, economic, or personal nature. There are special cases in which students leave their studies for a certain time and then re-enroll. In these cases, the dropout rate takes atypical values, as can be seen in Table 2 in the academic period 2017-1, where the dropout number at 24 months (25) is lower than the dropout rate at 18 months (26).
Taking the 2016-2 cohort as a reference, an analysis was made of the peaks highlighted in Figure 6. The first subject observed with a low peak in the FG was Data Structures (ACI220). Figure 6 indicates that all the students lowered their FGs in this subject, with the FG near 6. Table 3 shows the statistical data of the subject (Data Structures) in the different periods of study. It was observed, in relation to the pass rates, that the subject has had a positive evolution throughout the semesters analyzed. The fail rate was reduced from 35% in the semester 2016-1 to 17% in the semester 2018-1.
The second subject analyzed was Operating Systems II (ACI740) in the semester 2017-2; this subject has a peak of high FGs. Table 4 shows the statistical data of the subject in the different periods analyzed. It is interesting to consider some aspects identified around this subject. The subject has been taught by the same teachers in the three analyzed periods. The number of students per section is low in relation to other subjects. The average of pass rate of the subject is higher in relation to other subjects.
After the preliminary analysis, it became imperative to analyze the student retention and dropout values of the degree under study. Figure 7 shows the student retention and dropout rates accumulated for each cohort that began their studies in the academic periods we analyzed in this work. Figure 7 shows the retention and dropout rates at 6, 12, 18, 24, 30, and 36 months. When the rates are accumulated, it was observed that the cohort that began their studies in the semester 2016-1 had 29 students remaining after three years. The educational authorities must focus on these statistical data in order to implement actions that allow the dropout rate to be reduced.

4.1. Initial Situation: All Attributes

Figure 8 presents the first experiment carried out. The rule obtained by the decision tree is not very useful, as the tree in itself is very simple. However, the main feature retrieved, as we expected, was that a student needs to achieve over 5.9 grade to pass the subject.
Table 5 shows the accuracy, as well other measures, including the confusion matrix, obtained for this first experiment shown in Figure 8.

4.2. Without Final Grade

As verified in the previous section, the first step is to run the decision tree with all the available input attributes. The analysis is that only the input variable of PGs are taken into account to predict whether the student will pass or not. Therefore, the next step is to remove this variable to check the incidence of the rest of the variables and their correlation in the final result. For this reason, in the following experiments, different tests were carried out, gradually eliminating some of these variables and assessing their weight in relation to the final prediction (if the student will pass or fail).
Figure 9 shows the confusion matrix obtained for this first experiment. On the other hand, Table 6 shows additional measures related to the results of the execution of the decision tree algorithm. The decision tree of Figure 9 offers a high accuracy, in spite of the FG being removed. Furthermore, the decision tree in itself provides good visual rules where is obvious to observe the influence of the input variables and their correlation with the FG. To go one step further, within the next subsection, we will explore the effect of PGs by removing some of them.

4.3. Without PGs

In these experiments, we took out the PGs PG3 and PG2, respectively. Here, the objective with these tests was not only to build diverse decision trees—which in itself is great as it will provide us new rules and patterns—for every test, but most importantly, to weigh the significance of every PG, PG1–PG3. These results can be seen in Table 7.
What is really striking in these last experiments is the creation of clear and coherent decision trees and, consequently, the usefulness of the acquired decision rules. This allows a study on the PGs to determine which are the most decisive. For example, in Figure 10, the root of the decision tree shows that when PG2 is lower or equal than 5.7 and PG1 greater than 6.2, then the student will either fail if PG2 is lower than or equal to 4.0, or otherwise pass. With this information, teachers can build action plans of individualized learning for students classified under this rule. Figure 11 shows a similar decision tree, slightly more complex, where we are able to find patterns and rule analogously to the previous example of Figure 10; the difference in this test is that PG2 was removed, and we used the PGs PG1 and PG3.

4.4. Students Follow-Up

In this last subsection of the experimentation, we intend to address, possibly the most complex aspect, concerning student follow-up. For this challenge, we tried to predict the results of the students in the last year based on the results obtained in the previous academic courses (Figure 12).
We used a subset of the original dataset, including only students who belong to the database area, where the subjects are obviously similar. Figure 12 shows the decision tree we obtained with this experiment, and Table 8 shows the results achieved.
Table 9 shows the classification errors for the last academic year. The decision tree predicts that a particular student (i.e., instance 166) will fail, whereas the current situation is that the student will pass.
We have to find the reason among PGs. This instance has a lower qualification for a PG of 4.9. A similar explanation could be applied for instances 182 and 187, both of them with some PG below 5. Something more unknowable happens with instance 247, as well as 300, as they have PG not below 5 but still between 5 and 6. Therefore, these are the typical instances that belong to the outlier definition, between classes.
In Table 10, we can find the opposite perspective. Now, the decision tree predicts that a particular student (i.e., instance 160) will pass, whereas the current situation is that the student will fail. Again, it is important to depict and describe these results which depend on the PG. The system predicts that the student passes because some of the partial qualifications are high: instances 160, 233, and 238 are only low in PG3, although quite lower compared to the former PG1 and PG2.

5. Discussion and Conclusions

We carried out a complete series of experiments with the aim of establishing the best correlations between the input variables and the result, which is the prediction of whether the student will pass a certain subject or not.
The first and direct experiment was to use the FGs, but this fact did not represent a big step of our system (Figure 8). This was the reason why we used the PGs (Figure 9, Figure 10 and Figure 11) that were the most influential variables. With all the PGs, we obtained a high accuracy for predicting the FG (or, to be more precise, the final situation, i.e., pass or fail) of 96.5%. If we removed PG3, the accuracy became 91.5%, whereas removing PG2 the precision became93%. In addition, Figure 5 shows interesting correlations among the variables (e.g., how some areas influenced more than others).
These experiments have combined the selection of different PGs choice, as well as follow-up of the students. The results obtained by the experiments allow us to reach conclusions about the creation of action plans to avoid drop-out in the classrooms and to personalize the student follow-up as much as possible, as well as to make valuable information available to the student that allows them to evaluate their academic performance so that they take improvement actions in the subjects that have the highest risk of failing.
We need to continue collecting data to be able to do more tests and more follow-up to continue improving the prediction of the FGs. A future work that must be deepened is to group students according to different criteria—for example: FGs, affinities by area of knowledge, performance per semester, etc.
In this manuscript, we have proposed a methodology to monitor and predict grades in education. The objective of this approach was to obtain the best prediction results so that in a following work we can develop an individualized learning system. This approach led us to group students who meet certain common conditions—for example, those who have taken the same subjects and who have approved those subjects in the same academic period. This is not an easy task, since engineering students usually have very irregular behaviors when passing the required subjects of their curriculum. This is closely related to the fact that for engineering degrees, repetition rates are high, especially in subjects related to mathematics or engineering. For future research, it would be interesting to combine other variables, so that the prediction can be made based on similar academic patterns.
In the present study, an analysis of FGs was carried out by knowledge areas, such as database or network infrastructure areas. This is intended to justify that the grades in a subject can be predicted from student grades in the previous academic years of the subject. For example, the FGs of the course Database Certification can be predicted from the FGs of the subjects Databases I, Databases II, and Database Administration, while the FGs of the subject Certification of Networks can be predicted from the FGs of the subjects Networks I and Networks II.
As a result of the research carried out in the institution, the authorities of the university approved the change in the percentage assigned to each PG (PG), as we explained in the development of the work. In this way, it was possible to improve the grades and academic performance of students in the PG3, as well as reduce the rate of student absenteeism at the end of each academic period (PG3).
After we have verified the model proposed, the most imminent future work is to analyze and design a big data architecture that supports the processing of the large amount of academic data that the university generates periodically. This academic data should be also complemented with other data, such as personal and socio-economic information of the student and information on the student learning assessment system, among others. This large volume of data can be increased by scaling up the proposal of this paper for all the university’s degrees. To define the project architecture, it is not recommended to use a traditional approach based on a data warehouse; rather, due to the nature of the proposed project, it will be necessary to create a documented, scalable, and flexible database that can support large indexing and data consultation by students, teachers, and educational administrators. Therefore, we plan to design an architecture that uses big data tools, such as Hadoop and MongoDB, in parallel.

Author Contributions

D.B.-F. made the following contributions to the study: performed literature review, the conception and design of the study, acquisition and pre-processing of data and drafting the article. S.L.-M. made the following contributions to the study: critical revision, drafting the article and approval of the submitted version. D.G. contributed to the following: acquisition of data, analysis, and interpretation of data, drafting the article and approval of the submitted version. All authors read and approved the final manuscript.

Funding

This work was supported in part by the Spanish Ministry of Science, Innovation and Universities through the ProjectECLIPSE-UA under Grant RTI2018-094283-B-C32.

Conflicts of Interest

The authors declare no conflict of interest.

References

  1. United Nations. Sustainable Development Goals. Available online: http://www.undp.org/content/undp/en/home/sustainable-development-goals.html (accessed on 16 February 2019).
  2. Shields, L.; Newman, A.; Satz, D. Equality of Educational Opportunity. In Stanford Encyclopedia of Philosophy; Zalta, E., Ed.; Stanford University: Stanford, CA, USA, 2017. [Google Scholar]
  3. Paura, L.; Arhipova, I. Cause Analysis of Students’ Dropout Rate in Higher Education Study Program. Procedia Soc. Behav. Sci. 2014, 109, 1282–1286. [Google Scholar] [CrossRef]
  4. Mula, I.; Tilbury, D.; Ryan, A.; Mader, M.; Dlouha, J.; Mader, C.; Benayas, J.; Dlouhý, J.; Alba, D. Catalysing Change in Higher Education for Sustainable Development. Int. J. Sustain. High. Educ. 2017, 18, 798–820. [Google Scholar] [CrossRef]
  5. Visvizi, A.; Lytras, M.D.; Daniela, L. Education, Innovation and the Prospect of Sustainable Growth and Development. In The Future of Innovation and Technology in Education: Policies and Practices for Teaching and Learning Excellence; Emerald Publishing Limited: Bingley, UK, 2018; pp. 297–305. [Google Scholar]
  6. Casanova, D.; Moreira, A.; Costa, N. Technology Enhanced Learning in Higher Education: results from the design of a quality evaluation framework. Procedia Soc.Behav. Sci. 2011, 29, 893–902. [Google Scholar] [CrossRef]
  7. Daniela, L.; Kalniņa, D.; Strods, R. An Overview on Effectiveness of Technology Enhanced Learning (TEL). Int. J. Knowl. Soc. Res. 2017, 8, 79–91. [Google Scholar] [CrossRef]
  8. Lee, J.; Choi, H. What affects learner’s higher-order thinking in technology-enhanced learning environments? The effects of learner factors. Comput. Educ. 2017, 115, 143–152. [Google Scholar] [CrossRef]
  9. Castro, F.; Vellido, A.; Nebot, À.; Mugica, F. Applying Data Mining Techniques to e-Learning Problems. In Evolution of Teaching and Learning Paradigms in Intelligent Environment; Springer: Berlin/Heidelberg, Germany, 2007; pp. 183–221. [Google Scholar]
  10. Villegas-Ch, W.; Luján-Mora, S.; Buenaño-Fernandez, D.; Palacios-Pacheco, X. Big Data, the Next Step in the Evolution of Educational Data Analysis. In Proceedings of the International Conference on Information Technology & Systems (ICITS), Santa Elena, Ecuador, 10–12 January 2018; pp. 138–147. [Google Scholar]
  11. Buenaño-Fernandez, D.; Villegas-CH, W.; Luján-Mora, S. The use of tools of data mining to decision making in engineering education—A systematic mapping study. Comput. Appl. Eng. Educ. 2019, 27, 744–758. [Google Scholar]
  12. Romero, C.; Ventura, S. Educational Data Mining: A Review of the State of the Art. IEEE Trans. Syst. Man Cybern. Part C (Appl. Rev.) 2010, 40, 601–618. [Google Scholar] [CrossRef]
  13. Baker, R.S.; Yacef, K. The State of Educational Data Mining in 2009: A Review and Future Visions, 1. Int. Educ. Data Min. Soc. 2009, 1, 3–17. [Google Scholar]
  14. Baker, R.S. Data mining for education. Int. Encycl. Educ. 2010, 7, 112–118. [Google Scholar]
  15. Elbadrawy, A.; Polyzou, A.; Ren, Z.; Sweeney, M.; Karypis, G.; Rangwala, H. Predicting Student Performance Using Personalized Analytics. Computer 2016, 49, 61–69. [Google Scholar] [CrossRef]
  16. Piekarski, M.L. Student Retention - An issue, a discussion and a way forward. Brittany Cotter Cobek Softw. Ltd. 2013, 1, 29–35. [Google Scholar]
  17. Márquez-Vera, C.; Cano, A.; Romero, C.; Noaman, A.Y.M.; Fardoun, H.M.; Ventura, S. Early dropout prediction using data mining: A case study with high school students. Expert Syst. 2016, 33, 107–124. [Google Scholar] [CrossRef]
  18. Khalifa, S.; Elshater, Y.; Sundaravarathan, K.; Bhat, A.; Martin, P.; Imam, F.; Rope, D.; Mcroberts, M.; Statchuk, C. The Six Pillars for Building Big Data Analytics Ecosystems. ACM Comput. Surv. 2016, 49, 33. [Google Scholar] [CrossRef]
  19. Provost, F.; Fawcett, T. Data Science and its Relationship to Big Data and Data-Driven Decision Making. Big Data 2013, 1, 51–59. [Google Scholar] [CrossRef]
  20. Sin, K.; Muthu, L. Application of big data in educationDATA mining and learning analytics—A literature review. ICTACT J. Soft Comput. 2015, 5, 1035–1049. [Google Scholar] [CrossRef]
  21. Lu, O.H.; Huang, A.Y.; Huang, J.C.; Lin, A.J.; Ogata, H.; Yang, S.J. Applying learning analytics for the early prediction of students’ academic performance in blended learning. Educ. Technol. Soc. 2018, 21, 220–232. [Google Scholar]
  22. Gil, D.; Fernández-Alemán, J.; Trujillo, J.; García-Mateos, G.; Luján-Mora, S.; Toval, A. The Effect of Green Software: A Study of Impact Factors on the Correctness of Software. Sustainability 2018, 10, 3471. [Google Scholar] [CrossRef]
  23. Hong, S.J.; Weiss, S.M. Advances in predictive models for data mining. Pattern Recognit. Lett. 2001, 22, 55–61. [Google Scholar] [CrossRef]
  24. Brooks, C.; Thompson, C. Predictive Modelling in Teaching and Learning. In Handbook of Learning Analytics; Lang, C., Siemens, G., Wise, A., Gasevic, D., Eds.; Society for Learning Analytics Research (SoLAR): Ann Arbor, MI, USA, 2017; pp. 61–68. [Google Scholar]
  25. Rechkoski, L.; Ajanovski, V.V.; Mihova, M. Evaluation of grade prediction using model-based collaborative filtering methods. In Proceedings of the 2018 IEEE Global Engineering Education Conference (EDUCON), Tenerife, Spain, 17–20 April 2018; pp. 1096–1103. [Google Scholar]
  26. Bydžovská, H. Are Collaborative Filtering Methods Suitable for Student Performance Prediction? In Proceedings of the Progress in Artificial Intelligence - 17th Portuguese Conference on Artificial Inteligence (EPIA), Coimbra, Portugal, 8–11 September 2015; pp. 425–430. [Google Scholar]
  27. Polyzou, A.; Karypis, G. Grade prediction with models specific to students and courses. Int. J. Data Sci. Anal. 2016, 2, 159–171. [Google Scholar] [CrossRef]
  28. Thai-Nghe, N.; Drumond, L.; Krohn-Grimberghe, A.; Schmidt-Thieme, L. Recommender system for predicting student performance. Procedia Comput. Sci. 2010, 1, 2811–2819. [Google Scholar] [CrossRef]
  29. Khan, B.; Khiyal, M.S.H.; Khattak, M.D. Final Grade Prediction of Secondary School Student using Decision Tree. Int. J. Comput. Appl. 2015, 115, 32–36. [Google Scholar] [CrossRef]
  30. Sedkaoui, S.; Khelfaoui, M. Understand, develop and enhance the learning process with big data. Inf. Discov. Deliv. 2019, 47, 2–16. [Google Scholar] [CrossRef]
  31. Dahdouh, K.; Dakkak, A.; Oughdir, L.; Ibriz, A. Large-scale e-learning recommender system based on Spark and Hadoop. J. Big Data 2019, 6, 2. [Google Scholar] [CrossRef]
  32. Godfrey, P.; Gryz, J.; Lasek, P. Interactive Visualization of Large Data Sets. IEEE Trans. Knowl. Data Eng. 2016, 28, 2142–2157. [Google Scholar] [CrossRef]
Figure 1. Methodology proposed.
Sustainability 11 02833 g001
Figure 2. Subjects by area of knowledge.
Sustainability 11 02833 g002
Figure 3. Trend of students’ grades with greatest deviations highlighted with a red circle.
Sustainability 11 02833 g003
Figure 4. Visualization and correlation with all data after loading the dataset.
Sustainability 11 02833 g004
Figure 5. Initial dataset loaded in the system.
Sustainability 11 02833 g005
Figure 6. Variation of the final grades (FGs) (FG) of the four students.
Sustainability 11 02833 g006
Figure 7. Retention and dropout rates by cohort.
Sustainability 11 02833 g007
Figure 8. Decision tree with all the variables from the dataset.
Sustainability 11 02833 g008
Figure 9. Decision tree without the FG.
Sustainability 11 02833 g009
Figure 10. Decision tree without PG3.
Sustainability 11 02833 g010
Figure 11. Decision tree without PG2.
Sustainability 11 02833 g011
Figure 12. Decision tree to predict the results of the students in the last year.
Sustainability 11 02833 g012
Table 1. Sample of the dataset.
Academic PeriodSubject NamePG1PG2PG3FGAreaSituation
2016-1General Physics8.04.46.36.2Mathematics and PhysicsPass
2017-1Communication Theory6.05.65.35.7InfrastructureFail
2017-1Digital Electronics4.48.16.96.4ElectronicsPass
Table 2. Dropout number per cohort.
Academic PeriodTotal New EnrolmentDropout 6 MonthsDropout 12 MonthsDropout 18 MonthsDropout 24 MonthsDropout 30 MonthsDropout 36 Months
2016-167122129323638
2016-229614171719
2017-15713252625
2017-220445
2018-1681624
2018-2359
Table 3. Statistics of subject Data Structures (ACI220).
CriteriaStatistics 2016-2Statistics 2017-1Statistics 2017-2Statistics 2018-1
Total new enrolment51374618
Average of grades5.85.66.37.4
Pass rate65%65%72%83%
Fail rate35%35%33%17%
Table 4. Statistics of subject Operating Systems (ACI740).
CriteriaStatistics 2017-2Statistics 2018-1Statistics 2018-2
Total new enrolment272640
Average of grades7.06.37.4
Pass rate89%70%100%
Fail rate11%31%0%
Table 5. Values for the accuracy of the decision tree and the confusion matrix using all attributes.
Correctly Classified Instances6358100%
Incorrectly Classified Instances00%
=== Confusion Matrix ===
ab<-- classified as
12910|a = Fail
05067|b = Pass
Table 6. Values for the accuracy of the decision tree and the confusion matrix without the FG.
Correctly Classified Instances613996.5%
Incorrectly Classified Instances2193.5%
=== Confusion Matrix ===
ab<-- classified as
1122169|a = Fail
505017|b = Pass
Table 7. Values for the accuracy of the decision trees (without PG3 and PG2, respectively) and the confusion matrix.
Correctly Classified Instances581591.5%
Incorrectly Classified Instances5438.5%
=== Confusion Matrix ===
ab<-- classified as
961330|a = Fail
2134854|b = Pass
Correctly Classified Instances591593%
Incorrectly Classified Instances4437%
=== Confusion Matrix ===
ab<--classified as
937354|a = Fail
894978|b = Pass
Table 8. Values for the accuracy of the decision tree and the confusion matrix.
Correctly Classified Instances37193%
Incorrectly Classified Instances287%
=== Confusion Matrix ===
ab<-- classified as
5919|a = Fail
9312|b = Pass
Table 9. Classification errors for the last academic year.
Instance: 166Instance: 182
Academic period: Sem 2018-1Academic period: Sem 2018-1
Subject: ACI770- Multidimensional DatabaseSubject: ACI770- Multidimensional Database
PG1: 6.0PG2: 8.0PG3: 4.9PG1: 8.7PG2: 4.7PG3: 5.6
Predicted Situation: FailPredicted Situation: Fail
Situation: PassSituation: Pass
Instance: 187Instance: 247
Academic period: Sem 2018-2Academic period: Sem 2018-2
Subject: ACI530-Database ISubject: ACI630- Database II
PG1: 4.6PG2: 7.8PG3: 5.7PG1: 5.8PG2: 5.4PG3: 6.6
Predicted Situation: FailPredicted Situation: Fail
Situation: PassSituation: Pass
Instance: 300
Academic period: Sem 2018-2
Subject: ACI810- Database Administration
PG1: 6.1PG2: 5.9PG3: 5.9
Predicted Situation: Fail
Situation: Pass
Table 10. Classification errors for the last academic year.
Instance: 160Instance: 233
Academic period: Sem 2018-1Academic period: Sem 2018-2
Subject: ACI770- Multidimensional DatabaseSubject: ACI630-Database II
PG1: 6.1PG2: 6.0PG3: 2.9PG1: 7.7PG2: 6.1PG3: 4.0
Predicted Situation: PassPredicted Situation: Pass
Situation: FailSituation: Fail
Situation: PassSituation: Pass
Instance: 235Instance: 238
Academic period: Sem 2018-2Academic period: Sem 2018-1
Subject: ACI530- Database ISubject: ACI630- Database II
PG1: 6.5PG2: 5.7PG3: 5.4PG1: 7.0PG2: 6.8PG3: 4.3
Predicted Situation: PassPredicted Situation: Pass
Situation: FailSituation: Fail
Instance: 279Instance: 358
Academic period: Sem 2018-2Academic period: Sem 2018-2
Subject: Aci630- Database IISubject: ACI040- Database certification
PG1: 5.9PG2: 6.5PG3: 5.3PG1: 5.4PG2: 6.0PG3: 5.0
Predicted Situation: PassPredicted Situation: Pass
Situation: FailSituation: Fail

