Article

A Simple GIS-Based Model for Urban Rainstorm Inundation Simulation

School of Environmental and Geographical Sciences, Shanghai Normal University, Shanghai 200234, China
*
Author to whom correspondence should be addressed.
Sustainability 2019, 11(10), 2830; https://doi.org/10.3390/su11102830
Submission received: 5 April 2019 / Revised: 26 April 2019 / Accepted: 13 May 2019 / Published: 17 May 2019
(This article belongs to the Special Issue Future Cities: Urban Planning, Infrastructure and Sustainability)

Abstract

:
With rapid urbanization, floods that occur are more frequently associated with non-riverine, urban flooding. Reliable and efficient simulation of rainstorm inundation in an urban environment is profound for risk analysis and sustainable development. Although sophisticated hydrodynamic models are now available to simulate the urban flooding processes with a high accuracy, the complexity and heavy computation requirement render these models difficult to apply. Moreover, a large number of input data describing the complex urban underlying surfaces is required to setup the models, which are typically unavailable in reality. In this paper, a simple and efficient urban rainstorm inundation simulation method, named URIS, was developed based on a geographic information system (GIS) with limited input data. The URIS method is a simplified distributed hydrological model, integrating three components of the soil conservation service (SCS) module, surface flow module, and drainage flow module. Cumulative rainfall-runoff, output from the SCS model, feeds the surface flow model, while the drainage flow module is an important waterlogging mitigation measure. The central urban area of Shanghai in China was selected as a study case to calibrate and verify the method. It was demonstrated that the URIS is capable of characterizing the spatiotemporal dynamic processes of urban inundation and drainage under a range of scenarios, such as different rainstorm patterns with varying return periods and different alterations of drainage diameters. URIS is therefore characterized with high efficiency, reasonable data input, and low hardware requirements and should be an alternative to hydrodynamic models. It is useful for urgent urban flood inundation estimation and is applicable for other cities in supporting emergency rescue and sustainable urban planning.

1. Introduction

Urban floods occur frequently worldwide, and their losses and impacts are increasing rapidly [1,2,3]. With sustained economic growth and urbanization in China progressing at an unprecedented speed, the characteristics of flood risk have also changed [2,4]. According to the statistical data of the Chinese Bulletin of Flood and Drought Disasters, from 2006 to 2016, more than 100 cities were flooded every year. Floods, which have caused more serious losses and management difficulties in urban areas than in rural areas, have attracted attention in the field of disaster risk mitigation and management around the world [3].
Effective urban flooding simulation and forecasting is a beneficial tool for urgent flooding risk assessment and emergency management. Normally, the modeling approaches for urban flooding can be divided into three categories according to their calculation method, i.e., the hydrodynamic method, hydrologic method, and simplified method. The hydrodynamic methods are the most commonly used approach in urban flooding forecast, and they have the advantages of producing the spatiotemporal evolution of runoff based on physical laws, such as DHI MIKE Urban [5], InfoWorks CS [6], Sobek [7], and storm water management model (SWMM) [8]. The disadvantage is the requirement of detailed input data and substantial computational power. Many hydrologic models have now become available in urban flooding modeling, including the rapid flood spreading methodology (RFSM) [9], GIS-based urban flood inundation model (GUFIM) [10], urban storm inundation simulation method (USISM) [11], and so on. These models are based on water balance equations and have the advantage of a fast computational speed. The tradeoff is the lack of flow and inundation process simulations. Consequently, a simplified modeling approach that fulfills both rapid flooding calculation and inundation process simulation is a meaningful research direction for urgent flooding dynamic forecasting.
Many studies have been done on flooding inundation process simulation with simplified models at both the basin and regional scale [3,12,13,14,15,16,17,18]. Jacobs (2018) developed a flooding inundation modeling tool called Flood Modeller, which simulates the flooding of rivers, floodplains, and urban areas using simplified 1D and 2D hydraulics [19]. Chen et al. (2009) developed a flooding model in an urban environment, considering the cumulative surface runoff and flooding propagation based on a geographic information system (GIS) platform [10]. Zhang et al. (2014) proposed the flood connected domain calculation (FCDC) method to estimate riverine flood inundation [20,21]. They showed that the FCDC method can accurately simulate the flooding inundation processes associated with river flooding and dike breach. All the above mentioned methods simulate the inundation processes based on simplified hydraulic algorithms; however, most of them are designed to simulate fluvial rather than pluvial flooding, because the rainfall-runoff generation is not included in the model.
The soil conservation service-curve number (SCS-CN) model is one of the most widely used surface rainfall-runoff models because of its simple structure and the few parameters required [22]. To overcome the limitations of the SCS-CN model in terms of simulation ability, researchers have proposed a physically-based catchment distribution model and introduced field measurements to correct the two important parameters of the model, i.e., CN values and standard values, λ [23,24,25]. Such a distributed hydrological model fully considers the various changes of physical factors in the temporal and spatial dimensions and can be used to estimate total runoff, base flow, and infiltration, etc. on a large scale [23,26]. Furthermore, the application of physically-based distribution models has been strongly supported by the recent development of the Green–Ampt infiltration model, the slope manifold model, numerical calculation, and finite difference techniques [27,28,29,30]. Moreover, technologies, such as remote sensing (RS) and geographic information system (GIS), have made the acquisition, processing, and analysis of basin-wide scale data more convenient so that the distributed hydrological model can more accurately simulate flows on complex underlying surfaces [31,32]. These modern technologies are now widely used to improve river basin management, water conservation engineering and design, urban flood control, hydrological forecasting, etc.
With the increasing risk of urban flooding, the distributed hydrological model was proven to be useful in simulating rainfall runoff and flooding propagation in urban areas, which had successfully been applied to the cities of Tianjin, Nanjing, and Nanchang in China [27,29,33,34,35,36,37,38]. High-resolution spatiotemporal simulation of urban flooding is crucial for the provision of accurate results for risk assessment and to improve the effectiveness of disaster risk management. Therefore, it is an important development trend of urban waterlogging simulation. However, the dynamic modeling of urban flooding on the coupling of surface flow and drainage flow is not enough, and the simulation of the waterlogging drainage process needs further exploration. Moreover, artificial pavements (buildings) and underground drainage systems are the key factors affecting rainstorm flooding in urban areas [39]; since the classic SCS model did not consider these factors, it needs to be improved.
The aim of this research is to develop a simple and efficient urban rainstorm inundation simulation method with limited input data. A semi-physical distributed hydraulic model based on a GIS platform, named urban rainstorm inundation simulation (URIS), was developed. The model can simulate the high-resolution spatiotemporal dynamic processes of urban rainstorm waterlogging under a range of storm events. Hydrological tools in ArcGIS (by ESRI) and a coupling solution linking the enhanced SCS model, the surface flow model, and the drainage flow model were used to simulate the rainstorm waterlogging process in an urban environment. Taking the Shanghai downtown area (the former Jing’an District) in China as the study site, the newly developed model was tested with scenarios of different storm conditions of varying return periods and different alterations of drainage diameters.

2. Methodology

2.1. Model Development

2.1.1. SCS Runoff Model

The rainfall-runoff was calculated with the SCS model. The SCS model has been widely used to estimate runoff for small catchments [40,41,42]. It was developed based on a water balance relationship, Equation (1), and two basic hypothesizes, i.e., (1) the proportional equalization or linear hypothesis of Equation (2), and (2) the hypothesized relationship between the initial loss and potential maximum retention of Equation (3). The total rainfall is then divided into three parts, including initial loss, post-loss, and surface runoff, formulated as follows:
P = I a + F + Q ,
F S = Q P I a ,
I a = λ S ,
where P is the rainfall (unit: mm); Ia is the initial rainfall loss (unit: mm); F is the real retention (post-loss) (unit: mm); S is the potential retention capacity (the upper limit of the post-loss) (unit: mm); Q is the surface runoff depth (unit: mm); and λ is the dimensionless initial loss coefficient, which mainly depends on local geographic and climatic factors and generally ranges from 0 to 0.4 [40,41]. When plugged in, the classic rainfall runoff equation is obtained with only one parameter to solve, and it is assumed that there is no surface runoff when the initial loss is small:
Q { ( P λ S ) 2 P + ( 1 λ ) S P λ S 0 P < λ S .
Normally, the value of S varies significantly [0, 25146] [40,41]; for convenience, a curve number (CN) is introduced to help determine S [43]:
S = 25400 C N 254 ,
where CN is an integrated parameter reflecting the characteristics of underlying surfaces; theoretically, the value of the range is [1, 100], and the actual application range is [40, 98] [44].
Based on the land use maps interpreted from remote sensing (RS) images and soil classification standard of the “Shanghai Soil” provided by the Shanghai Soil Census Office, the soil types of the study area were divided into four classes (i.e., A, B, C, and D, in the order of decreasing permeability). Moreover, according to the Antecedent Moisture Condition (AMC) of different soil types, each soil class can be further divided into three categories, namely, dry (AMCI), average (AMCII), and wet (AMCIII). The standard method, referred to as the “annual flood series”, was used to determine the CN values of different underlying surfaces [43,45]. In this research, the CN values of nine land use types in an urban environment were determined following the suggestion by Urban Hydrology for Small Watersheds, as shown in Table 1 [43].

2.1.2. Combining the Surface Runoff Model and Drainage Model

1. SCS Model Improvement
The Shanghai urban area is an artificial environment; the influence of the regulation facility is crucial for urban flooding mitigation. However, the classic SCS model only calculates the surface rainfall runoff and does not consider the surface flow propagation and underground drainage system. Therefore, the classic SCS model needs to be improved before application. The specific improvement scheme is shown in Figure 1.
According to water balance, the antecedent runoff condition (ARC) in an urban environment is mainly related to the hydrological processes of redistributing storm waters among plant retention, infiltration, evaporation, surface runoff, and underground drainage. Normally, urban flooding is determined by surface runoff; however, underground drainage has an important effect on flooding mitigation. Based on this, the new water balance equation of the improved SCS model in urban environments is extended to:
P = I a + F + Q + S e + E ,
where Se is the pipe network flow (unit: mm) and E is the evaporation value (unit: mm).
Water losses caused by evaporation (E) only account for less than 0.5% of the total precipitation amount [11] due to the small scale of the urban area and relatively short duration of precipitation. Therefore, E is neglected in the modeling. Drainage flow (Se) is important for urban flooding simulation. In the model, parameters, such as pipe diameter and pipe length, are important. They have key influences on the resultant drainage capacity and need to be collected. Surface runoff (Q) is calculated using the SCS model on the basis of Equations (4) and (5). Generally, an average value of λ = 0.2 is used in natural watershed environments [40,41]. In urban environments (except for some small parts of green spaces), however, most of the ground is covered with impervious pavement where water permeability is very weak. Therefore, a small initial loss coefficient of λ = 0.05 is used according to a large number of field measurements [11].
In order to implement distributed hydrological simulation, the study area was divided into multiple sub-catchments that were centered at manholes. By referencing the CN value in Table 1 and the ratio of various land use types in each sub-catchment, the weighted comprehensive CN value ( C N ¯ ) for each sub-catchment was derived using the following equation:
C N ¯ = i = 1 n A r e a i · C N i A r e a ,
where A r e a i is the area of various land use types in each sub-catchment (unit: m2); Area is the total area of the sub-catchment (unit: m2); and C N i is the CN value of land use type i in Table 1.
2. Surface Flow Modeling
Rainfall runoff is essentially a special type of gravity slope flow, which generally has a shallow water depth (at millimeter level). Since the flow is continuously replenished with rainfall along the path, the processes of mass conservation and momentum conservation are complicated, and there is no simple analytical model has been obtained so far [29,33]. In this research, a slope flow model similar to the isochrone unit method and a grid pursuing method along the flow path were used to simplify the process [29,33]. Thus, the flow path, flow direction, and flow velocity in each sub-catchment were simulated.
First, the study area was discretized into square grids based on the digital elevation model (DEM). The input variables are time series rainfall lattices; the rainfall loss and actual runoff of each grid were obtained based on the ARC. Then, the flow direction of every grid driven by gravity was calculated using the elevation difference between a grid and its surrounding grids. Finally, the accumulated runoff of each sub-catchment was obtained by summing the runoff on each grid, and an iteration of the calculation along the flow path in a grid-by-grid sequence to the manhole was performed. The convention of eight flow directions in the neighborhood grids is denoted by 2n, where 1, 4, 16, 64 means a perpendicular direction flow, and 2, 8, 32, 128 means an oblique direction flow.
Based on the maximum weighted distance difference between the central grid and the surrounding grids, the total flow distance, L, was obtained by the summation of all grids (maximum weighted distance) along the path to the manhole:
L = j = 1 n i a j 2 l j 2 + η j 2 ,
where n i is the total number of grids that the i-th grid flow has passed through; l j is the grid resolution (unit: m); η j is the height difference between the center grid and the neighborhood grids (unit: m); and a j is the edge length coefficient, which is decided by directions: a j = 1 when flow is in a perpendicular direction, and a j = 2 when flow is in an oblique direction, a positive value indicating outflow, and a negative value indicating inflow.
The estimation of flow velocity is important for waterlogging simulation, especially under heavy precipitations [2]. In this study, we assumed that the flow velocity considers the nonlinear effect of the precipitation supplement disturbance, when the rainfall intensity is large (p ≥ 0.05S) [46,47]; otherwise, the study area was divided into several blocks with fixed flow speeds. Considering the flat landform in Shanghai, the flow velocity was set to a constant value of 0.2 m/s. By a combination of the above two categories, the slope flow velocities were formulated as follows [48]:
V = { k ( Q + q ) a ( η j a j l j ) b P 0.05 S 0.2 P < 0.05 S ,
where V is the flow velocity (unit: m/s); Q is the surface runoff depth (unit: m); q is the runoff depth (unit: m); k is the surface comprehensive resistance coefficient, estimated by the Darcy coefficient [29,33]; and a and b are constants, generally falling within the ranges of 0.40 < a < 0.67 and 0.18 < b < 0.33, respectively [29,33]. In this research, a = 0.40 and b = 0.30 were used for impervious surfaces and a = 0.50 and b = 0.18 were used for urban green lands [49].
1. Drainage Flow Modeling
• Pipeline Flow
The underground drainage flow, characterized as a dynamic nonlinear flow, is also forced by gravity if the pumping station is not considered. In pipeline flow calculations, the complex pipe network system is generalized into a network composed of several loops. The urban drainage network is a directed network diagram [50]. In practice, the manholes are considered as nodes, the pipelines are links (edges), and the flow direction is the linking direction. Therefore, establishing a drainage network model is equivalent to establishing a network diagram composed of nodes, links, and directions.
Head loss occurs during drainage flow due to the friction of the pipe wall, and the flow velocity is estimated with the Chezy equation [51,52]:
v = C R Δ d ,
Δ d = Δ h / P 2 Δ h 2 ,
R 2 A / π ,
where v is the flow velocity (unit: m/s); R is the hydraulic radius (unit: m); A is the flow area (unit: m2); Δd is the hydraulic slope; P is the pipeline length (unit: m); Δh is the elevation difference between the upper and lower ends of the pipeline (unit: m); and C is the Chezy coefficient (unit: m0.5/s), estimated with the Manning equation determined by the pipeline material.
In the Shanghai urban area, there are three main types of pipelines, i.e., concrete pipelines, cast iron pipelines, and steel pipelines. The pipeline material is labeled in the property sheet. The roughness coefficient of concrete pipe is set to a value from 0.012 to 0.023 according to the smoothing of the inner wall; that of the cast iron pipe is set to a value from 0.011 to 0.016 depending on whether the inner wall is protected; and that of the steel pipe is set to a value from 0.011 to 0.015 depending on the welding method.
Finally, the flow rate along the ith pipe section, q i (unit: m3/s), is expressed as:
q i = π v i R i 2 / 2 .
• Pipe Flow on Nodes
The drainage system is composed of multiple manholes, outlets, and connections. The hydraulic calculation of the drainage flow is to solve the continuity equation, i.e., the water is balanced at every node where the incoming flow (defined as positive) equals the outgoing flow (defined as negative) at every node:
q i ( m n ) + Q k = 0 ,
where Q k is the flow rate at node k; q i (m n) is the flow rate of pipeline i, which connects to node k; and m and n are the start and end node identity of pipeline i.
The flow rate at the boundary node must be introduced first to solve the above equations, i.e., the manhole inflow rate is derived from the surface flow model.
2. Model Coupling
The GIS platform was used to integrate the models. A coupling approach was customized in the Model Builder of ArcGIS to link the SCS runoff generation model, the surface flow model, and the underground drainage model.
The essential idea of the coupling method was to build the semi-physical model in every sub-catchment and then calculate the actual surface runoff, the inflow rate of manholes, and the flows in the pipelines. Specifically, the steps were as follows: Firstly, the study area was divided into sub-catchments using manholes and DEM elevations in the form of a raster grid; secondly, the underlying land use type and hydrometeorological conditions were assumed to be constant within the same grid, but to vary between raster grids, then the runoff generation, Equation (4), of the improved SCS model was used to calculate the actual runoff depth, Q, of each grid in each time step; thirdly, hydrological analysis tools in ArcGIS were used to extract the flow path and the flow direction for each sub-catchment, and the total flow length, L, was calculated by Equation (8); fourthly, the flow velocity, V, was calculated by Equation (9) in a raster-by-raster manner, and the total flow rate into the manhole was calculated by the spatial superposition and time accumulation of surface flow in a raster-by-raster manner along the path to the manhole; as a result, the water flow into the drainage system was introduced as an external boundary condition of pipe flow, and finally, the water redistribution in the drainage system was calculated with Equations (13) and (14), according to the principle of water flow continuity. The structure of modules includes:
  • Data input module. Provide spatial data input, including rainfall pattern editing, land use classification, sub-catchment division, and pipe network connectivity editing.
  • SCS rainfall-runoff module. Provide surface runoff calculation based on the raster grid, the Thiessen partition of a sub-catchment, and calculation of C N ¯ for each sub-catchment.
  • Surface flow module. Extract hydrological parameters, such as the elevation, slope, aspect, and flow direction. Simulate surface runoff by calculating the flow path, flow speed, and the maximum weighted distance to the manhole for each sub-catchment.
  • Drainage flow module. Establish the feature database of the directed pipe-network with spatial topological relationships. Build the attribute database with attributes, such as pipe caliber, material, elevation, and so on, and relate the attribute database to the feature database.
By customizing the above modules, the generation of surface runoff, flow sinking, and drainage discharge was realized. The space looping control code was implemented by the superposition of the Thiessen partition boundary and the DEM in each sub-catchment.

2.2. Model Application

2.2.1. Study Area

Shanghai is located in the Yangtze River Delta, East China, under the influence of Eastern Asia’s monsoon climate. Annual average precipitation is 1170 mm, and heavy precipitations occur mainly from May to September, with rainfalls in summer accounting for more than 60% of the annual total amount. The first sewerage in Shanghai can be sourced to the 1850s. The city currently has more than 3500 km of municipal drainage pipelines, 64,000 manholes, and a drainage network penetration rate of 78%. Investigations have shown that Shanghai has 14 large waterlogging prone areas with a 0.2 to 0.5 m flooding depth lasting for more than 3 h when moderate or heavy rainfall occurs [36,53,54].
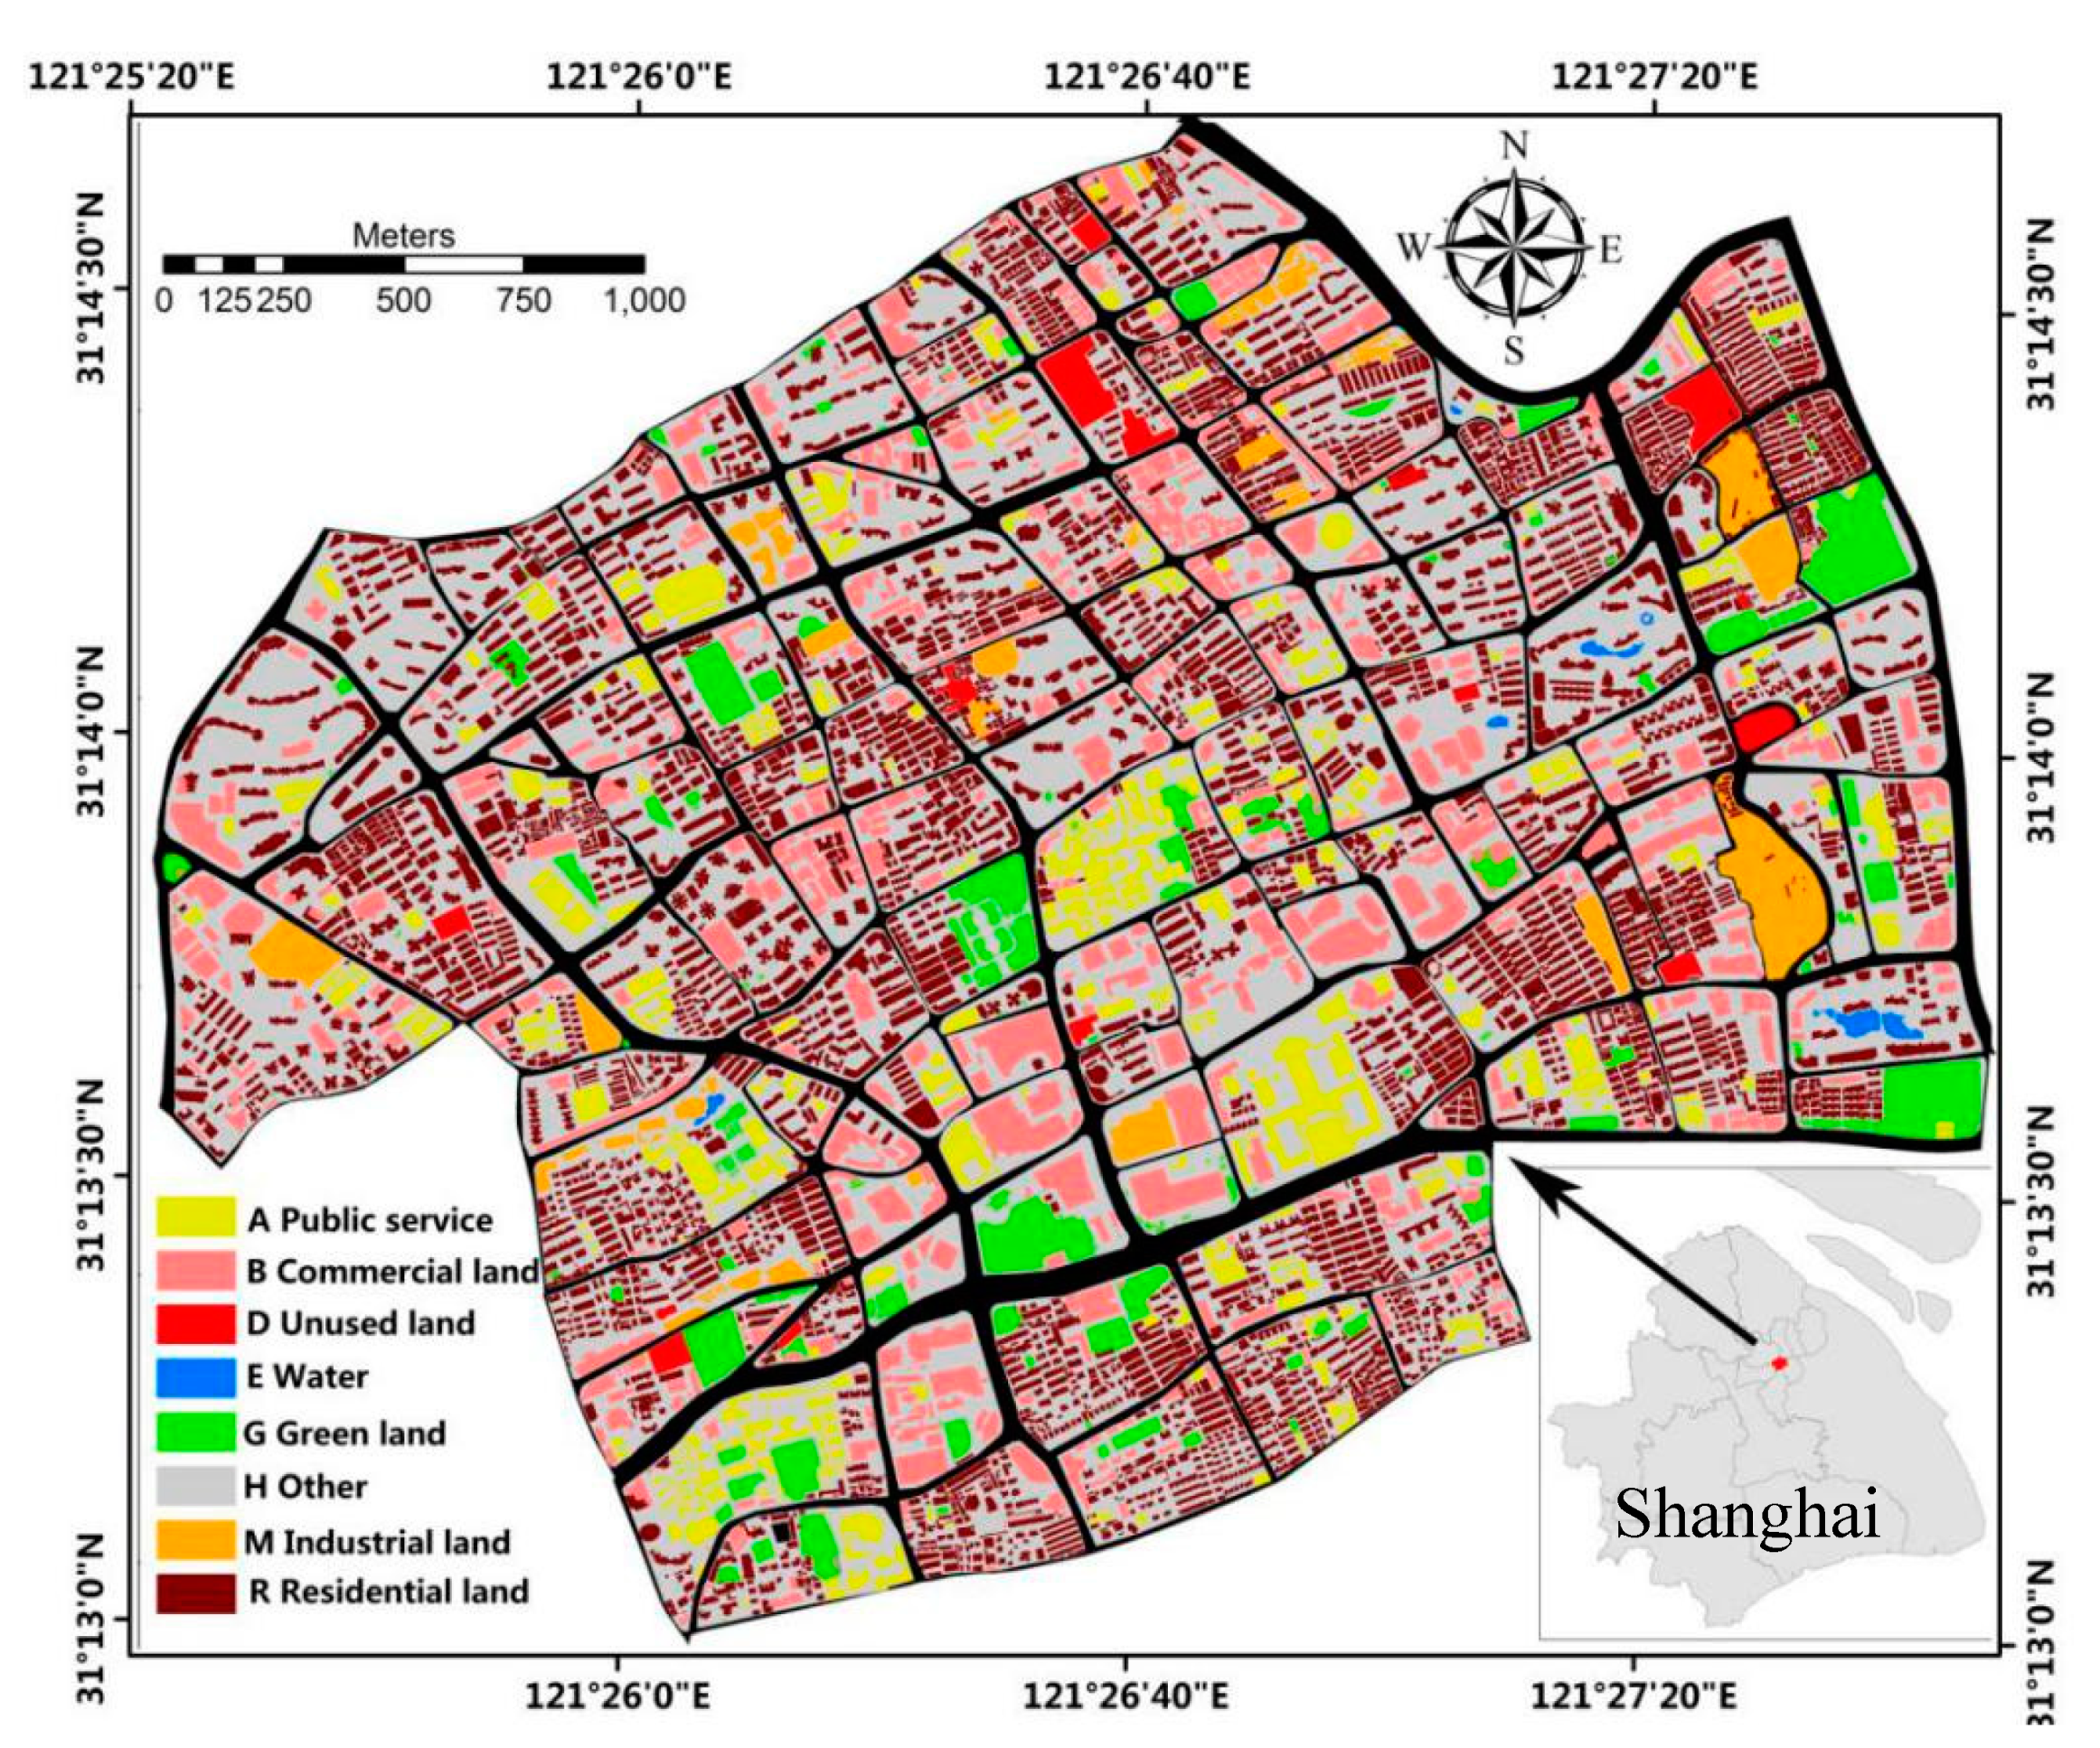
The former Jing’an District located in the central area of Shanghai was selected as an example to test the model. It is one of the regions most often impacted by waterlogging [38]. The total area is approximately 7.62 km2, i.e., 2.9 km long from east to west and 2.7 km wide from north to south (Figure 2). The average population density in this district is very high, up to 40,000 per km2. The district is committed to establishing a high-quality residential area, high-grade central business district, and an international commercial area [55]. However, due to the low land elevation and high building density, waterlogging disasters occur frequently during the rainy season. Therefore, it is meaningful to study the risks of rainstorm-waterlogging in the area.

2.2.2. Data Used

The data sources of this research included land use data, a topographic surveying map, manhole, pipe-network, and archived precipitation data. The data were preprocessed before use.
1. Land Use Data
The land use data were derived from the 2012 aerial image with a resolution of 0.25 m. The land use of the study area was divided into seven categories: Residential (R), commercial (B), industrial (M), public management and public service (A), green land and square (G), water (E), and unused land (D). The above layers were first merged into one layer and then resampled to a 2 m × 2 m resolution. The grid value, reflecting the land use distribution (Figure 2), was used to calculate the CN value in the SCS runoff model (see Table 1).
2. Manholes and Drainage Network
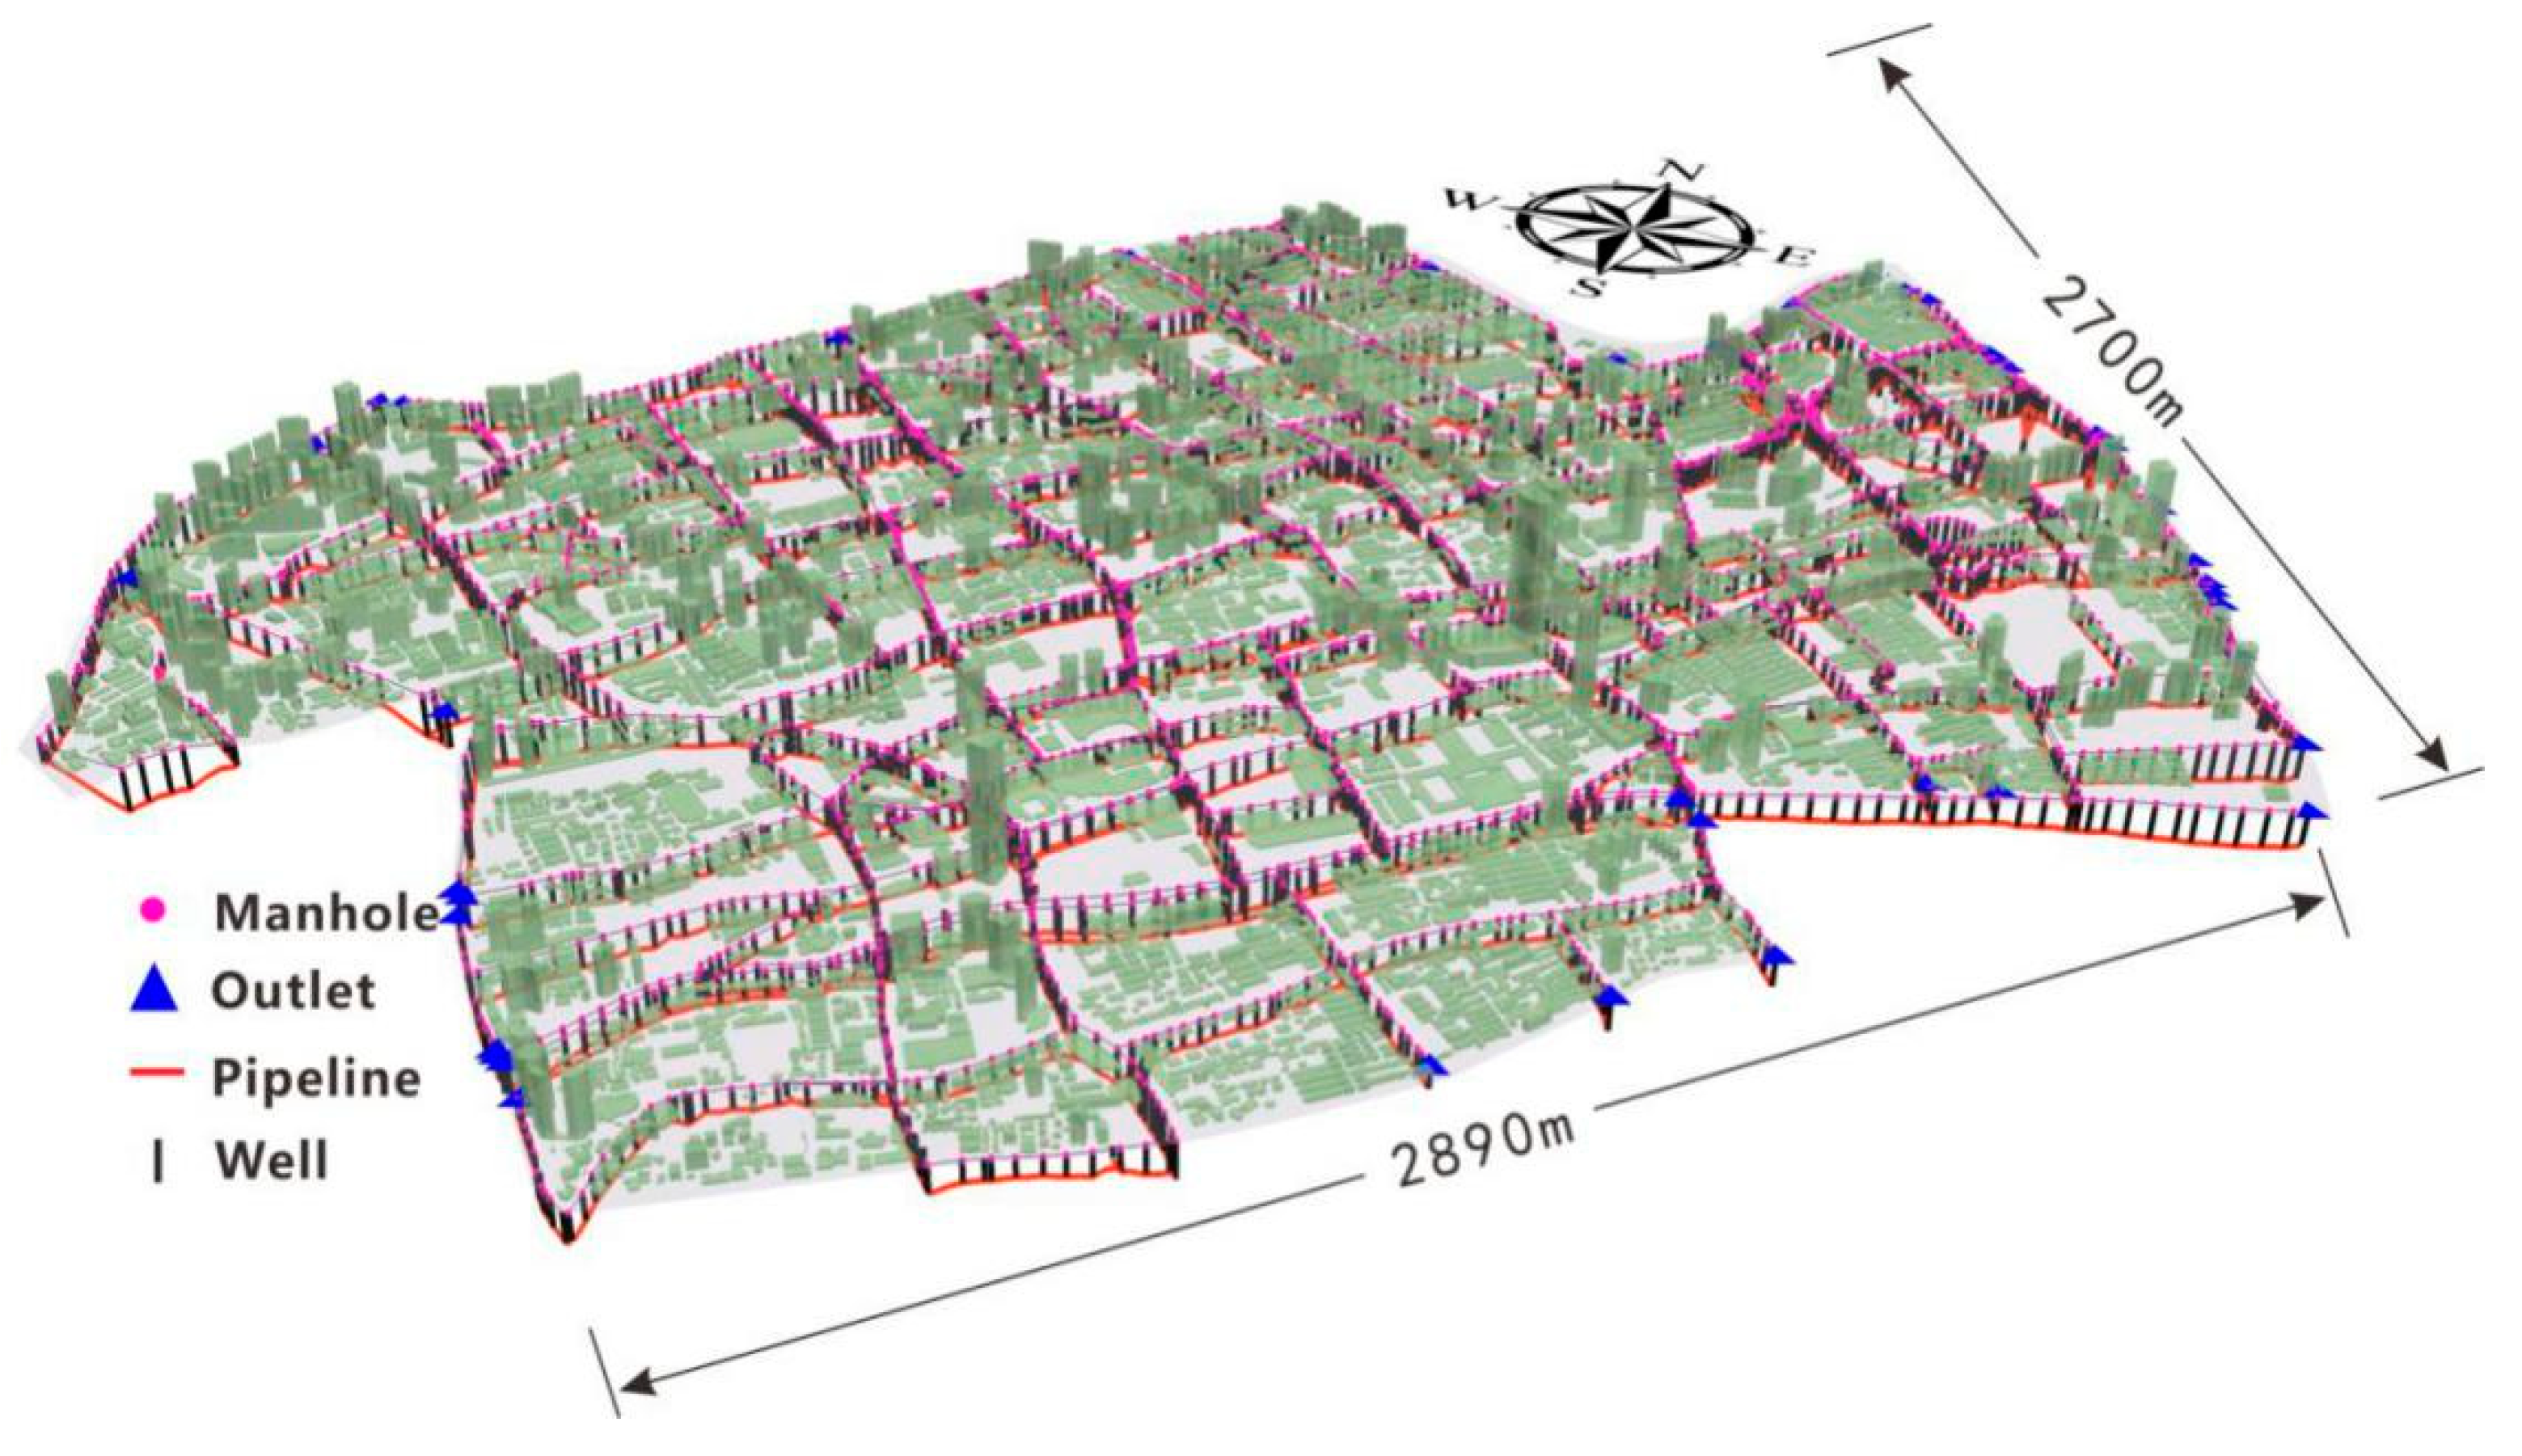
The municipal drainage data, derived from the Shanghai Drainage Company, are composed of manholes and pipelines. The drainage design standard of the study area is to resist one-year-return rainstorms. The pipe network was manually interpreted from the original computer aided design (CAD) data and converted into the vector data format in ArcGIS to establish a network diagram. The drainage system distributed across the study area includes 2872 pipelines, with a total length of 89,600 m, and the average depth is 2.48 m. There are 2748 manholes located inside the study area and 45 outlets located around the margin of the study area (Figure 3). Manhole properties include identity, coordinate, caliber, ground elevation, and bottom elevation; pipeline properties include identity, coordinate, pipe diameter, and pipe length (Table 2). Topological connectivity between manholes and pipelines must be well established so that manholes and pipelines are horizontally connected, and, in the vertical direction, the manhole is between the ground elevation and pipeline elevation, as seen in Figure 3.
3. Sub-Catchment
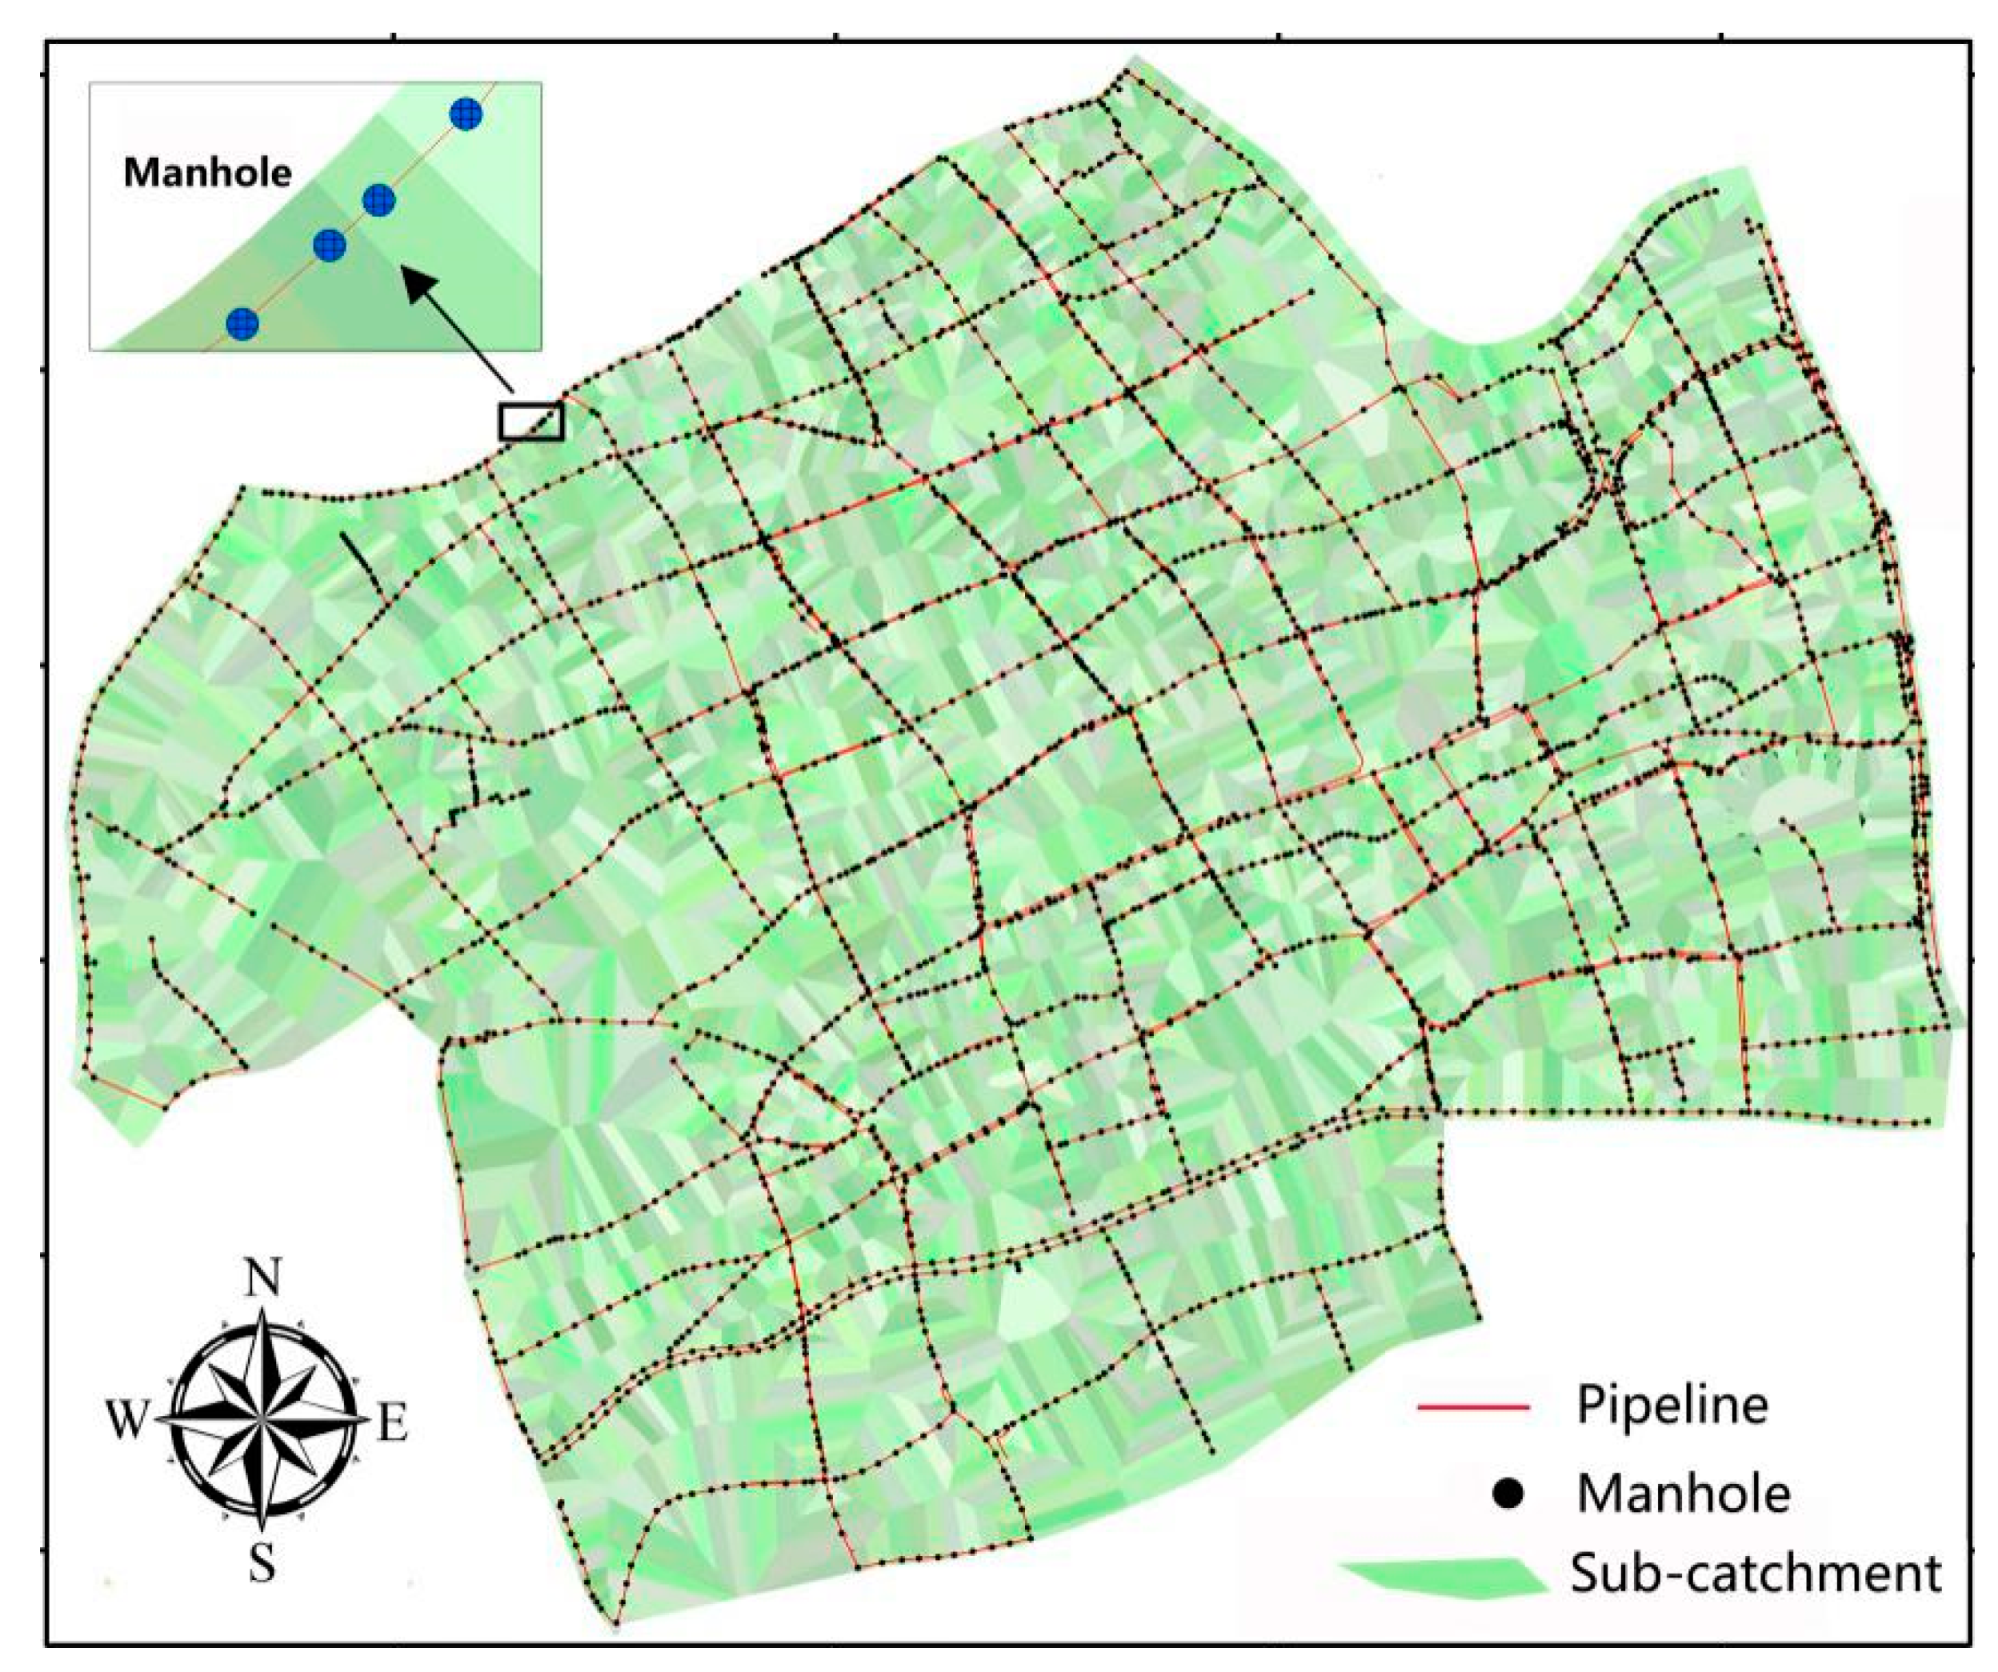
The maps of the ground surface and the base elevation of buildings were generated using a 1:500 terrain map measured by the Surveying and Mapping Institute of Shanghai. Kriging interpolation, which provides the best linear unbiased predictor of values at unsampled points, was used to generate the digital terrain model (DTM). A DTM resolution of 2 m was used to describe the land surface elevation and building base elevation. Sub-catchment division was implemented using the Thiessen partition method based on the spatial distribution of manholes. As a result, 2748 sub-catchments of different shapes were generated (Figure 4), with an average area of approximately 2800 m2; the semi-physical hydraulic model was established in each sub-catchment.
4. Rainfall Scenario
Simulations were performed under different rainfall scenarios, including different precipitation durations, intensities, and rainfall patterns. According to the rainfall intensity equation defined by the code for the design of outdoor wastewater engineering (GB50014-2006) [56], the resultant rainfall duration-return period-intensity equation of the study area was fitted with rainfall observation data from the Xujiahui weather station (1949–2012), using the annual maximum sampling method.
For a short precipitation duration (t = 5–120 min):
i p = 8.8112 + 7.8717 log T e ( t + 6.1005 ) 0.6453 .
For a long precipitation duration (t = 180–1440 min):
i p = 8.9117 + 13.5855 log T e ( t 9.3687 ) 0.7185 ,
where ip is the rainstorm intensity (unit: mm/min); Te is the return period (unit: year); and t is the precipitation duration (unit: min).
In addition to rainfall intensity, the rainfall pattern is another important factor. Single-peak rainfall, which occurs more frequently (more than 60%) than double-peak or multi-peak rainfall, has a great impact on waterlogging in Shanghai. For single-peak rainfall, a peak in the front (Poisson distribution) and in the middle (Normal distribution) is more frequent than a peak in the back [57]. Therefore, Poisson-pattern and normal-pattern rainfall was selected and combined with the duration-return period-intensity Equations (15) and (16) to test the modeling flexibility. The spatial difference of rainfall intensity was not considered in this research due to the small study area (less than 8 km2).

3. Results

3.1. Model Performance and Validation

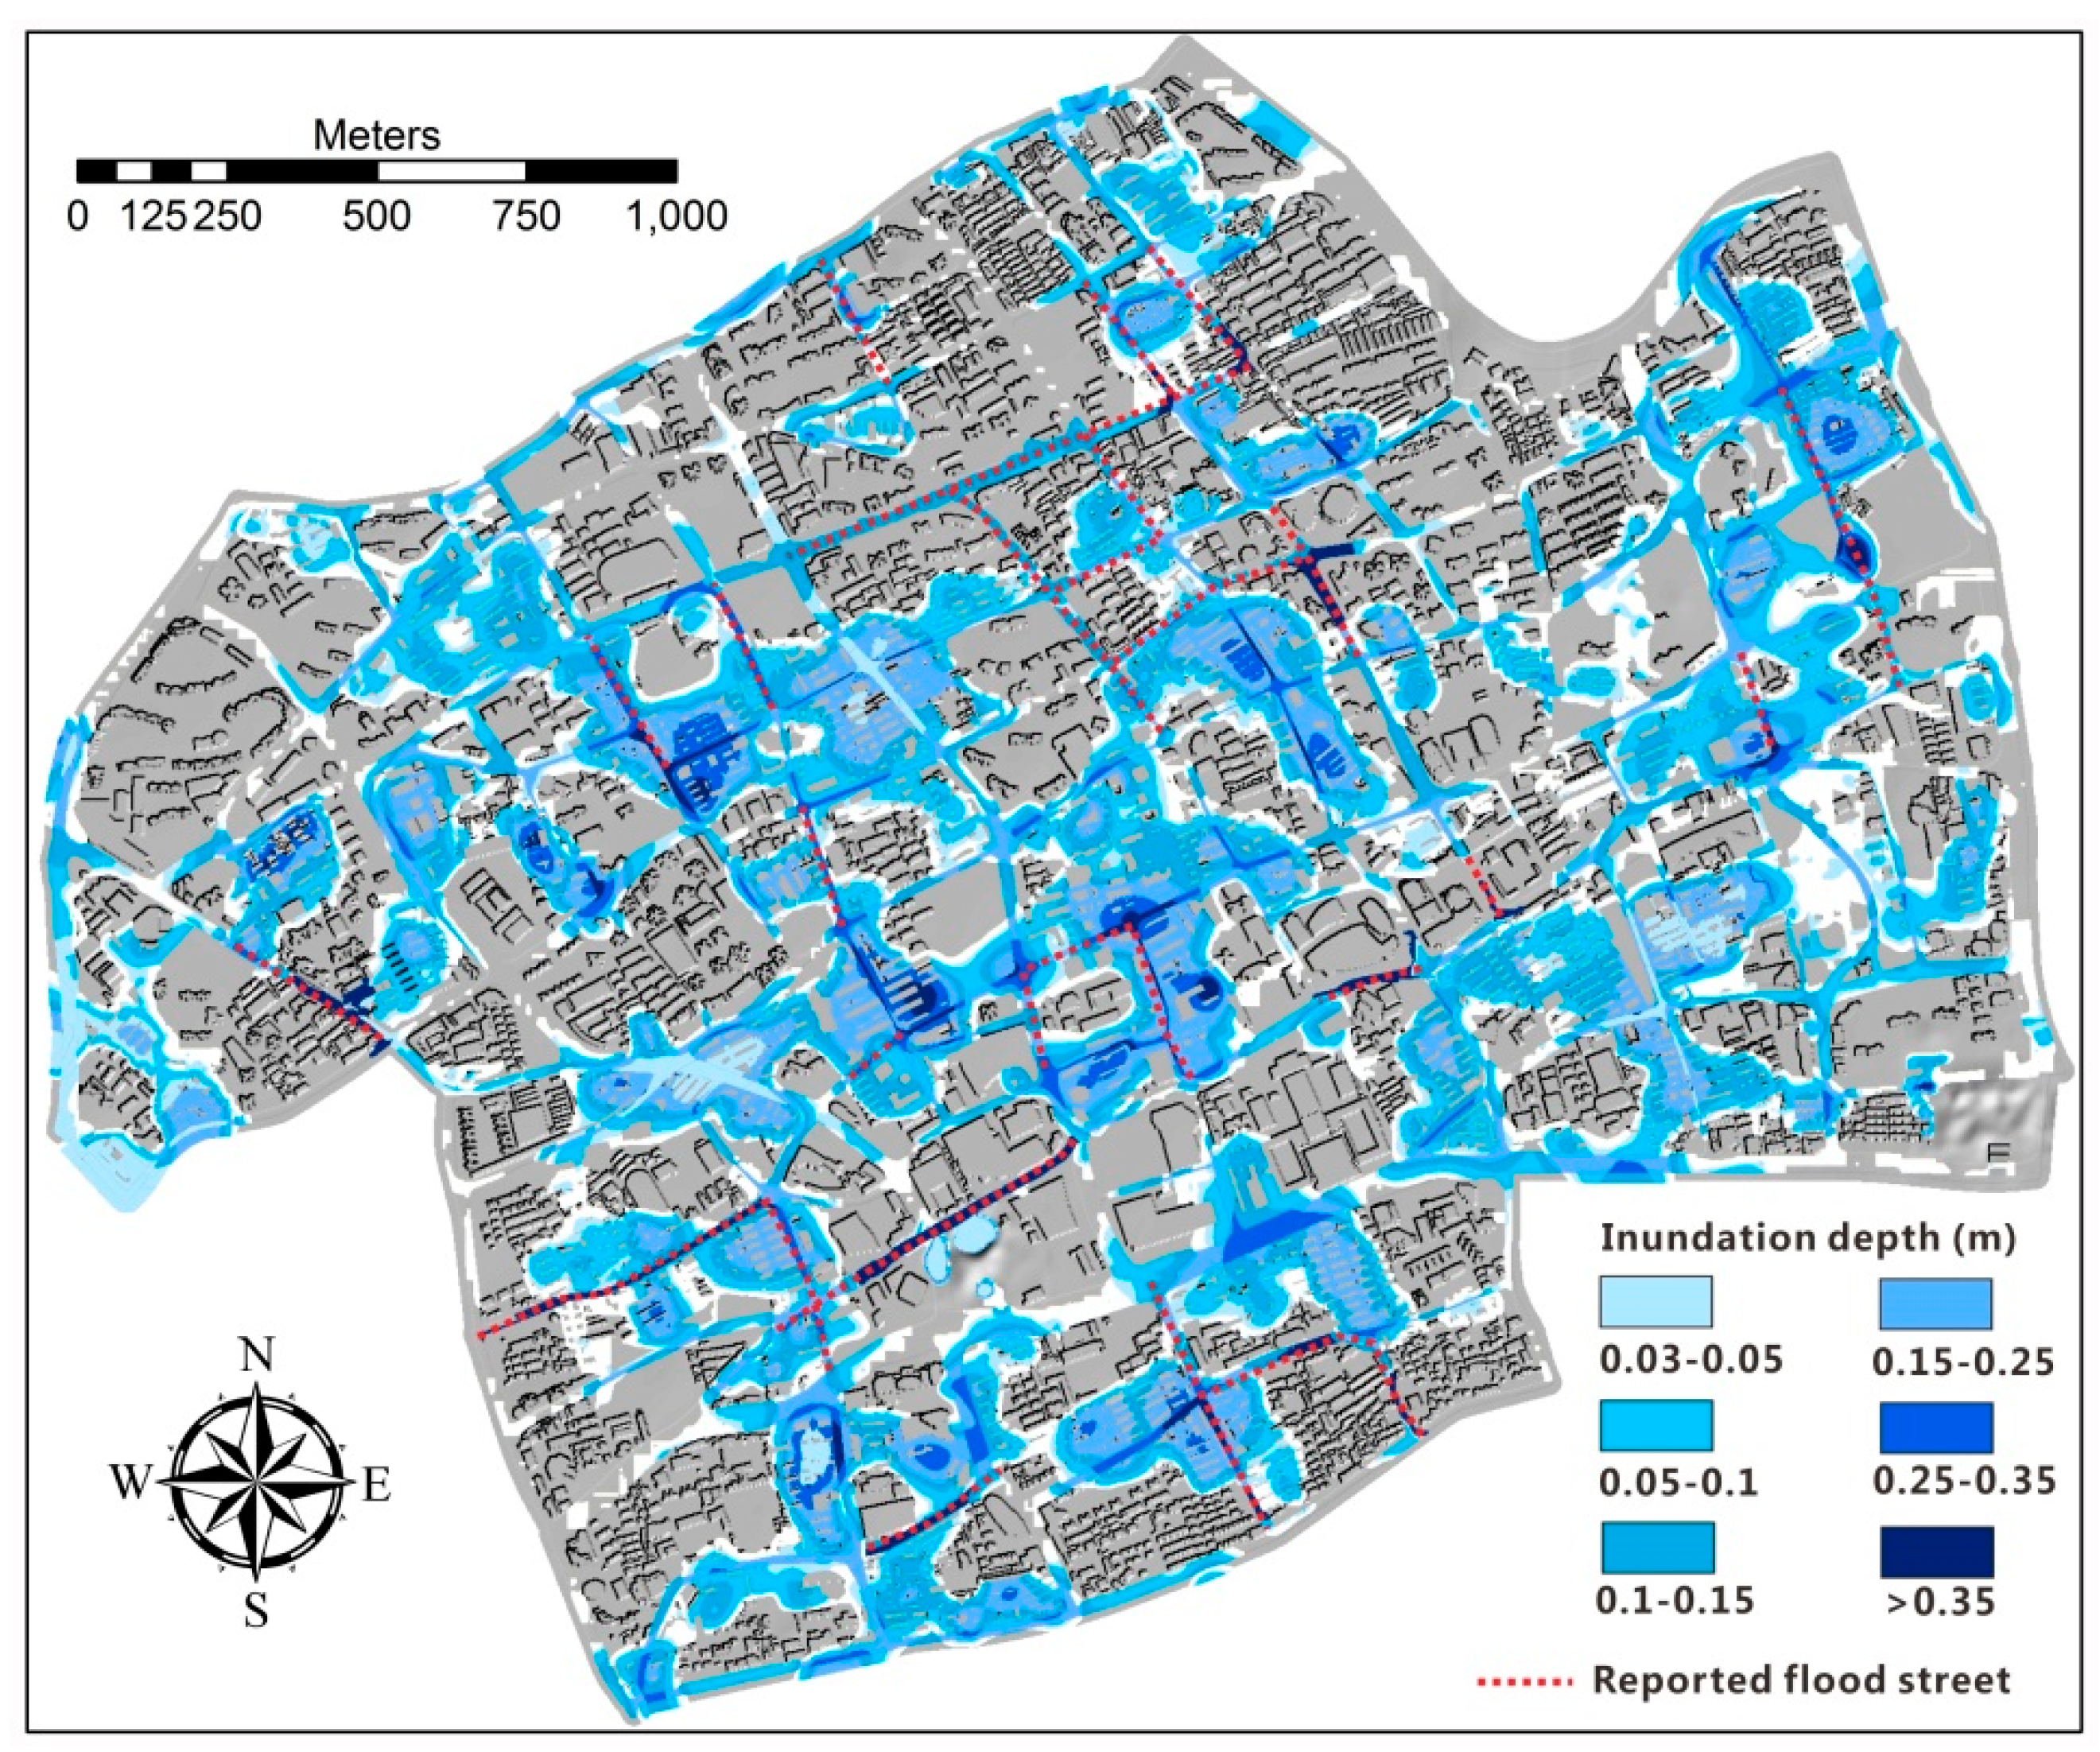
In order to evaluate the model performance, the hindcasted maximum inundation depth for the 7 August 2005 rainfall during Typhoon Matsa was compared with the monitored/reported inundation streets across the study area (Figure 5) [53,58]. Overall, agreement was good between the observed and predicted flooding distributions, especially for the streets where a water depth > 25 cm. All of the 15.3 km long reported flooding streets fall within the simulated flooding areas of water depth > 15 cm, and the majority exceeds 25 cm. However, the flooding area predicted by URIS seems to be a bit overestimated because there are more streets that are flooded compared to the reported 39 streets in this area.
The results of URIS were compared with the results of the flood map [59] under the same modeling setups. A random distribution of 20,000 sample points was generated and compared. Statistical analysis showed good agreement; the standard deviation (SD) is 0.12, the correlation coefficient (CC) is 0.89, the mean absolute error (MAE) is 0.09 m, and the root mean square error (RMSE) is 0.09 m.

3.2. Urban Surface Flooding

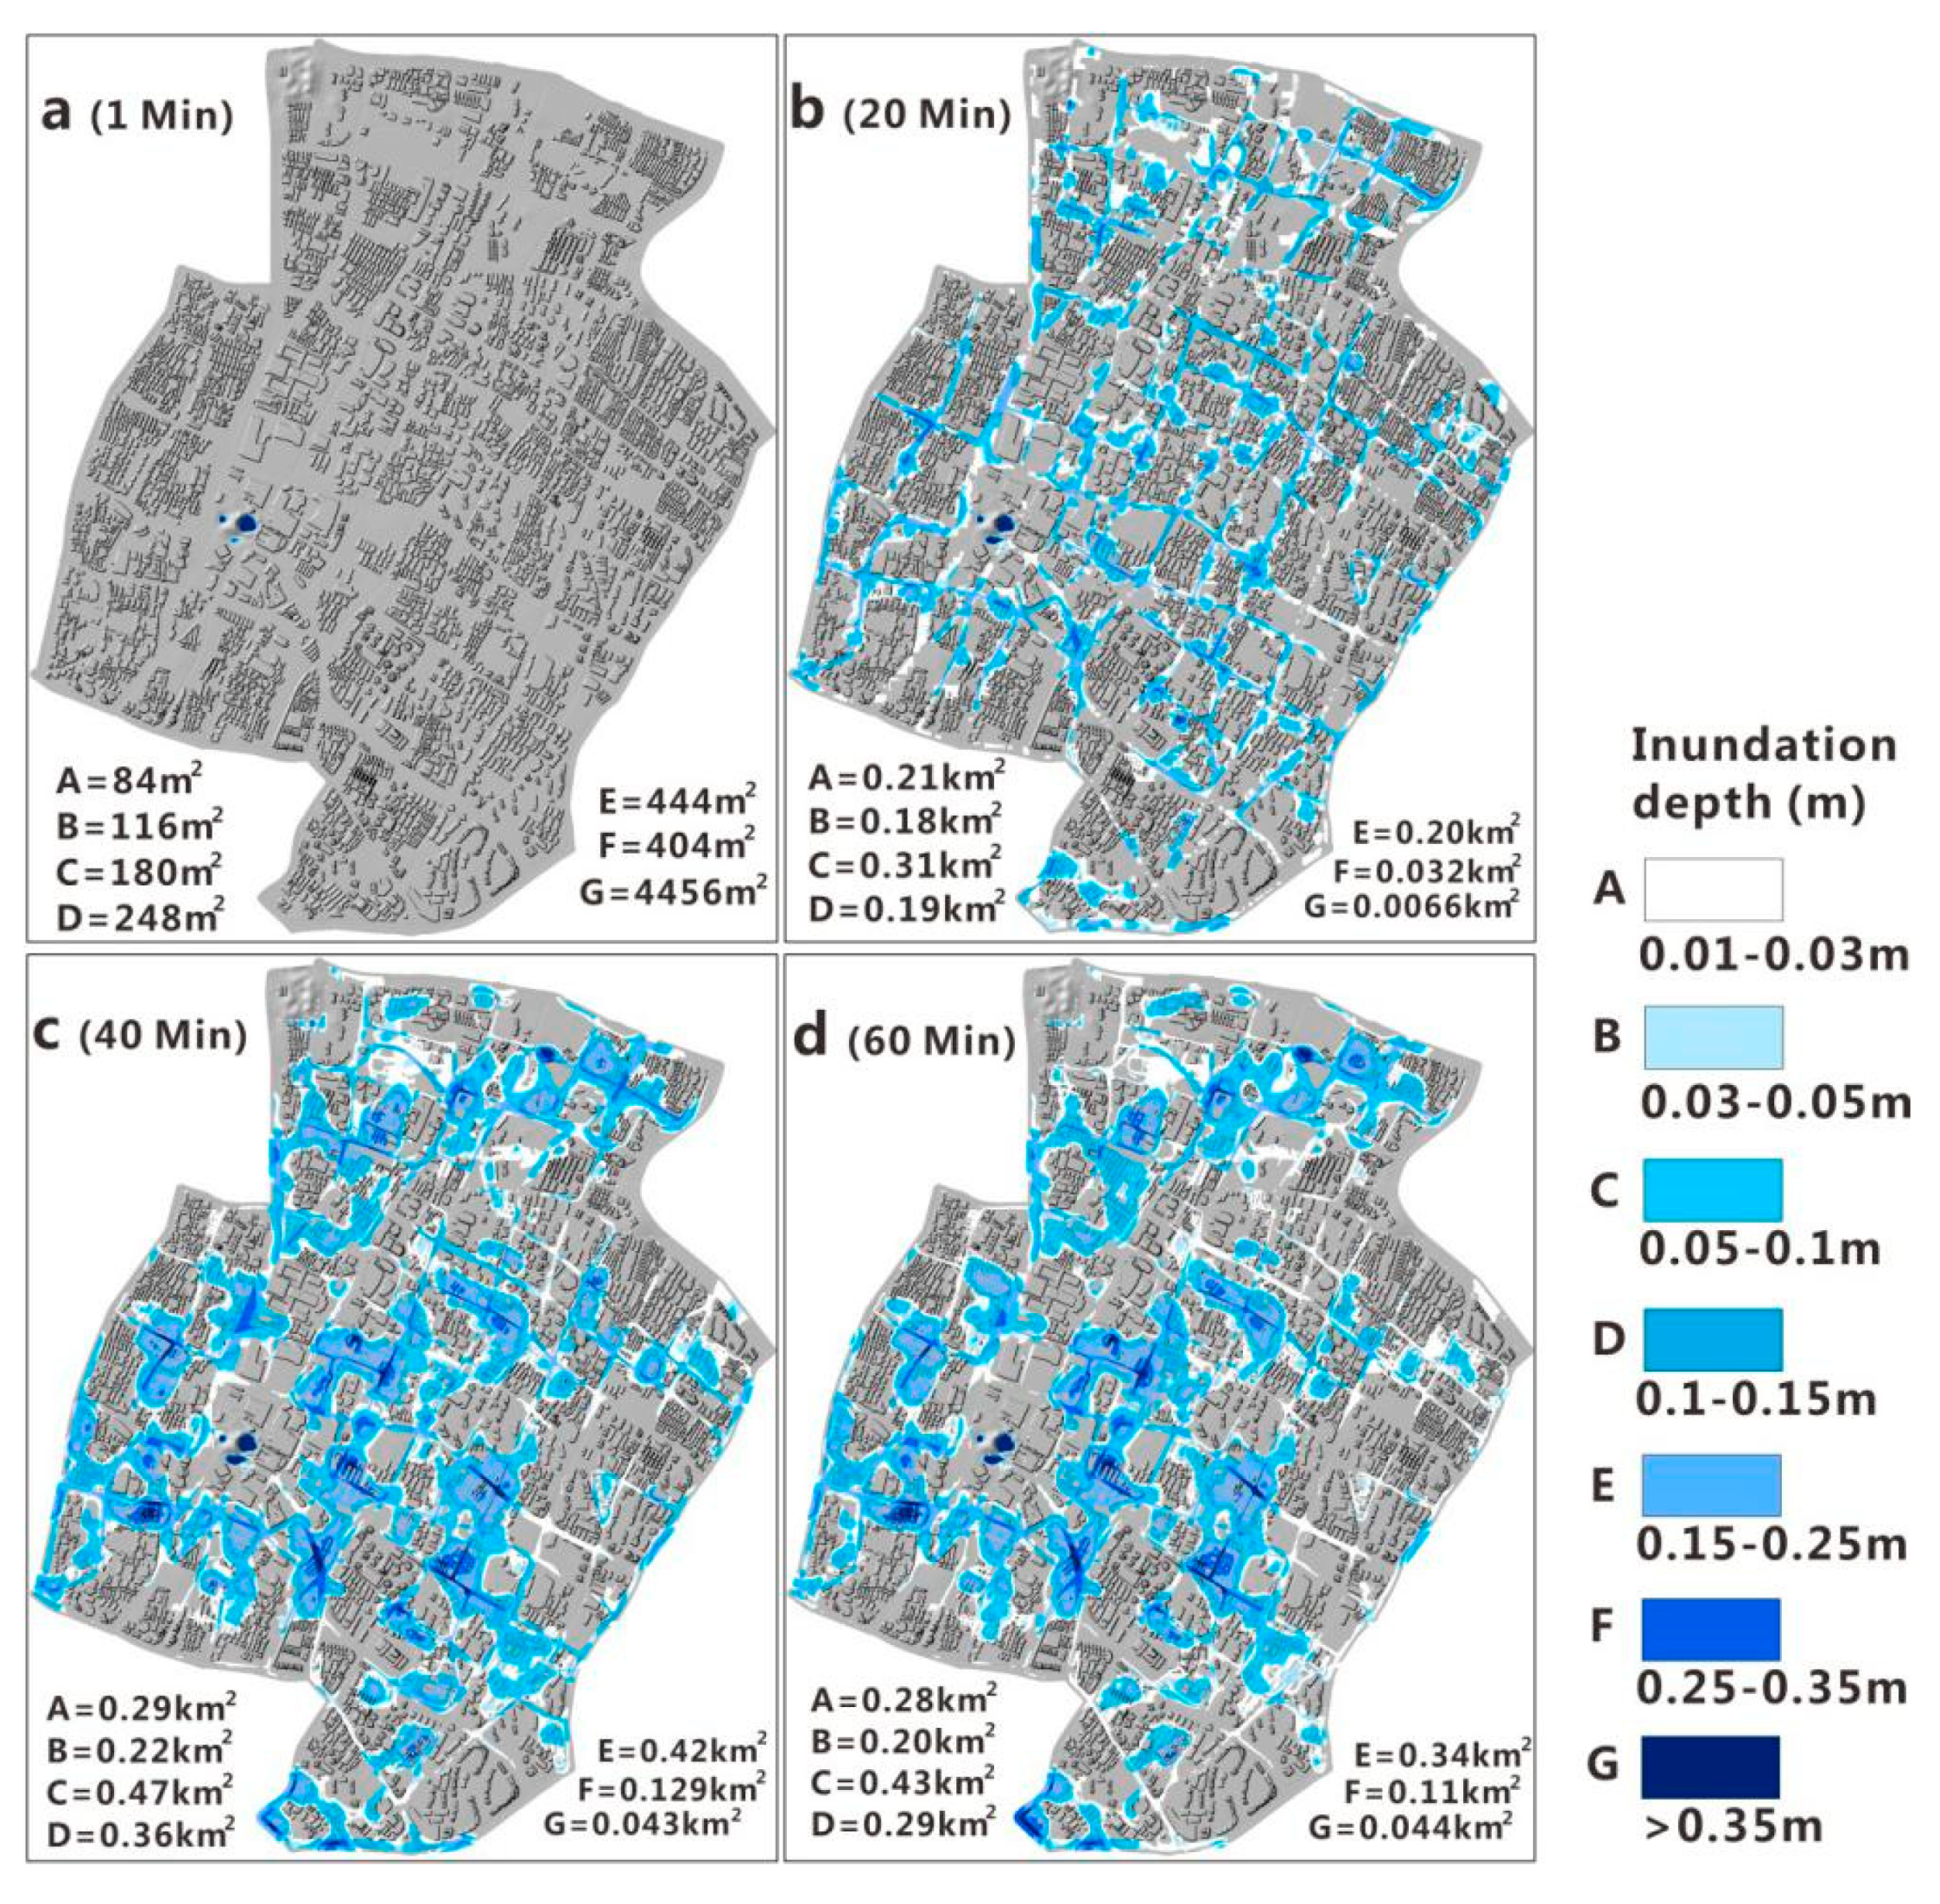
Flooding simulation in the study area was carried out under rainfall scenarios of different durations and return periods. Two single-peak rainfall patterns of a Poisson distribution and normal distribution were selected to simulate the flooding area and depth change over time. Taking 60-min Poisson-pattern rain of a 20-year return period as an example, the spatial distributions of water depth for the 1st, 20th, 40th, and 60th minutes are shown in Figure 6. In the first 40 min, the flooding area and depth increased significantly with continuous precipitation. Compared with the first 20 min in Figure 6b, the flooding area in the 40th minute in Figure 6c increased by 34%, 21%, 50%, 84%, 112%, 300%, and 543% for depths of A (0.01–0.03 m), B (0.03–0.05 m), C (0.05–0.1 m), D (0.1–0.15 m), E (0.15–0.25 m), F (0.25–0.35 m), and G (>0.35 m), respectively. However, with the decrease of rainfall intensity after the 40th minute (<0.15 mm/min) and the increase of the drainage capacity, the flooding depth decreased in some areas from the 40th minute to the 60th minute. Consistently, the flooding area in Figure 6d was reduced by 3%, 9%, 8%, 18%, 18%, and 15% compared with Figure 6c for depths of A, B, C, D, E, and F, respectively. Nevertheless, the result shows a slight increase in the area for water deeper than 0.35 m (G increased by 4% from the 40th minute to the 60th minute) because the drainage capacity reaches its peak value (28,000 m3/min) after 11 min, but rainfall runoff continuously flows into low-lying areas. After the 60th minute, waterlogging disappears gradually due to the stop of the precipitation, but the drainage and infiltration continues. The detailed changes of flood receding, and drainage processes are shown in Figure 7 and Figure 8.
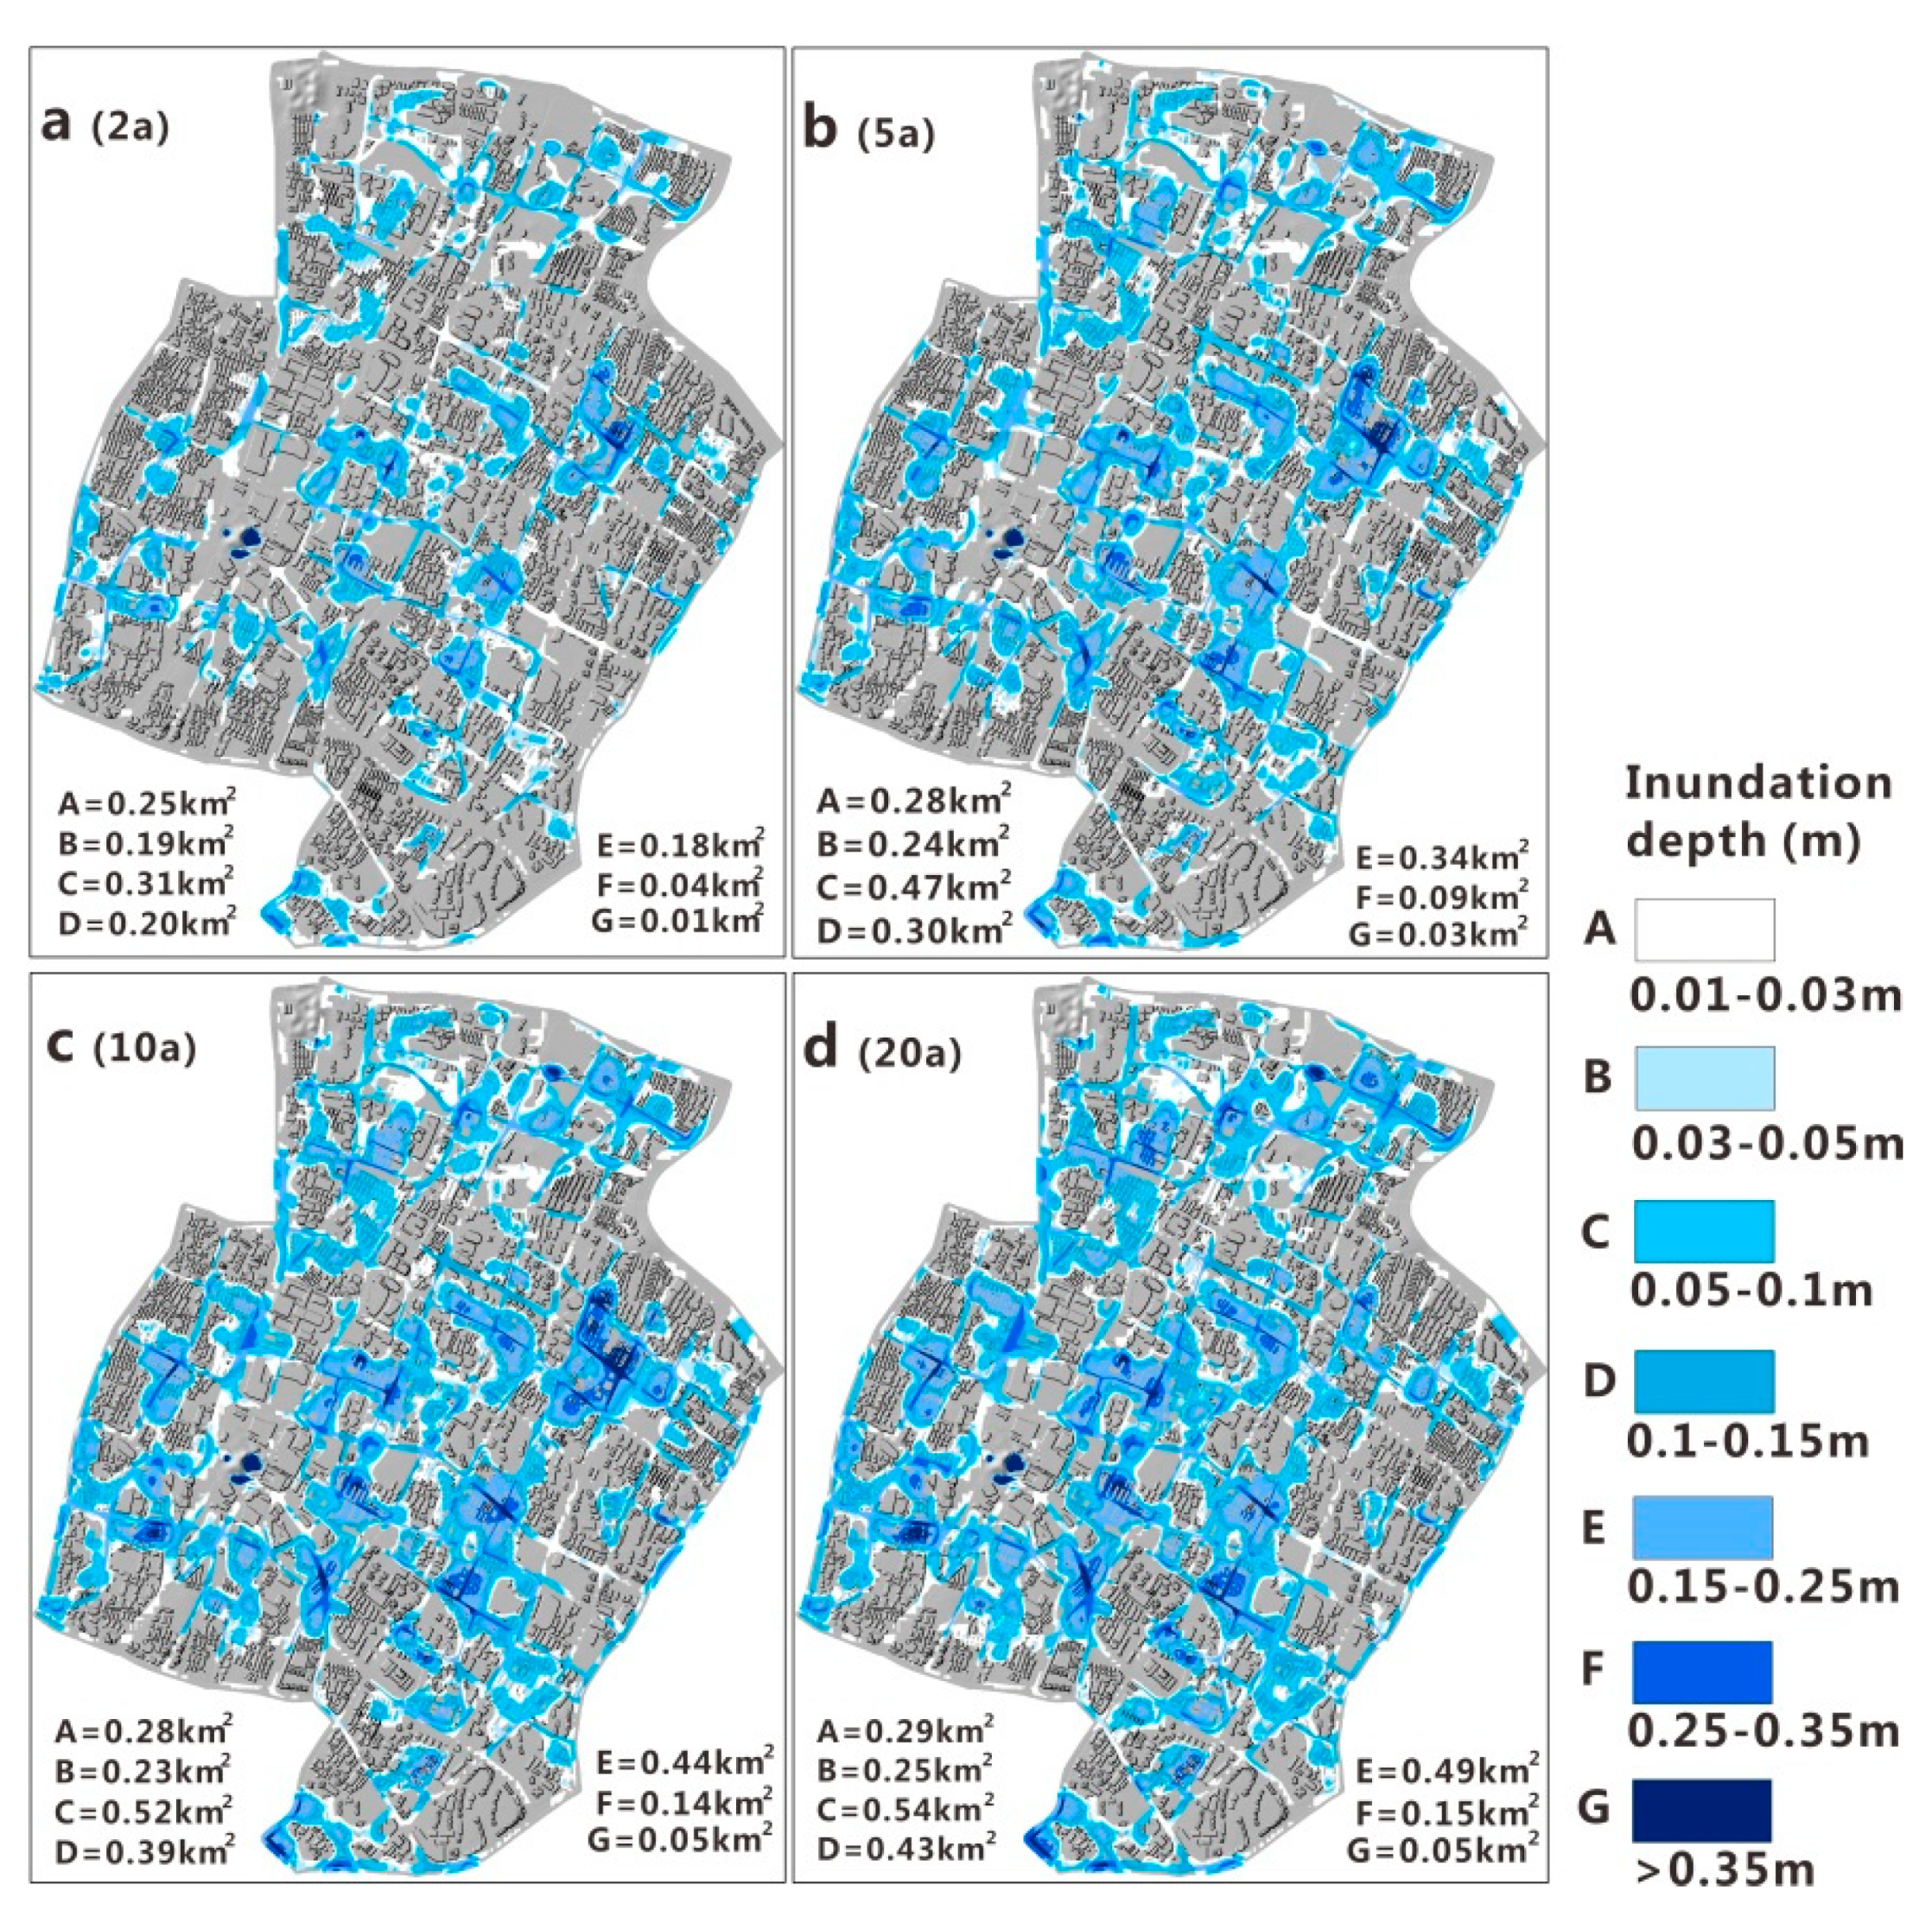
Taking the Poisson-pattern rainfall as an example, the maximum flooding depth distributions under return periods of 2a, 5a, 10a, and 20a for a 60-min rainfall duration are shown in Figure 7. It is observed that the flooding pattern is similar under different precipitation durations, although the flooding area slightly increases with the return period. Waterlogging mainly occurs along the street and in the low-lying areas on both sides of the street. Compared with the return period of 2 years, the flooding area that exceeds the 15 cm depth increases by 97%, 168%, and 194% for return periods of 5, 10, and 20 years, respectively.

3.3. Drainage Discharge

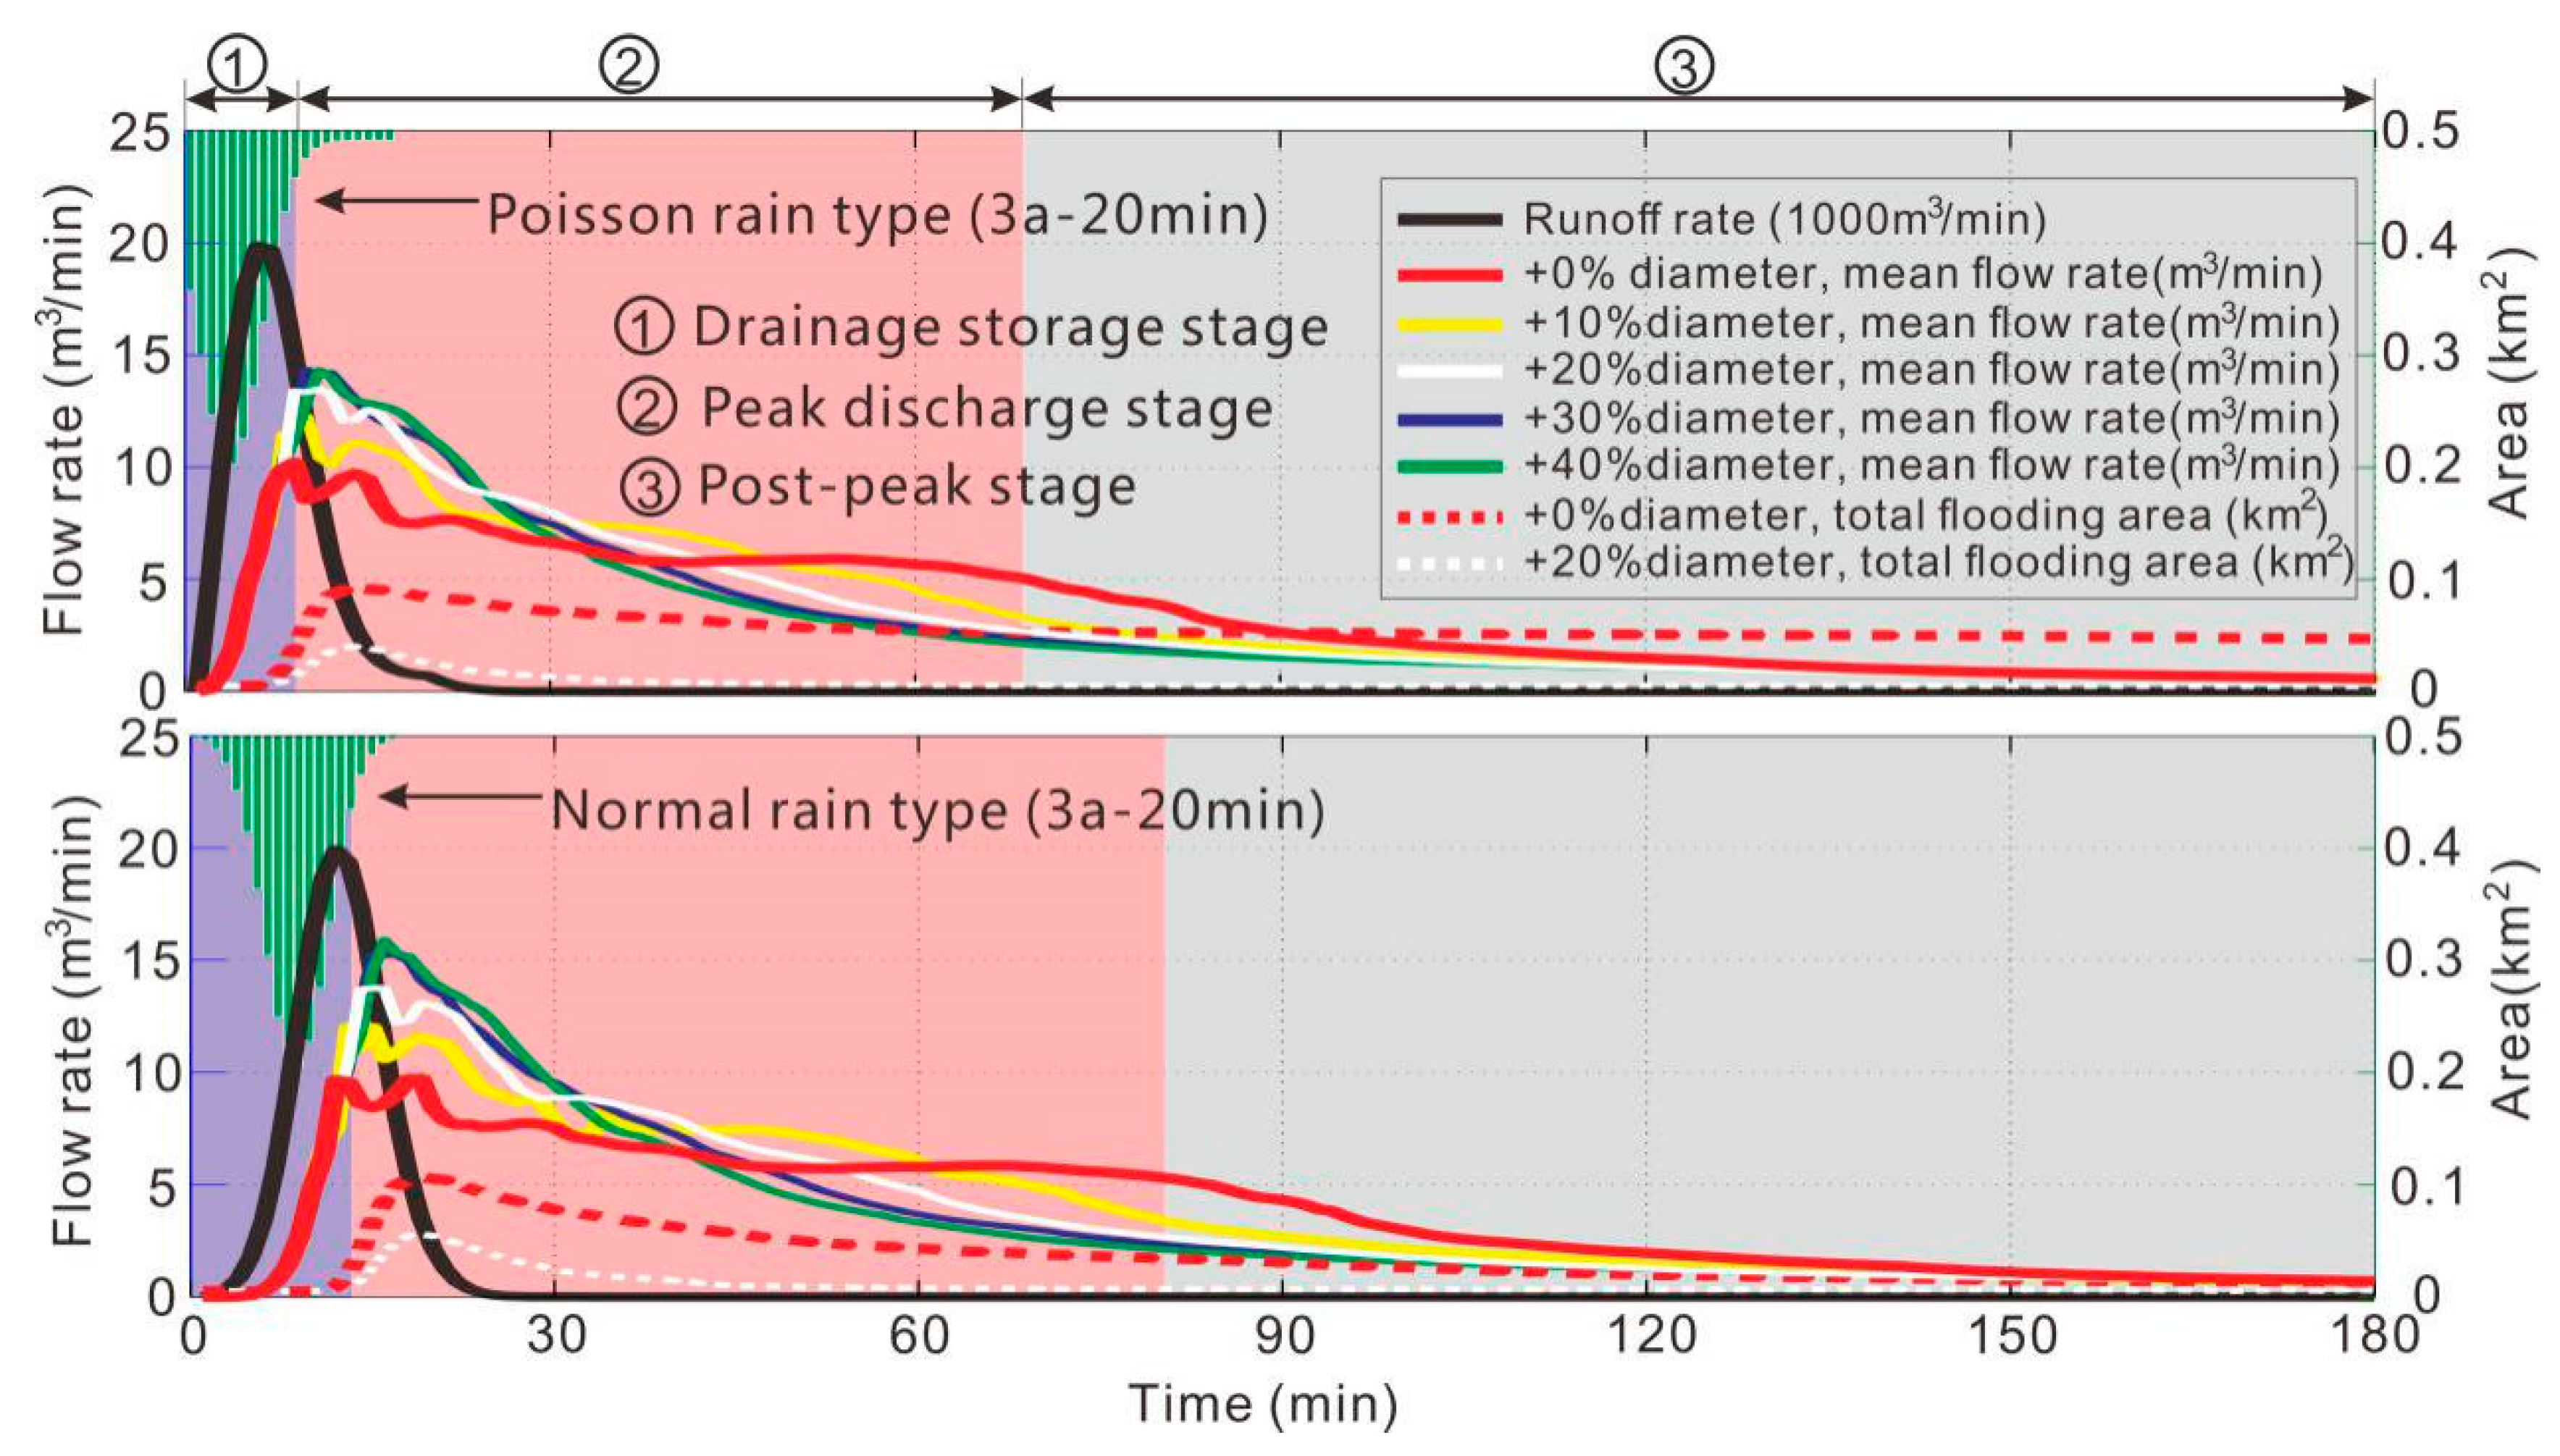
In order to demonstrate the coupling relationship between drainage flow and flooding area variations, the time series variation of a 3-year return period and a 20-min rainfall case is shown in Figure 8. In the early stage, with the increase of rainfall intensity, the rainfall runoff, drainage flow rate, and flooding area gradually increased, and the drainage system shows a strong water storage capacity. Drainage reached the maximum discharge capacity after 7 and 12 min under the Poisson-pattern and normal-pattern rainfall, respectively. In the middle stage, both the drainage capacity and the flooding area reached and maintained the peak value, although the rainfall intensity started to weaken. The drainage capacity maintained the peak value for a long time, reflecting the balance between the manhole input and drainage output. The rainfall runoff continuously flows into the low-lying areas, increasing the deeper inundation area. In the late stage, when rainfall stops, the runoff stops immediately and waterlogging is removed from the ground gradually, mainly through the drainage system.
Under normal-pattern rainfall, the flooding area decreased significantly within 100 min, but 0.01 km2 was still retained; while under the Poisson-pattern rainfall, the flooding area was reduced significantly within 80 min, but 0.05 km2 was still retained. At this stage, the flooding of Poisson-pattern rainfall is more serious than that of normal-pattern because Poisson-pattern rain tends to cause larger waterlogging instantaneously with high-intensity precipitation at the beginning. Furthermore, manholes are not necessarily located at the lowest point of the sub-catchment, and as a result, some flooding of the low-lying area can only be removed by infiltration and evaporation.

4. Discussion

The URIS simulates the urban flooding process based on a semi-physical distributed hydrological model; the uncertainty of the modeling result is mainly related to the DEM resolution and calculation efficiency [60,61]. These two aims (accuracy and efficiency) are often in conflict with each other [62]. On one hand, recent development of RS technology, like light detection and ranging (LiDAR), has increased the availability of high-resolution DEM. Therefore, data availability no longer represents a significant limitation to the reduction of modeling uncertainty [62]. On the other hand, the distributed hydrological model needs a long computation time to carry out simulation with high-resolution spatial DEM [63]. Usually, a compromise is taken to coarsen the DEM resolution to a reasonable degree, which reduces the number of grid cells, and as a consequence, the number of time steps required for the temporal process is also reduced. Generally, the coarsened DEM may not have an obvious influence on the changes of flooding patterns as shown in Figure 7; however, it will have a significant impact on small-scale flooding features, e.g., a low-resolution terrain map may result in a neglect of the small-scale inundation zones in that the flooding area illustrated in Figure 5 was reduced from 0.63 to 0.59 and 0.58 km2 when the DTM resolution was coarsened from 2 to 10 and 20 m, respectively. Moreover, some small rainwater retaining facilities, such as depression structures, and some micro-reliefs of artificial structures, such as road shoulders, will also influence the urban flooding propagation. Therefore, a high-quality DEM with reasonable resolution is important to reduce the uncertainty of modeling, which significantly reduces simulation times while providing reasonable simulation results for planning purposes.
The URIS was established based on some simplified assumptions. First, spatially evenly distributed precipitation was used as the source of water in the SCS model. However, this simplification is only appropriate when the modeling area is small and the rainfall intensity is evenly distributed, because it could underestimate flooding where rainfall intensity is larger and overestimate flooding where rainfall intensity is smaller if the latter condition is not satisfied. Secondly, owing to the complexity of urban drainage structures, some important drainage facilities, like pump stations, were not considered, and the drainage flow was treated as the gravity flow in pipelines. However, pump drainage is an important flooding mitigation measure during rainstorm, and ignoring enforced sewer discharge by pumps will lower the drainage capacity. This may be the reason that caused the overestimation of the flooding area illustrated in Figure 5 compared to the 39 reported flooding streets during Typhoon Matsa in 2005. In addition, isolated modeling of the Jing’an district has limitations in that the underground drainage of the study area is connected to that of the neighboring districts and rivers, and therefore, the drainage flow should be influenced by riverine water level variations. A high river water level during a rainstorm may block sewer outlets and therefore restrict drainage. In order to produce the situation of drainage failure by outlets blocking, we may need to delete some of the outlets or reduce the diameter of pipelines immediately connected to the outlets so that sewer conveyance capacity is restricted. Moreover, evaporation, transpiration, and other influencing factors, such as river flooding, were not considered in order to perform a simplified model.
Despite the abovementioned limitations, it was demonstrated that the URIS is effective in simulating urban rainstorm waterlogging. Under the rainfall scenario of a 3-year return period and 20-min duration, statistical analysis of the 2872 sub-catchments of the entire study area showed that a total of 82 sub-catchments (accounting for 0.3% of the total area) were unqualified, with a flooding depth greater than 25 cm, and 449 sub-catchments (accounting for 1.4%) were partly unqualified, with a flooding depth between 15 and 25 cm. The total area of unqualified and partly unqualified sub-catchments was 0.13 km2, which primarily consists of sub-catchments where the area is large. Taking sub-catchment ID1615 as an example, the required safety drainage for pipeline ID2289 is 2.7 m3/min under a 3-year return period and 20-min rainfall duration; however, the actual drainage capacity is only 1.8 m3/min, which is 0.9 m3/min lower than the requirement. Therefore, it is hypothesized that inadequate drainage capacity is the main cause of urban waterlogging during heavy rainstorms.
In order to prove this hypothesis, scenario simulations were rerun with the increases of pipe diameter by 10%, 20%, 30%, and 40% to evaluate the optimal discharge capacity (Figure 8). The results showed that the average drainage capacity increased from the original 6 m3/min by 18%, 22%, 20%, and 16%, respectively. The safety qualification rate increased from the original 82% of the total sub-catchments to 88%, 91%, 92%, and 91%, respectively. Therefore, it was demonstrated that the safety qualification rate increases significantly with the increase of the pipeline diameter. However, both the safety qualification rate and average drainage capacity are slightly reduced after a 20% increase of diameter, which may be due to the neck effect of some of the restrictive pipelines (pipe diameter less than 0.5 m accounts for 23% in the study area). Thus, the detection of the restrictive pipelines and then increasing their diameters is key to improvements of the overall drainage efficiency in old town rebuilding. Moreover, the flooding caused by Poisson-pattern rainfall is more serious than that of normal-pattern because Poisson-pattern rainfall will result in excessive rainfall immediately at the beginning, and the drainage capacity is limited to discharge severe waterlogging. Therefore, in addition to the drainage system, other low-impact development measures, such as increasing the concave green land, should also be included as comprehensive measures to treat the waterlogging caused by heavy precipitations.
Overall, the URIS is a useful tool for urban rainstorm inundation simulation and emergency preparation because of its time-efficient performance and low input and hardware requirements. Moreover, reliable risk area estimation with the high potential of serious flooding can help authorities to produce management strategies for urban planning, such as designing disaster control structures to cope with flooding (e.g., underground drainage projects) [11]; it can also help with producing and implementing sustainable flood-mitigation measures [64,65] and assist in decision making for flood insurance [66], facilitating emergency preparedness, and thus helping to alleviate risks and losses of life and property [67].

5. Conclusions

A semi-physical distributed modeling system, URIS, was developed based on a GIS platform to model urban rainstorm waterlogging. The central urban area of Shanghai in China was selected as the test case to evaluate the model performance.
Our results showed that the URIS model is a useful alternative to implement hydrodynamic modeling in an urban environment. It has the following advantages: (1) The model is able to describe the dynamic process of surface inundation and drainage discharge. (2) The model is capable of characterizing the spatiotemporal development of urban inundation and drainage under different rainstorm conditions. (3) The spatial and temporal resolutions of the modeling results are high enough for risk management and planning purposes. (4) The modeling method is simple, and the input of a few data is required for simulation; therefore, it is recommended for users without plenty of knowledge of hydrology and with a lack of sufficient data. (5) It is suitable for situations when urban surface flooding and drainage discharge need to be quickly estimated.
The model can successfully simulate the dynamic processes of urban flooding and drainage discharge, which greatly extends the application of the SCS model in the urban environment. Despite some limitations, the URIS that couples the SCS rainfall runoff, surface flow, and drainage flow models provides a practical approach for urban rainstorm waterlogging and drainage simulation. In order to improve the model performance, more calibration work of the key parameters and a sensitivity test should be done in future.

Author Contributions

All authors contributed to the design and development of the work. X.M. built the model, carried out the data analysis and wrote the paper. M.Z. built the model and wrote the paper. S.D. developed the model. J.W. and H.X. reviewed the paper. L.W. developed the model. Y.Y. processed original pipe network data.

Funding

This research was funded by the National Natural Science Foundation of China, grant number 51761135024, 71603168, 41701001, and 41871200, China Postdoctoral Science Foundation, grant number 2018M630414, National Key Research and Development Plan, grant number YS2017YFC1503001, the Science and Technology Commission of Shanghai Municipality, grant number 16070502800 and Jiangsu Planned Projects for Postdoctoral Research Funds. The model and data reported in this paper can be obtained by contacting the corresponding author Min Zhang ([email protected]).

Conflicts of Interest

The authors declare no conflict of interest.

References

  1. Zhang, J.Y.; Wang, Y.T.; He, R.M. Discussion on the urban flood and waterlogging and causes analysis in China. Adv. Water Sci 2016, 27, 485–491. (In Chinese) [Google Scholar]
  2. Li, G.F.; Tong, Y.Y.; Wang, H.M. Impact assessment of urbanization on flood risk in the Yangtze River Delta. Stoch. Environ. Res. Risk Assess. 2013, 27, 1683–1693. [Google Scholar] [CrossRef]
  3. Jha, A.; Lamond, J.; Bloch, R. Five Feet High and Rising Cities and Flooding in the 21st Century; Social Science Electronic Publishing: New York, NY, USA, 2011. [Google Scholar]
  4. Yu, H.F.; Zhao, Y.L.; Fu, Y.H. Spatiotemporal Variance Assessment of Urban Rainstorm Waterlogging Affected by Impervious Surface Expansion: A Case Study of Guangzhou, China. Sustainability 2018, 10, 3761. [Google Scholar] [CrossRef]
  5. Mike Urban. Available online: https://www.mikepoweredbydhi.com/products/mike-urban (accessed on 23 March 2019).
  6. InfoWorks CS. Available online: http://www.hrwallingford.com/ (accessed on 23 March 2019).
  7. SOBEK. Available online: https://www.deltares.nl/en/software/sobek/ (accessed on 23 March 2019).
  8. Storm Water Management Model (SWMM). Available online: http://www.epa.gov/ednnrmrl/models/swmm/ (accessed on 23 March 2019).
  9. Gironás, J.; Roesner, L.A.; Rossman, L.A.; Davis, J. A new applications manual for the Storm Water Management Model (SWMM). Environ. Model. Softw. 2010, 25, 813–814. [Google Scholar] [CrossRef]
  10. Chen, J.; Hill, A.A.; Urbano, L.D. A GIS-based model for urban flood inundation. J. Hydrol. 2009, 373, 184–192. [Google Scholar] [CrossRef]
  11. Zhang, S.H.; Pan, B.Z. An urban storm-inundation simulation method based on GIS. J. Hydrol. 2014, 517, 260–268. [Google Scholar] [CrossRef]
  12. Huang, C.; Chen, Y.; Wu, J.P. Mapping spatio-temporal flood inundation dynamics at large river basin scale using time-series flow data and MODIS imagery. Int. J. Appl. Earth Obs. Geoinf. 2014, 26, 350–362. [Google Scholar] [CrossRef]
  13. Yu, D.P.; Coulthard, T.J. Evaluating the importance of catchment hydrological parameters for urban surface water flood modelling using a simple hydro-inundation model. J. Hydrol. 2015, 524, 385–400. [Google Scholar] [CrossRef] [Green Version]
  14. Massari, C.; Tarpanelli, A.; Moramarco, T. A fast simplified model for predicting river flood inundation probabilities in poorly gauged areas. Hydrol. Process. 2015, 29, 2275–2289. [Google Scholar] [CrossRef]
  15. Heimhuber, V.; Tulbure, M.G.; Broich, M. Modeling multidecadal surface water inundation dynamics and key drivers on large river basin scale using multiple time series of Earth observation and river flow data. Water Resour. Res. 2017, 53, 1251–1269. [Google Scholar] [CrossRef]
  16. Xu, Z.X.; Cheng, L. Progress on studies and applications of the distributed hydrological models. J. Hydraul. Eng. 2008, 39, 1009–1017. (In Chinese) [Google Scholar]
  17. Sayama, T.; Tatebe, Y.; Iwami, Y. Hydrologic sensitivity of flood runoff and inundation: 2011 Thailand floods in the Chao Phraya River basin. Nat. Hazards Earth Syst. 2015, 15, 1617–1630. [Google Scholar] [CrossRef] [Green Version]
  18. Rosa, P.D.; Andrea, F.; Annalisa, M. Automatic Web Procedure for Calculating Flood Flow Frequency. Water 2019, 11, 14. [Google Scholar] [CrossRef]
  19. Flood Modeller. Available online: https://www.floodmodeller.com/ (accessed on 23 March 2019).
  20. Zhang, S.H.; Wang, T.W.; Zhao, B.H. Calculation and visualization of flood inundation based on a topographic triangle network. J. Hydrol. 2014, 509, 406–415. [Google Scholar] [CrossRef]
  21. Zhang, S.H.; Xia, Z.X.; Yuan, R. Parallel computation of a dam-break flow model using OpenMP on a multi-core computer. J. Hydrol. 2014, 512, 126–133. [Google Scholar] [CrossRef]
  22. Cho, Y.; Engel, B.A. Spatially distributed long-term hydrologic simulation using a continuous SCS CN method-based hybrid hydrologic model. Hydrol Process. 2018, 32, 904–922. [Google Scholar] [CrossRef]
  23. Mishra, S.K.; Pandey, R.P.; Jain, M.K.; Singh, V.P. A Rain Duration and Modified AMC-dependent SCS-CN Procedure for Long Duration Rainfall-runoff Events. Water Resour. Manag. 2008, 22, 861–876. [Google Scholar] [CrossRef]
  24. Soulis, K.X.; Valiantzas, J.D. Identification of the SCS-CN Parameter Spatial Distribution Using Rainfall-Runoff Data in Heterogeneous Watersheds. Water Resour. Manag. 2013, 27, 1737–1749. [Google Scholar] [CrossRef]
  25. Ajmal, M.; Waseem, M.; Ahn, J.H.; Kim, T.W. Improved Runoff Estimation Using Event-Based Rainfall-Runoff Models. Water Resour. Manag. 2015, 29, 1995–2010. [Google Scholar] [CrossRef]
  26. Geetha, K.; Mishra, S.K.; Eldho, T.I.; Rastogi, A.K.; Pandey, R.P. SCS-CN-based Continuous Simulation Model for Hydrologic Forecasting. Water Resour. Manag. 2008, 22, 165–190. [Google Scholar] [CrossRef]
  27. Suribabu, C.R.; Bhaskar, J. Evaluation of urban growth effects on surface runoff using SCS-CN method and Green-Ampt infiltration model. Earth. Sci. Inform. 2015, 8, 609–626. [Google Scholar] [CrossRef]
  28. Li, L.L. Hydrological Analysis and Calculation Research of Un-Gauged Basins. J. Henan Sci. Technol. 2016, 19, 59–60. (In Chinese) [Google Scholar]
  29. Razafison, U.; Stéphane, C.; Delestre, O. A Shallow Water model for the numerical simulation of overland flow on surfaces with ridges and furrows. Eur. J. Mech. B-Fluid 2012, 31, 44–52. [Google Scholar] [CrossRef]
  30. Huang, J.B.; Wen, J.W.; Wang, B.; Zhu, S. Numerical analysis of the combined rainfall-runoff process and snowmelt for the Alun River Basin, Heilongjiang, China. Environ. Earth. Sci. 2015, 74, 6929–6941. [Google Scholar]
  31. Kumar, T.; Jhariya, D.C. Identification of Rainwater Harvesting Sites using SCS-CN Methodology, Remote Sensing and Geographical Information System Techniques. Geocarto Int. 2017, 32, 1367–1388. [Google Scholar] [CrossRef]
  32. Tiwari, K.; Goyal, R.; Sarkar, A. GIS-based Methodology for Identification of Suitable Locations for Rainwater Harvesting Structures. Water Resour. Manag. 2018, 32, 1811–1825. [Google Scholar] [CrossRef]
  33. Pantelakis, D.; Zissis, T.; Anastasiadou-Partheniou, E.; Baltas, E. Numerical Models for the Simulation of Overland Flow in Fields Within Surface Irrigation Systems. Water Resour. Manag. 2012, 26, 1217–1229. [Google Scholar] [CrossRef]
  34. Chen, P.; Zhang, J.; Zhang, L.; Sun, Y.; Rudatsikira, E. Evaluation of resident evacuations in urban rainstorm waterlogging disasters based on scenario simulation: Daoli district (Harbin, China) as an example. Int. J. Environ. Res. Public Health 2014, 11, 9964. [Google Scholar] [CrossRef]
  35. Dang, A.T.N.; Kumar, L. Application of remote sensing and GIS-based hydrological modelling for flood risk analysis: A case study of District 8, Ho Chi Minh city, Vietnam. Geomat. Nat. Hazards Risk 2017, 8, 1792–1811. [Google Scholar] [CrossRef]
  36. Yin, J.; Yu, D.P.; Yin, Z.; Liu, M.; He, Q. Evaluating the impact and risk of pluvial flash flood on intra-urban road network: A case study in the city center of Shanghai, China. J. Hydrol. 2016, 537, 138–145. [Google Scholar] [CrossRef] [Green Version]
  37. Rizeei, H.M.; Pradhan, B.; Saharkhiz, M.A. Surface runoff prediction regarding LULC and climate dynamics using coupled LTM, optimized ARIMA, and GIS-based SCS-CN models in tropical region. Arab. J. Geosci. 2018, 11, 53. [Google Scholar] [CrossRef]
  38. Yin, Z.E.; Yin, J.; Xu, S.Y. Community-based scenario modelling and disaster risk assessment of urban rainstorm waterlogging. Acta Geogr. Sin. 2011, 21, 274–284. [Google Scholar] [CrossRef]
  39. Huang, Q.Y.; Wang, J.; Li, M.Y.; Fei, M.; Dong, J. Modeling the influence of urbanization on urban pluvial flooding: A scenario-based case study in Shanghai, China. Nat. Hazards 2017, 87, 1035–1055. [Google Scholar] [CrossRef]
  40. Fan, F.L.; Deng, Y.B.; Hu, X.F. Estimating Composite Curve Number Using an Improved SCS-CN Method with Remotely Sensed Variables in Guangzhou, China. Remote Sens. 2013, 5, 1425–1438. [Google Scholar] [CrossRef] [Green Version]
  41. Xu, J.H.; Zhao, Y.; Zhong, K.W. Coupling Modified Linear Spectral Mixture Analysis and Soil Conservation Service Curve Number (SCS-CN) Models to Simulate Surface Runoff: Application to the Main Urban Area of Guangzhou, China. Water 2016, 8, 550. [Google Scholar] [CrossRef]
  42. Bouvier, C.; Bouchenaki, L.; Tramblay, Y. Comparison of SCS and Green-Ampt Distributed Models for Flood Modelling in a Small Cultivated Catchment in Senegal. Geosciences 2018, 8, 122. [Google Scholar] [CrossRef]
  43. Cronshey, R.G.; McCuen, R.H.; Miller, N. Urban Hydrology for Small Watersheds; USDA, Soil Conservation Service: Washington, DC, USA, 1986; p. 164.
  44. McCuen, R.H. A Guide to Hydrologic Analysis Using SCS Methods; The National Agricultural Library: Beltsville, MD, USA; Washington, DC, USA, 1982.
  45. Ponce, V.M.; Hawkins, R.H. Runoff Curve Number: Has It Reached Maturity? J. Hydrol. Eng. 1996, 1, 11–19. [Google Scholar] [CrossRef]
  46. Lunasin, E.; Titi, E.S. Finite determining parameters feedback control for distributed nonlinear dissipative systems—A computational study. Math 2015, 3, 1–23. [Google Scholar] [CrossRef]
  47. Gildas, B.; Georges, D.; Benayache, Z. Towards nonlinear delay-based control for convection-like distributed systems: The example of water flow control in open channel systems. Netw. Heterog. Media 2017, 4, 211–221. [Google Scholar]
  48. Shen, H.B.; Xu, Z.X.; Zhang, S.H. Review on the simulation of overland flow in hydrological models. Adv. Water Sci. 2016, 27, 467–475. (In Chinese) [Google Scholar]
  49. Athol, D.A.; Gary, L.; Anthony, J.P. Rill hydraulics on a semiarid hillslope, southern Arizona. Earth. Surf. Proc. Land 2015, 21, 35–47. [Google Scholar]
  50. Seo, Y.; Hwang, J.; Noh, S.J. Analysis of Urban Drainage Networks Using Gibbs’ Model: A Case Study in Seoul, South Korea. Water 2015, 7, 4129–4143. [Google Scholar] [CrossRef] [Green Version]
  51. Konsoer, K.; Zinger, J.; Parker, G. Bankfull hydraulic geometry of submarine channels created by turbidity currents: Relations between bankfull channel characteristics and formative flow discharge. J. Geophys. Res.-Earth 2013, 118, 216–228. [Google Scholar] [CrossRef] [Green Version]
  52. Strupczewski, W.G.; Szymkiewicz, R. Analysis of paradoxes arising from the Chezy formula with constant roughness: I. Depth-discharge curve. Hydrol. Sci. J. 1997, 41, 659–673. [Google Scholar] [CrossRef]
  53. Wang, C.X.; Du, S.Q.; Wen, J.H.; Zhang, M.; Gu, H.; Shi, Y.; Xu, H. Analyzing explanatory factors of urban pluvial floods in Shanghai using geographically weighted regression. Stoch. Environ. Res. Risk Assess. 2017, 31, 1777–1790. [Google Scholar] [CrossRef]
  54. Quan, R.S. Rainstorm waterlogging risk assessment in central urban area of Shanghai based on multiple scenario simulation. Nat. Hazards 2011, 73, 1569–1585. [Google Scholar] [CrossRef]
  55. Yin, J.; Yin, Z.; Zhong, H.D.; Xu, S.; Hu, X.; Wang, J.; Wu, J. Monitoring urban expansion and land use/land cover changes of Shanghai metropolitan area during the transitional economy (1979–2009) in China. Environ. Monit. Assess. 2011, 177, 609. [Google Scholar] [CrossRef]
  56. Yu, H.L.; Wang, H.C.; Yang, S.S.; Hang, S.J.; Zhang, J.P.; Zhang, S.F.; Yang, K.; Zhang, F.J.; Cha, M.P. Code for Design of Outdoor Wastwater Engineering; China Planning Press: Beijing, China, 2006. [Google Scholar]
  57. Ning, J. Study on the Short-Term Rainstorm Intensity Formula and Design Rain Pattern in Shanghai. Master’s Thesis, Tongji University, Shanghai, China, 2006. (In Chinese). [Google Scholar]
  58. Du, S.Q.; Gu, H.H.; Wen, J.H.; Chen, K.; Van Rompaey, A. Detecting Flood Variations in Shanghai over 1949–2009 with Mann-Kendall Tests and a Newspaper-Based Database. Water 2015, 7, 1808–1824. [Google Scholar] [CrossRef] [Green Version]
  59. Yin, J.; Yu, D.P.; Wilby, R. Modelling the impact of land subsidence on urban pluvial flooding: A case study of downtown Shanghai, China. Sci. Total Environ. 2016, 544, 744–753. [Google Scholar] [CrossRef] [Green Version]
  60. Bathrellos, G.D.; Skilodimou, H.D.; Chousianitis, K.; Youssef, A.M.; Pradhan, B. Suitability estimation for urban development using multi-hazard assessment map. Sci. Total Environ. 2017, 575, 119–134. [Google Scholar] [CrossRef]
  61. Skilodimou, H.D.; Bathrellos, G.D.; Chousianitis, K. Multi-hazard assessment modeling via multi-criteria analysis and GIS: A case study. Environ. Earth. Sci. 2019, 78, 47. [Google Scholar] [CrossRef]
  62. Chen, A.S.; Evans, B.; Djordjevi, S.; Savić, D.A. A coarse-grid approach to representing building blockage effects in 2D urban flood modelling. J. Hydrol. 2012, 426–427, 1–16. [Google Scholar] [CrossRef]
  63. Yu, D.P. Parallelization of a two-dimensional flood inundation model based on domain decomposition. Environ. Model. Softw. 2010, 25, 935–945. [Google Scholar] [CrossRef] [Green Version]
  64. Meenar, M.; Fromuth, R.; Soro, M. Planning for watershed-wide flood-mitigation and stormwater management using an environmental justice framework. Environ. Pract. 2018, 20, 55–67. [Google Scholar] [CrossRef]
  65. Ernst, J.; Dewals, B.J.; Detrembleur, S.; Archambeau, P.; Erpicum, S.; Pirotton, M. Micro-scale flood risk analysis based on detailed 2D hydraulic modelling and high resolution geographic data. Nat. Hazards 2010, 55, 181–209. [Google Scholar] [CrossRef] [Green Version]
  66. Sarhadi, A.; Soltani, S.; Modarres, R. Probabilistic flood inundation mapping of ungauged rivers: Linking GIS techniques and frequency analysis. J. Hydrol. 2012, 458–459, 68–86. [Google Scholar] [CrossRef]
  67. Chang, L.C.; Shen, H.Y.; Wang, Y.F.; Huang, J.-Y.; Lin, Y.-T. Clustering-based hybrid inundation model for forecasting flood inundation depths. J. Hydrol. 2010, 385, 257–268. [Google Scholar] [CrossRef]
Figure 1. Conceptual model of the urban hydrological process showing the water balance of rainfall (P), runoff (Q), and pipe network flow (Se), where retention (F), primary rainfall loss ( I a ), and evaporation (E) compose the water losses.
Sustainability 11 02830 g001
Figure 2. Land use classification of the underlying surface (2 m × 2 m grid).
Sustainability 11 02830 g002
Figure 3. Three-dimensional model showing the spatial connectivity between manholes and pipelines.
Sustainability 11 02830 g003
Figure 4. Location of manholes and sub-catchments of the study area.
Sustainability 11 02830 g004
Figure 5. Simulated maximum flooding depth and reported flooding streets during Typhoon Matsa in 2005.
Sustainability 11 02830 g005
Figure 6. Flooding depths and their changes over time for (a) the first 1 min, (b) the first 20 min, (c) the first 40 min, and (d) the first 60 min under a 20-year return period rainfall scenario.
Sustainability 11 02830 g006
Figure 7. Maximum flooding depth distribution under the return periods of (a) 2a, (b) 5a, (c) 10a, and (d) 20a for a 60-min rainfall duration and Poisson-precipitation-pattern rain.
Sustainability 11 02830 g007
Figure 8. A comparison of the rainfall runoff–drainage flow–flooding area change under Poisson-pattern and normal-pattern rainfall with an intensity defined as a 3-year return period and a 20-min duration.
Sustainability 11 02830 g008
Table 1. The CN values of the underlying surface.
Land Use ClassificationSoil Permeability
ABCD
Residential land (R)77859092
Commercial land (B)88919395
Industrial land (M)86899193
Public facilities (A)85899295
Square land (G)Green space (G1)30557480
Squares (G2)80909598
Other land (G3)67768087
Water surface (E)100100100100
Road (R)85899597
Table 2. Drainage system statistics.
Pipeline LengthPipeline Diameter
Length (m)10–2020–3030–5050–100>100Diameter Range: 0.2–3.6 m
Diameter (m)≤0.50.6–1>1
Number738835105422124Percentage (%)235819