An Economic Analysis of Demand Side Management Considering Interruptible Load and Renewable Energy Integration: A Case Study of Freetown Sierra Leone

 ,
,  ,
, 

 and
and
Abstract
1. Introduction
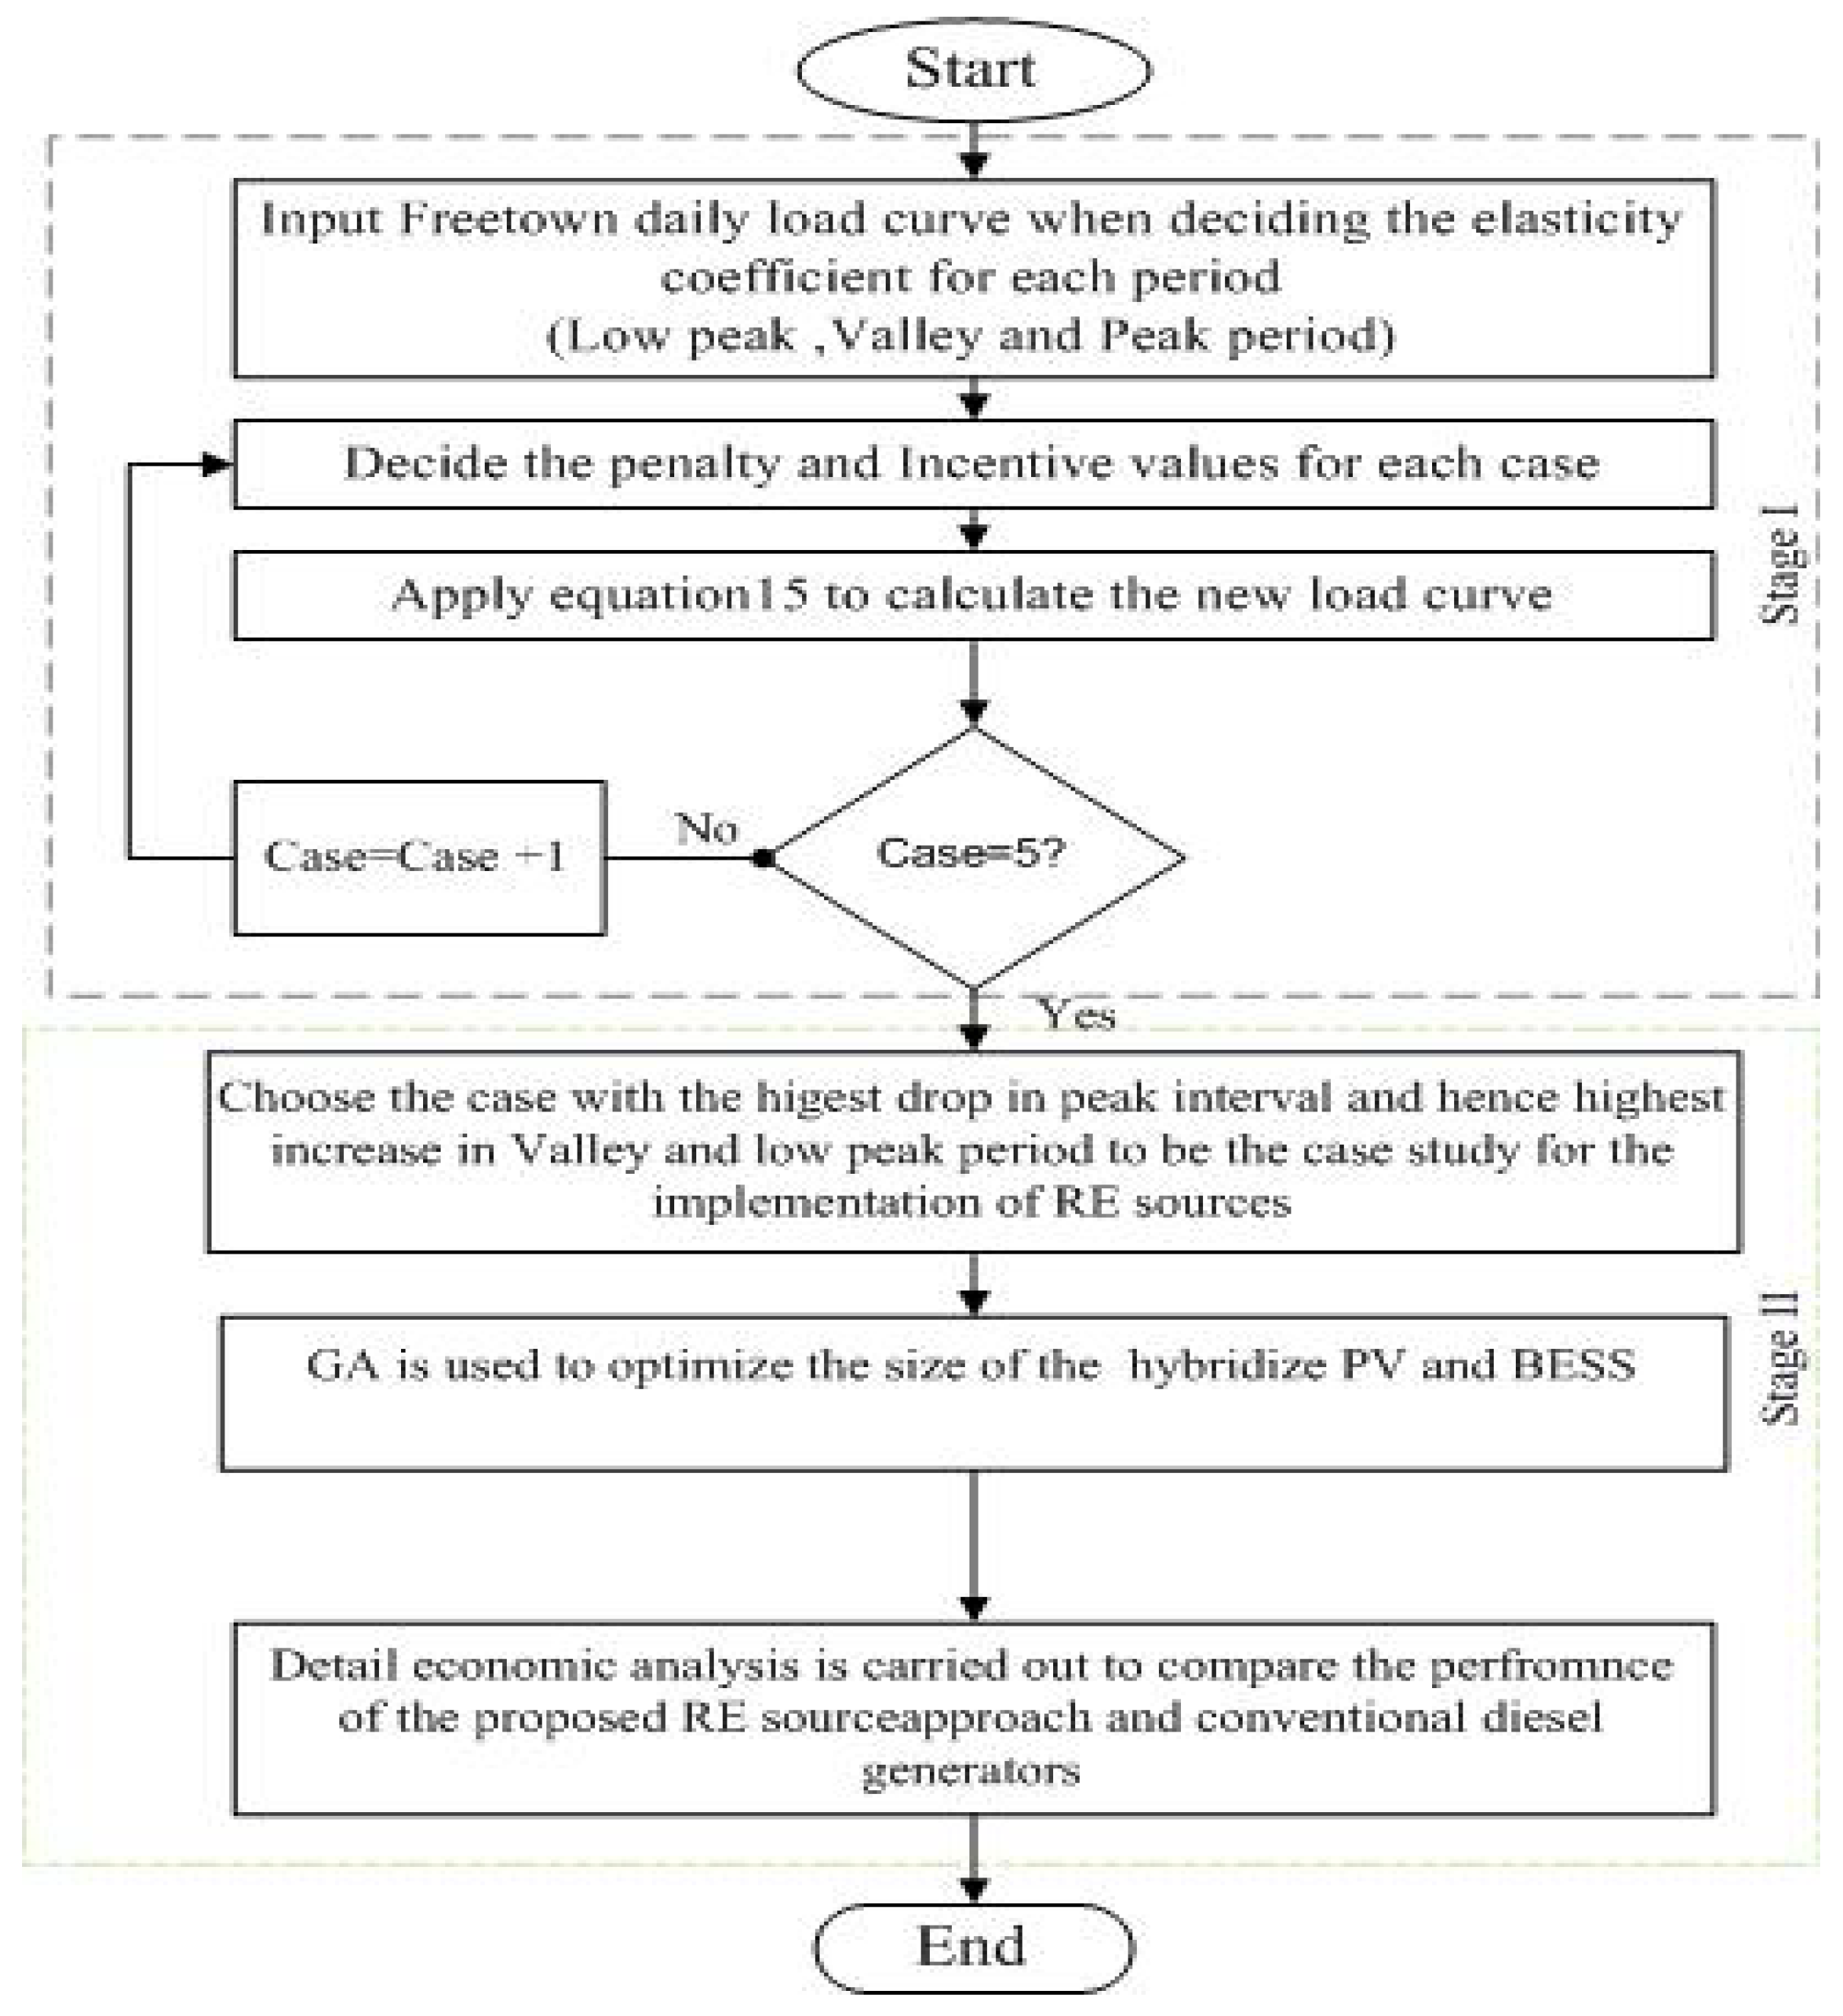
2. Methodology
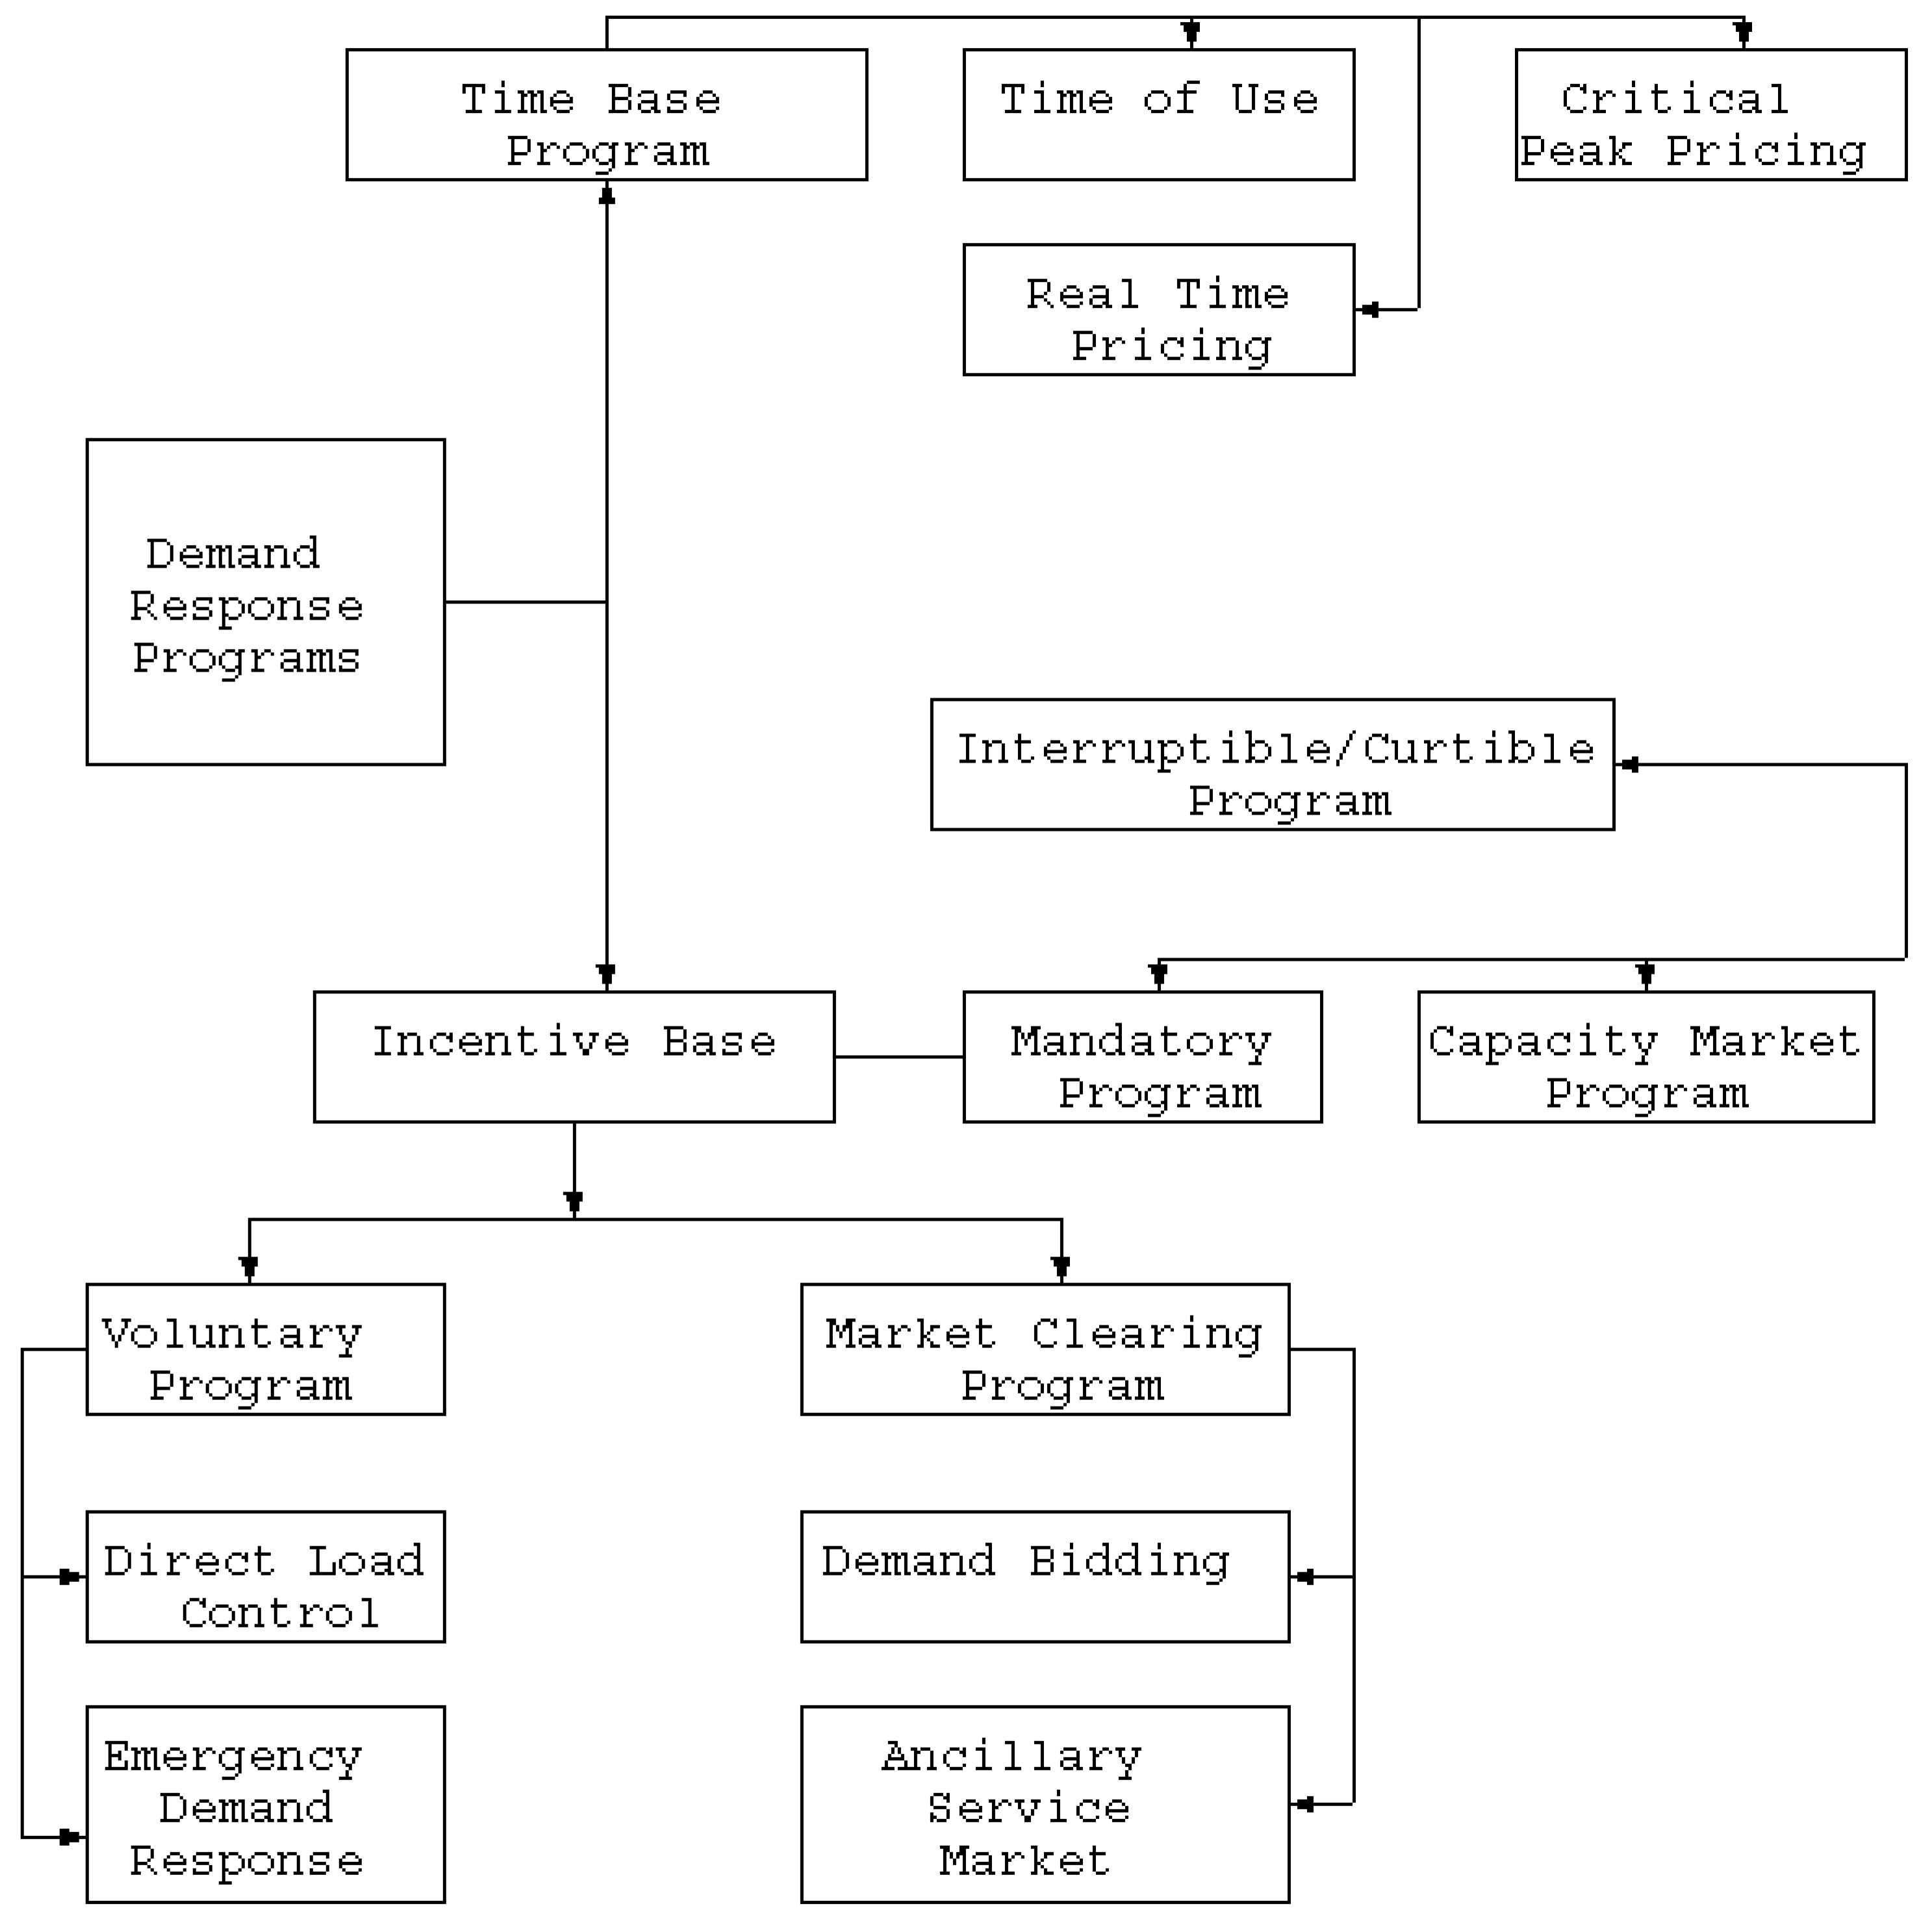
2.1. Phase I: Demand Response
2.1.1. Overview of Interruptible Load Model
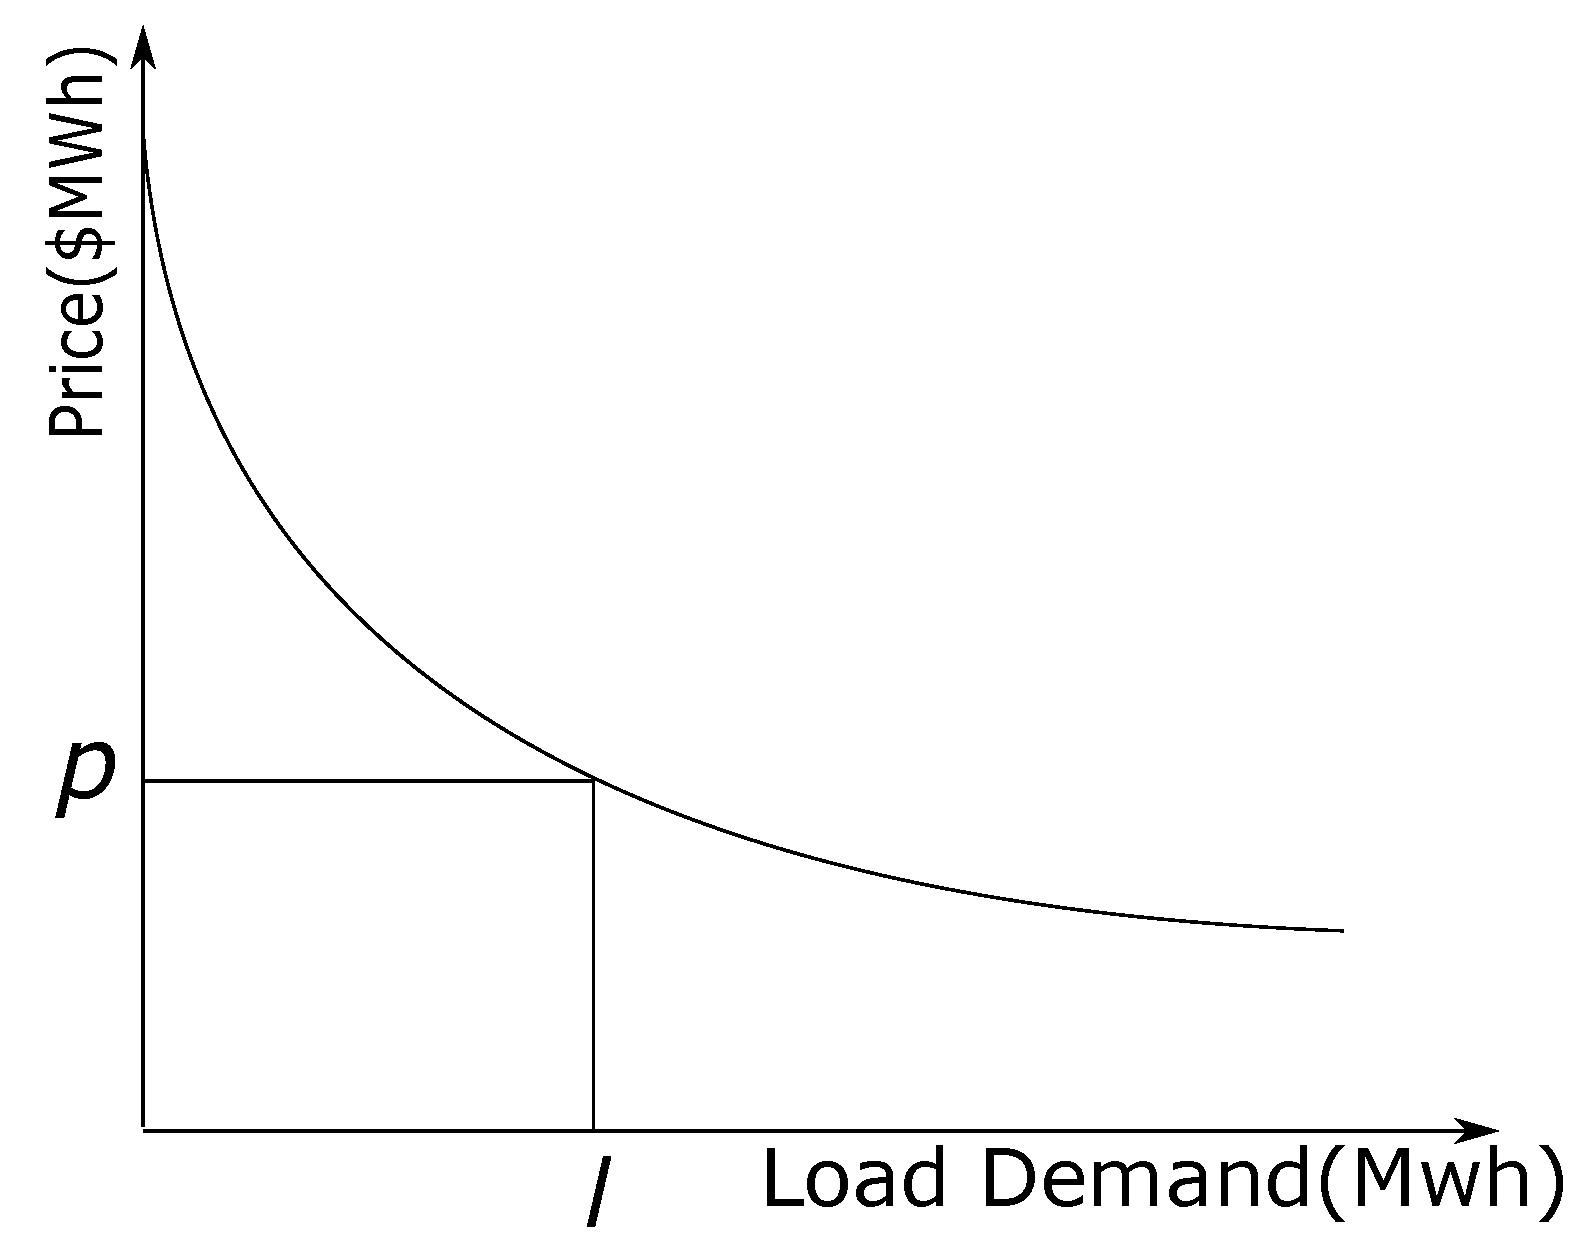
2.1.2. Mathematical Modelling of Interruptible Load DR
Proposed Modelling of Single and Multi-period Elastic load
Modelling of Multi-Period of the Interruptible Load Program
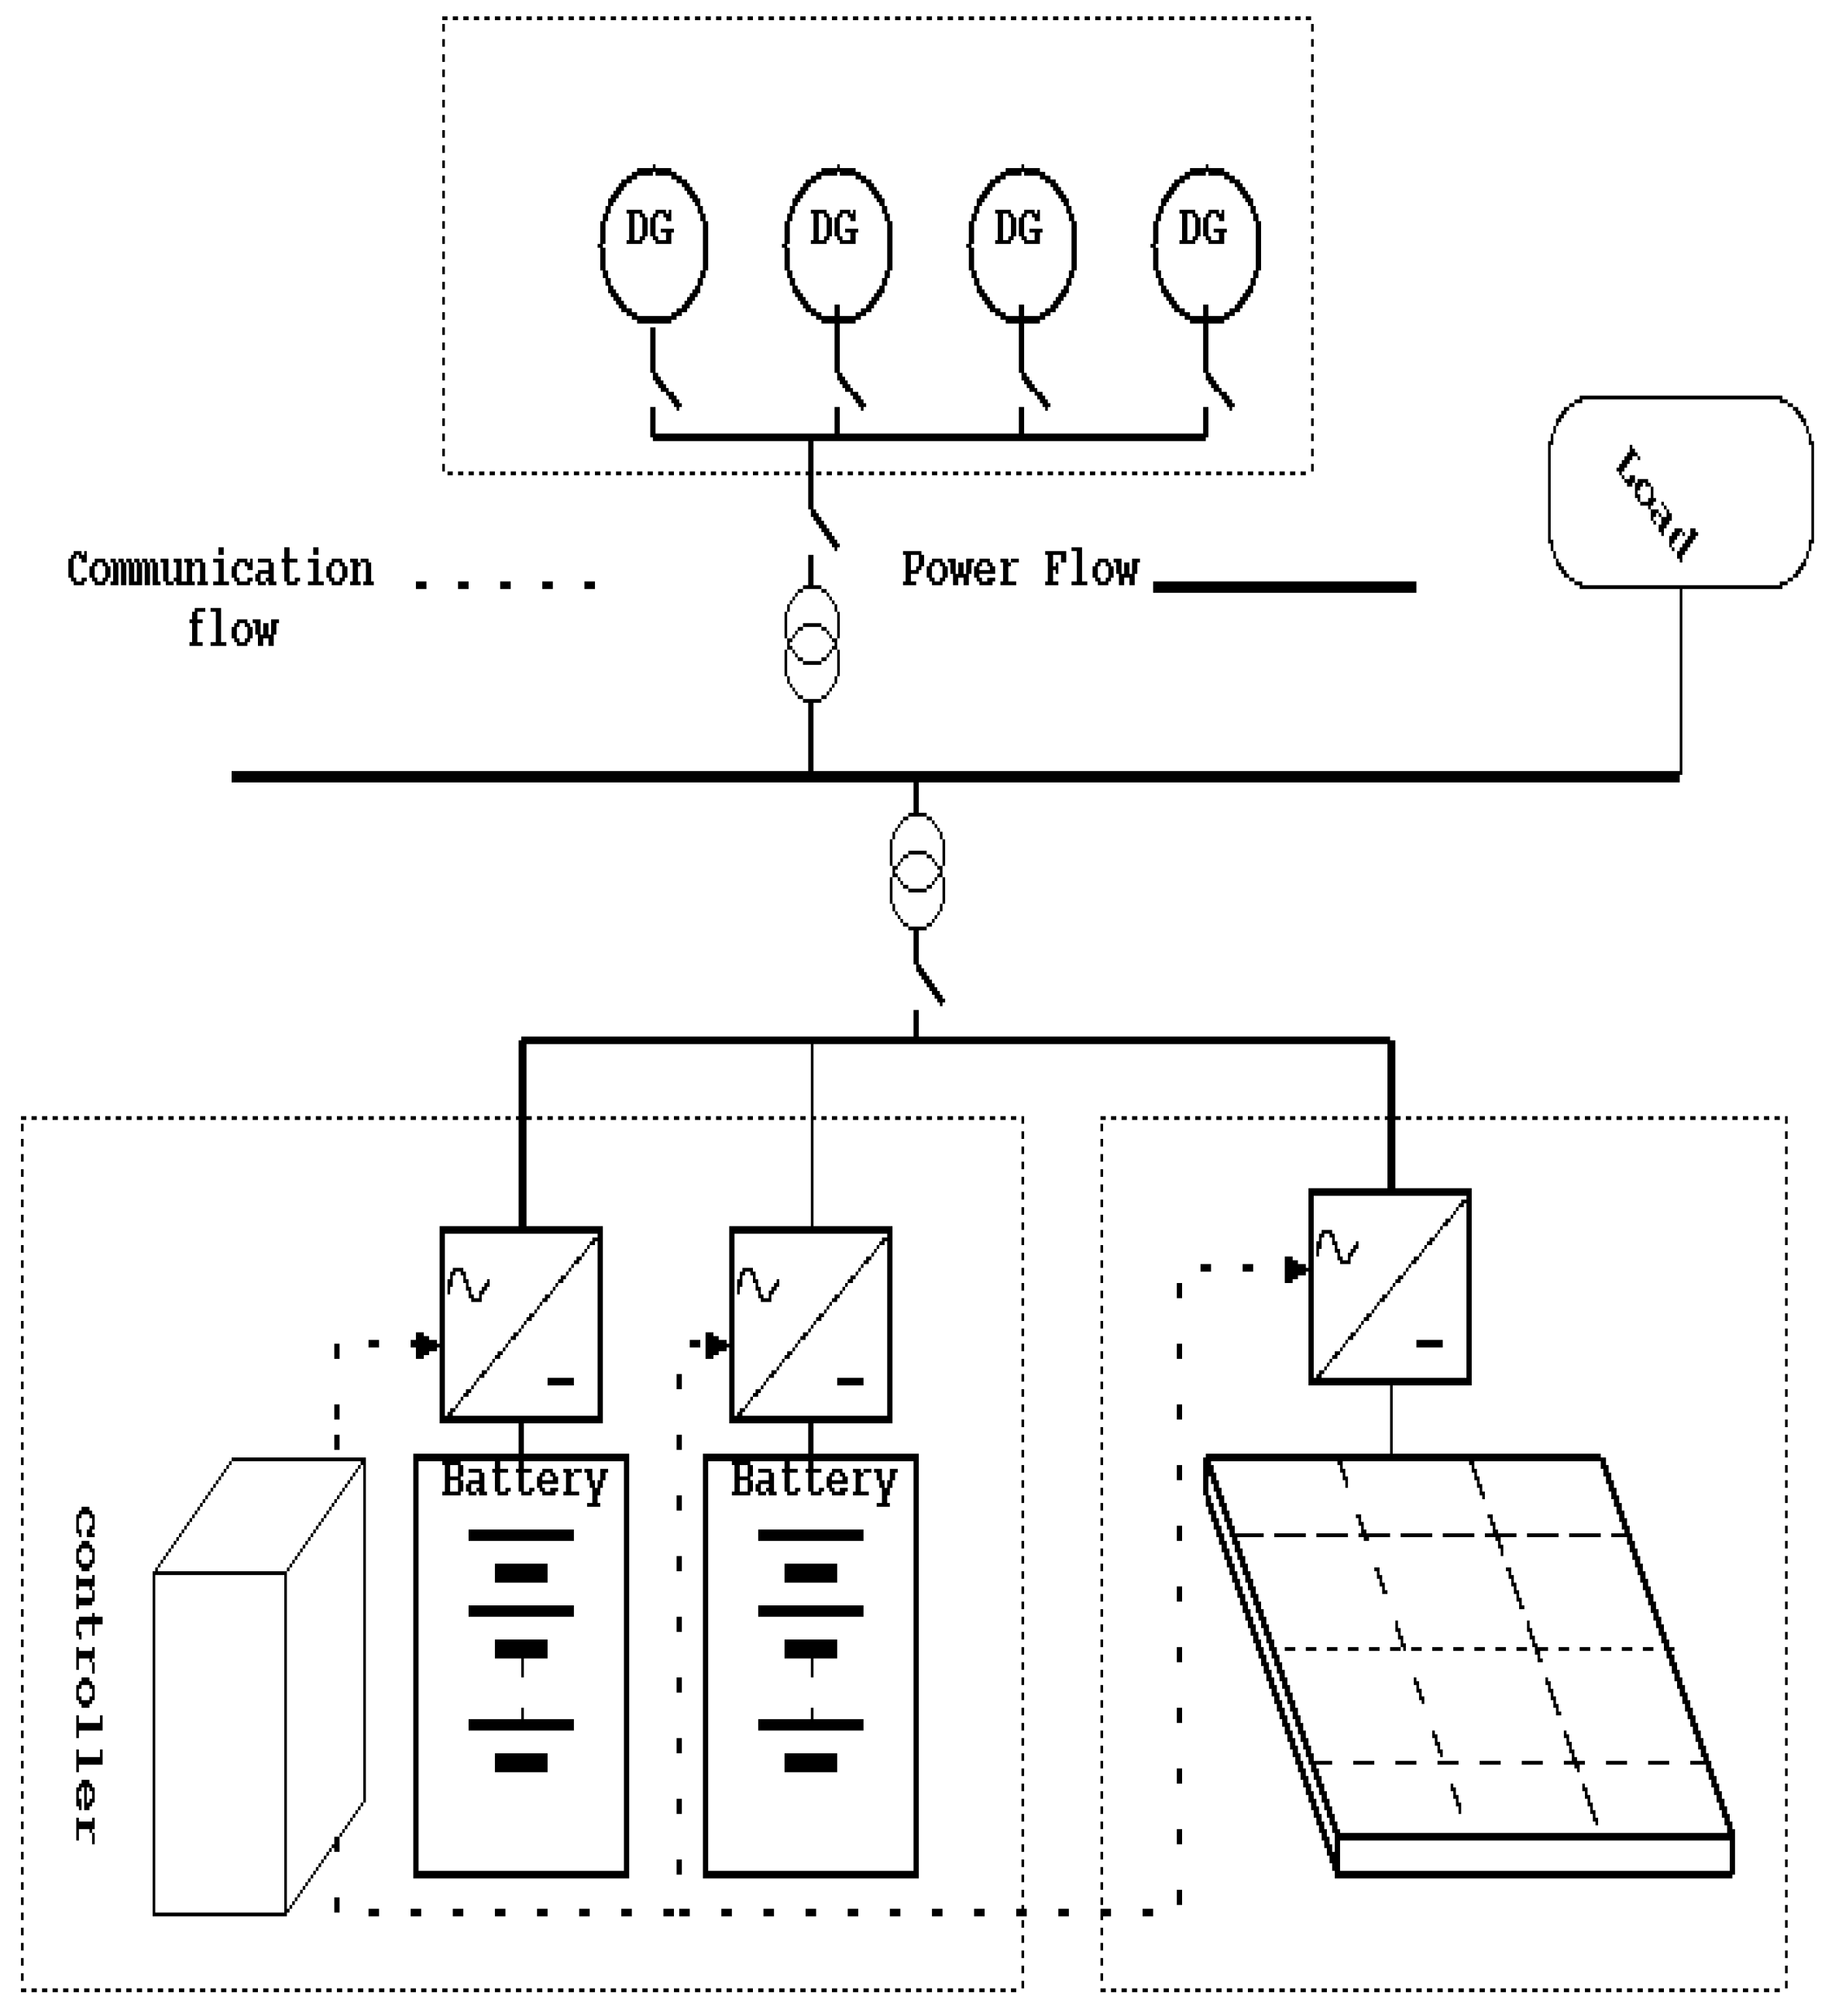
2.2. Phase II: Power System Formulation Introduction of Renewable Energy into Demand Response Program
2.2.1. The Output of PV Array
2.2.2. Battery Energy Storage System(Bess)
3. Case Study and Results of the Simulation
3.1. Results of Dr Program Execution and Analysis (Phase I)
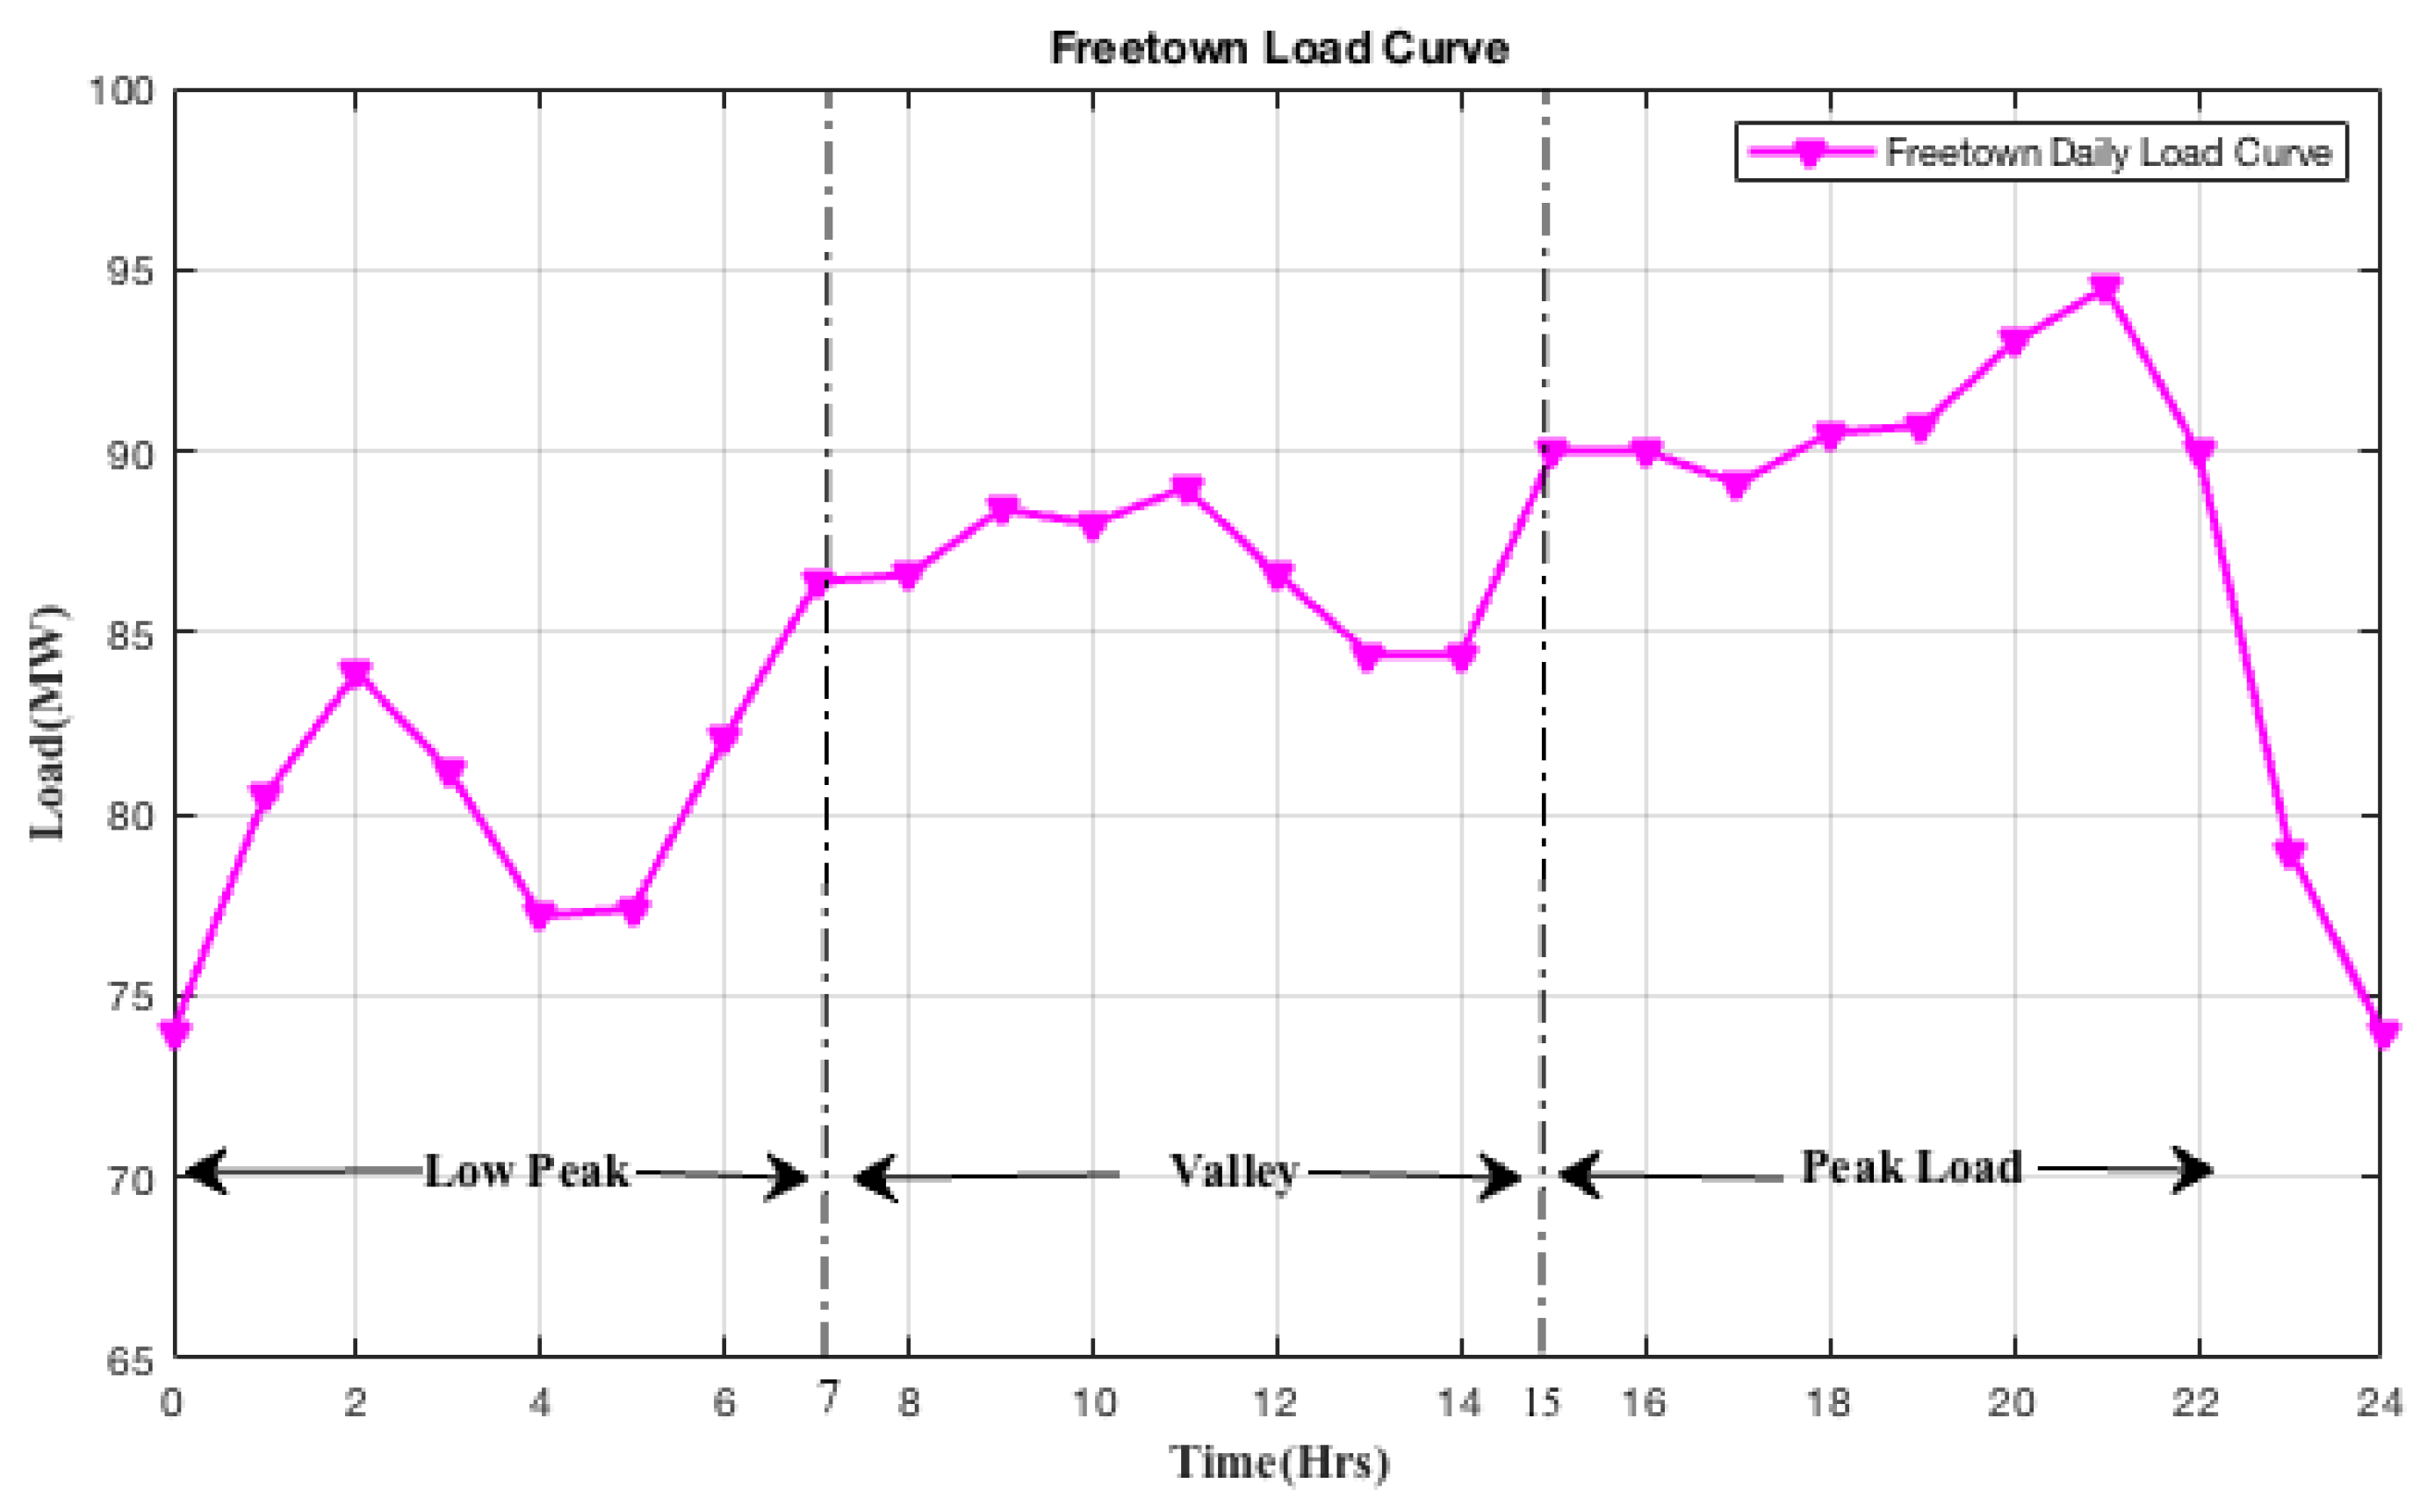
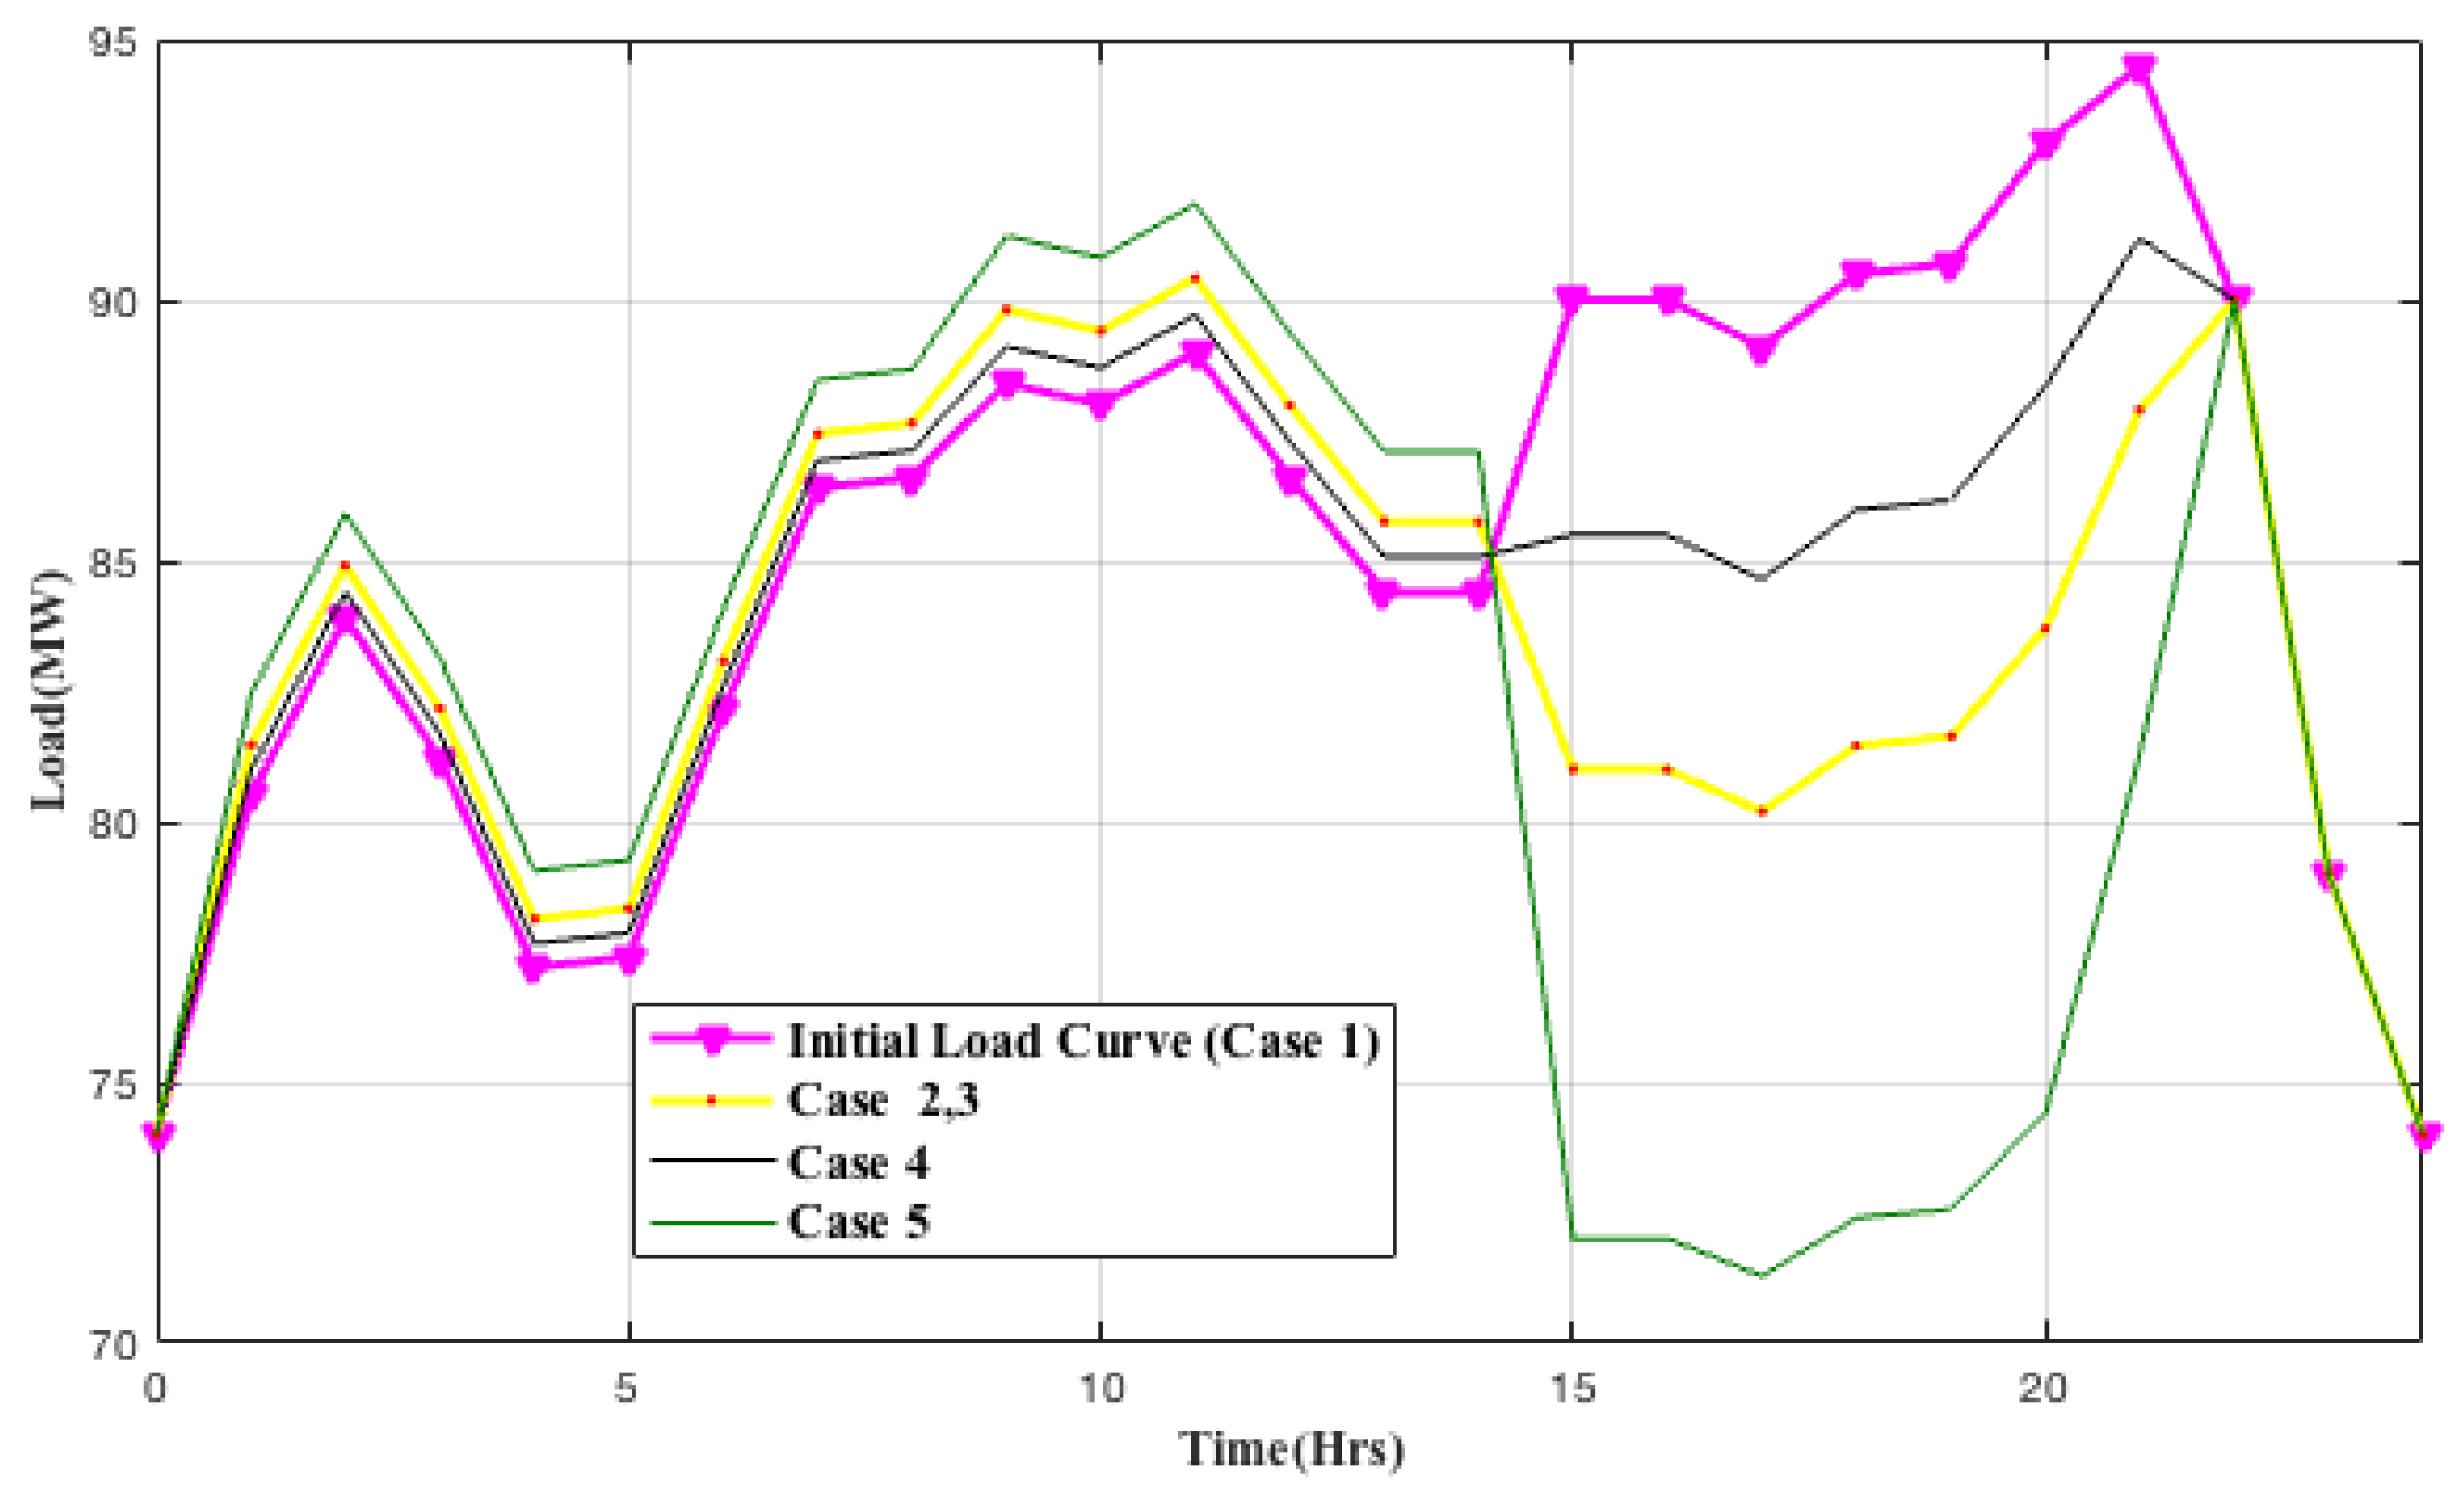
- Case 1 In case I, the peak load curve was considered without the execution of the proposed DR program. As shown in Table 4, the peak load was 94.5 MW, energy consumption was 2057 MWh, customer bill was $366,130, peak to valley distance was 21 MW. These four indices improved after implementation of the proposed DR model, as subsequently explained in the following subsections.
- Case 2 As shown in Table 4, penalty and incentives are taken as 0.178 $/kWh and 0 $/kWh respectively. Comparing the results with the base case, net reductions were observed on the following; peak load, by 4.3% (90.42 MW), energy consumption by 2.2% (2012 MWh), customer bill by (2.2%) $35,160 and peak to valley reduction by 23.8% (16 MW) as shown in Figure 6. Also, the customer benefit increased to $18,813 and supplier benefits reduced by 5.1% ($18,820) as compared to the base case.
- Case 3 In this case, the incentive and penalty are both at the equivalent value of 0.089 $/kWh as observed in Figure 6 which also depicts similar profile characteristic as in case 2 with decrease customers bill by 2.18% ($7970), 4.12% (90.42 MW) of peak load reduction. Also, supplier revenue decreased by 3.13% ($11470) as compared to the base case scenario. The incentive payment in case 2 doubled as in case 3, which is legitimized by Equation (15).
- Case 4 From Table 4, taking penalty and incentives as 0.029 $/kWh and 0.059 $/kWh respectively and comparing the results obtained to that of the case 1, it can be observed that there is net reduction in the following: peak load by 3.5%(91 MW), energy consumption by 1.06% (2035 MWh), and customer bill by 1.1% ($362,190) and peak to valley reduction by 19% (17 MW) as shown in Figure 6.
- Case 5 In this case, given the incentive and penalty values as 0.0178 $/kWh. From the simulation and comparing with the results obtained in case I, it observed that there is a net reduction in energy consumption by 4.35% (1967.40 MWh), customer bill by 4.32% ($350,200) and peak load by 2.80% (91.85 MW) as shown in Figure 6. Also, an increase in supplier revenue, customer benefit was observed from the simulation as shown in Table 4.
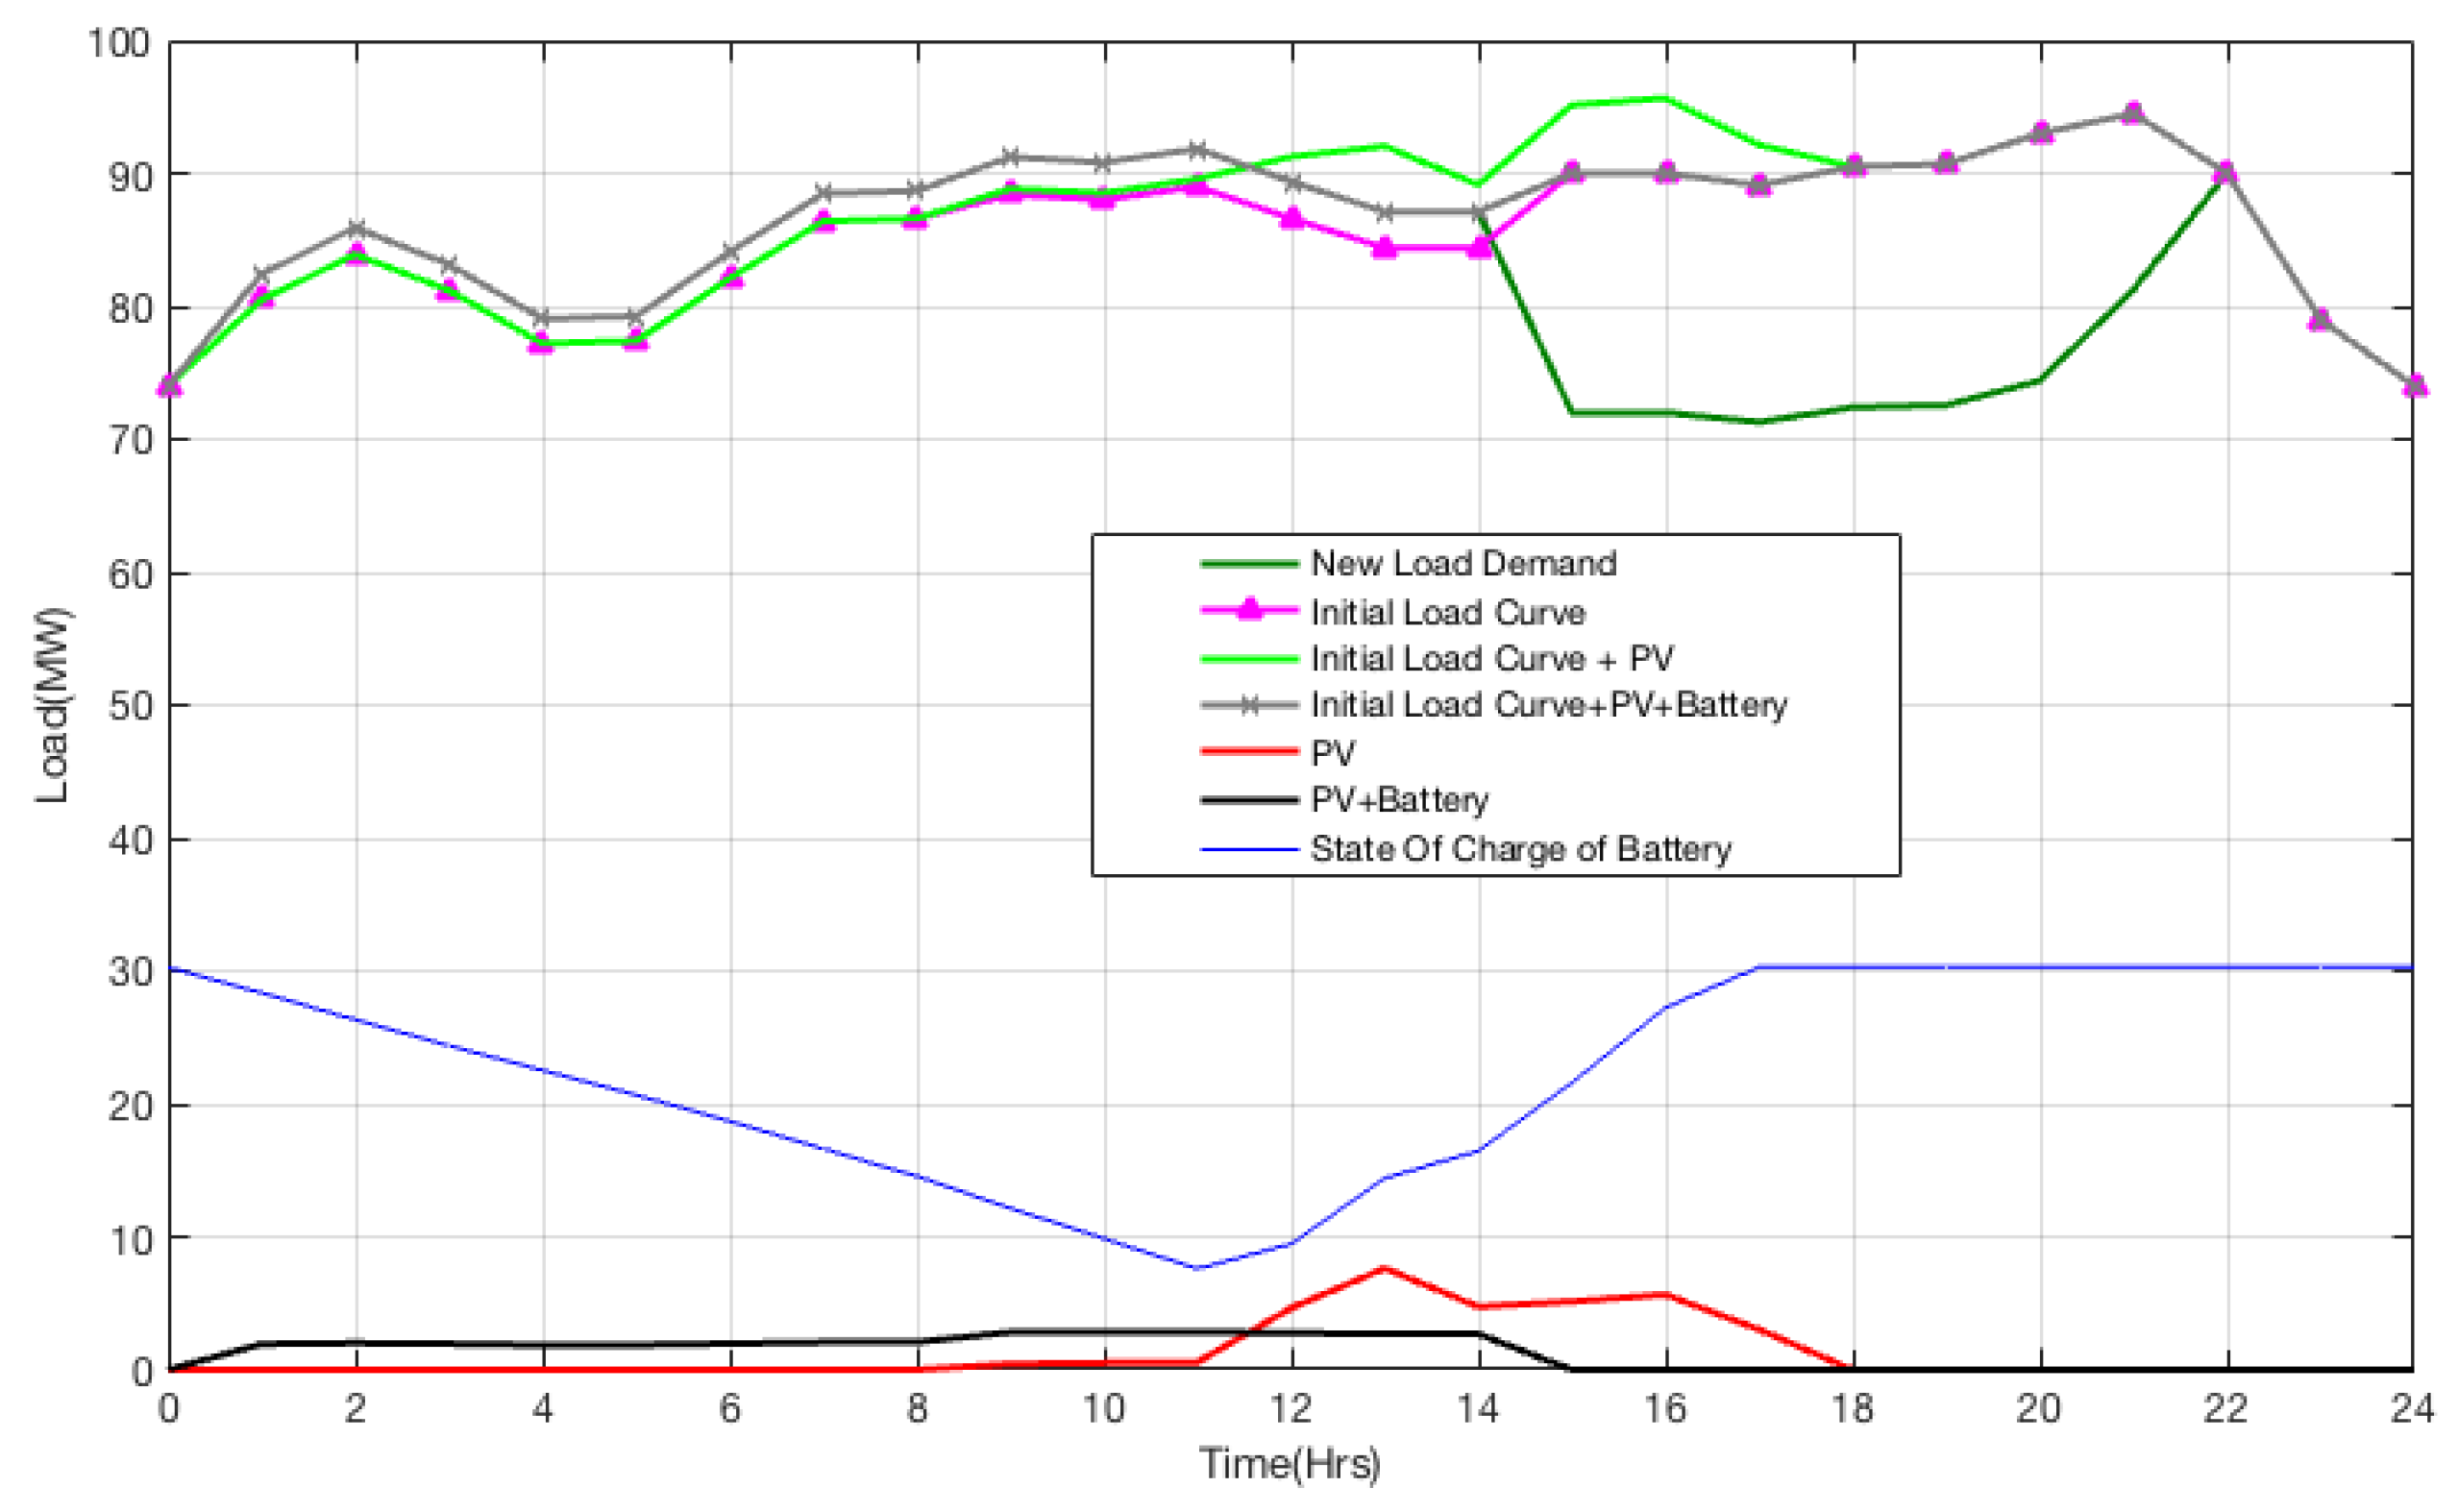
3.2. Results of the Introduction of Renewable Energy (Phase II)
Cost Analysis
- PV system cost The capital investment cost over 20 years period of operation is as shown below, and parameters used in the cost analysis are given in Table 1;where , are the initial investment cost and the total area of the PV respectively. The total operational and maintenance cost () of PV is as shown below, where denotes the escalation rate for 20 years operational period.The PV replacement () cost is considered zero, therefore the total resale price after the 20 years period is as shown;It follows that the total cost of PV over 20 years is
- Battery cost In this research, the project lifetime was 20 years and the lifetime of the battery was five years, it follows that the battery should be replaced three times during the project life cycle. The capital investment cost of the battery for five years is as shown below;Replacement cost after period j is given byTotal replacement for 20 years period
4. Results Discussion
- In phase I, the proposed control scheme was applied to the Freetown distribution network. Five case studies were considered with different incentive and penalty values. The results obtained from the simulation validate the efficiency of the proposed DR control approach to maximize customer profit by decreasing the customer bills and also increasing customer benefits. Furthermore, from the supplier point of view, the proposed methodology succeeded in decreasing the peak load, and reduced the energy consumption; in addition to mitigating the load factor that significantly enhances the power of the power system.
- In phase II; PV and BESS are introduced as RE-sources to meet the variance in load in the valley and Off-peak periods, hence, decreasing the use of conventional diesel generators. This step will lead to a decrease of GHG emissions which has harmful effects on the environment.
- The cost-benefit analysis was implemented to investigate and compare the economic effects of RE sources inclusion to that of convention diesel generators. The results confirm the ability of RE sources to cover the lifecycle cost of the project after twelve years. Depending on these results, the supplier can gain eight years of profit due to the RE energy sources inclusion in addition to its non-hazardous effect on the environment.
5. Conclusions
Author Contributions
Funding
Conflicts of Interest
Nomenclature
| MDI | maximum demand index |
| DR | demand response |
| BESS | battery energy storage |
| GHG | green house gas |
| DSM | demand side management |
| IEA | international energy agency |
| NPA | national power authority |
| EDSA | electricity distribution and supply authority |
| EGTC | electricity generation and transmission company |
| AfDB | Africa Development Bank |
| ISO | independent system operator |
| RDR | residential demand response |
| cross elasticity | |
| self elasticity | |
| initial load. | |
| modified demand | |
| i | i-th period |
| j | j-th period |
| incentive rate | |
| benefit at nominal value | |
| penalty rate | |
| electricity price at nominal value | |
| Y | customer benefit |
| PVout | output power of PV |
| GA | genetic algorithm |
| IPP | independent power producers |
| PV | photovoltaic |
| RE | renewable energy |
| EU | European Union |
| E | elasticity |
| electricity price | |
| l | load demand |
| DR program contract | |
| customer income in period i-th | |
| Incentive revenue payment | |
| levied customer penalty | |
| the efficiency of PV panel | |
| the area occupied by the PV-panel | |
| solar radiation | |
| Sum of aggregated power | |
| PV power in i-th period | |
| aggregated power of thermal units | |
| state of charge of battery | |
| inverter efficiency | |
| hourly discharge rate | |
| battery charging efficiency | |
| nominal capacity of the battery bank | |
| battery discharging efficiency | |
| minimum state of charge of the battery | |
| maximum state of charge of the battery | |
| e | index year |
| capital investment cost | |
| initial investment cost of PV | |
| annual operational and maintenance cost of PV | |
| escalation rate | |
| the replacement cost of PV | |
| resale cost of PV | |
| the inflation rate of PV | |
| total cost of PV over 20 years | |
| capital cost of battery | |
| total number of battery | |
| battery cost | |
| the replacement cost of battery | |
| escalation rate of battery |
References
- The World Bank Global Tracking Framework 2017: Progress Toward Sustainable Energy. Available online: http://www.worldbank.org (accessed on 1 March 2019).
- Lee, J.T.; Callaway, D.S. The cost of reliability in decentralized solar power systems in sub-Saharan Africa. Nat. Energy 2018, 3, 960. [Google Scholar] [CrossRef]
- Owusu, P.A.; Asumadu-Sarkodie, S. A review of renewable energy sources, sustainability issues and climate change mitigation. Cogent Eng. 2016, 3, 1167990. [Google Scholar] [CrossRef]
- UNDP: National Energy Profile of Sierra Leone. Available online: http://www.sl.undp.org (accessed on 5 March 2019).
- STATISTICS SIERRA LEONE: 2015 Population and Housing Census. Available online: https://www.statistics.sl (accessed on 5 March 2019).
- Konneh, D.A.; Howlader, H.O.R.; Shigenobu, R.; Senjyu, T.; Chakraborty, S.; Krishna, N. A Multi-Criteria Decision Maker for Grid-Connected Hybrid Renewable Energy Systems Selection Using Multi-Objective Particle Swarm Optimization. Sustainability 2019, 11, 1188. [Google Scholar] [CrossRef]
- EEG Energy Insight: Developing a Programme of Research on the Electricity Sector in Sierra Leone. Available online: https://assets.publishing.service.gov.uk (accessed on 17 August 2018).
- The Ministry of Foreign Affairs: Sector Scan, The Energy Sector in Sierra Leone. Available online: https://www.rvo.nl (accessed on 5 March 2019).
- The National Electricity ACT, 2011: Supplement of the Sierra Leone Gazette Vol.CXIII, No.6 Dated 9th February 2012. Available online: http://www.sierra-leone.org (accessed on 5 March 2019).
- Konneh, D.; Lotfy, M.; Shigenobu, R.; Senjyu, T. Optimal Sizing of Grid-connected Renewable Energy System in Freetown Sierra Leone. IFAC-PapersOnLine 2018, 51, 191–196. [Google Scholar] [CrossRef]
- Adewuyi, O.B.; Lotfy, M.E.; Akinloye, B.O.; Howlader, H.O.R.; Senjyu, T.; Narayanan, K. Security-constrained optimal utility-scale solar PV investment planning for weak grids: Short reviews and techno-economic analysis. Appl. Energy 2019, 245, 16–30. [Google Scholar] [CrossRef]
- Mohagheghi, S.; Yang, F.; Falahati, B. Impact of demand response on distribution system reliability. In Proceedings of the IEEE Power and Energy Society General Meeting, San Diego, CA, USA, 24–29 July 2011; pp. 1–7. [Google Scholar] [CrossRef]
- Hasani Shoreh, M.; Siano, P.; Shafie-Khah, M.; Loia, V.; Catalão, J. A survey of industrial applications of Demand Response. Electr. Power Syst. Res. 2016, 141, 31–49. [Google Scholar] [CrossRef]
- Behrangrad, M. A review of demand side management business models in the electricity market. Renew. Sustain. Energy Rev. 2015, 47, 270–283. [Google Scholar] [CrossRef]
- Shigenobu, R.; Adewuyi, O.B.; Yona, A.; Senjyu, T. Demand response strategy management with active and reactive power incentive in the smart grid: A two-level optimization approach. AIMS Energy 2017, 5, 482–505. [Google Scholar] [CrossRef]
- Kirschen, D.S.; Strbac, G.; Cumperayot, P.; de Paiva Mendes, D. Factoring the elasticity of demand in electricity prices. IEEE Trans. Power Syst. 2000, 15, 612–617. [Google Scholar] [CrossRef]
- Torriti, J.; Hassan, M.; Leach, M. Demand response experience in Europe: Policies, programmes and implementation. Energy 2010, 35, 1575–1583. [Google Scholar] [CrossRef]
- Alasseri, R.; Tripathi, A.; Joji Rao, T.; Sreekanth, K. A review on implementation strategies for demand side management (DSM) in Kuwait through incentive-based demand response programs. Renew. Sustain. Energy Rev. 2017, 77, 617–635. [Google Scholar] [CrossRef]
- Ming, Z.; Song, X.; Mingjuan, M.; Lingyun, L.; Min, C.; Yuejin, W. Historical review of demand side management in China: Management content, operation mode, results assessment and relative incentives. Renew. Sustain. Energy Rev. 2013, 25, 470–482. [Google Scholar] [CrossRef]
- Eskom’s Energy Efficiency and DEMAND-side Management (EEDSM) Incentive Program. Available online: http://iepd.iipnetwork.org (accessed on 7 March 2019).
- Lorek, S.; Trotta, G. Country Report Finland. An Inventory of Policies, Business and Civil Society Initiatives, Focusing on Heating, Hot Water and the Use of Electricity. EUFORIE—European Futures for Energy Efficiency. 2015. Available online: https://www.researchgate.net/publication/313240816_Country_Report_Finland_An_inventory_of_policies_business_and_civil_society_initiatives_focusing_on_heating_hot_water_and_the_use_of_electricity_EUFORIE_-_European_Futures_for_Energy_Efficiency (accessed on 11 August 2018).
- Regulatory, S.R.F.E. 2018 Assessment of Demand Response and Advanced Metering Commission. Nat. Energy 2018. Available online: https://www.ferc.gov/legal/staff-reports/2018/DR-AM-Report2018.pdf (accessed on 11 August 2018).
- Kopsidas, K.; Galeela, M.M. Utilizing Demand Response to Improve Network Reliability and Ageing Resilience. IEEE Trans. Power Syst. 2018, 34, 2216–2227. [Google Scholar] [CrossRef]
- Aalami, H.; Yousefi, G.R.; Parsa Moghadam, M. Demand Response model considering EDRP and TOU programs. In Proceedings of the 2008 IEEE/PES Transmission and Distribution Conference and Exposition, Chicago, IL, USA, 21–24 April 2008; pp. 1–6. [Google Scholar] [CrossRef]
- Nikzad, M.; Mozafari, B. Reliability assessment of incentive- and priced-based demand response programs in restructured power systems. Int. J. Electr. Power Energy Syst. 2014, 56, 83–96. [Google Scholar] [CrossRef]
- Xia, X.; Setlhaolo, D.; Zhang, J. Residential demand response strategies for South Africa. In Proceedings of the IEEE PES Power Africa 2012-Conference and Exhibition, Johannesburg, South Africa, 9–13 July 2012; pp. 1–6. [Google Scholar] [CrossRef]
- Weather Atlas: Monthly Weather Forecast and Climate Freetown, Sierra Leone. Available online: https://www.weather-atlas.com (accessed on 11 August 2018).
- International Energy Agency: Strategic Plan. Available online: http://www.ieadsm.org/strategic-plan (accessed on 8 May 2019).
- Albadi, M.H.; El-Saadany, E.F. Demand Response in Electricity Markets: An Overview. In Proceedings of the 2007 IEEE Power Engineering Society General Meeting, Tampa, FL, USA, 24–28 June 2007; pp. 1–5. [Google Scholar] [CrossRef]
- Federal Energy Regulatory Commission Staff Report: 2012 Assessment of Demand Response and Advanced Metering Staff Report. Available online: https://www.ferc.gov/legal/ (accessed on 10 November 2018).
- Aalami, H.; Moghaddam, M.P.; Yousefi, G. Demand response modeling considering Interruptible/ Curtailable loads and capacity market programs. Appl. Energy 2010, 87, 243–250. [Google Scholar] [CrossRef]
- Asumadu-Sarkodie, S.; Sevinç, C.; Jayaweera, H.M. A hybrid solar photovoltaic-wind turbine-Rankine cycle for electricity generation in Turkish Republic of Northern Cyprus. Cogent Eng. 2016, 3, 1180740. [Google Scholar] [CrossRef]
- Sediqi, M.M.; Furukakoi, M.; Lotfy, M.E.; Yona, A.; Senjyu, T. Optimal Economical Sizing of Grid-Connected Hybrid Renewable Energy System. J. Energy Power Eng. 2017, 11. [Google Scholar] [CrossRef]
- Electricity Distribution and Supply Authority. Available online: http://www.edsa.sl/ (accessed on 10 December 2018).
- Ministry of Energy (MoE). Available online: http://www.energy.gov.sl/ (accessed on July 2018).
- Nikoukar, J. Unit commitment considering the emergency demand response programs and interruptible/ curtailable loads. Turk. J. Electr. Eng. Comput. Sci. 2018, 26, 1069–1080. [Google Scholar] [CrossRef]
- Solar Energy for Professionals. Available online: http://www.soda-pro.com (accessed on 5 August 2018).
- Solano-Peralta, M.; Moner-Girona, M.; van Sark, W.; Vallve, X. “Tropicalisation” of Feed-in Tariffs: A custom-made support scheme for hybrid PV/diesel systems in isolated regions. Renew. Sustain. Energy Rev. 2009, 13, 2279–2294. [Google Scholar] [CrossRef]


| VARIABLE | NOMENCLATURE | VALUE |
|---|---|---|
| Interest rate | i | 0.1 |
| Index year | e (years) | |
| Inflation rate | 0.04 | |
| Escalation rate | 0.075 | |
| Inverter efficiency | 0.9 | |
| PV Initial cost | m) | 251 |
| Total Area of PV | (m) | |
| Annual O&M Cost of PV | ($/m/yr) | |
| The replacement cost of PV | ($) | 0 |
| Resale price of PV | ||
| PV efficiency | 0.14 | |
| The capital Investment cost of PV | ($) | |
| Battery charging efficiency | 0.9 | |
| Battery discharging efficiency | 0.9 | |
| Number of Batteries | ||
| Battery cost | ($/MW) | 200,000 |
| Battery replacement cost | ||
| Hourly self discharge | 0 | |
| Battery Capacity | 50 kW |
| CASE | INCENTIVE $/kWh | PENALTY $/kWh |
|---|---|---|
| 1 | 0 | 0 |
| 2 | 0.178 | 0 |
| 3 | 0.089 | 0.089 |
| 4 | 0.029 | 0.059 |
| 5 | 0.178 | 0.178 |
| Period | Low Peak (00:00–7:00) | Valley (8:00–14:00) | Peak Load (15:00–22:00) |
|---|---|---|---|
| Low Peak (00:00–7:00) | −0.1 | 0.01 | 0.012 |
| Valley (8:00–14:00) | 0.01 | −0.1 | 0.016 |
| Peak Load (15:00–22:00) | 0.012 | 0.016 | −0.1 |
| PARAMETERS | CASE-1 (Base) | CASE-2 | CASE-3 | CASE-4 | CASE-5 |
|---|---|---|---|---|---|
| Incentive = 0.0 Penalty = 0.0 | Incentive = 0.178 Penalty = 0 | Incentive = 0.089 Penalty = 0.089 | Incentive = 0.029 Penalty = 0.059 | Incentive = 0.178 Penalty = 0.178 | |
| Energy Consumption (MWh) | 2056.90 | 2012.20 | 2012.20 | 2034.80 | 1967.40 |
| Customer Bill ($) | 366,130.00 | 358,160.00 | 358,160.00 | 362,190.00 | 350,200.00 |
| Peak Load (MW) | 94.50 | 90.42 | 90.42 | 91.22 | 91.85 |
| Load Factor (%) | 90.69 | 92.72 | 92.72 | 92.93 | 89.25 |
| Incentive ($) | 0.00 | 10,848.00 | 5424.10 | 873.77 | 21,696.00 |
| Penalty ($) | 0.00 | 0.00 | 1924.70 | 3054.70 | 3585.00 |
| Customer Benefit ($) | 0.00 | 18,813.00 | 13,137.00 | 3826.30 | 37,627.00 |
| Supplier Revenue ($) | 366,130.00 | 347,310.00 | 354,660.00 | 364,370.00 | 332,090.00 |
| Energy reduction (%) | 0 | 2.22 | 2.22 | 1.09 | 4.55 |
| Peak Reduction (%) | 0 | 4.31 | 4.31 | 3.46 | 2.81 |
| Peak to Valley (MW) | 20.50 | 16.42 | 16.42 | 17.23 | 20.57 |
| Time | Solar Radiation w/m | Time | Solar Radiation w/m |
|---|---|---|---|
| 0:00 | 0 | 12:00 | 531 |
| 1:00 | 0 | 13:00 | 873 |
| 2:00 | 0 | 14:00 | 543 |
| 3:00 | 0 | 15:00 | 587 |
| 4:00 | 0 | 16:00 | 646 |
| 5:00 | 0 | 17:00 | 347 |
| 6:00 | 0 | 18:00 | 0 |
| 7:00 | 0 | 19:00 | 0 |
| 8:00 | 0 | 20:00 | 0 |
| 9:00 | 50 | 21:00 | 0 |
| 10:00 | 60 | 22:00 | 0 |
| 11:00 | 66 | 23:00 | 0 |
© 2019 by the authors. Licensee MDPI, Basel, Switzerland. This article is an open access article distributed under the terms and conditions of the Creative Commons Attribution (CC BY) license (http://creativecommons.org/licenses/by/4.0/).
Share and Cite
Conteh, A.; Lotfy, M.E.; Kipngetich, K.M.; Senjyu, T.; Mandal, P.; Chakraborty, S. An Economic Analysis of Demand Side Management Considering Interruptible Load and Renewable Energy Integration: A Case Study of Freetown Sierra Leone. Sustainability 2019, 11, 2828. https://doi.org/10.3390/su11102828
Conteh A, Lotfy ME, Kipngetich KM, Senjyu T, Mandal P, Chakraborty S. An Economic Analysis of Demand Side Management Considering Interruptible Load and Renewable Energy Integration: A Case Study of Freetown Sierra Leone. Sustainability. 2019; 11(10):2828. https://doi.org/10.3390/su11102828
Chicago/Turabian StyleConteh, Abdul, Mohammed Elsayed Lotfy, Kiptoo Mark Kipngetich, Tomonobu Senjyu, Paras Mandal, and Shantanu Chakraborty. 2019. "An Economic Analysis of Demand Side Management Considering Interruptible Load and Renewable Energy Integration: A Case Study of Freetown Sierra Leone" Sustainability 11, no. 10: 2828. https://doi.org/10.3390/su11102828
APA StyleConteh, A., Lotfy, M. E., Kipngetich, K. M., Senjyu, T., Mandal, P., & Chakraborty, S. (2019). An Economic Analysis of Demand Side Management Considering Interruptible Load and Renewable Energy Integration: A Case Study of Freetown Sierra Leone. Sustainability, 11(10), 2828. https://doi.org/10.3390/su11102828