Article

Optimal Design and Application of a Multiple Tuned Mass Damper System for an In-Service Footbridge

1
Department of Disaster Mitigation for Structures, Tongji University, Shanghai 200092, China
2
Shanghai Research Institute of Building Sciences, Shanghai 200032, China
*
Author to whom correspondence should be addressed.
Sustainability 2019, 11(10), 2801; https://doi.org/10.3390/su11102801
Submission received: 23 April 2019 / Revised: 13 May 2019 / Accepted: 14 May 2019 / Published: 16 May 2019
(This article belongs to the Section Sustainable Engineering and Science)

Abstract

:
Slender steel footbridges suffer excessive human-induced vibrations due to their low damping nature and their frequency being located in the range of human-induced excitations. Tuned mass dampers (TMDs) are usually used to solve the serviceability problem of footbridges. A multiple TMD (MTMD) system, which consists of several TMDs with different frequencies, has a wide application in the vibration control of footbridges. An MTMD system with well-designed parameters will have a satisfactory effect for vibration control. This study firstly discusses the relationship between the acceleration dynamic amplification factor and important parameters of an MTMD system, i.e., the frequency bandwidth, TMD damping ratio, central frequency ratio, mass ratio and the number of TMDs. Then, the frequency bandwidth and damping ratio optimal formulas are proposed according to the parametric study. At last, an in-service slender footbridge is proposed as a case study. The footbridge is analyzed through a finite element model and an in situ test, and then, an MTMD system is designed based on the proposed optimal design formulas. The vibration control effect of the MTMD system is verified through a series of in situ comparison tests. Results show that under walking, running and jumping excitations with different frequency, the MTMD system always has an excellent vibration control effect. Under a crowd-induced excitation with the resonance frequency, the footbridge with an MTMD system can meet the acceleration limit requirement. It is also found that the analysis result agrees well with the in situ test.

1. Introduction

Because of the beautiful architectural appearance, short construction period and high economy, slender steel footbridges became more and more popular than before and were common in urban areas [1,2,3,4,5,6,7,8]. With the development of high-performance materials, footbridges became slenderer and lighter [9,10,11]. However, slender steel footbridges usually had a low damping ratio, and their frequency was located in the range of human-induced excitations [12,13], e.g., walking, running and jumping excitations. They were suffering from excessive human-induced vibrations [14]. When the resonance phenomenon happens, it would cause a more and more conspicuous serviceability problem [15].
To solve the serviceability problem, one choice was to strengthen the footbridge. However, this would cause the waste of materials and environmental pollution, but obtains little effect. A sustainable way was to use structural control technology [16]. One of the most traditional structural control devices was the tuned mass damper (TMD), which consisted of a mass element, a stiffness element and a damping element. It was usually used to control the in-service human-induced vibrations of the slender footbridges [17]. When the frequency of a TMD was well-tuned and its damping ratio was also reasonable, it would have an excellent vibration control effect [18]. TMDs already had a wide application in vertical pedestrian induced vibration control. Moutinho et al. [19] controlled a footbridge using passive and semiactive TMDs. Lievens et al. [20] designed a TMD for a footbridge to improve its serviceability. Elsa et al. [21] proposed the implementation of TMDs to protect the Pedro e Inês footbridge. Casado et al. [22] proposed the implementation of passive and active TMDs for an in-service pedestrian bridge. Tubino and Piccardo [23] optimized a TMD to control the human-induced vibration of footbridges. Huang et al. [24] proposed a shape memory alloy (SMA)-based TMD to reduce the excessive human-induced vibration. Rathi and Chakraborty [25] optimized the TMD considering the reliability-based performance. Lievens et al. [26] proposed a robust vibration serviceability assessment of footbridges under pedestrian excitations. Rezaei and Banazadeh [27] proposed a probabilistic risk-based performance evaluation of seismically base-isolated steel structures under far-field earthquakes. Tajammolian et al. [28] presented a seismic fragility assessment of asymmetric structures supported on TCFP bearings subjected to near-field earthquakes. From References [26,27,28], it could be known that supplemental dampers (such as TMD) can be used in parallel to other controlling devices (such as base isolations) to optimally design the performance.
However, a TMD had a narrow control bandwidth, and it is sensitive to the frequency deviation [29,30,31,32]. When a TMD was mistuned due to the unreasonable design and the variation of the primary structural frequency, its vibration control effect would decrease [33,34]. A multiple TMD (MTMD) system, which consisted of several TMDs with different frequency, had a wide application in vibration control of footbridges [35]. An MTMD system could extend the control bandwidth of a single TMD, and therefore, it was more robust and effective.
There were several pieces of research and real project applications of MTMD systems. Carpineto et al. [35] mitigated the human-induced vibration in suspension footbridges using MTMDs. Li et al. [36] presented the crowd-induced random vibration control using MTMDs. Lu et al. [37] applied an MTMD system to control the human-induced vibration in the Expo Culture Centre. Gaspar et al. [38] studied the multimode vibration control using MTMDs, under the human rhythmic activities. Daniel et al. [39] proposed the multimode control of footbridges using MTMDs. Jokic et al. [40] presented a reduced-order optimization of MTMDs. Roman and Justyna [41] carried a dynamic analysis of structures with MTMDs. Hoang and Warnitchai [42] designed an MTMD system through a numerical optimizer. Nakhorn et al. [43] proposed a nonlinear MTMD system for a footbridge. Recently, Li et al. [6] proposed a numerical study of vibration control of a large-span pedestrian suspension bridge using an MTMD system. Wang et al. [7] presented the vertical human-induced vibration control of a long-span steel footbridge using TMDs. Though they are both important contributions, however, the detail parametric study and optimal design method are absent in these two references.
For a single TMD, it was generally accepted that the parameters could be optimized according to Reference [44]. However, to the knowledge of the authors, there was still no widely-recognized design criteria for an MTMD system. There was little research about how to design the main parameters of an MTMD system, i.e., the central frequency ratio, mass ratio, the number of TMDs, frequency bandwidth and damping ratio. In order to fill this blank, a parametric study and an in-service footbridge case study were proposed in this paper.
To propose an optimal design method of an MTMD system, it was necessary to parametrically study every important parameter in the MTMD system first, which had not been proposed in other papers. Then, the optimal process of an MTMD system was concluded and further verified through a particular case study. Therefore, this paper firstly discussed the parameters of an MTMD system, i.e., the frequency bandwidth, TMD damping ratio, central frequency ratio, mass ratio and the number of TMDs. Then the frequency bandwidth and damping ratio optimal formulas were proposed according to the parametric study, which are shown in Section 2. Then, the optimal design process of an MTMD system was proposed in Section 2.7. Section 3 presented an in-service slender steel footbridge as a case study. The footbridge was analyzed through the finite element model and an in situ test, and then, an MTMD system was designed based on the proposed optimal design formulas. Section 4 presented a series of in situ human-induced vibration comparison tests to verify the control effect of the MTMD.

2. Parametric Study and Optimal Design

2.1. Schematic Diagram and Dynamic Analysis

For a simply supported footbridge, the first vertical mode is usually dominated [13]. Therefore, this kind of footbridge can be simplified as a single-degree-of-freedom (SDOF) system. When it is coupled with an MTMD system, the schematic diagram is shown in Figure 1, under a vertical harmonic excitation.
In Figure 1, m s , k s and c s are the mass, stiffness and damping coefficients of the primary structure. n is the total number of TMDs in the MTMD system. m n , k n and c n are the mass, stiffness and damping coefficient of the TMD with the numerical order n . P and ω are the amplitude and circular frequency of the external harmonic excitation respectively. t means the time. It is assumed that the TMD is arranged in order of frequency increase, and their frequency is in an arithmetic progression.
The dynamic equation of the dynamic system in Figure 1 can be written as
[ m s m 1 m n ] [ x ¨ s x ¨ 1 x ¨ n ] + [ c s + j = 1 n c j c 1 c n c 1 c 1 c n c n ] [ x ˙ s x ˙ 1 x ˙ n ] + [ k s + j = 1 n k j k 1 k n k 1 k 1 k n k n ] [ x s x 1 x n ] = [ P e i ω t 0 0 ]
In Equation (1), j is the numerical order of a TMD in the MTMD system. Under a harmonic excitation, the dynamic response in the steady state can be written as [1]
{ x s = H s e i w t x j = H j e i w t ,
In Equation (2), H s and H j are the response amplitude of the primary structure and a TMD with the numerical order j , respectively. To analyze the relationship between the primary structural response and the parameters of an MTMD system, H s can be firstly calculated as
H s = P k s w 2 m s + i w c s w 2 j = 1 n m j k j + i w c j k j + i w c j w 2 m j ,
For simplification, it is defined that primary structural circular frequency ω s = k s m s ; circular frequency of the TMD with the numerical order j , ω j = k j m j ; damping ratio of the primary structure ξ s = c s 2 m s ω s ; excitation frequency ratio g = ω ω s ; TMD frequency ratio f j = ω j ω s ; single TMD mass ratio with the numerical order j μ j = m j m s ; MTMD mass ratio μ = j = 1 n μ j ; central frequency ratio f T = ω T ω s , where ω T is the central frequency of TMDs in an MTMD system; frequency bandwidth ratio χ = ω n ω 1 ω T , where ω n is the circular frequency of the last TMD with the maximum frequency, and ω 1 is the circular frequency of the first TMD with the minimum frequency; TMD damping ratio ξ j = c j 2 m j ω j , where m j , k j and c j are the mass, stiffness and damping coefficient of the TMD with the numerical order j , and it is assumed that all TMDs have the same damping ratio.
As for the serviceability problem, the primary structural acceleration response is usually used as the evaluation index. The detailed acceleration limit value can be found in References [45,46,47,48,49,50], and also according to the requirement of the client. Then, the acceleration dynamic amplification factor can be calculated as
D M F a c c = g 2 R z 2 + I z 2 ,
In Equation (4), R z and I z mean that
{ R z = 1 g 2 g 2 j = 1 n μ j f j 2 ( f j 2 g 2 ) + ( 2 ξ j f j g ) 2 ( f j 2 g 2 ) 2 + ( 2 ξ j f j g ) 2 I z = 2 ξ s g + g 4 j = 1 n μ j 2 ξ j f j g ( f j 2 g 2 ) 2 + ( 2 ξ j f j g ) 2 ,
It can be seen in Equations (4) and (5) that the primary structural acceleration dynamic amplification factor is mainly related to the frequency bandwidth, TMD damping ratio, central frequency ratio, mass ratio and the number of TMDs in the MTMD system. Therefore, in order to decrease the primary structural acceleration response, it is necessary to discuss and optimally design these parameters.
Considering that the damping ratio of the slender footbridge is low and for simplification, in the following parametric discussion, ξ s is ignored and set to be zero. It can be known from Reference [23] that for a single TMD, the optimal frequency is f T = 1 / ( μ + 1 ) , and it is also reasonable when f T = 1 . To find a better choice for the MTMD system, these two cases will be compared in the following.

2.2. Discussion on the Frequency Bandwidth and TMD Damping Ratio

The relationship between D M F a c c and excitation frequency ratio g , with different TMD damping ratios ξ T is shown in Figure 2.
In Figure 2, the number of TMDs is 5, the frequency bandwidth is set to be 0.225, the MTMD mass ratio is 4.0% and f T = 1 . It can be seen that because it is a six DOF system, there are six distinct crests when the TMD damping ratio is low ( ξ T = 1.9 % ). As the ξ T increases, the maximum D M F a c c will decrease firstly and then increase. It also can be known from Figure 2 that, in this case, the optimal ξ T is about 4.9%.
The relationship between D M F a c c and excitation ratio g , with different frequency bandwidth χ is shown in Figure 3. In Figure 3, the TMD damping ratio ξ T is set to be 4.9%, for example.
It is proposed in Figure 3 that, when χ = 0.0 , which means that it becomes a single TMD, the D M F a c c is at its maximum compared to the other three cases. As the χ increases, the maximum D M F a c c decreases firstly and then increases. Therefore, there is an optimum value for the frequency bandwidth χ .
In order to further study the tendency between D M F a c c , χ and ξ T , the relationship between D M F a c c and χ , with different ξ T is presented in Figure 4, and the relationship between the maximum D M F a c c and ξ T , with different χ is presented in Figure 5.
In Figure 4, it is obvious that as χ increases, Tuned mass dampers D M F a c c decreases firstly and then increases. The similar conclusion can be obtained from Figure 5 that, as ξ T increases, D M F a c c decreases firstly and then increases. Therefore, it is no doubt that there are optimal values for χ and ξ T , respectively.

2.3. Optimal Design of the Frequency Bandwidth and TMD Damping Ratio

The same as Section 2.2, when the number of TMDs is 5, the MTMD mass ratio is 4.0% and f T = 1 , the relationship between D M F a c c , ξ T and χ is shown in Figure 6.
In Figure 6, it is clear that in this case, the optimal TMD damping ratio ξ o p t is 4.9%, and the optimal frequency bandwidth χ o p t is 0.225.
The optimal goal is to minimize the maximum D M F a c c . Through the aforementioned method, when the number of TMDs n is in the range of (2, 12) and the MTMD mass ratio μ is in the range of (0.005, 0.100), the optimal frequency bandwidth χ o p t and the optimal TMD damping ratio ξ o p t can be calculated through the following formulas ( f T = 1 ):
χ o p t = 1.048 0.498 ln ( n ) + 0.27 ln ( μ ) + 0.108 ln 2 ( n ) + 0.02 ln 2 ( μ ) 0.05 ln ( μ ) ln ( n ) ,
ξ o p t = 0.175 + 0.092 n + 0.058 ln ( μ ) + 0.074 n 2 + 0.005 ln 2 ( μ ) + 0.019 ln ( μ ) n ,
D M F o p t = 1.136 μ 0.486 0.023 ln ( n ) + 0.334 ,
When the central frequency ratio is f T = 1 / ( μ + 1 ) , χ o p t and ξ o p t can be calculated through the following formulas:
χ o p t = 1.065 0.48 ln ( n ) + 0.269 ln ( μ ) + 0.063 ln 2 ( n ) + 0.018 ln 2 ( μ ) 0.062 ln ( μ ) ln ( n ) ,
ξ o p t = n μ 1.595 + 1.122 n + 8.139 μ + 0.014 ,
D M F o p t = 1.136 μ 0.486 0.023 ln ( n ) + 0.334 ,
Then, it can be concluded that after the MTMD mass ratio μ and the number of TMDs n are chosen, χ o p t and ξ o p t can be calculated through Equation (6)–(8) or (9)–(11). To see the tendency between χ o p t and μ , and ξ o p t and μ clearly, Equation (4) and Equation (5) are drawn in Figure 7a,b, respectively, for example. To see the tendency between χ o p t and n , and ξ o p t and n clearly, Equation (4) and Equation (5) are drawn in Figure 8a,b, respectively, for example.
It can be seen in Figure 7 that the increment of χ o p t and ξ o p t is in direct proportion to the increment of μ . In Figure 8, as the n increases, χ o p t also increases; however, ξ o p t decreases as the n increases.
In Equations (8) and (11), D M F o p t is also related to the MTMD mass ratio μ and the number of TMDs n . Therefore, it is necessary to discuss the central frequency ratio f T , mass ratio μ and the number of TMDs n in the MTMD system.

2.4. Discussion on the Central Frequency Ratio

The relationship between D M F o p t and the number of TMDs n , with different MTMD mass ratios μ and central frequency ratio f T is shown in Figure 9. In Figure 9, for different μ , n and f T , the ξ o p t and χ o p t can be calculated from Equations (4) and (5).
From Figure 9, it can be known that with a larger mass ratio μ , D M F o p t will have a smaller value; D M F o p t decreases as the number of TMDs n increases, however, the drop rate is small after n = 4 . In all cases, the f T = 1 case has a smaller D M F o p t than the f T = 1 / ( μ + 1 ) case. Therefore, it is suggested that the central frequency ratio f T can be set to be 1.

2.5. Discussion on the Mass Ratio

The relationship between D M F o p t and the MTMD mass ratio μ , with different numbers of TMD n , and the relationship between D M F o p t and the excitation ratio g , with different MTMD mass ratio μ , are proposed in Figure 10 respectively.
From Figure 10a, it can be seen that D M F o p t decreases as μ increases and the curve of n = 3 and n = 12 are quite similar. It can be known from Figure 10b that in a wide excitation frequency bandwidth, D M F o p t decreases as μ increases, however, the increment rate is smaller when μ is larger.
In general, D M F o p t is inversely proportional to μ . However, in real projects, it may be impossible to obtain a too-large mass ratio, and it should be reasonable.

2.6. Discussion on the Number of TMDs

The relationship between D M F o p t and the number of TMDs n , with different MTMD mass ratios μ , and the relationship between D M F o p t and the excitation ratio g , with different number of TMD n , are presented in Figure 11 respectively.
From Figure 11a, it can be seen that D M F o p t decreases as n increases from 1 to 3, and then, it is steady. The same conclusion can be obtained from Figure 11b. In real projects, it may be inconvenient to produce and implement too many TMDs with different frequencies. Therefore, the number of TMDs is suggested to be 3~5.

2.7. Design Process of an MTMD System

As aforementioned, an MTMD system with well-designed parameters will have a satisfactory effect for man-induced vibration control. The relationship between the acceleration dynamic amplification factor and important parameters of an MTMD system, i.e. the frequency bandwidth, TMD damping ratio, central frequency ratio, mass ratio and the number of TMDs, has been discussed in detail in the previous sections. A general design method and process of an MTMD system is concluded and proposed in this section.
Firstly, the MTMD mass ratio should be chosen. An MTMD system with a larger mass ratio will has a better vibration control effect. However, in real projects, it may be impossible to obtain a too-large mass ratio. Usually, the MTMD mass ratio is located in the range of 1~5%. Then, the number of TMDs in the MTMD system is chosen according to Section 2.6. The number of TMDs is suggested to be 3~5. Thirdly, it is referred in Section 2.4 that the central frequency ratio f T can be set to be 1, which means that the central frequency of an MTMD system is set to be the same as the structural dominant frequency. At last, the optimal frequency bandwidth χ o p t and the optimal TMD damping ratio ξ o p t can be calculated through Equations (6) and (7).
An MTMD system can be optimized and designed according to the proposed process and it is also suggested to be applied in the location where the structure has the maximum modal response.

3. Optimal Design of an MTMD System for a Footbridge

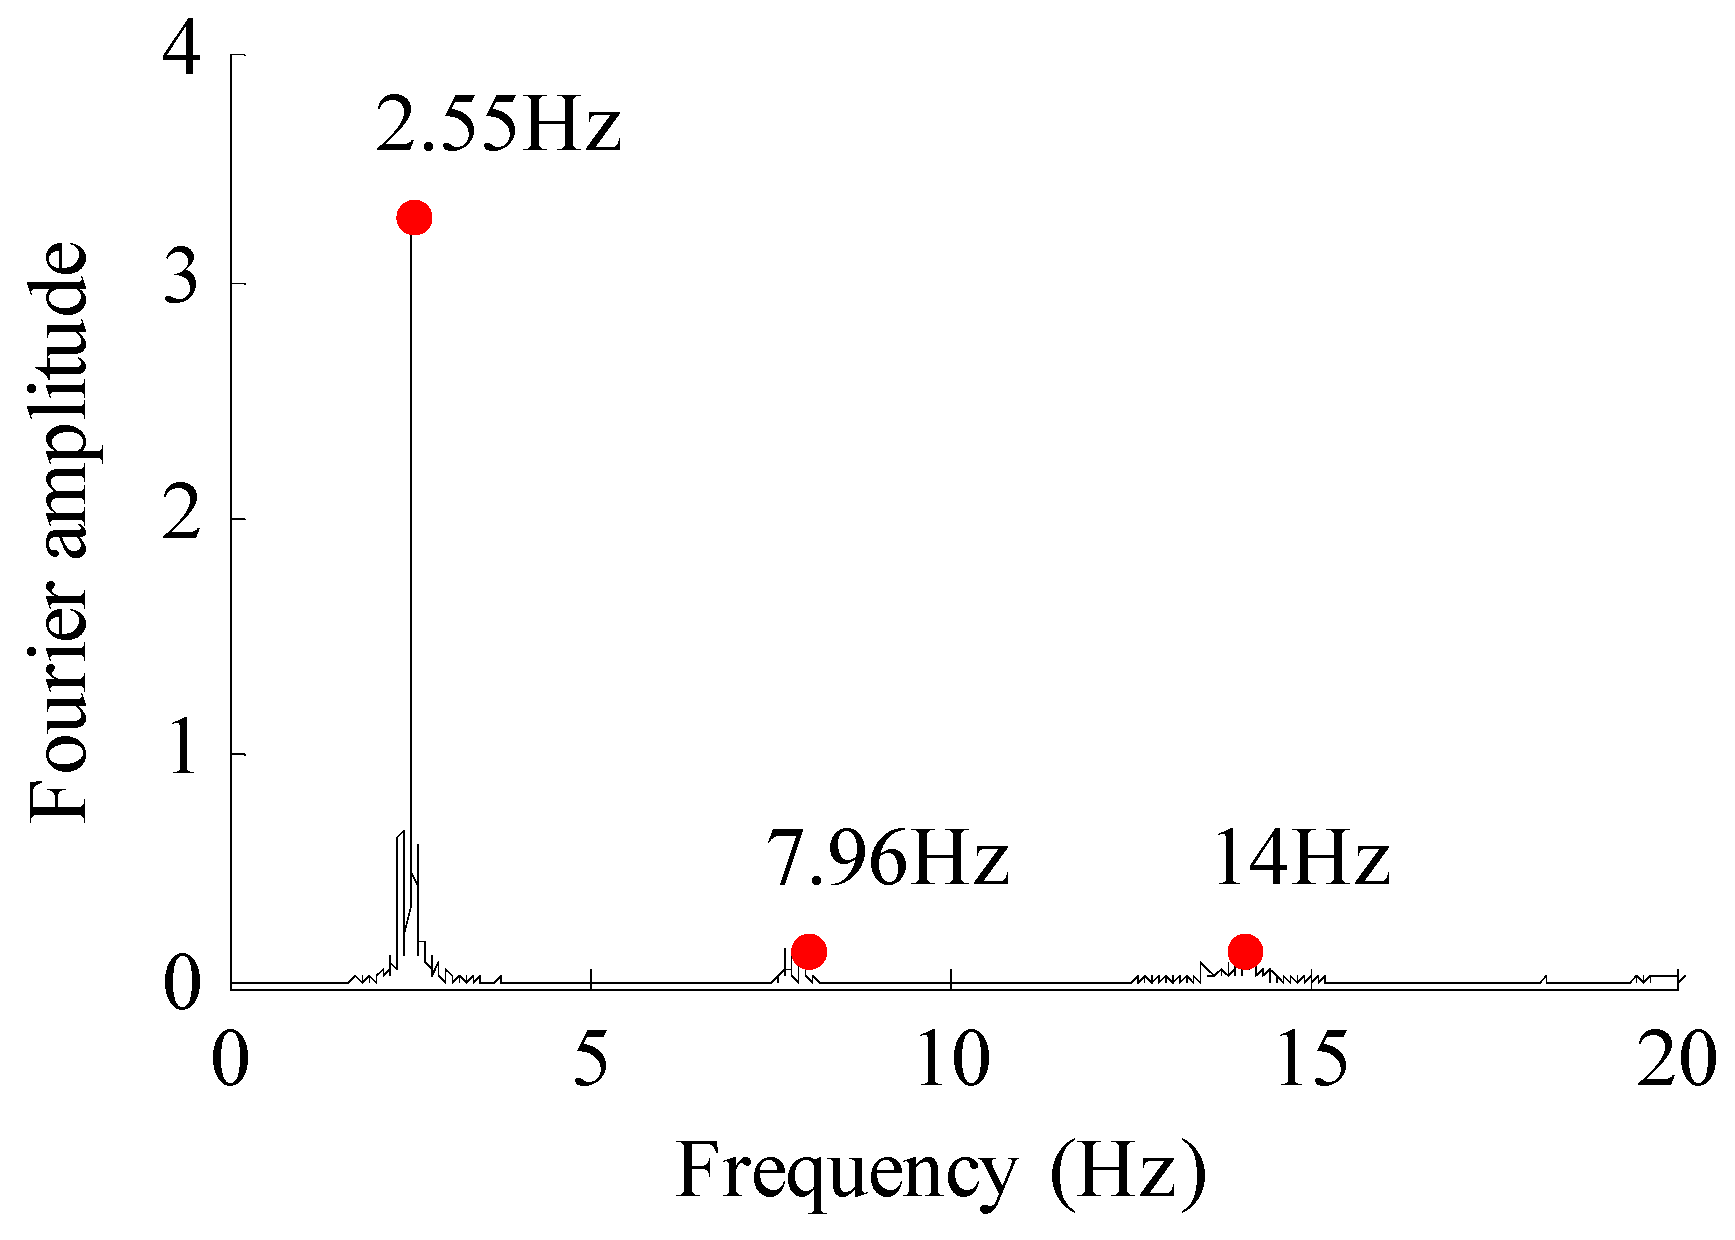
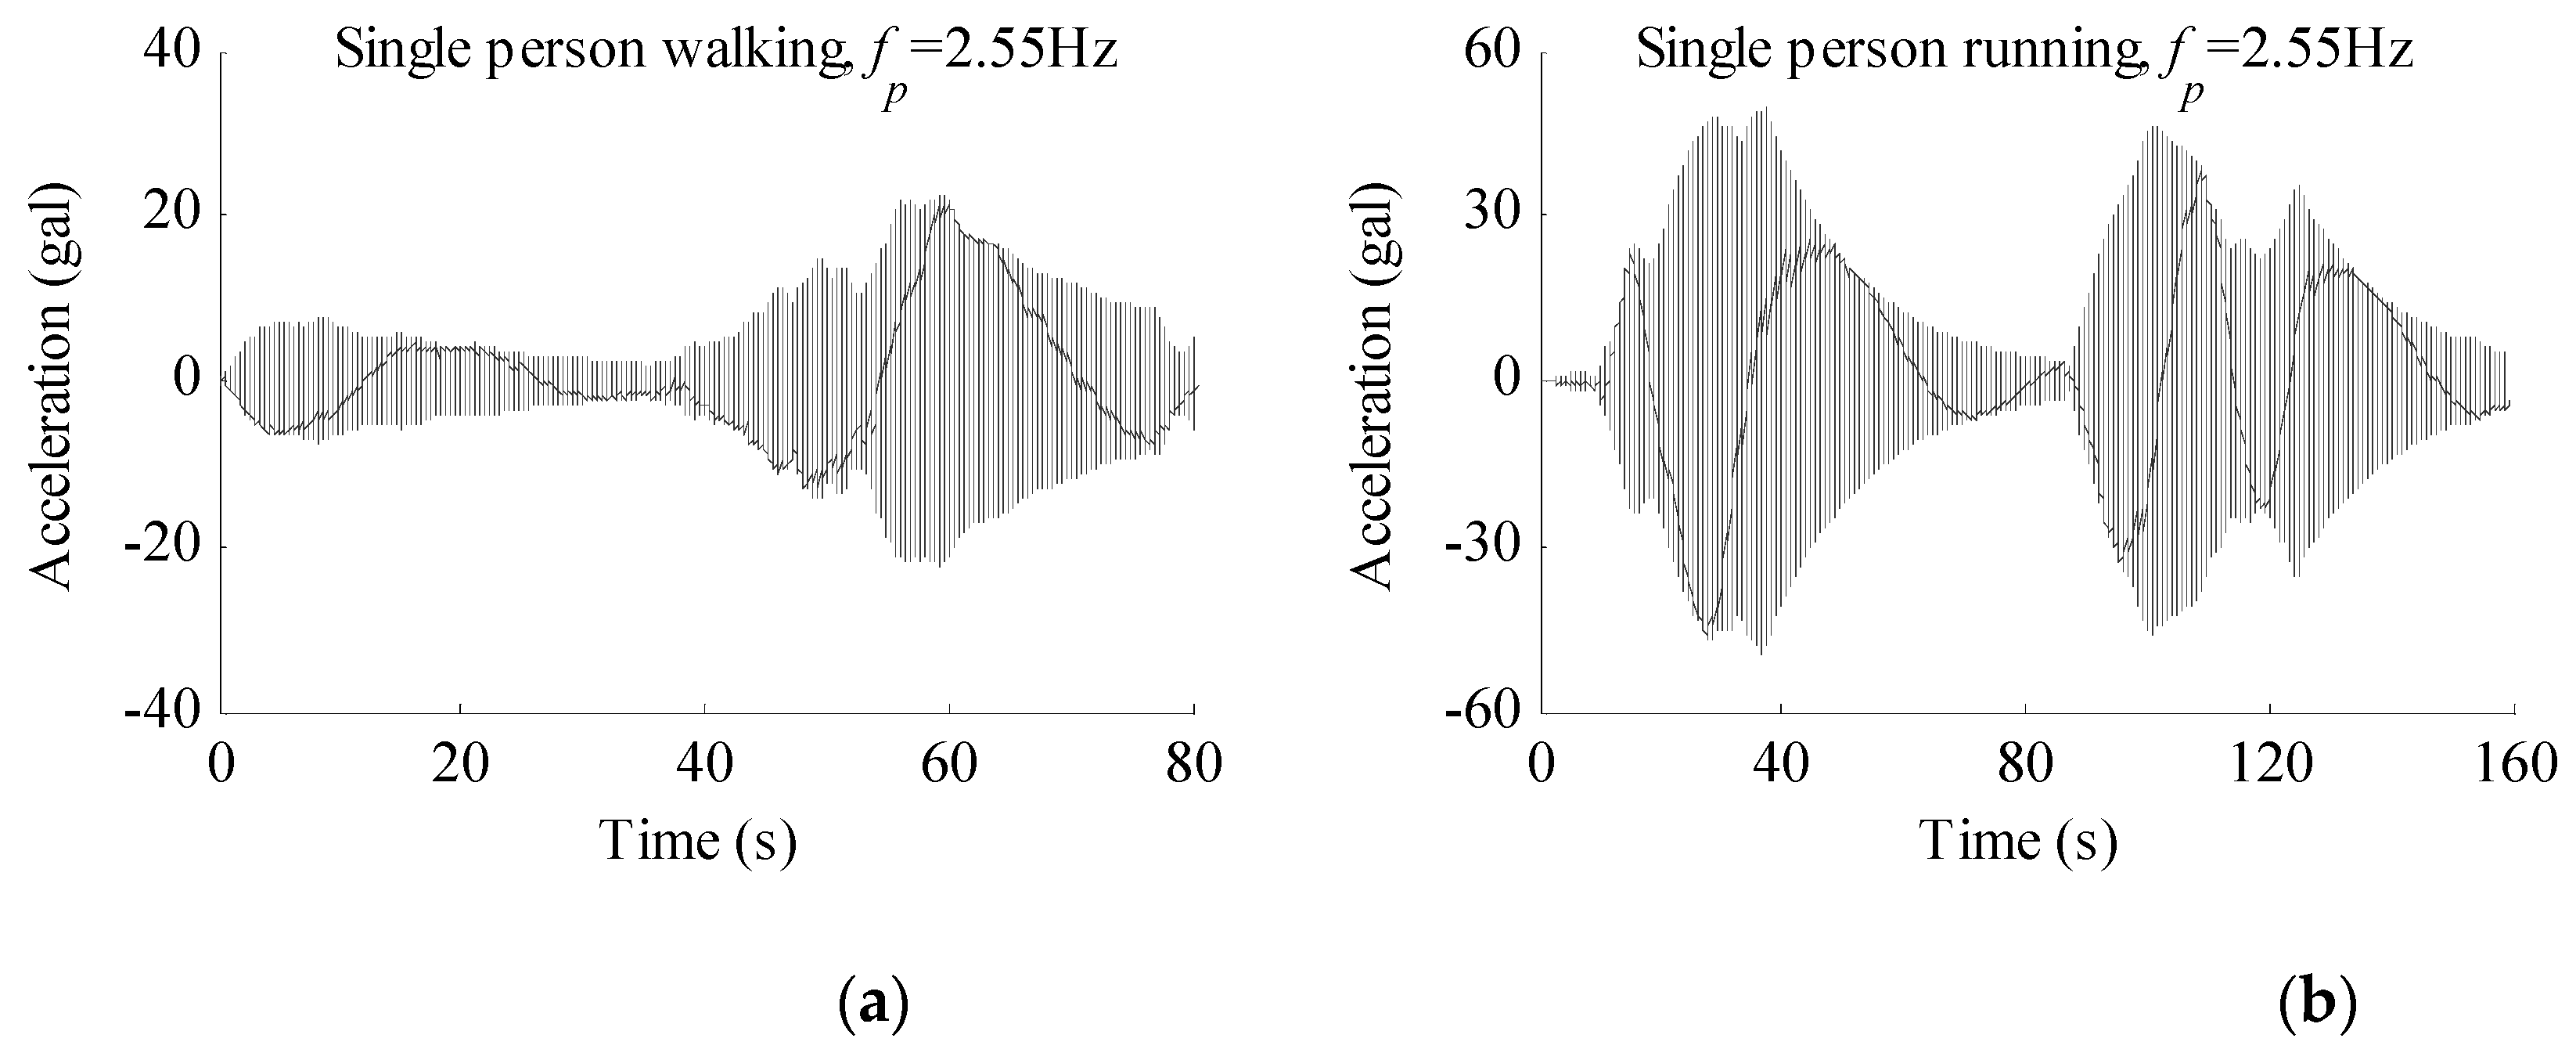
3.1. Model Analysis and In Situ Test

In order to illustrate and verify the aforementioned optimal design method and formulas, an in-service steel footbridge is proposed as a case study in this and the next sections. The footbridge is simply supported and 55.2 m in length. Because it is slender and light, it suffers from excessive human-induced vibrations and needs to be controlled by an MTMD system.
To provide a reference for the following in situ test, the footbridge finite element model built in SAP2000 is analyzed firstly. The model in SAP2000 [51] and the first three vertical modes are shown in Figure 12.
Shell members are used to simulate the steel deck. Beam elements are adapted for steel members. Finally, the footbridge is fixed at the base of piers. The detailed structural parameters and input parameters are proposed in Table 1.
Through the model analysis, it is found that the first vertical frequency is 2.55 Hz, which is sensitive to human-induced excitations. The second and third vertical frequencies are 7.18 Hz and 13.86 Hz respectively, which are difficult to be excited compared to the first mode. Besides, the first mode mass participation ratio is 86.5%, which is no doubt dominant. Therefore, the main attention should be paid to the first vertical mode and it can be simplified as an SDOF system.
The dynamic response in the mid-span is the maximum for the first vertical mode. Therefore, in the following in situ test, three measurement points are arranged near the mid-span and are presented in Figure 13.
Under ambient excitation, the acceleration response of three measurement points are obtained through three acceleration sensors and are analyzed through fast Fourier transformation (FFT). The results of the three points are quite similar, and for brevity, only the result of the A2 point is shown in Figure 14.
The frequency identification result comparison between the model analysis and in situ test is shown in Table 2 and the first order damping ratio is identified through the fitting exponential function [1].
It can be seen in Table 2 that the frequency identification result of the model analysis agrees well with the in situ test, especially the first mode. The first order damping ratio is only 0.35% and can be ignored.
To analyze the structural dynamic response more precisely, a 700 N worker walks, runs and jumps in the mid-span with the resonance frequency (2.55 Hz) under the guidance of a metronome [52]. The human-induced forces and also the acceleration responses are measured at the A2 point. For example, the jumping force and the comparison of A2 point response between the model analysis and in situ test are proposed in Figure 15. In a personal computer with an Intel(R) Core(TM) i5-7200U CPU @ 2.50 GHz–2.71 GHz, for every walking, running and jumping excitation simulation case, it only takes about 30 s.
From Figure 15, it can be seen that, on the one hand, the model analysis result fits well with the in situ test; on the other hand, the maximum response of the in situ test is 74.5 gal. According to References [38,39,40] and also the requirements of the client, as for the walking excitation, the structural acceleration response limit value is 15 gal and 50 gal for running and jumping excitations. The structural acceleration response of the A2 point under walking and running excitations are shown in Figure 16.
In Figure 16, the structural maximum acceleration is 22.8 gal for the walking case and 49.5 gal for the running case. In Figure 16a, the acceleration amplitude “22.8 gal” is only the response value of a single person walking. In fact, according to References [41,42,43], a 0.5 person/m2 crowd-load should be considered. Based on the equivalent flow analysis result, the walking coefficient should be multiplied by 3.2, and therefore, the structural equivalent maximum acceleration is 73.0 gal for the walking case. It can be seen that neither of the above three cases can meet the serviceability requirement.

3.2. Optimal Design of an MTMD System

In order to improve the serviceability of the aforementioned in-service footbridge, an MTMD system is optimized in this section.
According to Section 2.4, the central frequency ratio f T is set to be 1; according to Section 2.5, the MTMD mass ratio is chosen to be 3.6%; according to Section 2.6, there are three TMDs with different frequency in this MTMD system. Then, according to Equations (6) and (7), the optimal frequency bandwidth χ o p t and damping ratio ξ o p t can be calculated, which are 0.16 and 6.0%, respectively. The optimal process can be seen in Figure 17.
Detailed parameters of the optimized MTMD system are shown in Table 3.

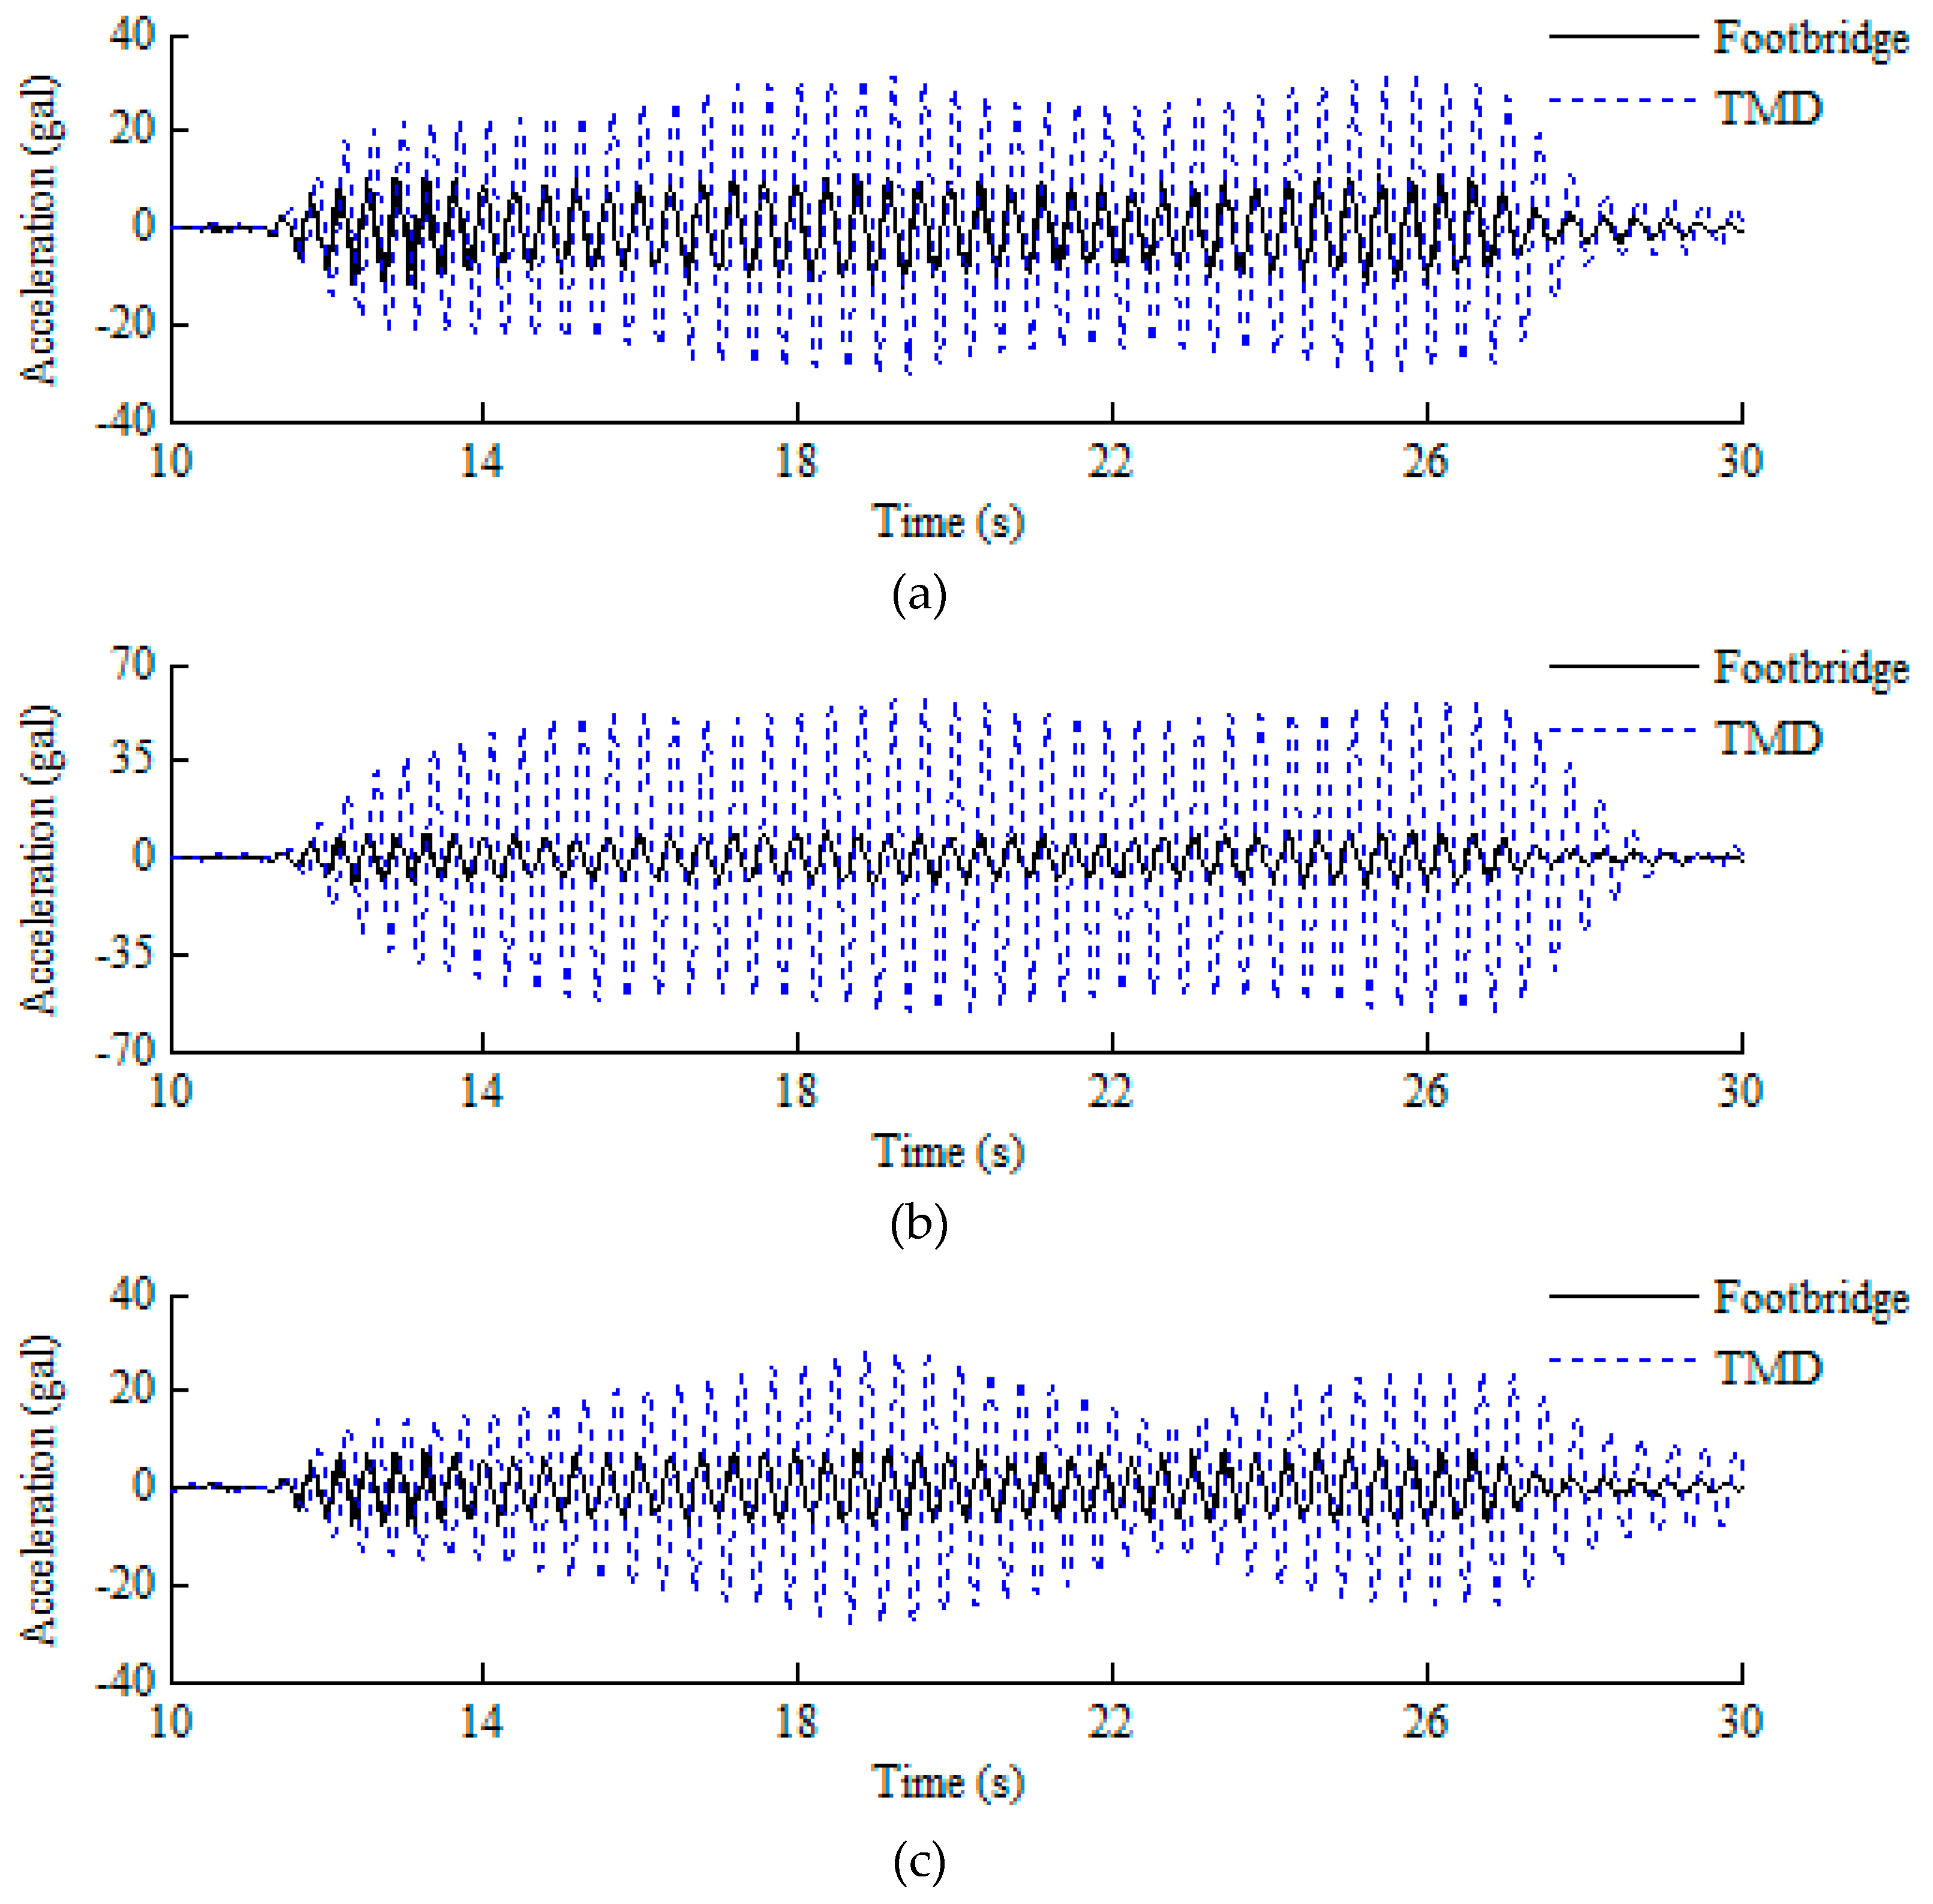
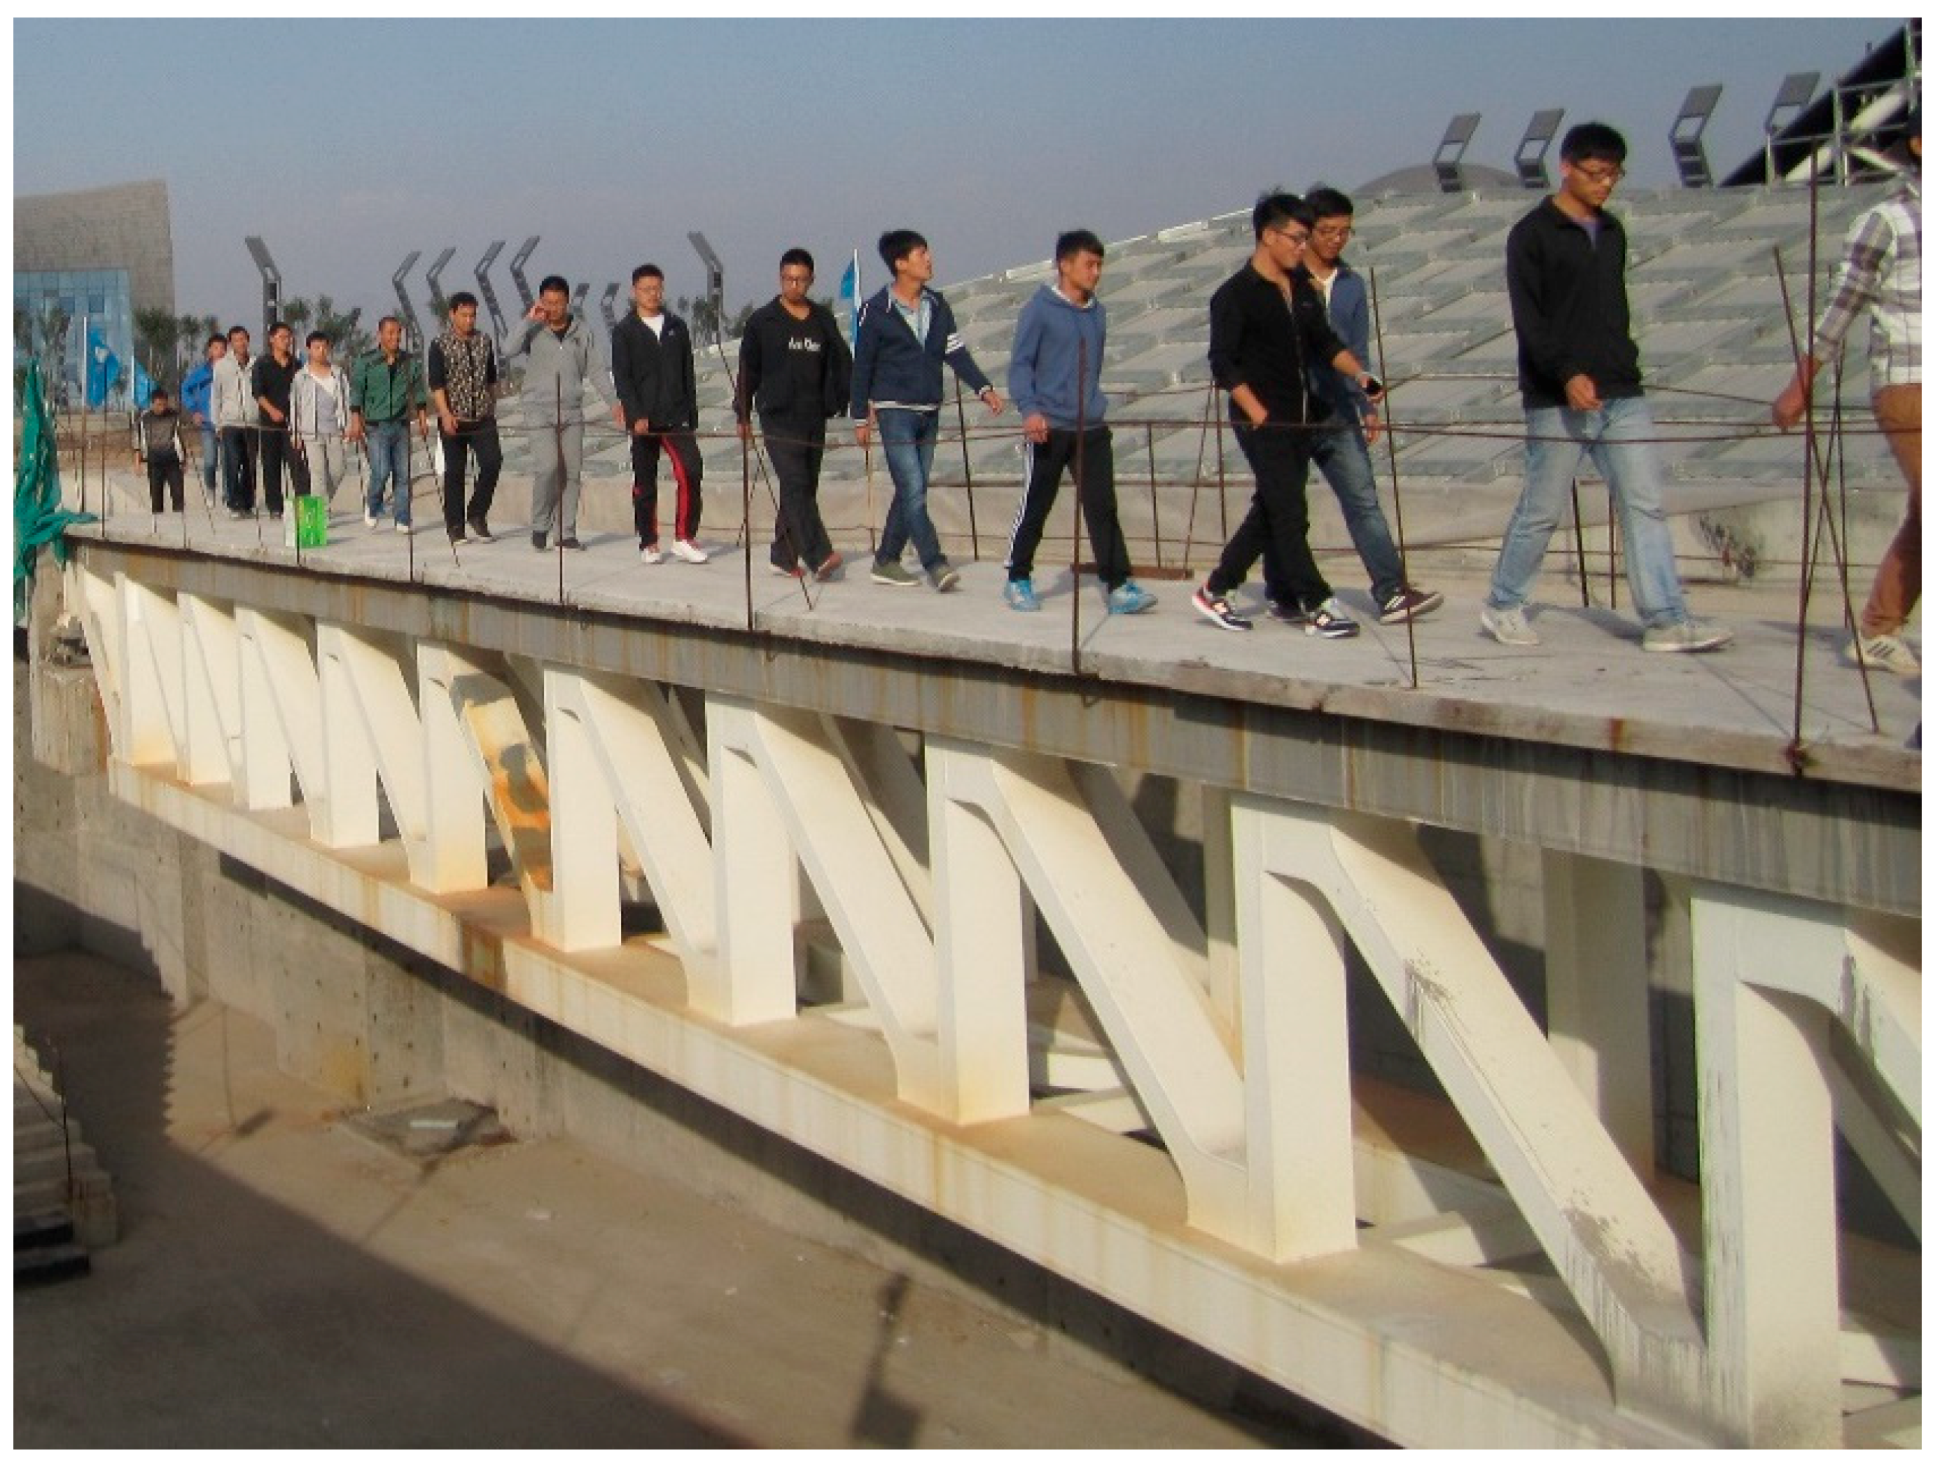
4. Implementation of the MTMD System and Vibration Test

The MTMD system in Table 3 is produced and implemented in the in-service footbridge. The location of each TMD is shown in Figure 13.
To verify the vibration control effect of the MTMD system, the same as Figure 15 and Figure 16, the worker of 700 N walks, runs and jumps in the mid-span. The acceleration responses of the A2 point are presented in Figure 18.
The comparison of maximum responses between Figure 15, Figure 16 and Figure 18 are shown in Table 4.
It is obvious in Table 4 that the optimized MTMD system has an excellent control effect for all kinds of human-induced vibrations. After the implementation of the MTMD system, the footbridge can meet the serviceability requirement.
To further illustrate the control effect of the MTMD system, under the jumping excitation, the acceleration time history of both the footbridge and TMD in all measurement points are drawn in Figure 19.
It can be seen in Figure 19 that there is a phase difference of about 90 degrees between the footbridge and TMD acceleration time history curves. This means that the vibration energy of the footbridge passes to the TMD and TMD gives an opposite force to the footbridge to suppress its movement. The vibration energy of the footbridge is dissipated quickly and the TMD can accelerate the vibration attenuation of the footbridge.
To verify the MTMD control effect in a wide excitation bandwidth, the comparison of walking, running and jumping excitation response spectra in the A2 point are shown in Figure 20.
From Figure 20, it can be known that the MTMD system is robust in a wide excitation bandwidth. The footbridge has the maximum response when the resonance happens and, at that time, the MTMD system has the best reduction in the structural acceleration response.
At last 16 people walks through the footbridge with the resonance frequency twice to verify whether it can meet the serviceability requirement of 15 gal. The photo of this test is shown in Figure 21 and the acceleration time history of A2 point is presented in Figure 22.
It can be seen in Figure 22 that the maximum acceleration of the mid-span is 12.5 gal and it can meet the serviceability requirement.

5. Conclusions

Slender steel footbridges suffer from excessive human-induced vibrations due to their low damping nature and their frequency being located in the range of human-induced excitations. An MTMD system, which consists of several TMDs with different frequencies has a wide application in the vibration control of footbridges. An MTMD system with well-designed parameters would have a satisfactory effect for human-induced vibration control.
This paper firstly discussed the relationship between the acceleration dynamic amplification factor and the main parameters of an MTMD system, i.e., the frequency bandwidth, TMD damping ratio, central frequency ratio, mass ratio and the number of TMDs. Then, the frequency bandwidth and damping ratio optimal formulas were proposed according to the parametric study. At last, an in-service slender footbridge was proposed as a case study. The following conclusions could be obtained:
1)
According to the parametric study, the central frequency ratio was suggested to be 1; a larger mass ratio would get a better control effect, but it also should be reasonable; the number of TMDs was suggested to be 3~5.
2)
The frequency bandwidth and damping ratio of the MTMD system could be calculated through the proposed optimization formulas.
3)
A slender steel footbridge was analyzed through the finite element model and an in situ test, and an MTMD system was designed based on the proposed optimal design formulas.
4)
The vibration control effect of the MTMD system was verified through a series of in situ comparison tests. The results showed that under walking, running and jumping excitations with different frequencies, the MTMD system always had an excellent vibration control effect, and the footbridge with an MTMD system could meet the acceleration limit requirement. The analysis result agreed well with the in situ test.
Though the proposed optimal design method had been verified through a particular case study, it did not consider the primary structural damping ratio. Besides, as time went by, the primary structural dynamic parameters (mass, stiffness and damping coefficients) would vary and they had an uncertainty which had not been considered in the proposed design framework. These aspects need to be studied in further research. It was also worth studying the effectiveness of the proposed MTMD system design framework in lateral human-induced vibration control in further research.

Author Contributions

C.W. carried out the detailed work and wrote the paper. W.S. conceived the analytical method, provided valuable discussions and revised the paper.

Funding

This research received no external funding.

Acknowledgments

This project was supported by the Shanghai Science and Technology Committee of China (Grant No. 17DZ1201404).

Conflicts of Interest

The authors declare no conflict of interest.

References

  1. Shi, W.; Wang, L.; Lu, Z. Study on self-adjustable tuned mass damper with variable mass. Struct. Control Health Monit. 2018, 25, e2114. [Google Scholar] [CrossRef]
  2. Shi, W.; Wang, L.; Lu, Z.; Gao, H. Study on adaptive-passive and semi-active eddy current tuned mass damper with variable damping. Sustainability 2018, 10, 99. [Google Scholar] [CrossRef]
  3. Shi, W.; Wang, L.; Lu, Z.; Zhang, Q. Application of an artificial fish swarm algorithm in an optimum tuned mass damper design for a pedestrian bridge. Appl. Sci. 2018, 8, 175. [Google Scholar] [CrossRef]
  4. Casciati, F.; Casciati, S.; Faravelli, L. A contribution to the modelling of human induced excitation on pedestrian bridges. Struct. Saf. 2017, 66, 51–61. [Google Scholar] [CrossRef]
  5. Domaneschi, M.; Martinelli, L.; Po, E. Control of wind buffeting vibrations in a suspension bridge by TMD: Hybridization and robustness issues. Comput. Struct. 2015, 155, 3–17. [Google Scholar] [CrossRef]
  6. Li, Z.; Li, D.; Lu, Y.; Tang, C. Analysis on Vibration Control of a Large–Span Pedestrian Suspension Bridge Based on a Multiple Tuned Mass Damper System; Noise & Vibration Worldwide—SAGE Publications Ltd.: London, UK, 2019; Volume 50, pp. 56–63. [Google Scholar]
  7. Wang, D.; Wu, C.; Zhang, Y.; Li, S. Study on vertical vibration control of long-span steel footbridge with tuned mass dampers under pedestrian excitation. J. Constr. Steel Res. 2019, 154, 84–98. [Google Scholar] [CrossRef]
  8. Ferreira, F.; Moutinho, C.; Cunha, Á.; Caetano, E. Use of semi-active tuned mass dampers to control footbridges subjected to synchronous lateral excitation. J. Sound Vib. 2019, 446, 176–194. [Google Scholar] [CrossRef]
  9. Casciati, S. Human induced vibration vs. cable-stay footbridge deterioration. Smart Struct. Syst. 2016, 18, 17–29. [Google Scholar] [CrossRef]
  10. Narasimhan, S.; Caetano, E.; Fujino, Y. Special issue on load modeling and experimental studies on lively pedestrian bridges. J. Bridge Eng. 2016, 21, C2016001. [Google Scholar] [CrossRef]
  11. Nimmen, K.; Lombaert, G.; Roeck, G.; Broeck, P. Vibration serviceability of footbridges: Evaluation of the current codes of practice. Eng. Struct. 2014, 59, 448–461. [Google Scholar] [CrossRef] [Green Version]
  12. Zivanovic, S.; Pavic, A.; Reynolds, P. Vibration serviceability of footbridges under human-induced excitation: A literature review. J. Sound Vib. 2005, 279, 1–74. [Google Scholar] [CrossRef]
  13. Brownjohn, J.M.W.; Paivc, A. Experimental methods for estimating modal mass in footbridges using human-induced dynamic excitation. Eng. Struct. 2007, 29, 2833–2843. [Google Scholar] [CrossRef]
  14. García-Diéguez, M.; Zapico-Valle, J.L. Sensitivity of the vertical response of footbridges to the frequency variability of crossing pedestrians. Vibration 2018, 1, 290–311. [Google Scholar] [CrossRef]
  15. Jiménez-Alonso, J.F.; Pérez-Aracil, J.; Díaz, H.; Mateo, A.; Sáez, A. Effect of Vinyl flooring on the modal properties of a steel footbridge. Appl. Sci. 2019, 9, 1374. [Google Scholar] [CrossRef]
  16. Spencer, N.S., Jr. State of the art of structural control. J. Struct. Eng. 2003, 129, 845–856. [Google Scholar] [CrossRef]
  17. Shi, W.; Wang, L.; Lu, Z.; Wang, H. Experimental and numerical study on adaptive-passive variable mass tuned mass damper. J. Sound Vib. 2019, 452, 97–111. [Google Scholar] [CrossRef]
  18. Sun, C.; Nagarajaiah, S.; Dick, A.J. Family of smart tuned mass damper with variable frequency under harmonic excitation and ground motions: Closed-form evaluation. Smart Struct. Syst. 2014, 13, 319–341. [Google Scholar] [CrossRef]
  19. Moutinho, C.; Cunha, Á.; Caetano, E.; de Carvalho, J.M. Vibration control of a slender footbridge using passive and semiactive tuned mass dampers. Struct. Control. Health Monit. 2018, 25, e2208. [Google Scholar] [CrossRef]
  20. Lievens, K.; Lombaert, G.; Roeck, G.; Broeck, P. Robust design of a TMD for the vibration serviceability of a footbridge. Eng. Struct. 2016, 123, 408–418. [Google Scholar] [CrossRef]
  21. Caetano, E.; Cunha, Á.; Moutinho, C.; Magalhães, F. Studies for controlling human-induced vibration of the Pedro e Inês footbridge, Portugal. Part 2: Implementation of tuned mass dampers. Eng. Struct. 2010, 32, 1082–1091. [Google Scholar] [CrossRef]
  22. Casado, C.; Díaz, I.; Sebastián, J.; Poncela, A.; Lorenzana, A. Implementation of passive and active vibration control on an in-service footbridge. Struct. Control. Health Monit. 2013, 20, 70–87. [Google Scholar] [CrossRef]
  23. Tubino, F.; Piccardo, G. Tuned mass damper optimization for the mitigation of human-induced vibrations of pedestrian bridges. Meccanica 2015, 50, 809–824. [Google Scholar] [CrossRef]
  24. Huang, H.; Chang, W.S.; Mosalam, K.M. Feasibility of shape memory alloy in a tuneable mass damper to reduce excessive in-service vibration. Struct. Control. Health Monit. 2017, 24, e1858. [Google Scholar] [CrossRef]
  25. Rathi, A.; Chakraborty, A. Reliability-based performance optimization of TMD for vibration control of structures with uncertainty in parameters and excitation. Struct. Control. Health Monit. 2017, 24, e1857. [Google Scholar] [CrossRef]
  26. Lievens, K.; Lombaert, G.; Van Nimmen, K.; De Roeck, G.; Van den Broeck, P. Robust vibration serviceability assessment of footbridges subjected to pedestrian excitation: Strategy and applications. Eng. Struct. 2018, 171, 236–246. [Google Scholar] [CrossRef]
  27. Rezaei Rad, A.; Banazadeh, M. Probabilistic risk-based performance evaluation of seismically base-isolated steel structures subjected to far-field earthquakes. Buildings 2018, 8, 128. [Google Scholar] [CrossRef]
  28. Tajammolian, H.; Khoshnoudian, F.; Rezaei Rad, A.; Loghman, V. Seismic fragility assessment of asymmetric structures supported on TCFP bearings subjected to near-field earthquakes. Struct. 2018, 13, 66–78. [Google Scholar] [CrossRef]
  29. Wang, L.; Shi, W.; Zhou, Y. Study on self-adjustable variable pendulum tuned mass damper. Struct. Des. Tall Spec. Build. 2019, 28, e1561. [Google Scholar] [CrossRef]
  30. Wang, L.; Shi, W.; Li, X.; Yheng, L. An adaptive-passive retuning device for a pendulum tuned mass damper considering mass uncertainty and optimum frequency. Struct. Control. Health Monit. 2019, e2377. [Google Scholar] [CrossRef]
  31. Nagarajaiah, S. Adaptive passive, semi-active, smart tuned mass dampers: Identification and control using empirical mode decomposition, Hilbert transform, and short-term Fourier transform. Struct. Control. Health Monit. 2009, 16, 800–841. [Google Scholar] [CrossRef]
  32. Varadarajan, N.; Nagarajaiah, S. Wind response control of building with variable stiffness tuned mass damper using empirical mode decomposition/Hilbert transform. J. Eng. Mech. 2004, 130, 451–458. [Google Scholar] [CrossRef]
  33. Sun, C.; Nagarajaiah, S. Study on semi-active tuned mass damper with variable damping and stiffness under seismic excitations. Struct. Control. Health Monit. 2014, 21, 890–906. [Google Scholar] [CrossRef]
  34. Ferreira, F.; Moutinho, C.; Cunha, Á.; Caetano, E. Proposal of optimum tuning of semiactive TMDs used to reduce harmonic vibrations based on phase control strategy. Struct. Control. Health Monit. 2018, 25, e2131. [Google Scholar] [CrossRef]
  35. Carpineto, N.; Lacarbonara, W.F. Mitigation of pedestrian-induced vibrations in suspension footbridges via multiple tuned mass dampers. J. Vib. Control 2010, 16, 749–776. [Google Scholar] [CrossRef]
  36. Li, Q.; Fan, J.; Nie, J.; Li, Q.; Chen, Y. Crowd-induced random vibration of footbridge and vibration control using multiple tuned mass dampers. J. Sound Vib. 2010, 329, 4068–4092. [Google Scholar] [CrossRef]
  37. Lu, X.; Ding, K.; Shi, W.; Weng, D. Tuned mass dampers for human-induced vibration control of the Expo Culture Centre at the World Expo 2010 in Shanghai, China. Struct. Eng. Mech. 2012, 43, 607–621. [Google Scholar] [CrossRef]
  38. Gaspar, C.M.R.; de Santos, S.J.G.; Costa-Neves, L.F. Multimode vibration control of building steel–concrete composite floors submitted to human rhythmic activities. Comput. Struct. 2016, 165, 107–122. [Google Scholar] [CrossRef]
  39. Daniel, Y.; Lavan, O.; Levy, R. Multiple-tuned mass dampers for multimodal control of pedestrian bridges. J. Struct. Eng. 2012, 138, 1173–1178. [Google Scholar] [CrossRef]
  40. Jokic, M.; Stegic, M.; Butkovic, M. Reduced-order multiple tuned mass damper optimization: A bounded real lemma for descriptor systems approach. J. Sound Vib. 2011, 330, 5259–5268. [Google Scholar] [CrossRef]
  41. Roman, L.; Justyna, G. Dynamic analysis of structures with multiple tuned mass dampers. J. Civ. Eng. Manag. 2009, 15, 77–86. [Google Scholar]
  42. Hoang, N.; Warnitchai, P. Design of multiple tuned mass dampers by using a numerical optimizer. Earthq. Eng. Struct. Dyn. 2005, 34, 125–144. [Google Scholar] [CrossRef]
  43. Nakhorn, P.; Sopak, K.; Pennung, W. Application of non-linear multiple tuned mass dampers to suppress man-induced vibrations of a pedestrian bridge. Earthq. Eng. Struct. Dyn. 2010, 32, 1117–1131. [Google Scholar]
  44. Den Hartog, J.P. Mechanical Vibrations; McGraw-Hill/Dover: New York, NY, USA, 1985. [Google Scholar]
  45. Occhiuzzi, A.; Spizzuoco, M.; Ricciardelli, F. Loading models and response control of footbridges excited by running pedestrians. Struct. Control. Health Monit. 2008, 15, 349–368. [Google Scholar] [CrossRef]
  46. Magalhaes, F.; Cunha, A.; Caetano, E.R. Damping estimation using free decays and ambient vibration tests. Mech. Syst. Signal. Process. 2010, 24, 1274–1290. [Google Scholar] [CrossRef] [Green Version]
  47. Carroll, S.P.; Owen, J.S.; Hussein, M.F.M. A coupled biomechanical/discrete element crowd model of crowd–bridge dynamic interaction and application to the Clifton Suspension Bridge. Eng. Struct. 2013, 49, 58–75. [Google Scholar] [CrossRef]
  48. Murray, T.M.; Allen, D.E.; Ungar, E.E. Floor Vibrations Due to Human Activity-Steel Design Guide Series; American Institute of Steel Construction: Chicago, IL, USA, 1997. [Google Scholar]
  49. ISO 2631–2—Evaluation of Human Exposure to Whole-Body Vibration—Part 2: Human Exposure to Continuous and Shock-Induced Vibrations in Buildings (1 to 80 Hz); International Organization for Standardization: Geneve, Switzerland, 1989.
  50. Wyatt, T.A. Design Guide on the Vibration of Floors; The Steel Construction Institute: Berkshire, UK, 1989. [Google Scholar]
  51. Computer & Structures Inc. Structure Analysis Program 2000 (SAP2000) [Software], Computer & Structures Inc.: Berkeley, CA, USA, 2011.
  52. Ferreira, F.; Simões, L. Optimum design of a controlled cable-stayed footbridge subject to a running event using semiactive and passive mass dampers. J. Perform. Constr. Facil. 2019, 33, 04019025. [Google Scholar] [CrossRef]
Figure 1. The schematic diagram of a single-degree-of-freedom (SDOF) primary structure with a multiple tuned mass dampers (MTMD) system.
Sustainability 11 02801 g001
Figure 2. The relationship between D M F a c c and excitation ratio g with different ξ T .
Sustainability 11 02801 g002
Figure 3. The relationship between D M F a c c and excitation ratio g with different χ .
Sustainability 11 02801 g003
Figure 4. The relationship between D M F a c c and χ with different ξ T .
Sustainability 11 02801 g004
Figure 5. The relationship between D M F a c c and ξ T with different χ .
Sustainability 11 02801 g005
Figure 6. The relationship between D M F a c c , ξ T and χ .
Sustainability 11 02801 g006
Figure 7. The relationship between (a). χ o p t and μ ; (b) ξ o p t and μ .
Sustainability 11 02801 g007
Figure 8. The relationship between (a) χ o p t and n ; (b) ξ o p t and n .
Sustainability 11 02801 g008
Figure 9. The relationship between D M F o p t and n , with different μ and f T .
Sustainability 11 02801 g009
Figure 10. The relationship between (a) D M F o p t and μ ; (b) D M F o p t and g .
Sustainability 11 02801 g010
Figure 11. The relationship between (a) D M F o p t and n ; (b) D M F o p t and g .
Sustainability 11 02801 g011
Figure 12. The model analysis (a) Finite element model; (b) The first vertical mode; (c) The second vertical mode; (d) The third vertical mode.
Sustainability 11 02801 g012
Figure 13. The location of three measurement points.
Sustainability 11 02801 g013
Figure 14. The fast Fourier transform (FFT) result of the A2 point.
Sustainability 11 02801 g014
Figure 15. The jumping excitation comparison (a) Jumping force time history; (b) Comparison of structural acceleration response (note: “gal” means “cm/s2”.).
Sustainability 11 02801 g015
Figure 16. The dynamic response in the mid-span under (a) Walking excitation; (b) Running excitation.
Sustainability 11 02801 g016
Figure 17. The optimal design of the χ and ξ T .
Sustainability 11 02801 g017
Figure 18. The dynamic response in the mid-span with the MTMD system, under (a) Walking excitation; (b) Running excitation; (c) Jumping excitation.
Sustainability 11 02801 g018
Figure 19. The acceleration time history comparison between the footbridge and TMD. (a) A1 point; (b) A2 point; (c) A3 point.
Sustainability 11 02801 g019
Figure 20. The comparison of the acceleration response spectra. (a) Walking excitation; (b) Running excitation; (c) Jumping excitation.
Sustainability 11 02801 g020aSustainability 11 02801 g020b
Figure 21. The crowd-induced vibration test.
Sustainability 11 02801 g021
Figure 22. The acceleration time history of the mid-span.
Sustainability 11 02801 g022
Table 1. The detailed structural parameters and input parameters of the finite element model.
TypeComponentSize (mm)NumberInput Loads
CrossbarBeam element150 × 150 × 856Walking, running and jumping excitations, which are measured from the in situ test, are input in the midspan node.
Longitudinal barBeam element550 × 550 × 20108
Vertical barBeam element550 × 550 × 2054
Diagonal barBeam element350 × 350 × 16108
Bridge deckShell element55181 × 1450 × 1001
Table 2. The comparison of the frequency identified results.
OrderTest Frequency/HzAnalysis Frequency/HzDeviationDamping Ratio
First2.552.550.00%0.35%
Second7.967.18–9.80%
Third14.0013.86–1.00%
Table 3. The parameters of the optimized multiple tuned mass dampers (MTMD) system.
Structural frequency2.55 Hz
Structural modal mass83.3 t
Total number of TMD3
Order of TMDA1A2A3
Mass of TMD1.0 t1.0 t1.0 t
MTMD mass ratio3.6%
Optimal frequency bandwidth0.16
Central frequency ratio1.00
Central frequency2.55 Hz
TMD frequency2.35 Hz2.55 Hz2.75 Hz
Optimal damping ratio6.0%
Table 4. The maximum acceleration response comparisons.
CaseWithout Control/galWith the MTMD System/galReduction/%
Walking excitation72.99.187.5%
Running excitation49.55.289.5%
Jumping excitation74.513.581.9%

