1. Introduction
The growth and decline of cities may be caused by changes in the industrial structures of the countries in which they are located. In the first half of the 20th century, manufacturing industries such as the automobile sector and energy industries such as the coal sector generated economic growth in American, European, and Japanese cities. The decline of these industries has caused cities to decline, such as in the “Rust Belt” cities in the US. (Another major reason for population shrinkage is a sudden change in the political structure, such as German reunification in 1990) [
1].
However, gateway cities such as New York, London, and Tokyo show slightly different trends. Because these cities are central to their respective countries, their principal function is changing as the country’s industrial structure shifts. The center of Tokyo has adjusted its role over time as Japan’s industrial structure has shifted toward the manufacturing and service sectors. It initially served as a location for small factories and wholesale stores until rapid growth began in the 1960s, with workers commuting to this area to undertake manual labor. The shift to the service sector has accelerated urbanization and has moved population concentrations from rural and small urban areas to big cities, particularly to large metropolises such as Tokyo. Office workers commuted from the suburbs to the central area, which was redeveloped for office and commercial uses to allow productive face-to-face communication within and across companies. In this context, office demands in the metropolis have continued to grow.
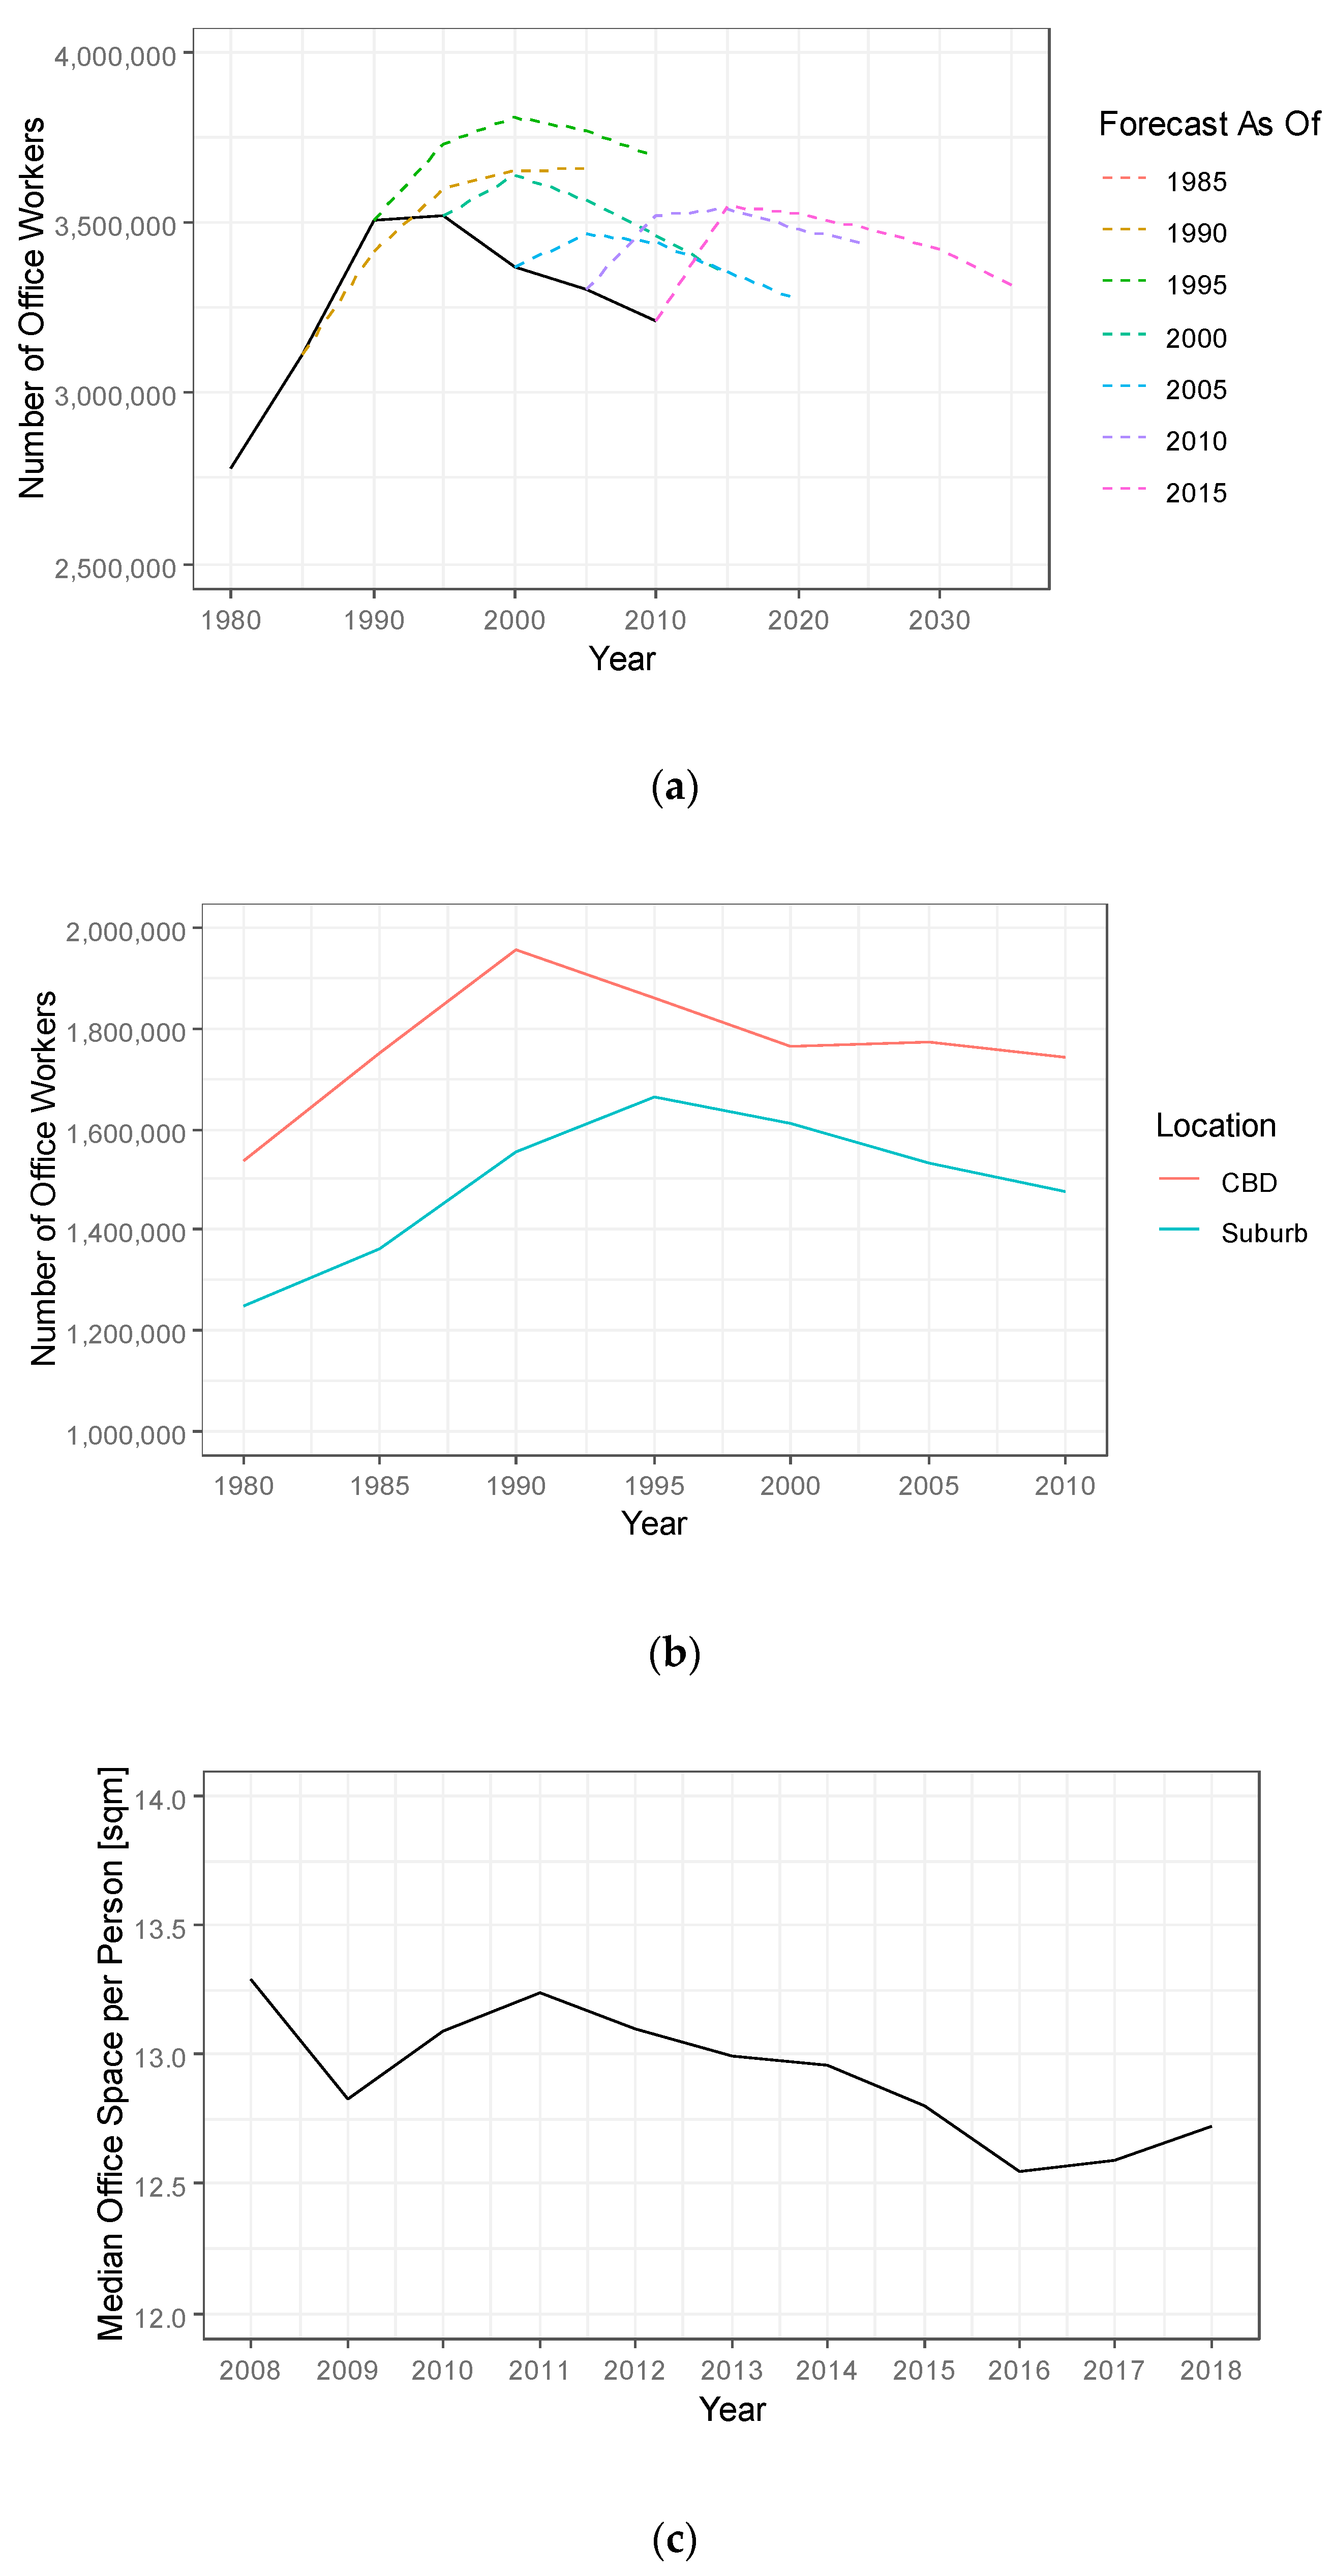
Although metropolises are growing worldwide, they face the risk of shrinkage. The dynamics of shrinkage in central metropolises are unique; in such cities, the labor force declines while agglomeration power continues. Tokyo is ahead of the rest of the world in the sense that its labor force has been shrinking since 1995, although it is one of the world’s largest cities. Urbanization has led to declining fertility rates and a resultant aging society [
2], and Japan has strict immigration policies concerning potential workers from abroad. Economic depreciation is especially rapid in Japan’s office market, caused by changing workplace preferences as information technology develops as well as by changing standards for disaster risks such as earthquakes.
This study seeks to capture and contextualize the “shrinkage” of the office market in Tokyo. Specifically, this study investigates the spatial and physical aspects of Tokyo’s office market over the last 30 years and the consequences of the shrinkage for existing office stocks employing unique property-level datasets on the office buildings’ performance and uses.
First, we quantify the geographical distribution of office supply over time in Tokyo’s 23 wards, focusing on their vintage, size, and distance from the central business district (CBD). We find that the geographical office supply area has been shrinking from its fringes, in line with the large-scale redevelopment of the central area after the collapse of the asset bubble in the early 1990s. (Japan’s bubble period is widely accepted to have occurred from 1986 to 1991; some studies detect a bubble in the Tokyo real estate market around that period using statistical methods that identify structural changes in property prices [
3]). Whereas small office buildings were constructed along the fringes during the bubble period, newer buildings are larger and are concentrated in the central area.
Second, we investigate the negative consequences for existing office stocks by calculating the vacancy rate over time by the buildings’ vintage, size, and distance from the CBD, and quantify the rent premium employing hedonic regression. We find recent negative consequences for existing property stocks: old office properties along the fringe have recently faced more vacancies and lower rent premiums, even during the upturn in around 2007, showing shrinking demand.
In the literature, “shrinking cities” have been part of a societal concept whereby previously expanding economic activities and populations begin to shrink. The shrinkage of workplaces has been treated as an exogenous shock to urban areas [
1,
4,
5,
6,
7]. The literature directly investigates neither the spatial aspects of shrinkage nor the (spatially) shrinking process of workplaces within a city. The few exceptions include case studies of some residential districts and theoretical modeling approaches [
8,
9,
10]. By contrast, other studies have investigated the metropolis growth process using remote-sensing land-use data [
11,
12,
13,
14,
15], including for Tokyo [
16]. Furthermore, spatial analyses of office supply have been conducted on the development processes of some metropolises [
17,
18,
19]. The shrinking process may not be well-captured via land-use data alone because of the durability in property stock, whereby land use may not be adjusted immediately when the demand is gone. Tracking the supply area of office buildings over 30 years across all of Tokyo’s special wards allows us to capture the shift in market structure over time.
Previous studies have investigated the negative consequences of a shrinking society for existing housing stocks, such as increasing vacancy/abandonment rates and falling property values [
20]. Investigating the recent demand indices of existing property stocks, we confirm that those consequences are also common to office properties in the sense that excessive supply and shrinking demand lead to increasing vacancies and falling rent levels.
Our findings regarding Tokyo’s office market have two main implications for the shrinking city discourse. First, the “shrinking cities” concept is also applicable in a spatial context, even for service sector workplaces. The shrinkage process is unique for central metropolises: The labor force declines while agglomeration power continues. Service sector workplaces are a mirror image of societies experiencing growth and shrinkage: They both expand (to the fringe) and then shrink (to the central area) as the urban core is renewed. Second, allowing large-scale redevelopment in the central area while the economy remains powerful has the potential to transform the metropolis into a more compact form, which may be desirable in the long run. Specifically, shrinking cities require some economic power with which to adjust their property stock to meet residents’ changing preferences and needs. In Tokyo, allowing redevelopment with a larger floor area ratio and public support for these projects will accelerate the demolition and replacement of the existing building stocks. Existing building stocks must be adjusted because of (i) the excessive supply due to overestimated expectations during the bubble of the late 1980s and (ii) the subsequent large-scale redevelopment in the central area. Despite the potential for some negative temporary consequences, such a “rebirth” of the central area will realize the compact form of the metropolis, which may be desirable in the long run.
The rest of the paper is organized as follows.
Section 2 describes the context of the recent shrinkage of Tokyo’s office market.
Section 3 describes the study’s datasets.
Section 4 shows the spatial shrinkage of the office supply, while
Section 5 investigates its negative consequences for the vacancy and rent premiums of existing property stocks.
Section 6 discusses the findings’ implications for the shrinking city discourse. Finally,
Section 7 concludes the paper.
3. Data
3.1. Property-Level Data
We employ two datasets to investigate the office market in Tokyo’s 23 special wards. One is a property-level panel dataset provided by the Xymax Corporation, a premier asset and property management company in Japan (“Xymax data” hereafter). The data cover more than half of all office building stock in Tokyo since 2001 (buildings demolished before 2001 are not recorded in the Xymax dataset). In addition to basic building/locational characteristics such as the year built, floor area, and geocodes, the data include the newly contracted rent for each unit (when the tenant moves in) and the occupancy/vacancy status in each month since 2011.
The other dataset comprises building-use GIS (geographic information system) data for Tokyo’s 23 special wards, provided by the Tokyo Metropolitan Government (“TMG data” hereafter). These data include information on all the building stocks (building use is recorded for each building polygon) in Tokyo for 1991, 1996, 2001, 2006, and 2011. We select the office building as the basic unit of analysis.
Though the TMG data represent all the office property stocks, we mainly exploit the Xymax data, which contain much detailed property-level performance information. (We confirmed the validity of the Xymax data, since the net supply derived from them exhibits trends similar to that derived from the TMG data). The TMG data are used to show the position of newly supplied assets relative to the entire property supply.
3.2. Categorizing Office Buildings
The major components that determine the value of office buildings in Tokyo are their vintage, size, and distance from the CBD.
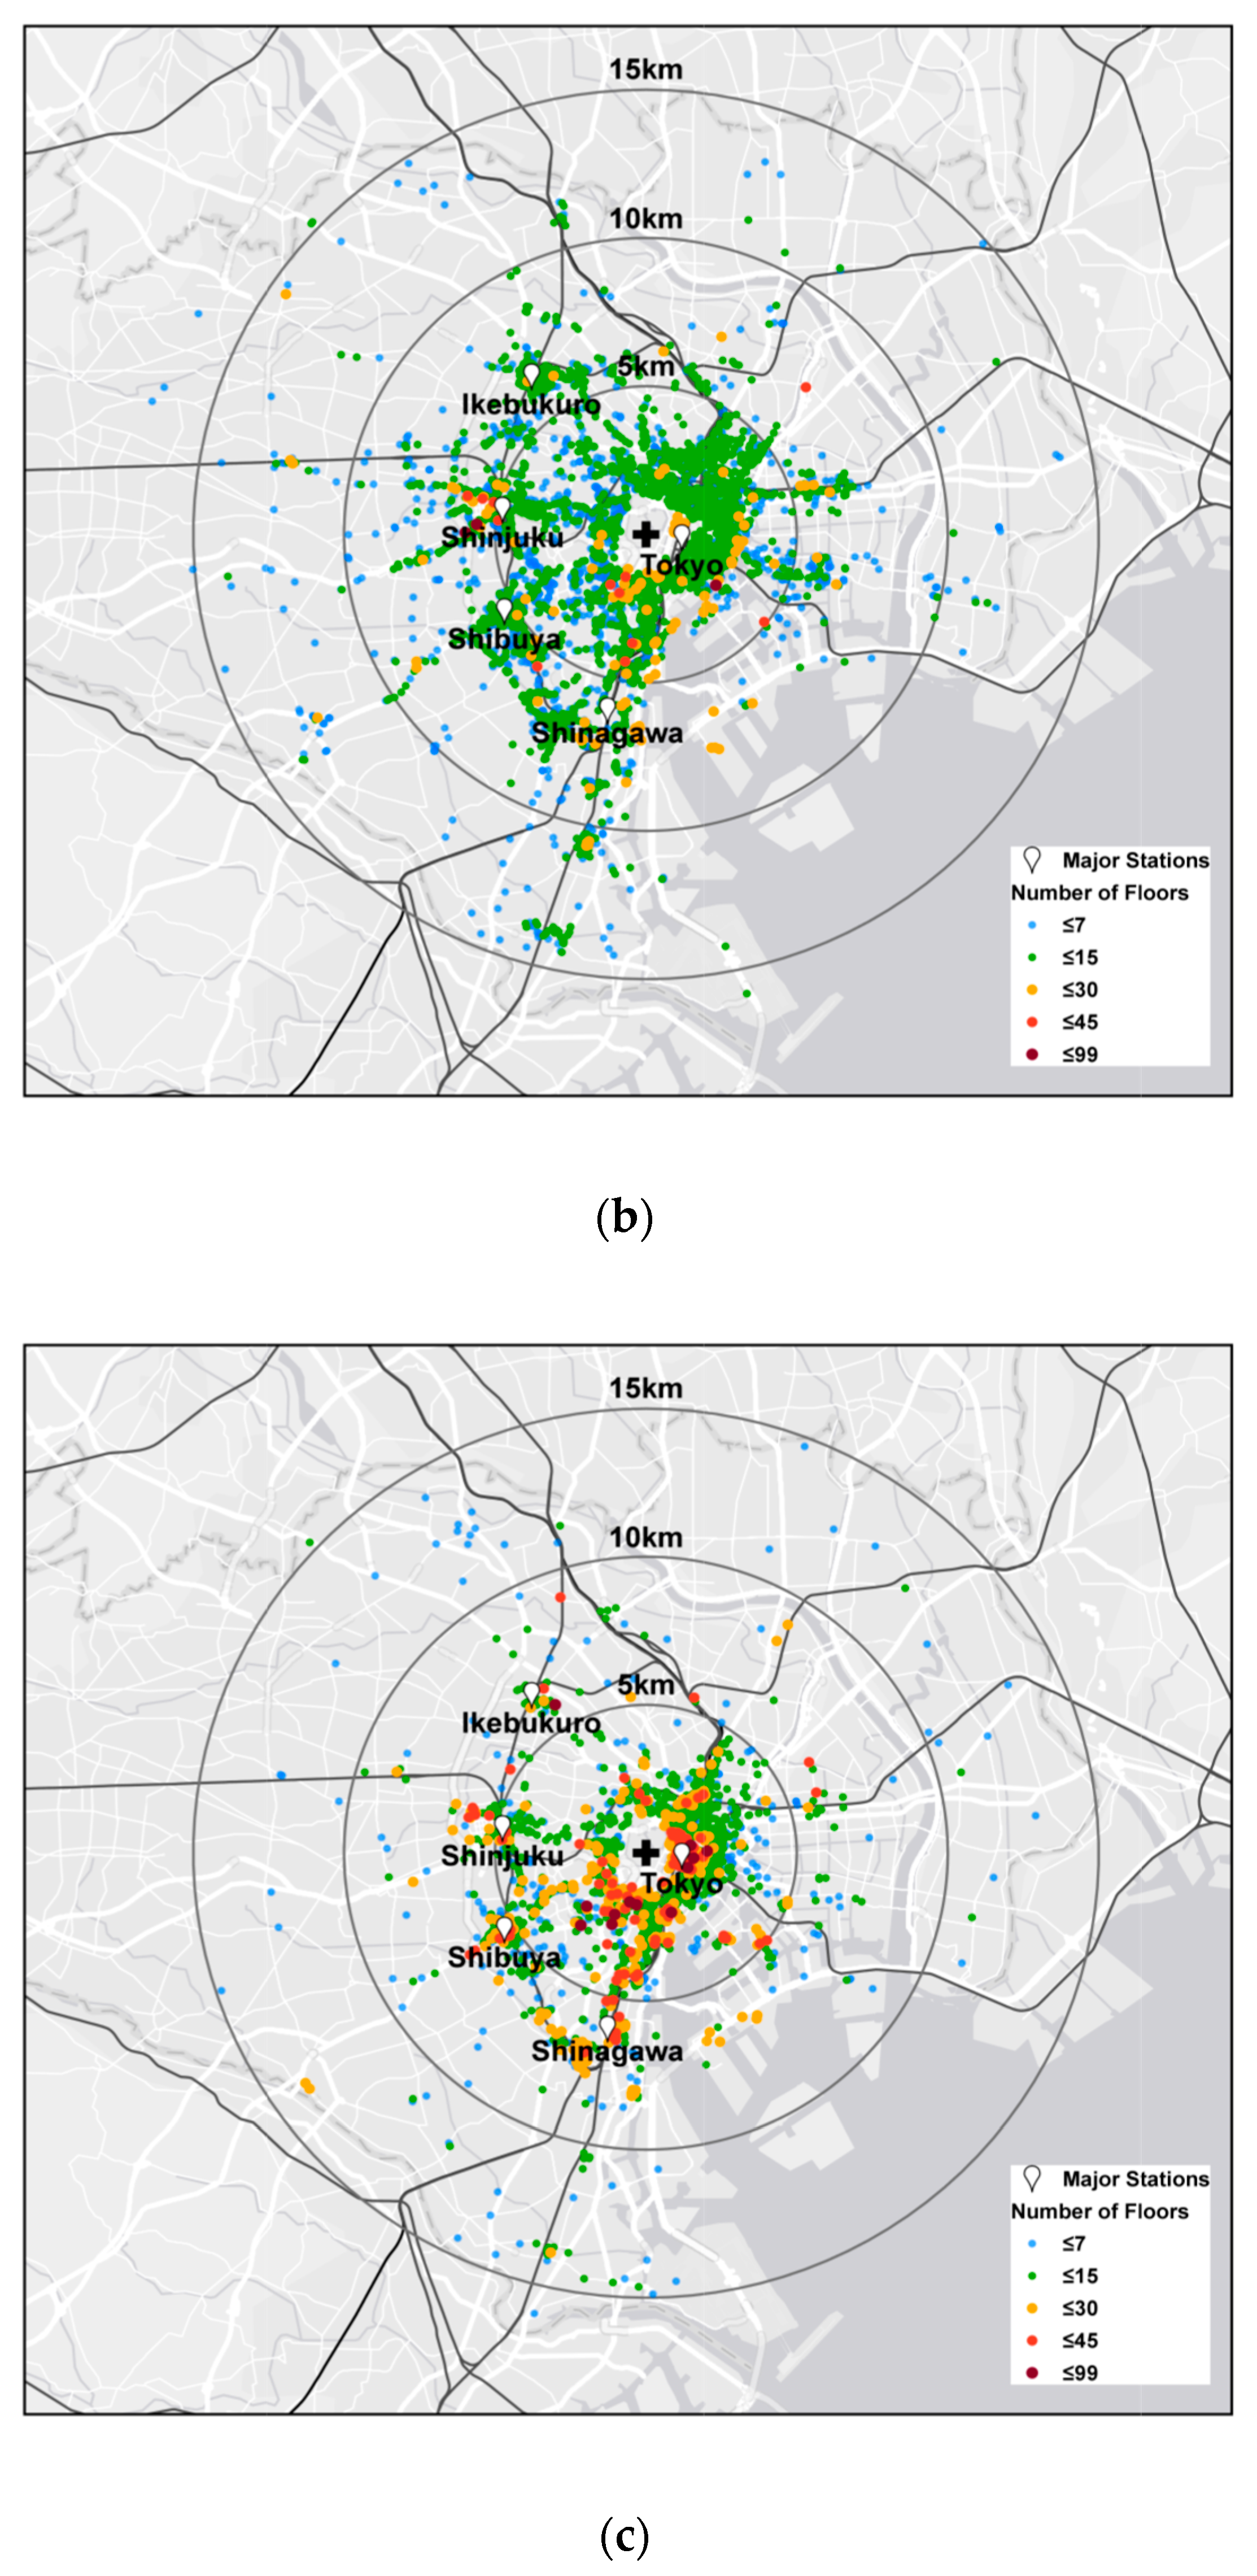
In the Xymax dataset, the vintage (generation) of buildings is categorized as “before the bubble” (until 1985), “during the bubble” (from 1986 to 1997), and “after the bubble” (after 1998). Although the widely accepted bubble period is from 1986 to 1991, we decompose the analysis period as “before the bubble” (until 1985, in panel [a]), “during the bubble” (1986–1997, in panel [b]), and “after the bubble” (since 1998, in panel [c]). We do this because the decision to construct an office building is typically made several years before the completion of the building and TMG data are available at five-year intervals.
In both datasets, building size is measured as total floor area, calculated as its polygon area times its number of levels. We categorize buildings as “small” (1000–10,000 square meters) or “large” (>10,000 square meters) based on their total floor area. The threshold separating large from small buildings is 10,000 square meters because that figure is used to identify large developments by the government. Within the Tokyo metropolitan area, building construction proposals are submitted to either the Tokyo Metropolitan Government or lower municipal offices (the ward office), depending on the total floor area of the planned buildings. Construction of a building with a total floor area larger than 10,000 square meters must be authorized by the Tokyo Metropolitan Government, since that size of building is restricted by zoning laws, and extra assessments are required during the authorization process. Buildings smaller than 1000 square meters are not widely accepted as “office buildings” in the service sector but as low-rise buildings used for administration purposes; these buildings are not likely to be included in the Xymax data.
Distance is calculated as distance from the CBD, which is assumed to be the center of the Imperial Palace (adjacent to the Tokyo Central Station).
4. Spatial Shrinkage of Office Supply
4.1. Spatial Distribution
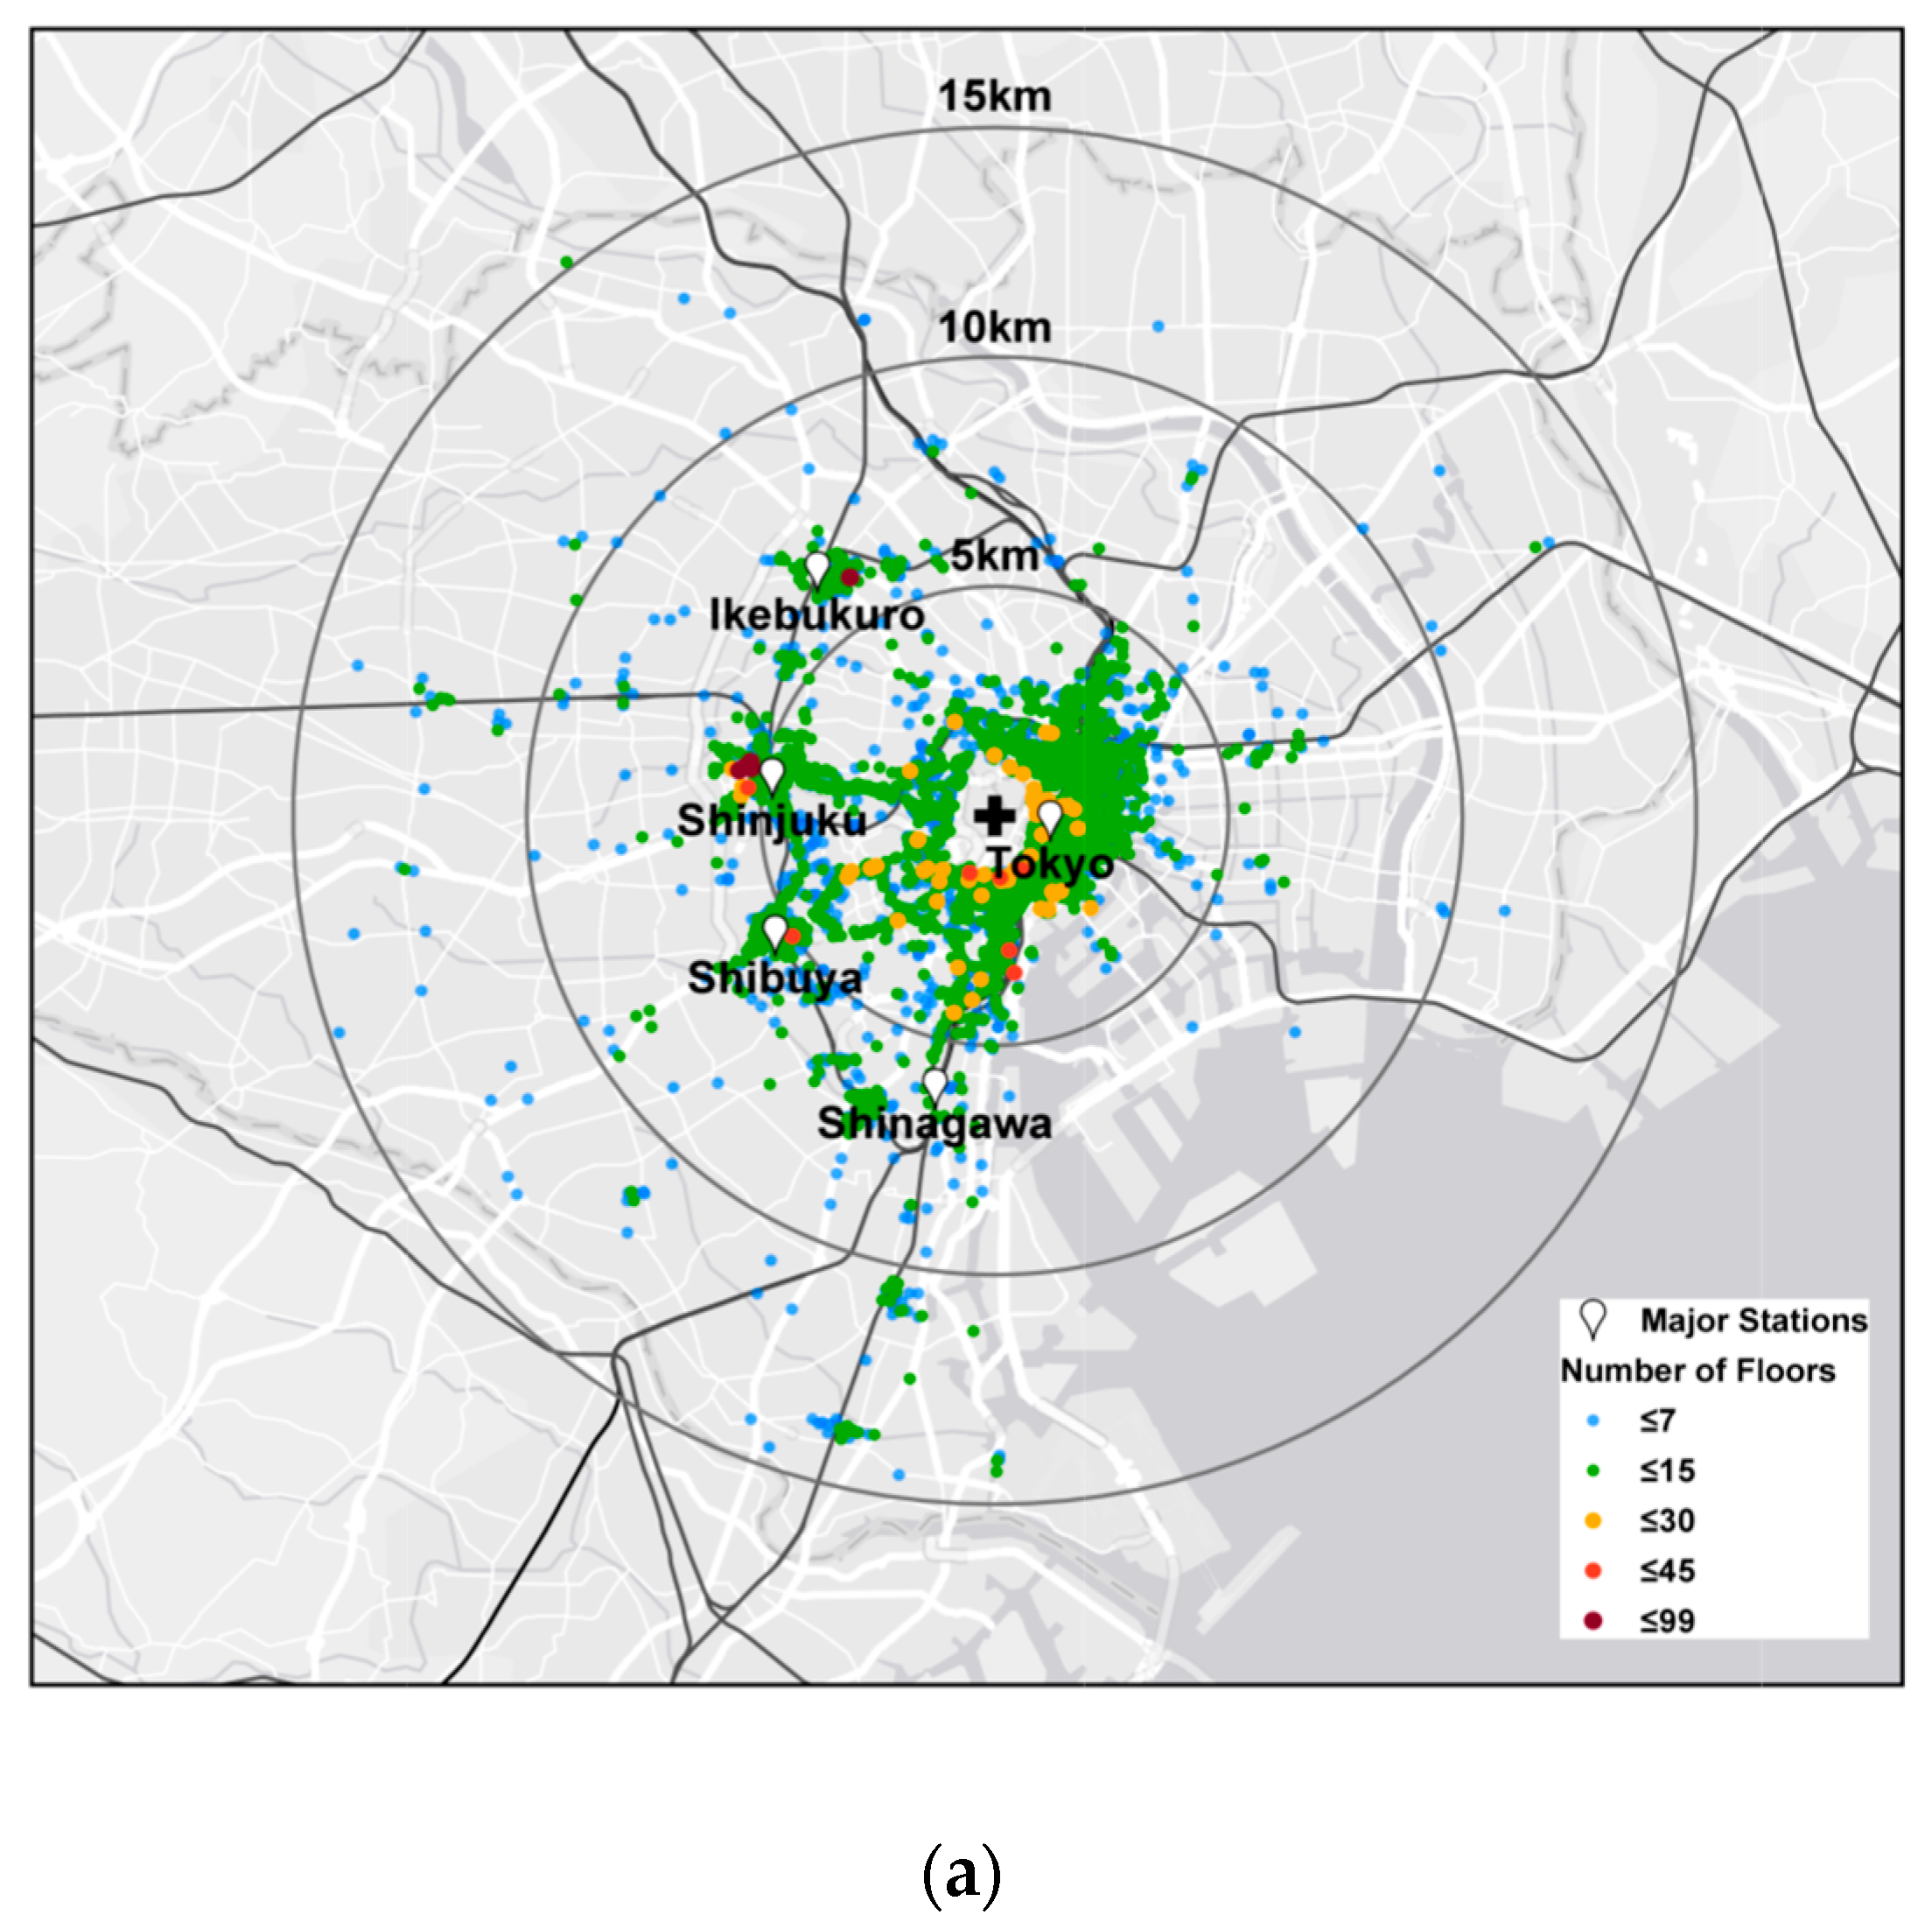
Figure 2 shows the spatial distribution of the office supply before the bubble (until 1985, in panel [a]), during the bubble (1986–1997, in panel [b]), and after the bubble (since 1998, in panel [c]). Each point shows an office building constructed within the period. Properties are categorized based on the year in which the building was built, which is included in the Xymax database. The color of the points indicates the office building’s number of floors: blue and green points are low-rise buildings, whereas orange and red points are high-rise buildings.
The distance from the CBD is categorized into 0–5 km (central area), 5–10 km (sub-center), and 10–15 km (fringe) radiuses. Major train lines and stations are also shown. The traditional office area is around the Tokyo station, while additional office areas exist along the Yamanote circle line, such as Ikebukuro, Shinjuku, Shibuya, and Shinagawa (all around terminal railway stations). Although the geographical area of Tokyo’s CBD is not officially defined, it is widely recognized as the area within the Yamanote circle line (and around its terminal stations), which is roughly contained within a 5 km radius (see
Figure 2). In addition, most of Tokyo’s 23 wards are included within a 15 km radius. Therefore, to quantify the distribution, we categorize office locations using 5 km intervals (and 2.5 km intervals for more detailed investigations).
Before the bubble (panel [a]), the new office supply area is mostly limited to the central area, within 5 km (or 7 km) of central Tokyo. Most of the office buildings in the central area are 15 stories high at most, and taller buildings (30 stories high at most) are concentrated within 5 km from central Tokyo. Most office buildings in the fringe area are seven stories high at most.
Drastic changes occur during the bubble period (panel [b]). The office supply area expands beyond 5 km from the CBD. In the south of Shinagawa, some concentration occurs (including office buildings higher than 15 stories) beyond 10 km from the CBD along the train line to the fringe. The number of office buildings 15 to 30 stories high increases during this period, especially in Shinjuku and Shinagawa.
Drastic changes also occur after the bubble (panel [c]). The central area experiences large-scale redevelopment, and most of the new supply shrinks to within 5 km (or 7 km) of central Tokyo. Significant construction of large-scale supply takes place around the Tokyo station and other sub-centers; most of these buildings are 15 stories high or taller and some are taller than 45 stories. In the fringe, most of the newly built offices are seven stories high or smaller; there is little concentration beyond 10 km from the CBD, as in the bubble period.
4.2. Vintage, Size, and Distance
Figure 3 shows the office supply by vintage, size, and distance. We employ the Xymax data because they contain detailed building profiles such as the built year, which is crucial for identifying a building’s vintage. The panels represent the office supply in periods before the bubble (until 1985), during the bubble (1986–1997), and after the bubble (since 1998). In each panel, the horizontal axis shows the distance interval from the CBD, and the vertical axis shows the sum of the total floor area of buildings (within the distance interval), which is decomposed into the contribution of small/large buildings. The total floor area is the sum of the total floor area of all offices appearing in the rental market from 2001 to the present day. Thus, our calculation of the vintage of Tokyo’s office building stock is a reflection of its past new office supply.
Before the bubble, new office supply is limited to the central area, with a non-negligible share of small buildings. Within 2.5 km from the CBD (the peak interval), around 15 million square meters of office buildings are supplied, of which around 40% are small buildings.
During the bubble, the supply area expands to the sub-centers and fringes, again with a non-negligible share of small buildings. The peak distance interval is 5.0–7.5 km from central Tokyo, suggesting the growth of office supply toward the sub-centers, which is roughly captured in
Figure 2. In the distance interval, around 40% of the supply comprises small buildings. While the total supply is smallest during the bubble period, because it is the shortest time interval (only 12 years), supply beyond 7.5 km is non-negligible compared with the before/after bubble periods.
After the bubble, the supply area shrinks to the central area and is concentrated in large-scale buildings. Within 2.5 km from the CBD (the peak interval), 20 million square meters of offices are supplied, of which more than 85% are large buildings; this represents a clear difference from the other periods. The rest of the distance intervals also represent a significant share of large buildings (around 80–90%, except for the 10.0–12.5 km interval). These trends may reflect the growing demand for new large office buildings in order to adjust to changing preferences and needs.
4.3. Contribution of Bubble Supply to Entire Office Stock
What is shown in
Figure 3 is limited to some extent because the dataset omits buildings that have not appeared in the rental market and, more importantly, buildings demolished before 2001, including the buildings that were replaced with new offices during the bubble period. To formally quantify the history of new office supply, we employ the TMG data, which include complete samples of office buildings that existed at the time (but lack detailed information such as the built year of each building). The TMG data provide a snapshot of the building stock status every five years, so the total amount of the net new supply of offices is calculated as the difference from the total amount of office stock five years previously.
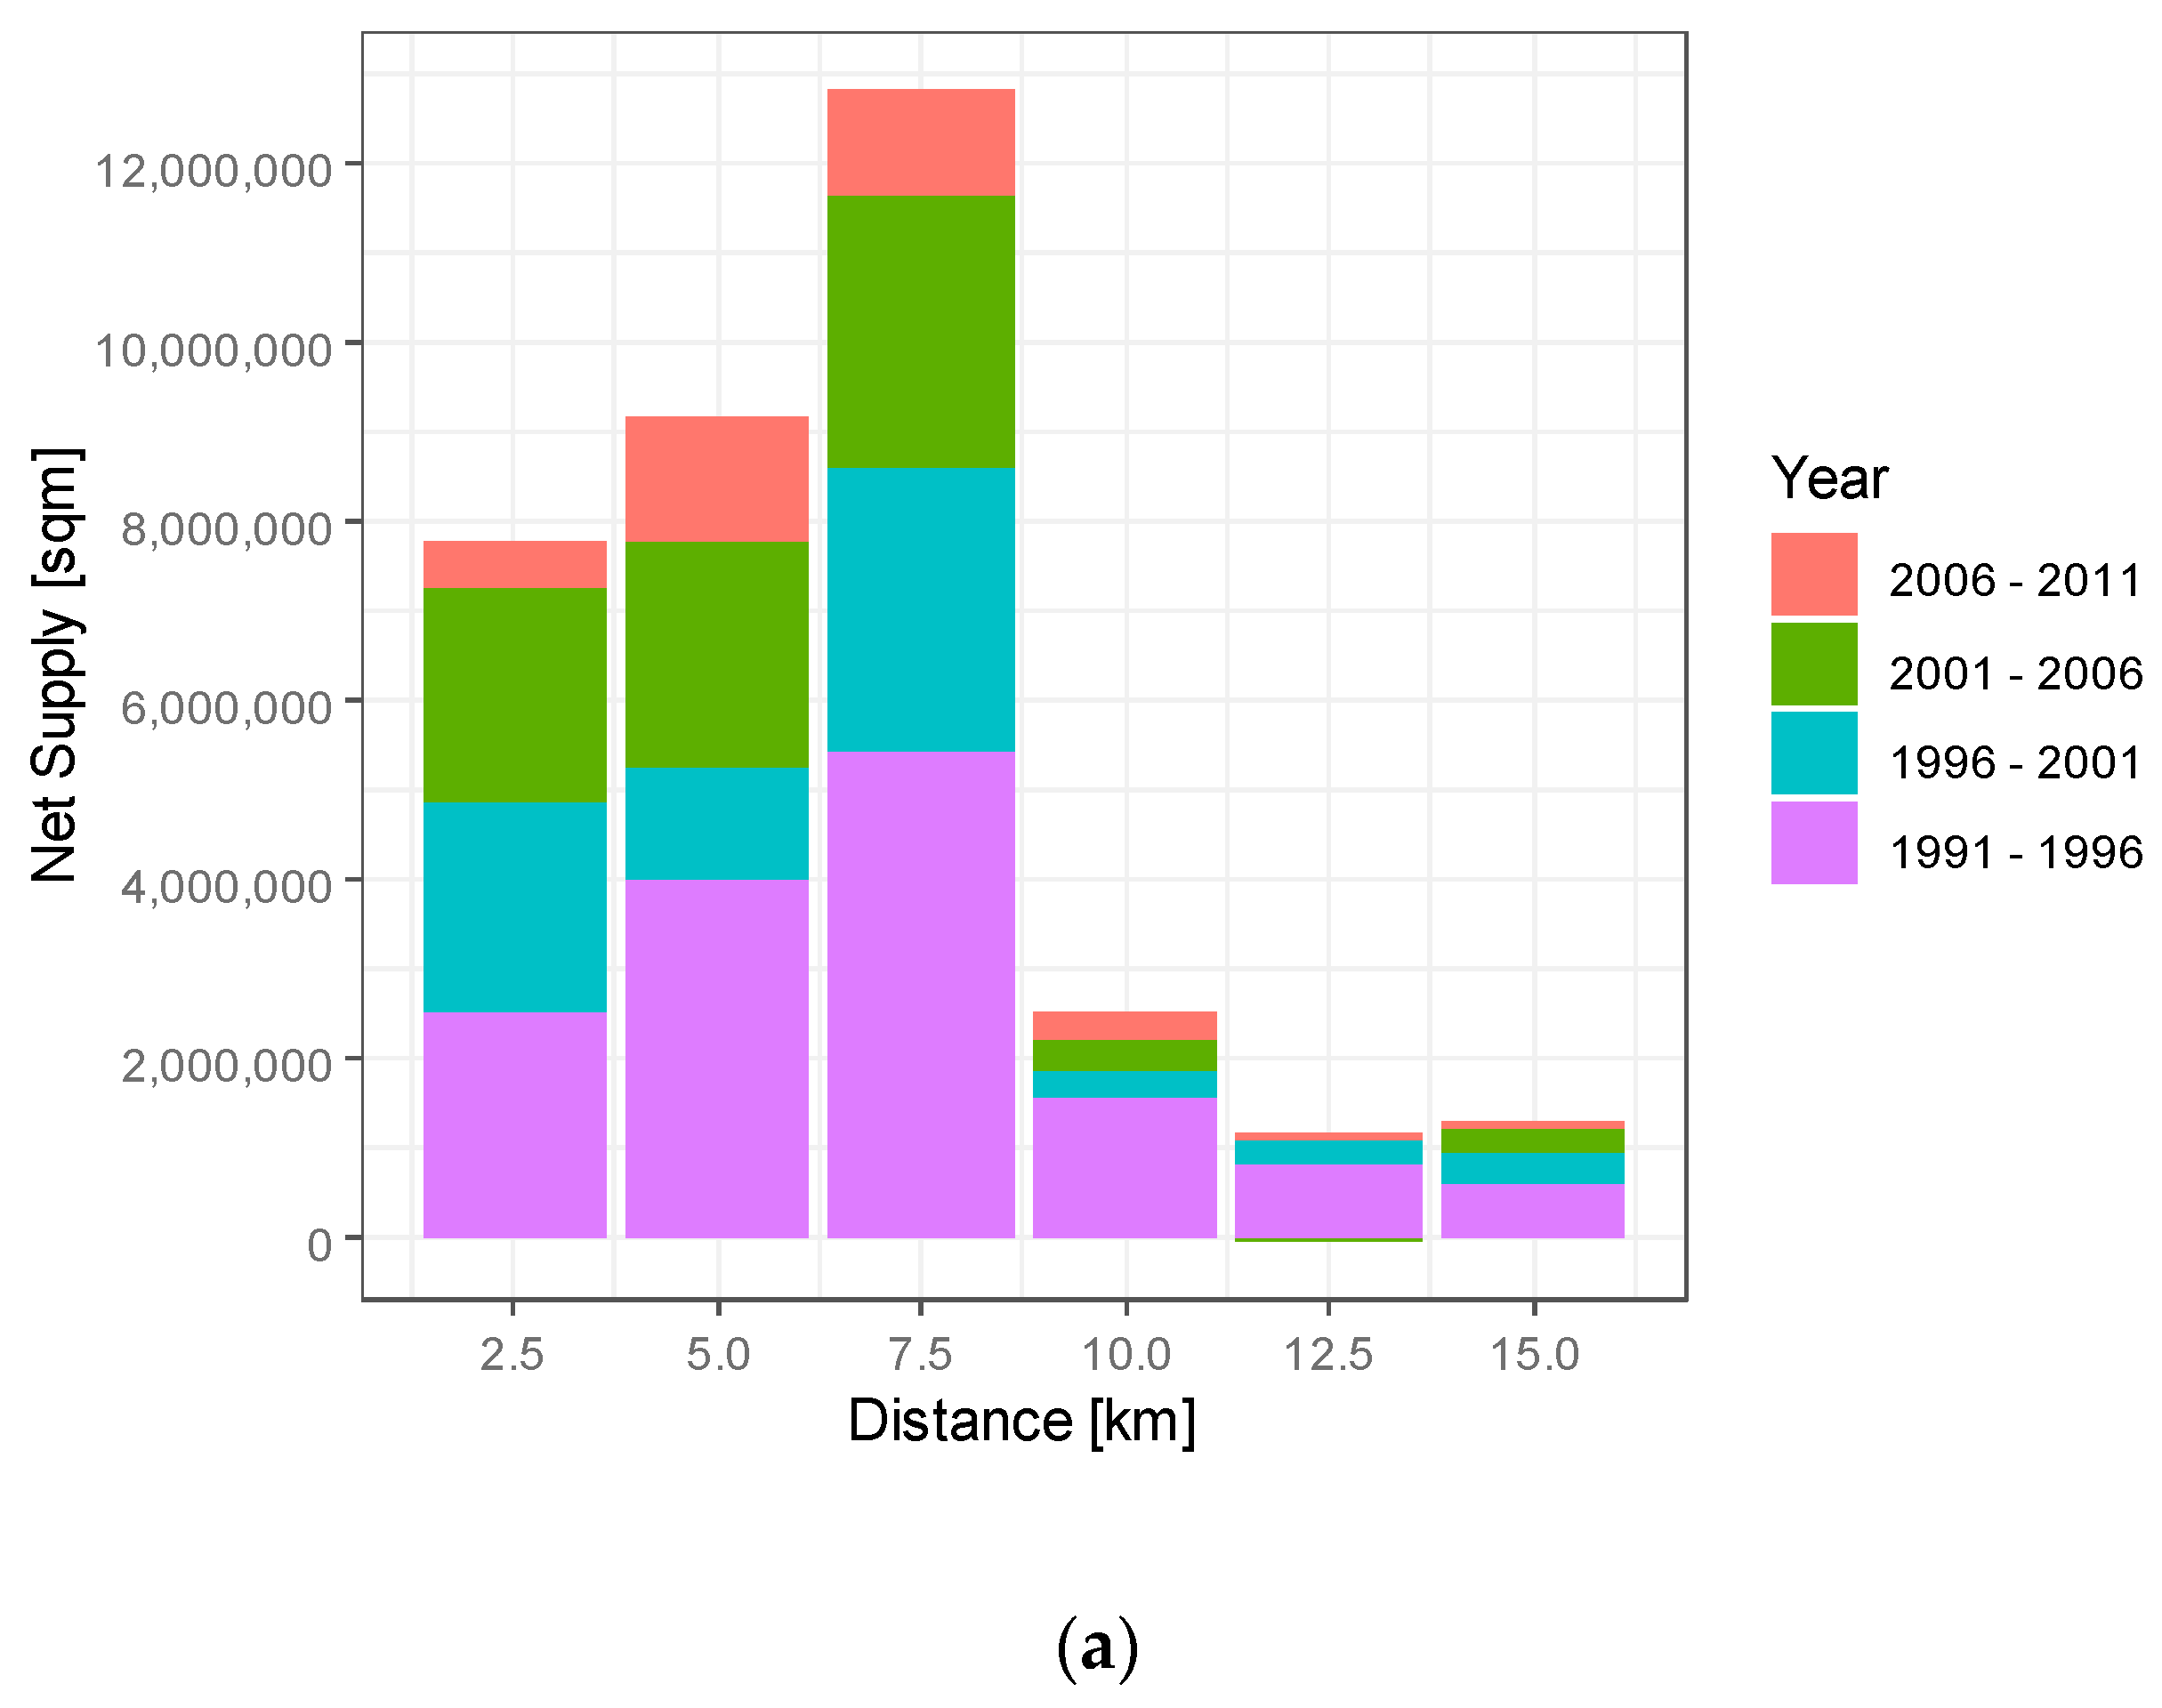
Figure 4 shows the net supply by distance compared with the entire supply from 1991 to 2011 employing the TMG data. In panel (a), the horizontal axis is the distance from the CBD. The vertical axis is the degree of net supply (square meters). Thus, the bars show the increase in the total floor area within the distance interval from five years previously. The net supply includes (i) new development from (vacant) land and (ii) the redevelopment of existing buildings whose office floor area increases. Thus, panel (a) shows the growth of office volume over time. While the suburban office stock remaining in 2011 is supplied mainly during the bubble period (in this case, from 1991 to 1996), offices in the central area consist mainly of recent supply since 1996, which indicates that the obsolete office stock in the central area was rebuilt into larger offices after the bubble period.
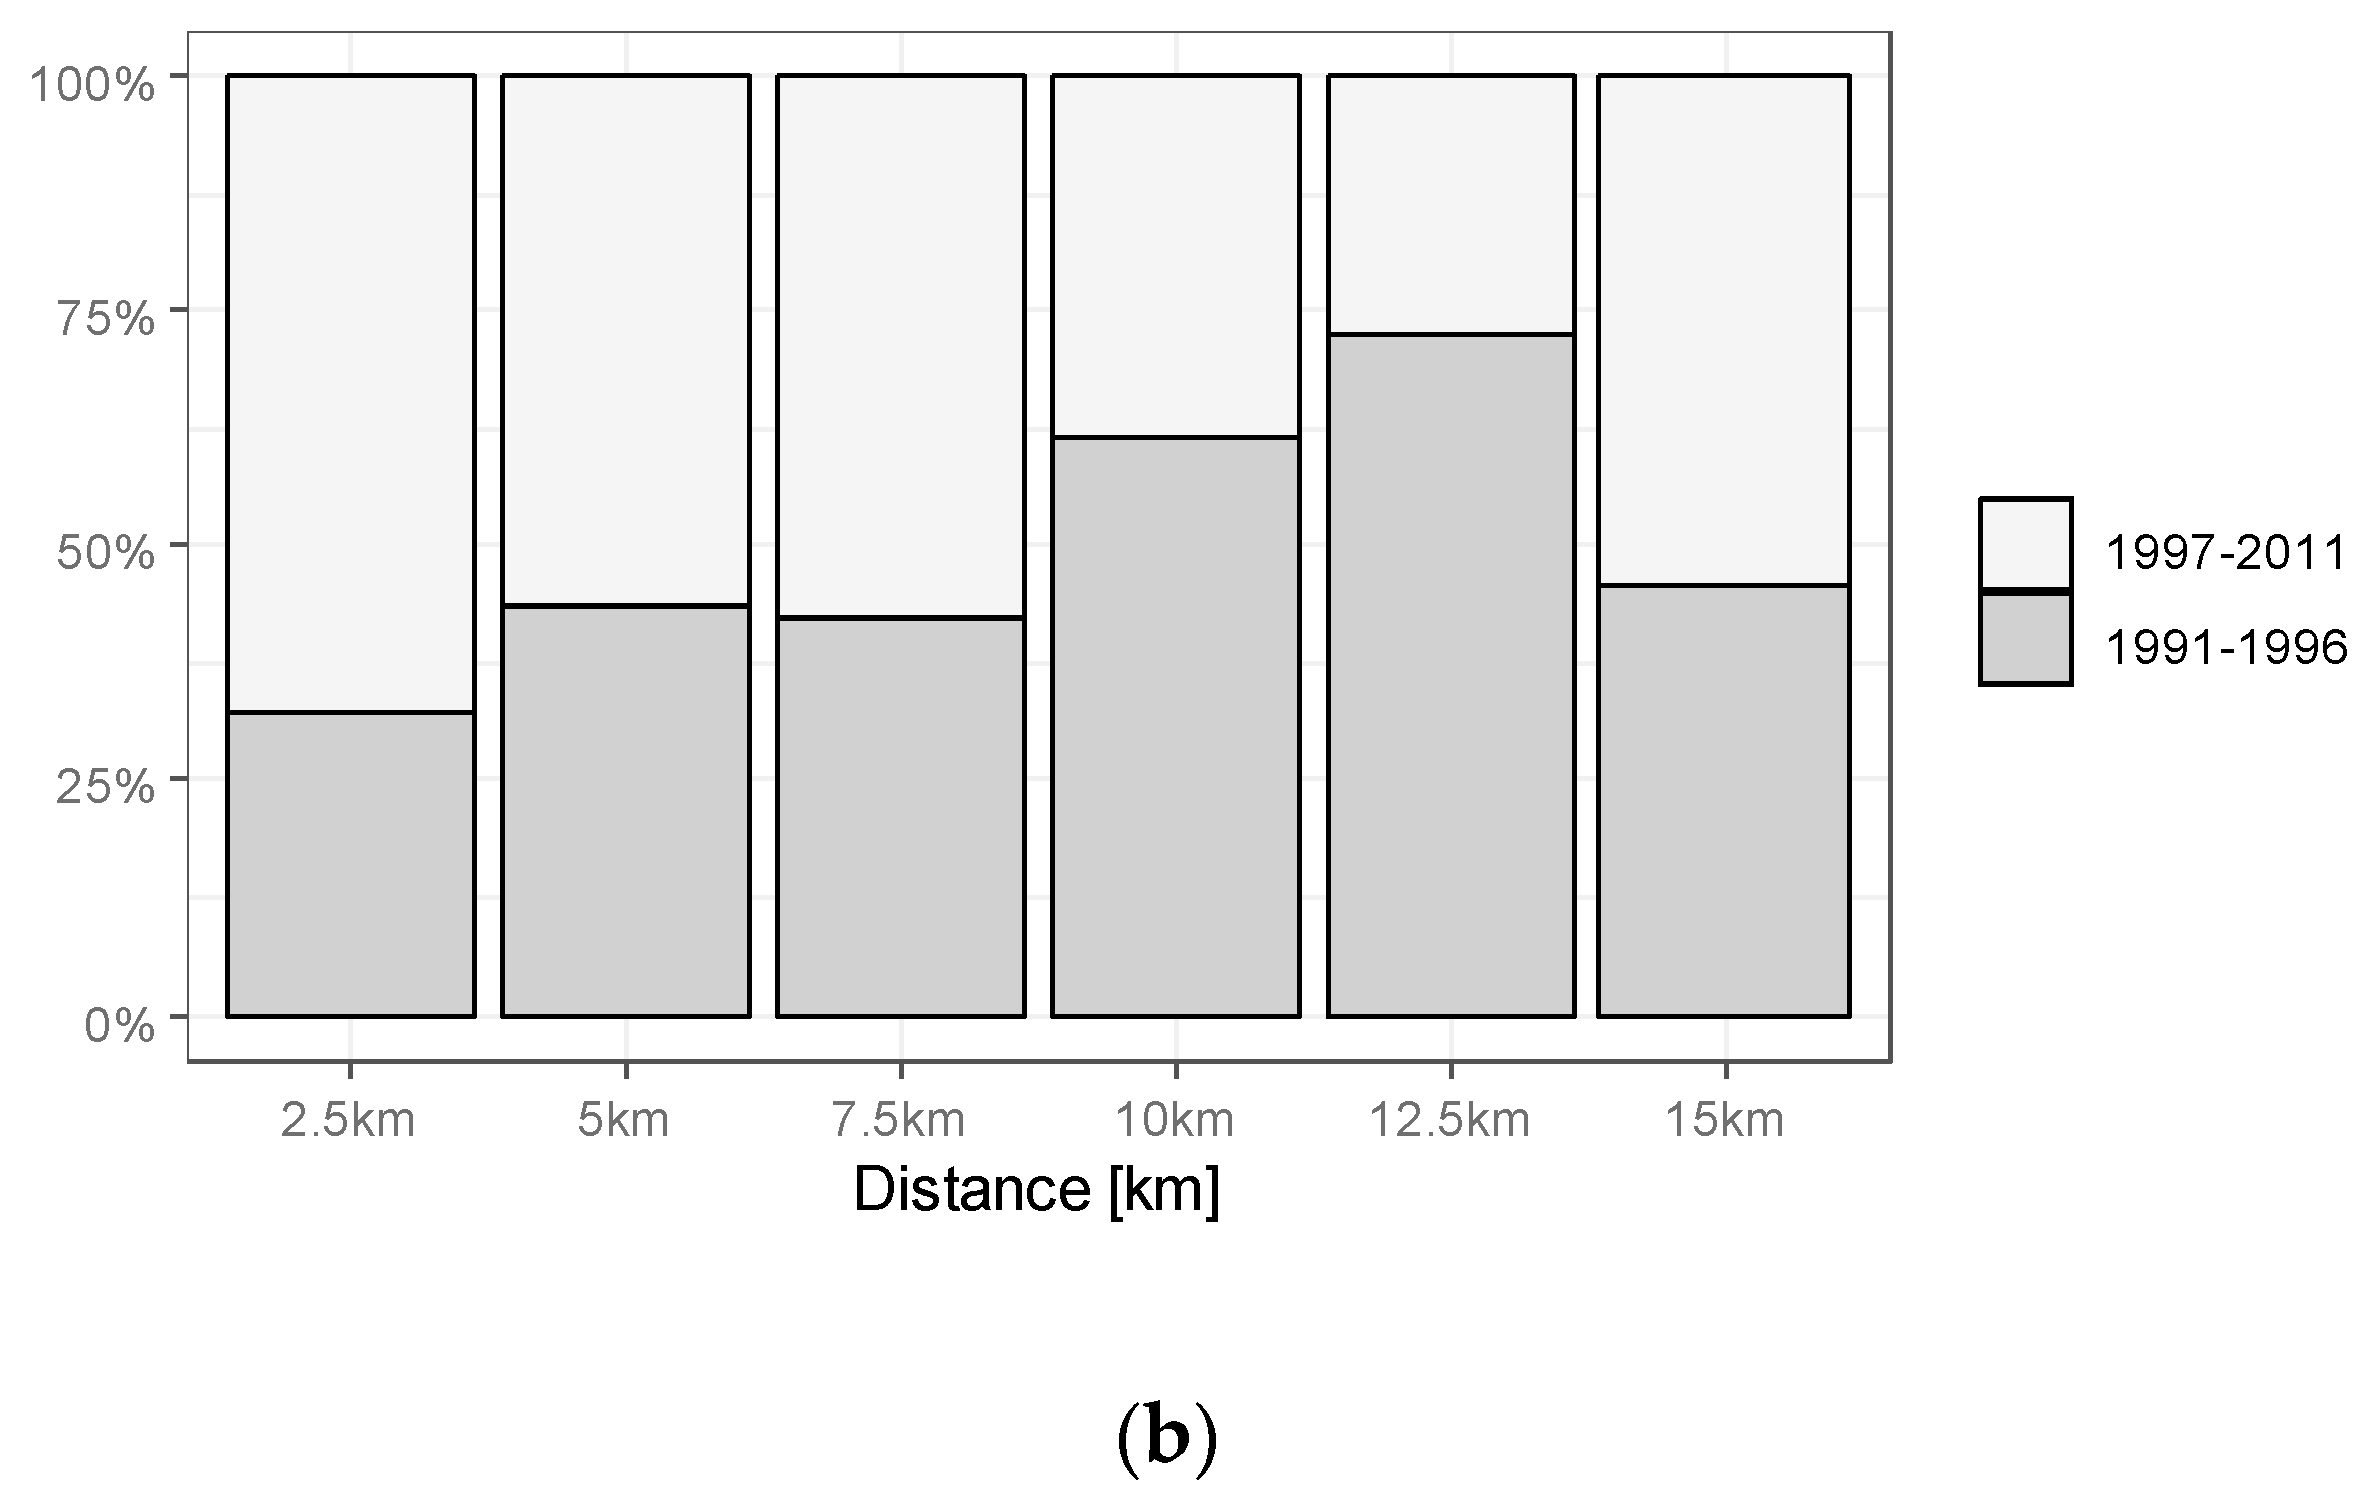
To confirm this more clearly, panel (b) shows the contribution of the bubble supply (1991–1996) compared with the entire supply (1991–2011). The upward sloping structure of the distance from the CBD confirms the significant contribution of office stocks during and after the bubble in the fringe and central areas, respectively.
5. Negative Consequences for Existing Office Stocks
This section investigates the consequences of the shrinking office market for existing property stocks during the post-bubble period. Because the property market adjusts via vacancy and rent levels, the consequences will be captured through these variables.
5.1. Vacancy Rate
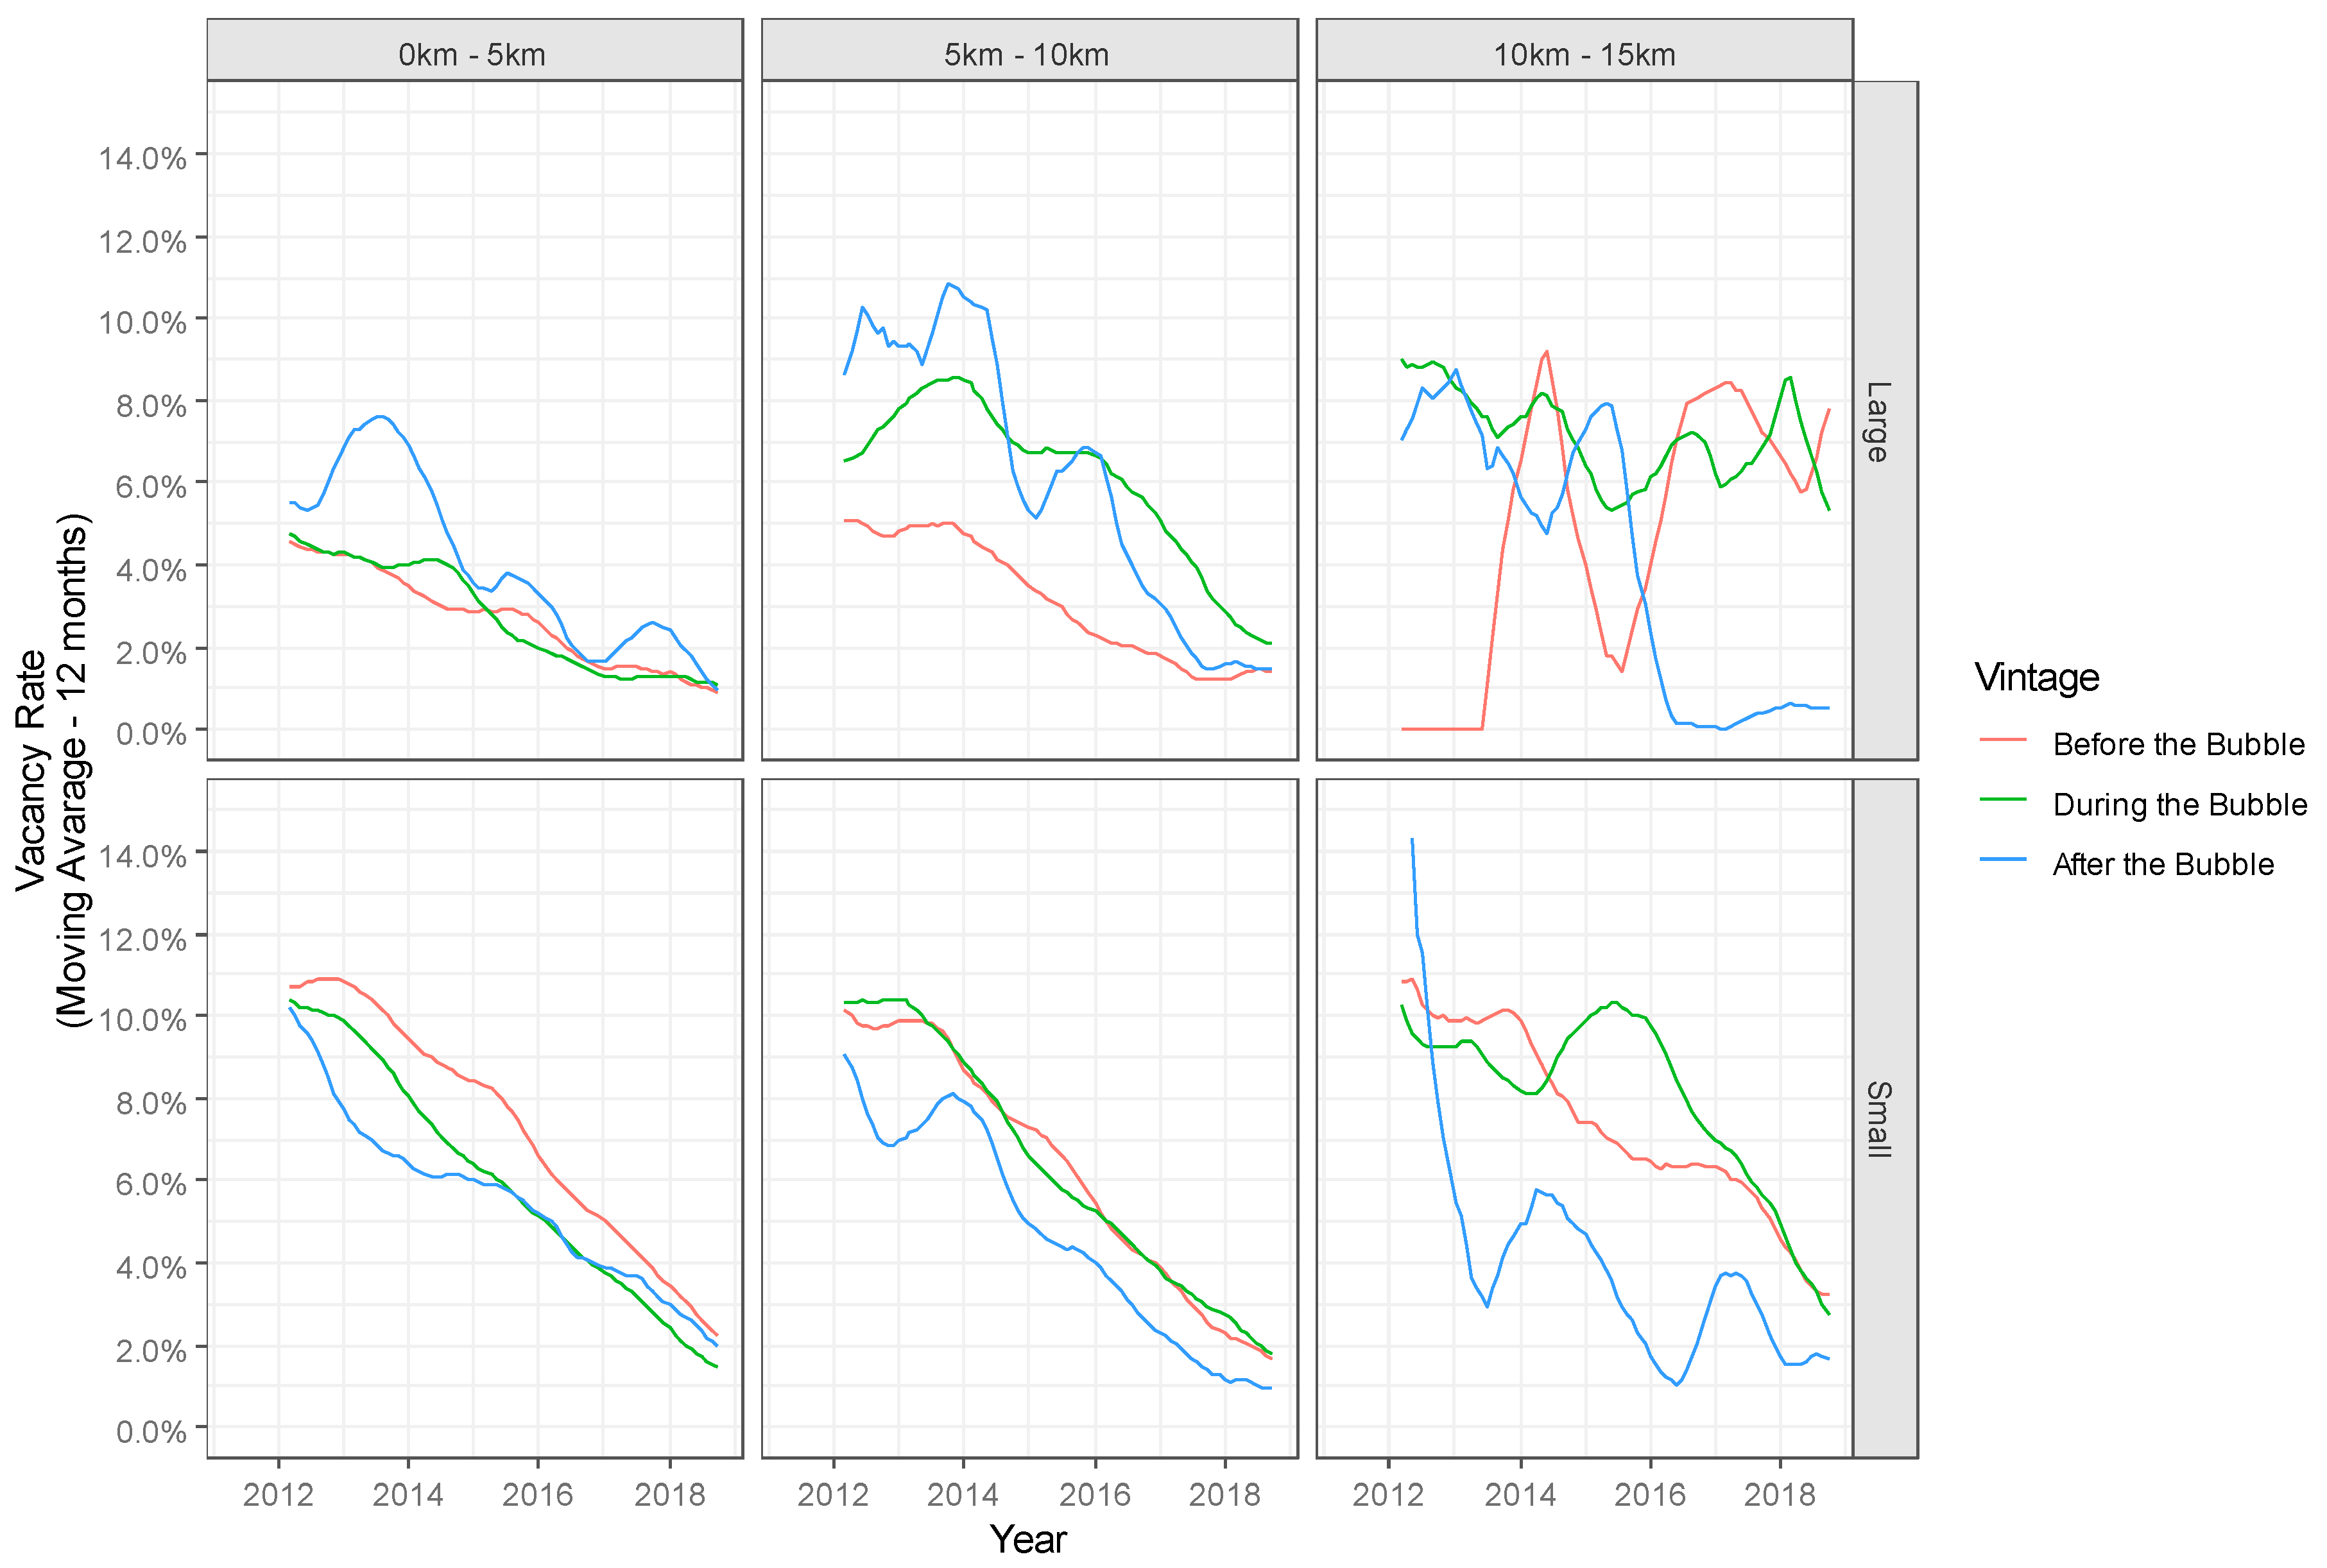
Figure 5 shows the time series of the vacancy rate of existing office properties categorized by vintage (before, during, or after the bubble), size (small or large), and distance from the CBD (categorized by 5 km intervals) employing the Xymax data. (Most of the property-level monthly vacancy ratios are zero, indicating full occupancy; we thus employ the regional-level vacancy ratios (moving average over 12 months) in the analysis). Overall, the vacancy rate continues to drop after 2012, suggesting a recent trend of strong office demand.
However, a closer examination reveals strong heterogeneity. First, large office properties in the central area have a lower vacancy rate over time (less than 4%) because redevelopment enables the upgrading of office buildings to meet contemporary needs. Note that even old buildings are well-occupied because of their locational advantage (survivorship bias may also exist). Second, the vacancy rates for small office properties within a 10 km interval of the CBD exhibit a similar declining trend over time, regardless of the vintage of the property. (Some older properties exhibit a higher vacancy rate; vacancies often occur upon the completion of large-scale office properties, so large buildings tend to exhibit higher vacancy levels than do small buildings). This result shows that small office properties in the central area (within a 5 km interval from the CBD) and sub-centers (5 to 10 km from the CBD) retain stable demand over the property lifecycle.
Third, among large office properties in the sub-centers (5–10 km from the CBD), those that are relatively new during the bubble period (or later) exhibit high vacancy rates. In contrast with those in the central area, such large properties may not be desirable in the sub-centers. Fourth, large office buildings in the fringe (10–15 km from the CBD) built during/before the bubble period have recently exhibited high vacancy rates, although the vacancy rate for new buildings built after the bubble period has declined since 2016. Fifth, small office buildings built in the fringe (10–15 km from the CBD) during/before the bubble period have exhibited high vacancy rates, which have declined recently. This finding suggests that, in the fringe, smaller offices may be suitable for the office market, which has been growing in recent periods. The former tendency for major companies to establish large back-offices in the fringe has recently begun to decline, and office needs are diversifying.
Overall, the high vacancy rate in the fringe after the upturn around 2007 reflects the concentration of office demand on renewed central property stocks; this has caused some of the existing stocks in the fringes to lose competitive power and thus display high vacancies.
5.2. Rent Premium
Table 1 shows the results of the hedonic regression of office rents employing the Xymax data. In column (1), we first estimate the following baseline model:
where ln
Ri,t is the log of newly contracted rent per square meter (JPY/sqm) of unit
i in year
t.
a is the constant.
Vi,t is the vintage (property age) at year
t, ln
Si is the log of floor area,
Di is the distance from CBD, and
Mi is the time to the nearest station, where
b1–
b4 are the corresponding coefficients.
Ci is city fixed effects, and
Yt is year fixed effects.
ei,t is the error term. We employ “pooling data” in the Equation (1) (and the following Equations (2)–(4)); that is, unit-level (denoted as unit
i) office rents that are newly contracted within the sample periods 2001–2018 (denoted as year
t) are all employed in a single regression. The year (time) fixed effects,
Yt, controls for the macroeconomic dynamics over time. Therefore, the coefficients of vintage, size, and distance (property age, log of floor area, CBD distance, (and time to station)),
b1–
b4, capture the percentage change of newly contracted rents corresponding to the unit change of these variables, after controlling for the basic macroeconomic dynamics over time (and the city-level fixed effects). In Equation (1), the coefficients
b1–
b4 are assumed to be constant over time.
In columns (2) to (4), we allow the coefficients of vintage, size, and distance (property age, log of floor area, CBD distance),
b1–
b3, to vary depending on the year. We capture this with the “interaction terms” between each variable (vintage, size, and distance from CBD) and year dummy, after controlling for the basic macroeconomic dynamics over time (and the time to station control and city-level fixed effects):
Note that there are two types of hedonic methods to control time effect: structure restricted hedonic method (employed in column (1)) and non-restricted hedonic model (employed in columns (2) to (4)). [
30] Column (2) replaces the property age with the interaction terms between the year dummies and property age; this captures the structural change of the contribution of property age to office rent over time. Similarly, columns (3) and (4) replace the (log of) floor area and distance from the CBD, respectively.
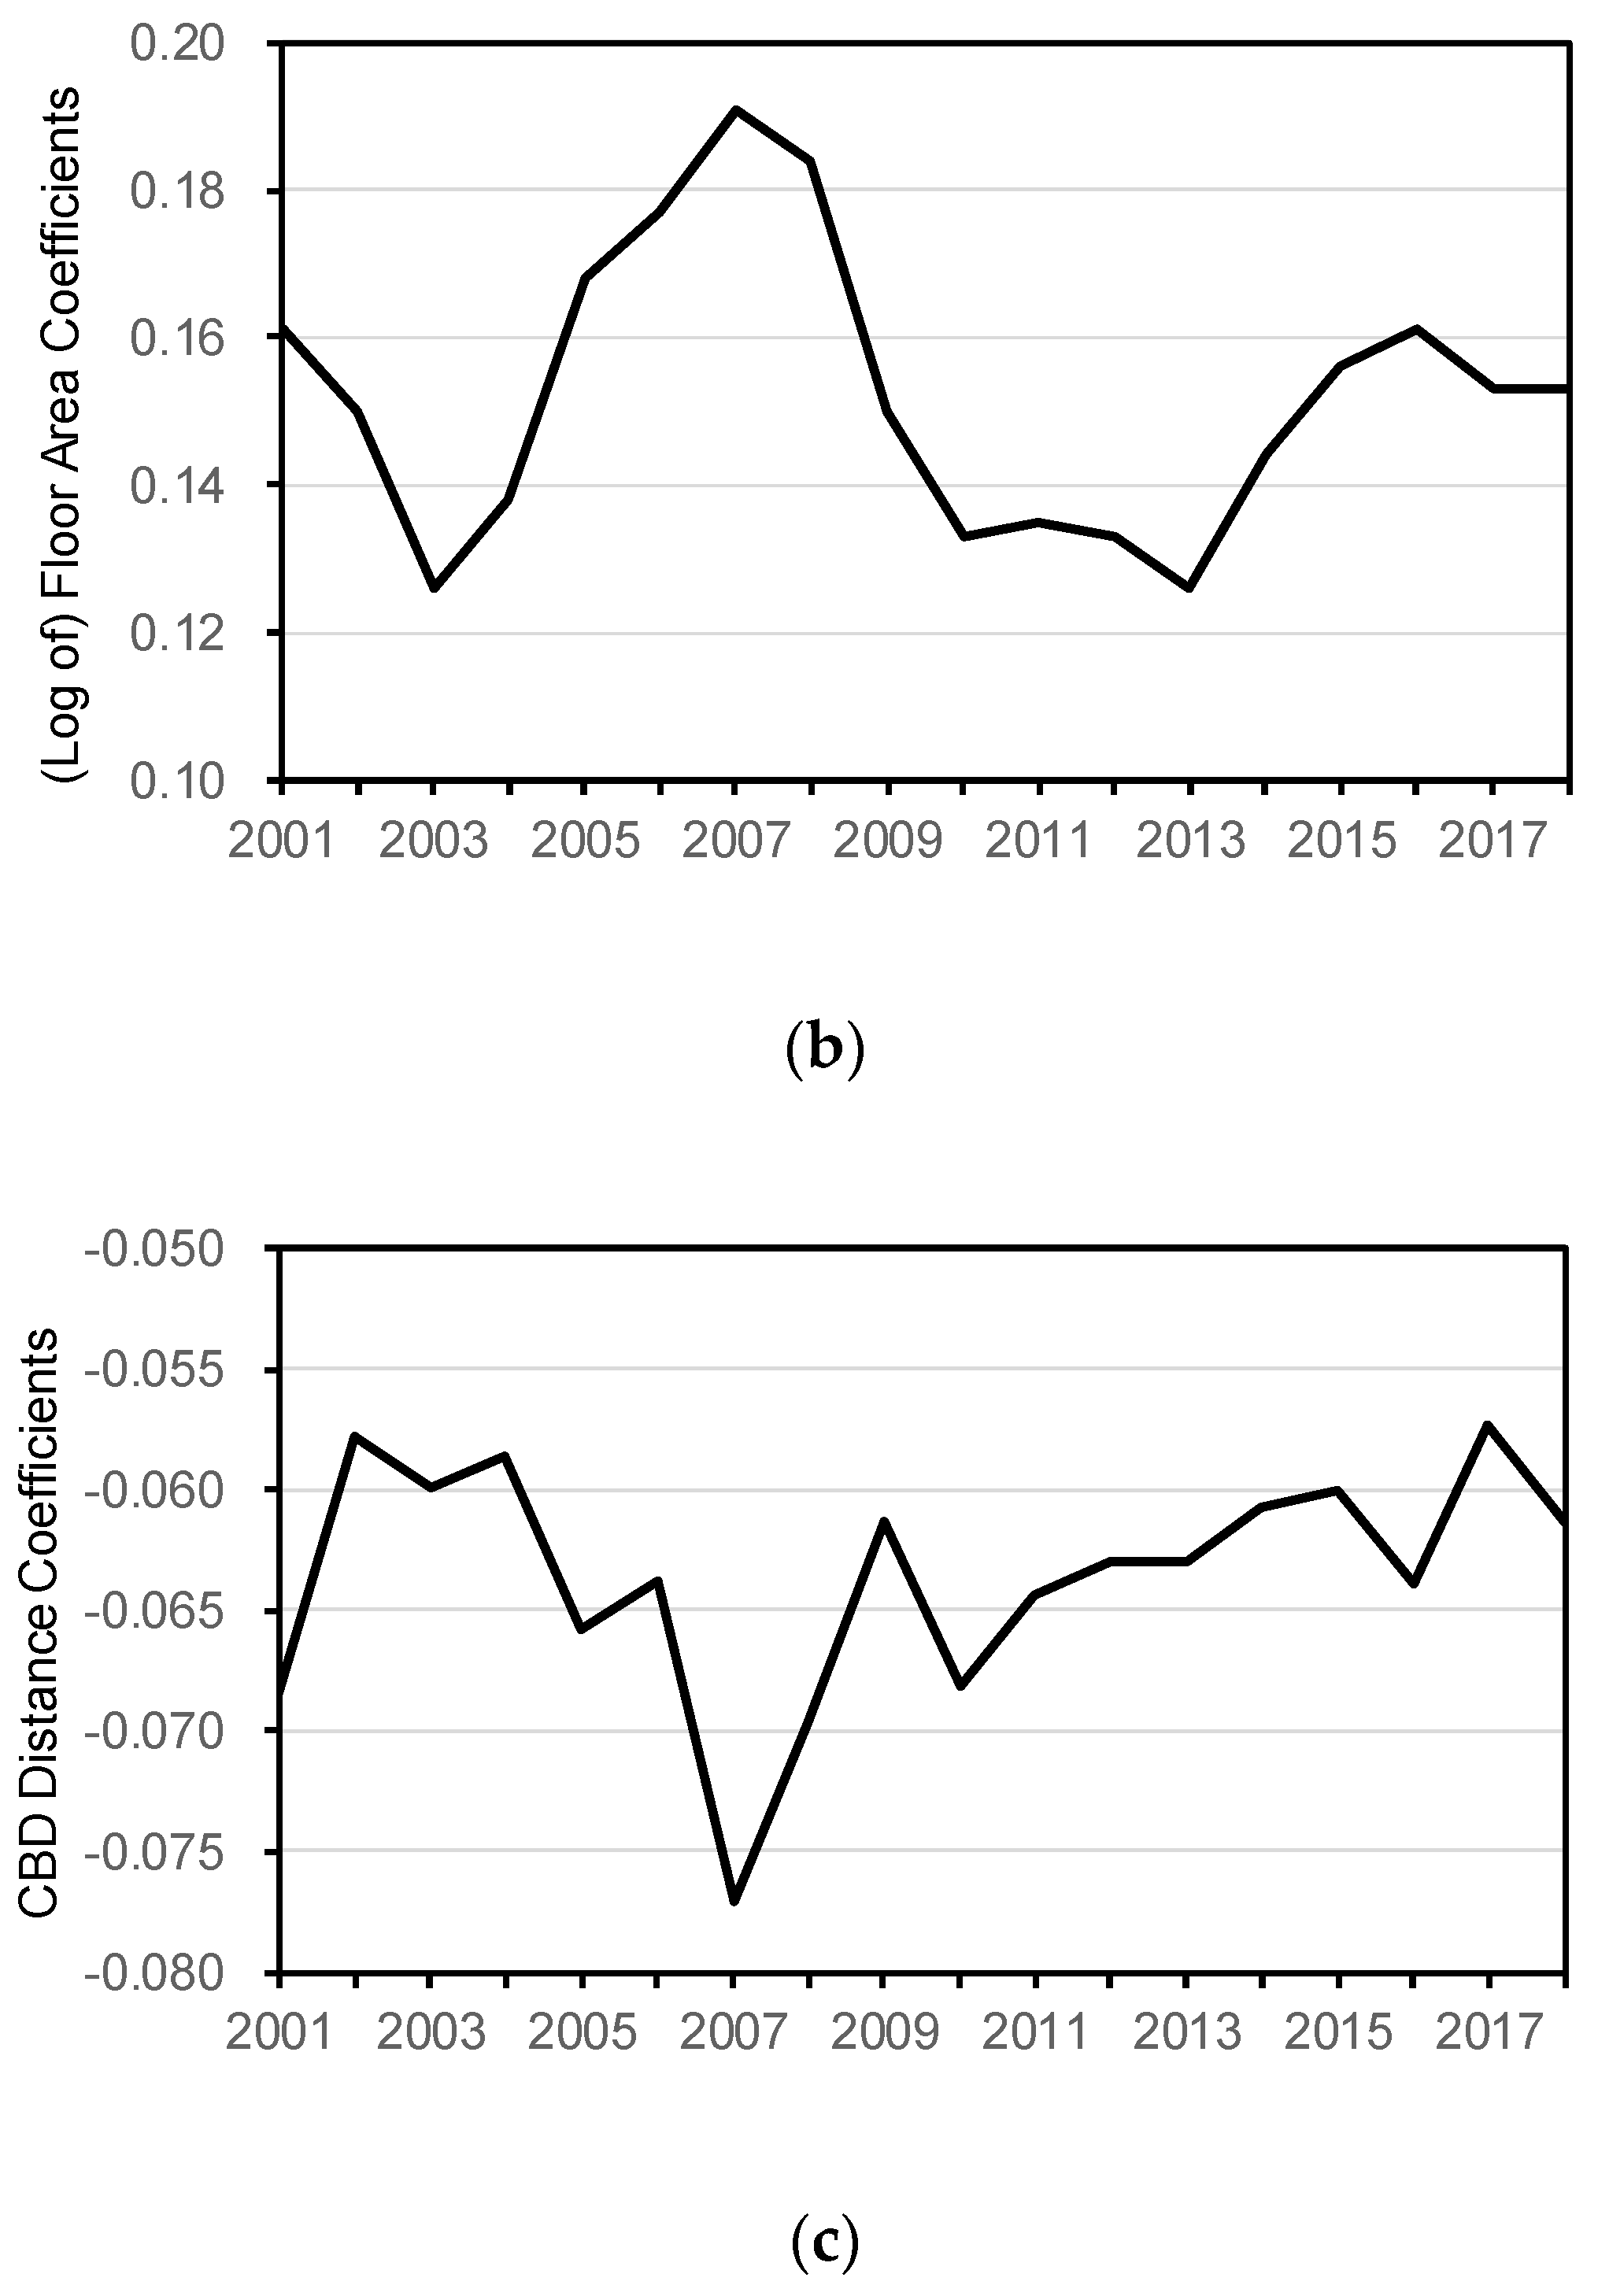
Based on columns (2) to (4),
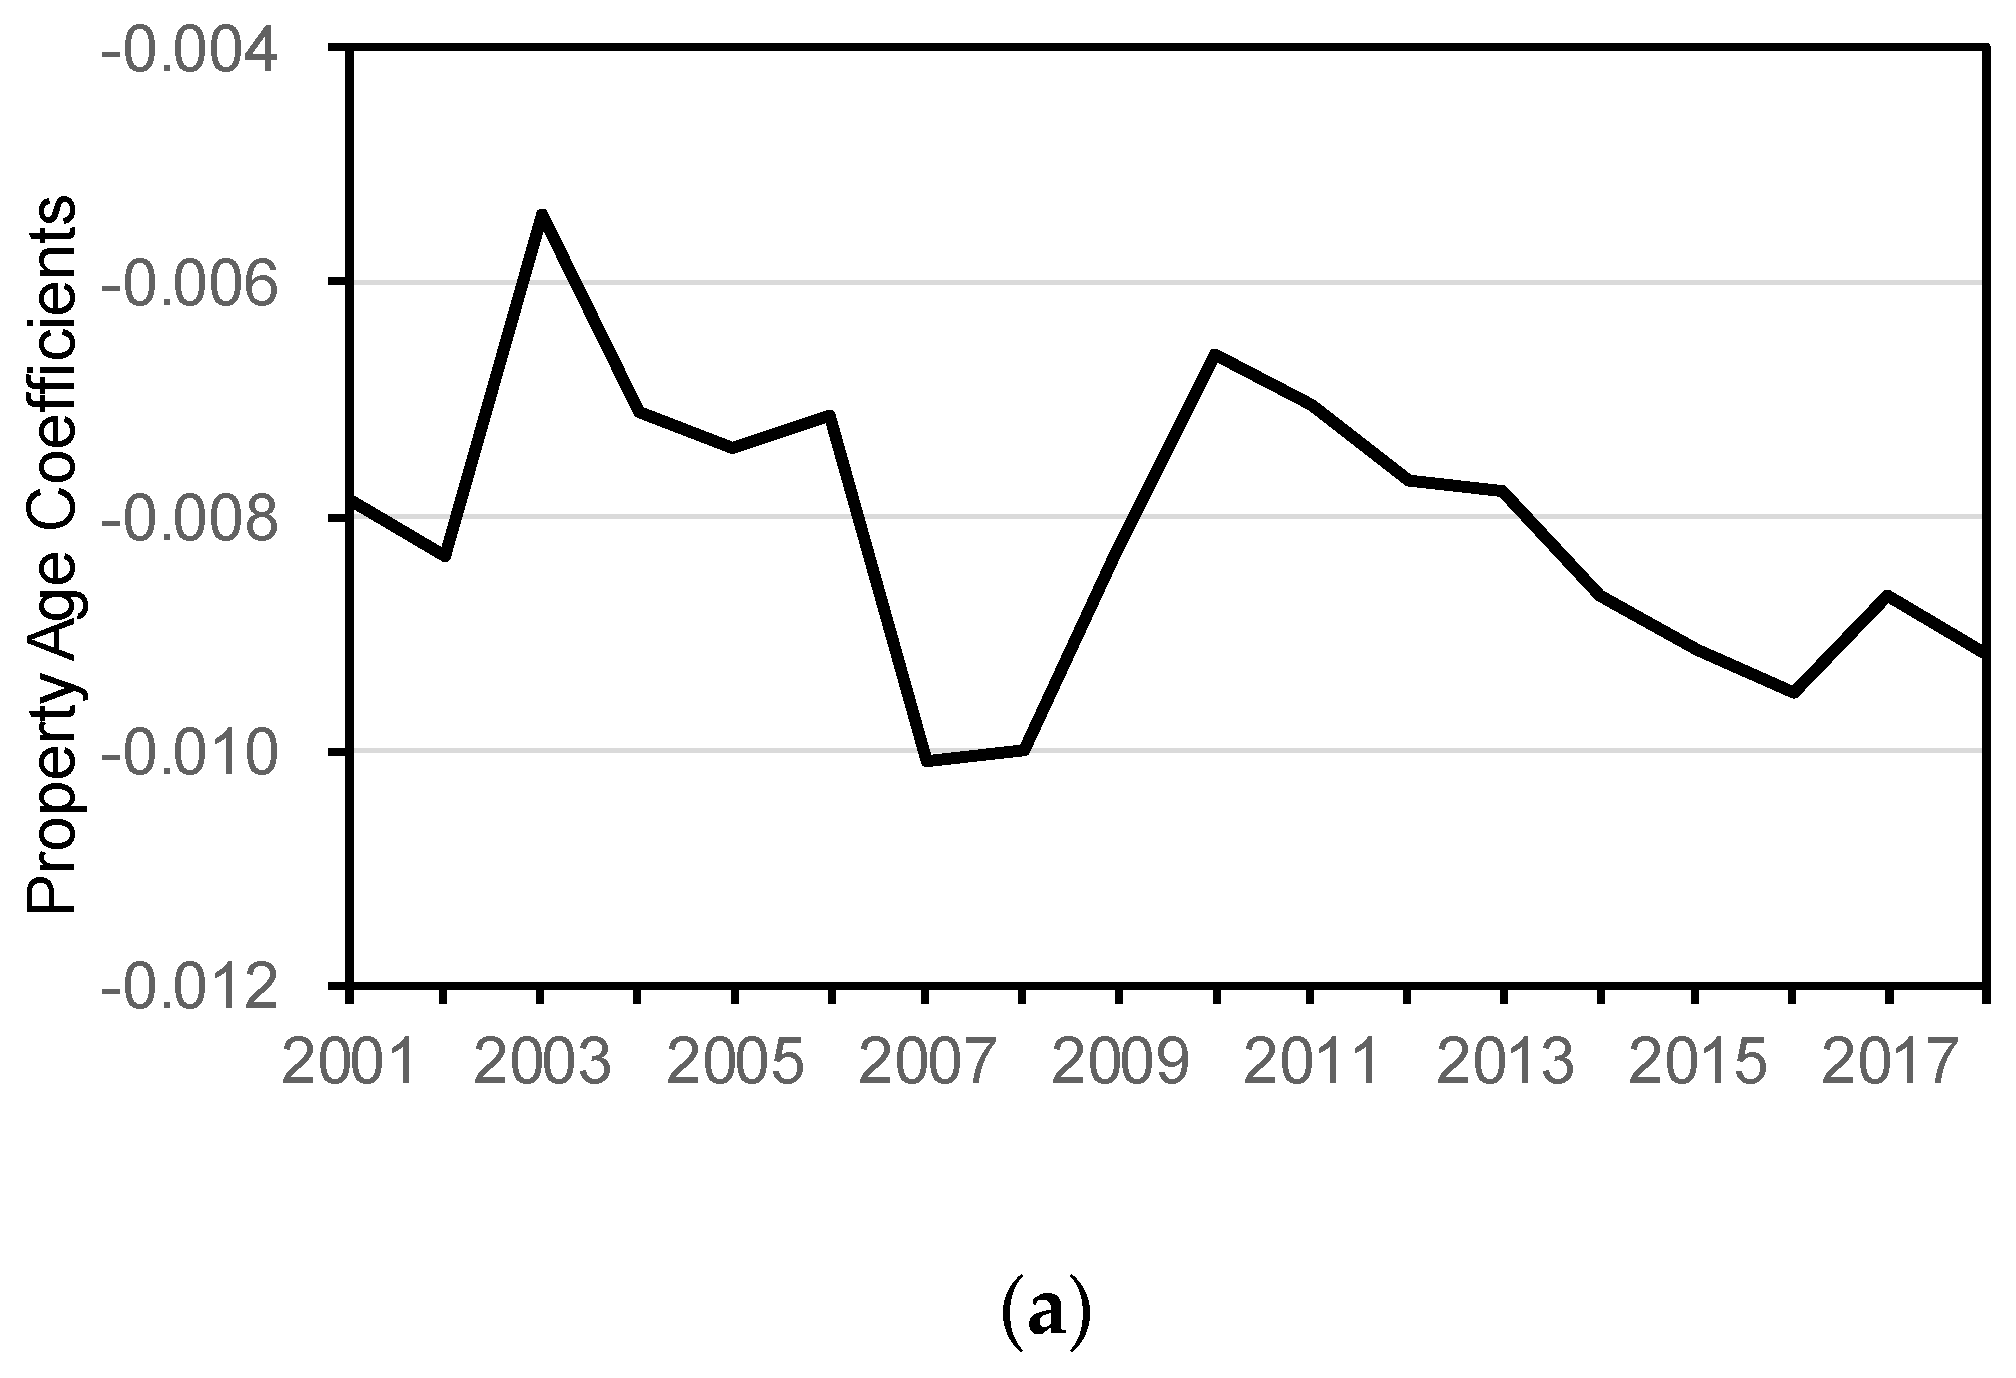
Figure 6 graphically shows the change in the coefficients of the interaction terms over time. This clarifies the rent premium for the additional vintage, size, and CBD distance, after controlling for the basic characteristics of the property at that time. For instance, the decreasing coefficients of property age over time imply that old properties exhibit premiums much lower than those of new properties at that time. In other words, the demand for older properties is lower than that for new ones.
The coefficients of vintage, size, and distance from the CBD change over time (2001–2018). During the upturn in around 2007, the property age coefficient decreases, the floor area coefficient increases, and the distance coefficient decreases. This suggests that large new properties in the central area have larger rent premiums than their counterparts at that time. In other words, small old properties in the fringe attract lower demand at that time.
More recently (2016–2018), the property age coefficient is as low as those around 2007, suggesting that old properties currently have lower rent premiums. The (log of) floor area coefficient shows an increasing trend recently (although the degree is smaller than that of those around 2007), suggesting that smaller properties have lower rent premiums. However, the coefficient of the distance from the CBD is opposite to those during 2007; this suggests that recent rent premiums for office properties in the fringes are not as small as those for properties in the central area. Although office demand in the fringes is gradually becoming stronger, office stocks still need to be adjusted, especially for old buildings.
6. Implications for Shrinking City Discourse
Among the world’s shrinking cities, Tokyo is unique in the sense that it is facing shrinkage while also being one of the largest gateway cities in the world. Many cities are showing common shrinking patterns [
31], while global cities such as London, New York, and Tokyo have been growing continuously due to agglomeration effects. Therefore, they offer an opportunity to capture the shrinkage of their service-sector workplaces and their simultaneous rebirth. Unlike in the downturn and vacancy of central areas in shrinking cities in the United States and in Europe [
32], Tokyo’s fringe is exhibiting vacancies while its central area grows.
6.1. Spatial Shrinkage of the Metropolis, Especially Service Sector Workplace
The literature has dealt with the “shrinking cities” issue as a societal concept denoting the phenomenon in which previously expanding economic activities and population begin to shrink [
1,
4,
5,
6,
7]. The literature does not directly investigate the spatial aspects of shrinkage, nor does it examine the spatial shrinkage of workplaces within central metropolises.
By tracking the supply area of office buildings over 30 years and the recent demand indices of existing property stocks, we capture the spatial and physical aspects of shrinkage in the office market. This suggests that the concept of “shrinking cities” is also applicable in a spatial context, even for service sector workplaces. In other words, offices are a mirror image of societies experiencing growth and shrinkage. They both expand (to the fringe) and then shrink (to the central area) as the urban core is renewed. The negative consequences of a shrinking society discussed in the housing context also apply in the office property context, in the sense that excessive supply and shrinking demand lead to a high vacancy rate and low rent premiums in the fringe area.
6.2. Public Involvement and Economic Power in the “Rebirth” of Cities
Even Tokyo, one of the largest metropolises in the world, cannot escape the shrinking demand in the property market. In the near future, this may also apply to other large metropolises, particularly in East Asia and Europe. However, the shrinkage is not only a negative phenomenon but can also serve as an opportunity to renew these cities.
Even amid the shrinking demand, property preferences continue to change. Thus, adjusting existing property stocks in a city or metropolis is always necessary. Although the Japanese property market has been criticized for its “scrap and build” culture, in which buildings are frequently demolished and replaced, this process keeps buildings up to date with the (albeit shrinking) contemporary demand.
Tokyo’s experience has implications for the question of how best to form a spatially compact city, which may be desirable in the long run. Allowing and supporting large redevelopment in a restricted central area has the potential to transform a metropolis into a more sustainable compact form. Redeveloping depreciating property stocks requires concentrating declining economic powers. Despite the potential for temporary negative consequences for existing properties, such a rebirth of the central area would realize the compact form of the metropolis, which may be desirable in the long run.
Some Western cities impose strong supply constraints for new buildings in central areas. This may lead to the underutilization of existing property stocks in such areas [
33], whereas, even in a shrinking society, vacancies among old obsolete properties in central areas provoke urban sprawl to the suburbs.
7. Conclusions
Although global metropolises continue to grow, they face the risk of shrinkage. This study captures and contextualizes the shrinkage of the office market in Tokyo, one of the largest cities in the world that has been dealing with a shrinking labor force since 1995.
Employing unique property-level data on Tokyo’s office buildings’ performance and uses, the study quantifies the geographical distribution of office supply over time and shows that the geographical area of office supply is shrinking from the fringes, in line with the large-scale redevelopment of the central area after the collapse of the asset bubble in the early 1990s.
Analyses of changes in vacancy rates and rent premium (via hedonic regressions) suggest that old office properties in the suburbs have recently faced more vacancies and lower rent premiums, even during the upturn peak in around 2007.
This evidence suggests that (i) the “shrinking cities” concept is also applicable in a spatial context, even for service sector workplaces in central metropolises, and (ii) allowing large-scale redevelopment in a central area while the economy remains powerful has the potential to transform the metropolis into a more compact form, which may be desirable in the long run. The Tokyo experience suggests a new pattern of shrinkage in mature societies.
In this study, buildings that are replaced (i.e., torn down and rebuilt), especially during the bubble period, are not well-captured by the dataset. In reality, such replacements may improve the quality of office buildings (or their productivity) or convert them to other uses (such as residential uses). Formally clarifying these adaptation processes occurring in shrinking metropolises will likely support the view that the shrinkage is not a hopeless phenomenon [
31]. This is left for future research.


