Article

Performance of Permanent Vegetable Production Systems Designed with the PermVeg Model for the Red River Delta, Vietnam

1
Field Crops Research Institute, Hai Duong and Vietnam National University of Agriculture, Gia Lam 11311, Hanoi, Vietnam
2
Applied Plant Research, Wageningen University and Research, P.O. Box 430, 8200 AA Lelystad, The Netherlands
3
Wageningen Plant Research, Wageningen University and Research, P.O. Box 16, 6700 AA Wageningen, The Netherlands
4
Centre for Crop Systems Analysis, Wageningen University and Research, P.O. Box 430, 6700 AK Wageningen, The Netherlands
*
Author to whom correspondence should be addressed.
Sustainability 2019, 11(10), 2719; https://doi.org/10.3390/su11102719
Submission received: 25 March 2019 / Revised: 29 April 2019 / Accepted: 9 May 2019 / Published: 14 May 2019

Abstract

:
The aim of the research described was to design permanent vegetable production systems for the Red River Delta in Vietnam. Permanent vegetable production systems better meet the increasing consumer demand for vegetables and may increase farmers’ income. Optimum crop sequences for permanent vegetable production in the Red River Delta were designed with the recently developed model PermVeg. The crop sequences designed were tested in a field experiment from May 2007 to May 2009. The production systems tested were five systems designed according to the scenarios of (i) high profitability, (ii) low labor requirement, (iii) low costs of pesticide use, (iv) high level of crop biodiversity, and (v) low perishable products, respectively. The five systems were compared with the traditional vegetable production system. At local prices, only the high profitability and low labor requirement systems yielded significantly higher profits than the traditional system. At city wholesale market prices, profits of all permanent vegetable production systems were significantly higher than that of the traditional system, except for the low perishability system. Permanent vegetable production systems required more labor than the traditional system. Labor-day incomes of permanent vegetable production systems generally were not higher than those of the traditional system. The labor-day income increased only with the low labor requirement system at city wholesale market prices. The model outcomes correlated reasonably well with the labor requirement and the length in days of production systems in the field. The model poorly predicted profits and costs of pesticide use. We concluded that permanent vegetable production systems can yield higher profits than the traditional system, and can contribute to enhancing employment opportunities and increasing household income.

1. Introduction

Field vegetable production in South East Asia plays a major role in food supply, quality of the diet, income improvement, and trade development [1]. Vegetables provide essential micro-nutrients and fiber for a balanced diet. As income and educational levels have increased, consumers have become more aware of the role of vegetables in a healthy diet. Daily supply of vegetables per capita in many South East Asian countries has increased over the last 20 years: e.g., in Vietnam, from 110 g per person per day in 1990–1993 to 300 g per person per day in 2010–2013 and in Thailand from 90 g per person per day in 1990–1993 to 130 g per person per day in 2010–2013 [2]. In Vietnam, Laos, and Cambodia vegetable production yields a higher income for farmers than cereal production [3]. Besides increasing income for farmers, vegetable production in South East Asia stimulates trade as well. Thailand exported vegetable products worth 200 million US dollars per year during 2000–2005 to 300 million US dollars per year during 2011–2016 [2].
In the Red River Delta (RRD), Vietnam, vegetables are mainly grown in a rotation with two consecutive flooded rice crops per year [4]. This vegetable production system in the RRD has disadvantages, e.g., seasonality of production and prices [5,6], poor soil conditions for vegetables, and high labor requirement for land preparation [7]. There also are year-round vegetable production systems in the RRD. In these systems, crops of the same plant family, e.g., Cruciferae, may be grown continuously [8,9], potentially increasing the incidence of family-specific pests and diseases.
The disadvantages of the present vegetable production systems called for the development of innovative permanent vegetable production systems for the RRD [10]. Innovative production systems can be designed by using models. The ROTAT model [11], for example, has been used to design seasonal crop rotations. However, this model was not suitable to design crop sequences in the Red River Delta, where crop durations and crop intervals had to be calculated in days. In the current paper, the model PermVeg, specifically developed for the purpose of this work [10], was used.
A two-year long field experiment was carried out to test the performance of newly designed permanent vegetable production systems in comparison with the traditional vegetable and flooded rice system, and to compare the data used in the modeling and the results of the model calculations with those from the field experiment.

2. Materials and Methods

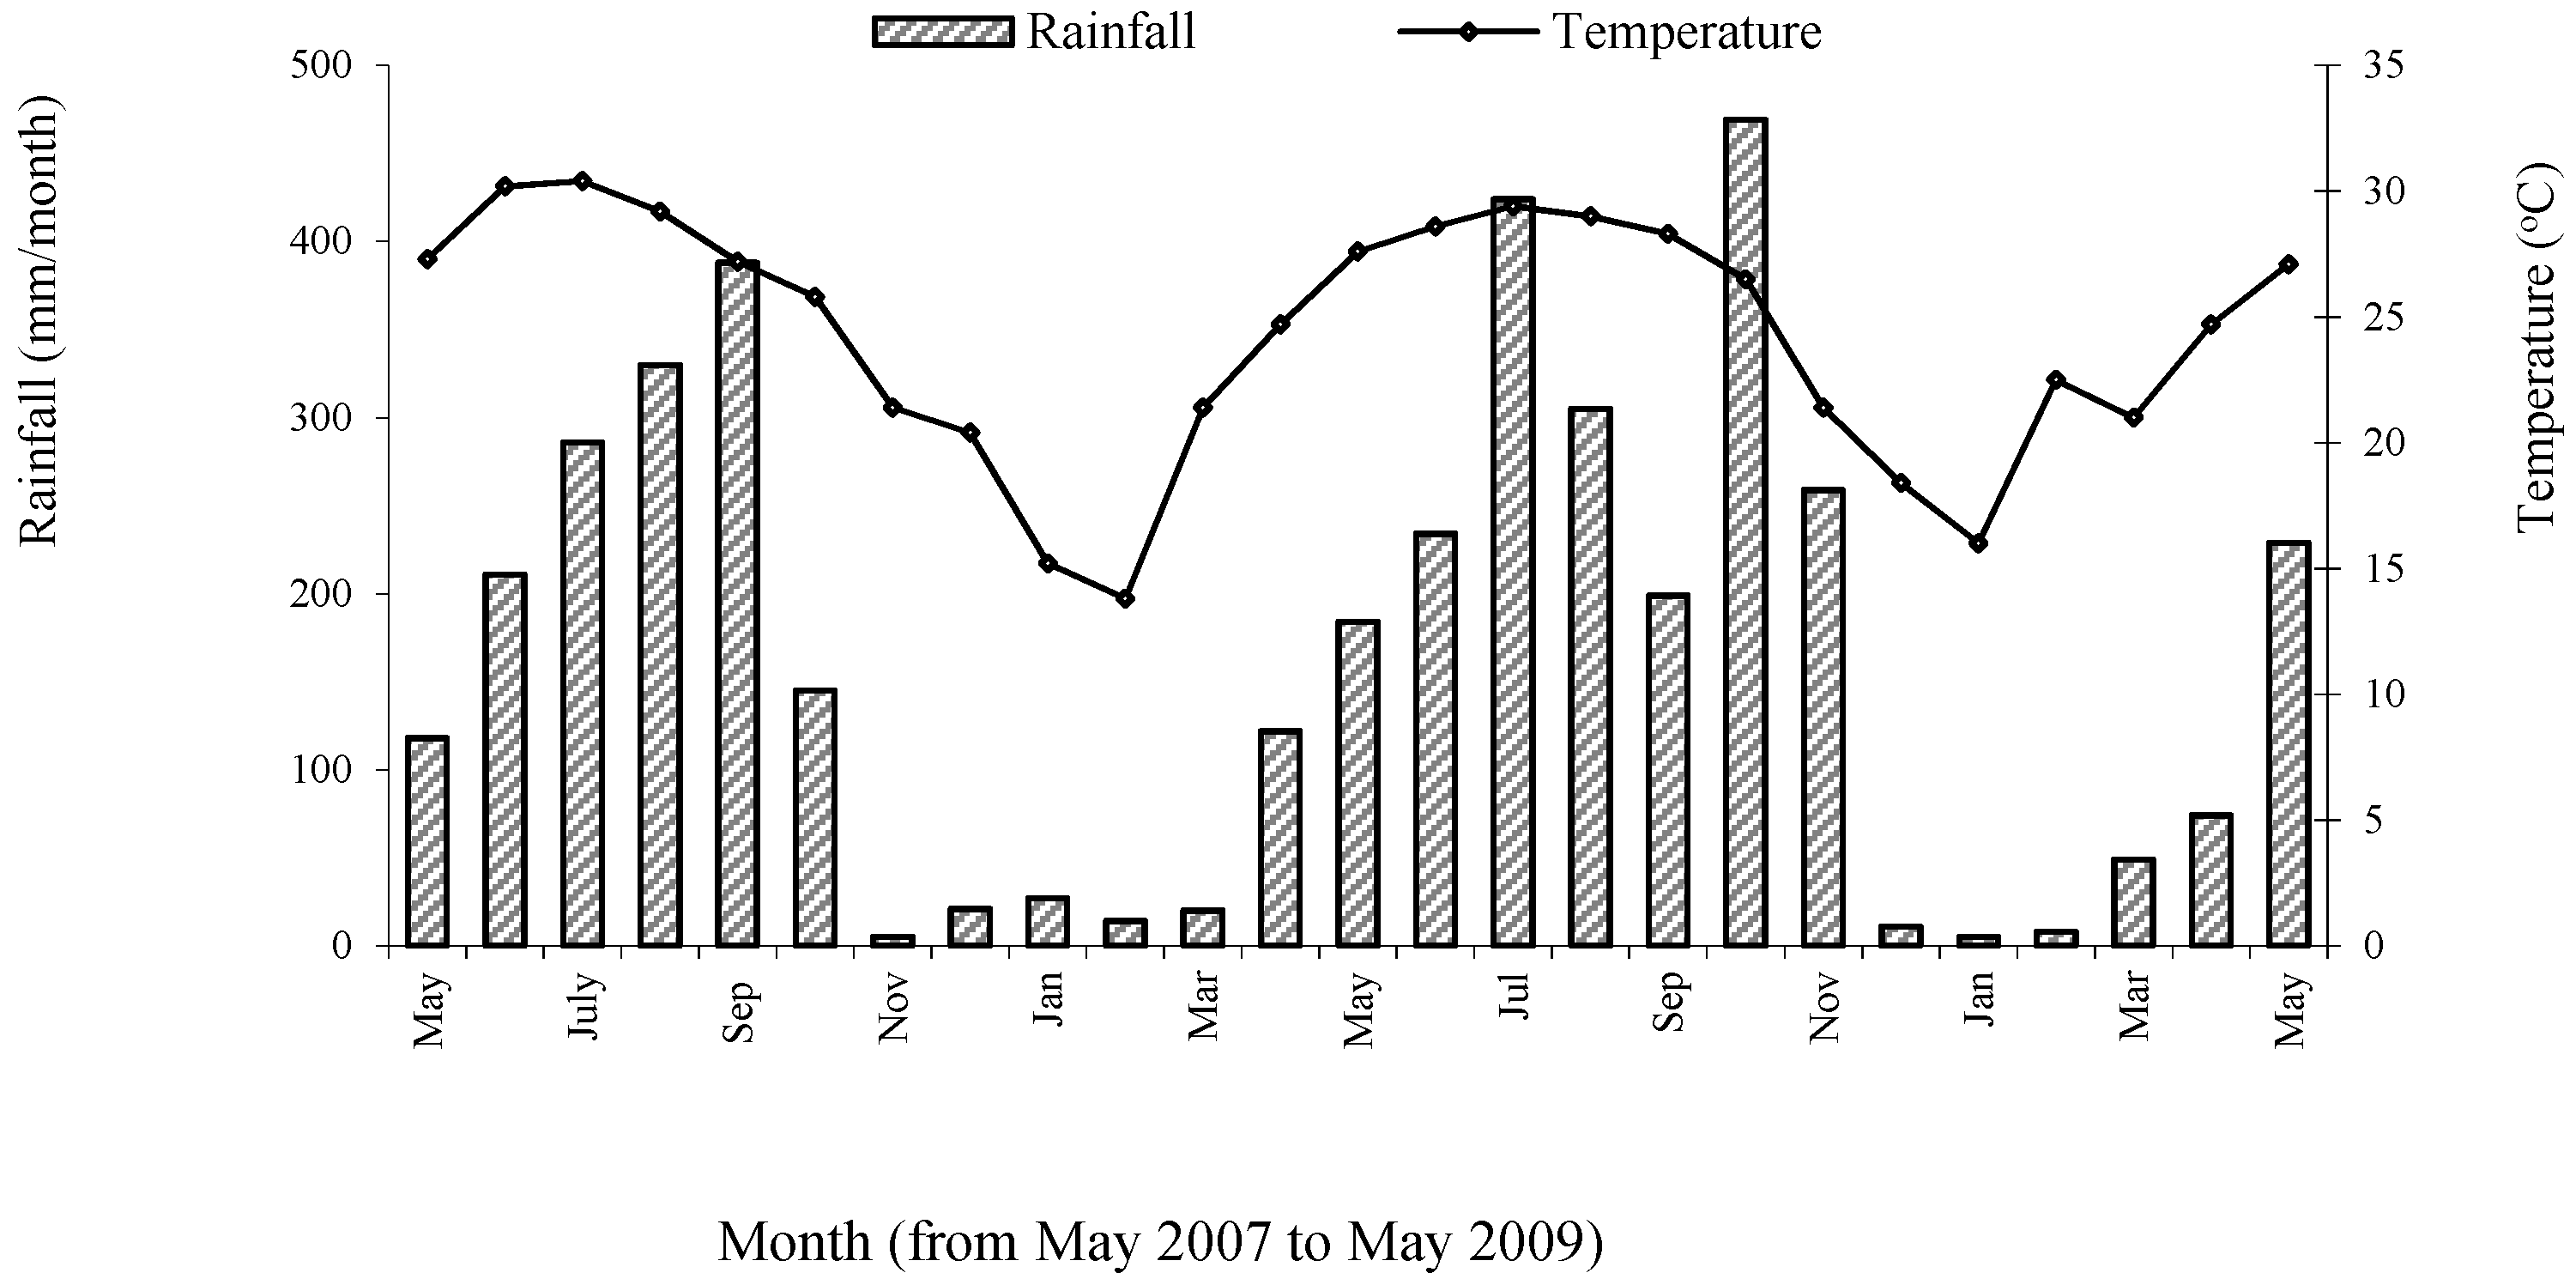
2.1. Location, Climate, and Soil of the Experimental Site

The field experiment for testing the performance of the designed permanent vegetable production systems was carried out from May 2007 to May 2009 at Son Du village, Nguyen Khe commune, Dong Anh district, Hanoi Province (21° 10′ N, 105° 49′ E), about 17 km northeast of Hanoi, in the Red River Delta in the north of Vietnam. The field rented from local farmers had a history of vegetable cultivation in rotation with two consecutive flooded rice crops a year since at least 1989 (as based on local people’s memory).
The climate at the experimental site is a tropical monsoon climate, with a hot and wet season from May to September, a cool and dry season from October to January, and a cool and humid season from February to April [4]. The weather conditions during the experiment are presented in Figure 1. January and February 2008 were very cold. Exceptionally high rainfall in the period October 30 to November 5 2008 caused temporary flooding of the experimental field.
The soil at the experimental site is a sandy loam with a pH of 6.1 and low organic carbon content (Table 1).

2.2. PermVeg Model and Crop Sequences

The PermVeg model was developed to generate the crop sequences for new permanent vegetable production systems for the RRD, as based on the data of profit, labor requirement and costs of pesticide use of 42 different vegetable crops commercially produced in the RRD [12].
Crop sequences for permanent vegetable production systems were designed based on the pre-requisites and restrictions imposed by five scenarios: (i) high profitability, (ii) low labor requirement, (iii) low costs of pesticide use, (iv) high level of crop biodiversity, and (v) low perishable products, respectively [10]. Taking into account the pre-requisites and restrictions of a certain scenario, the PermVeg model selects crops for a crop sequence according to the required crop planting time, as mostly related to the seasonal variation in temperature, and crop growth duration, with a 5-day interval between crops. PermVeg generates crop sequences and calculates the length of the total crop sequence in days. The profit, labor requirement, and costs of pesticide use of each crop sequence are calculated per hectare per day [10].
Crop sequences for the vegetable production systems, covering a period of approximately two years starting on May 1, were generated with the PermVeg model [10]. Crops in the vegetable production systems tested in the field experiment are presented in Table 2.
The permanent vegetable production systems tested, as based on the five scenarios, were (Table 3):
Profitability: the crop sequence with the highest profitability per hectare per day was selected;
Labor: the crop sequence with the lowest labor requirement per hectare per day was selected;
Pesticide: the crop sequence with the lowest cost of pesticide use per hectare per day was selected;
Biodiversity: crops of one botanical family were permitted to be grown only once in the crop sequence; the crop sequence with the highest profitability per hectare per day was selected;
Perishability: only crops with products of low perishability (storability at least four days between harvest and selling) were selected; the crop sequence with the highest profitability per hectare per day was selected.
The traditional vegetable flooded rice system acted as reference:
Traditional: the crop sequence (including two consecutive crops of flooded rice per year in the hot season) with the highest profitability per hectare per day was selected.
The sequences in Table 3 were based on a preliminary database. Upon later refinement of the data base, the model results of these crop sequences for length of crop sequence, profit, labor requirement, and costs of pesticide use were recalculated using the final database [12] (Table 4).

2.3. Experimental Design and Crop Production

The experiment was set up in a randomized complete block design with six treatments and four replications. The six treatments were the consecutive cultivation of the crops of the permanent vegetable production systems: Profitability, Labor, Pesticide, Biodiversity, and Perishability, and of those of the Traditional system (Table 3).
There were 24 plots. Each plot measured 10.50 m by 11.95 m, consisting of eight raised beds of 10.0 m long, 1.1 m wide and 0.2 m high, with 0.4 m wide furrows between beds. Data were calculated using a net plot size of 8.0 m by 9.0 m, comprising six beds and furrows.
At the establishment of the experimental field, the whole field was ploughed using buffalo traction. In the first three months of the experiment, before sowing or planting crops, the beds in the permanent vegetable production systems were ploughed using buffalo traction, followed by soil tillage with a hand held hoe. After that period, soil tillage for crop sowing or planting was done by hand only, using a hoe.
In the Traditional system, the rice fields were ploughed and puddled before rice planting using buffalo traction. After harvest of the rice, the fields were ploughed using buffalo traction, followed by construction of the raised beds and tillage for vegetable sowing or planting by hand, using a hoe. For vegetables grown after vegetables in this system, soil tillage for sowing or planting was similar to that in the permanent vegetable production systems.
Fertilizers and manure were applied according to the recommendations by the Soils and Fertilizer Institute, the Vegetable and Fruit Research Institute, and the Field Crops Research Institute of Vietnam. For crops without fertilizer recommendations by these institutes, fertilizers and manure were applied according to common local farmers’ practice. Manure, phosphate, and NPK compound fertilizers were applied before planting. Nitrogen and potassium were applied also during the growing period. The latter was based on the crop stand. In most crops, rice husk was applied as mulch. The quantities of each kind of fertilizer applied were as described by Everaarts et al. [13]. Pests and diseases were identified and treated using pesticides available at the location. Pests were controlled when they appeared, using chemical pesticides. Diseases were controlled both by preventive and curative chemical measures. Weeds, however, were controlled manually.
Crop products were graded according to local standards.

2.4. Data Measurement and Analysis

The performance of the crops was evaluated using the variables profit, potential profit, labor requirement, labor-day income, potential labor-day income, costs of pesticide use, and amount of active ingredient of insecticides and fungicides used per hectare per day. Profit of each crop was calculated from gross return and production costs in thousand Vietnamese Dong (kVND) per hectare (ha) per growing day (Gday) in the field (kVND/ha/Gday). Gross return was calculated from the yield and the local price of the product as sold to middle men or at the local market. Production costs included the costs of seeds or seedlings, fertilizers, pesticides, other materials such as mulching materials, frames, plastic for shelters, costs of soil tillage (if applicable), and costs of rice threshing.
The potential profit is defined as the profit a farmer can achieve by selling his products directly at the Hanoi Long Bien wholesale market, about 30 km from the experimental site. The product prices at the wholesale market are generally considerably higher than those at the local market or the prices paid by middle men. As product prices were not always available at the Long Bien market, the available data of Long Bien market prices (after subtraction of 300 VND/kg of product for costs of transport), y, and local prices, x, were used to establish a prediction equation of Long Bien market prices: y = 1.31x + 1771 (n = 28; % variance accounted for = 64, p < 0.05). By using the equation default product prices were obtained for the Long Bien market.
Rice is only sold in cities after processing and no correction was made for potential profit.
Labor requirement was calculated from labor recorded for all activities of crop management and expressed in days per hectare per growing day in the field (day/ha/Gday). From May to September 2007, the labor was recorded based on labor spent on individual crops in the four replications together. From October 2007 to May 2009, the labor was recorded based on individual plots. Soil tillage by buffalo traction and rice threshing were not included in the labor requirement, because, in practice, farmers contracted those services, and did not perform those practices using their own family labor.
Farmers’ income per day of labor is based on 8 h labor per day (Lday) (kVND/Lday).
Variables for evaluation of pesticide use of each crop were the costs of pesticides use (kVND/ha/Gday) and active ingredient (ai) used in gram (g) per ha per growing day in the field (g/ha/Gday).
The results for vegetable production systems were calculated as averaged over the period from the day of planting of the first crop to the last day of harvesting of the last crop. The second spinach crops in the Pesticide and Biodiversity systems and the second watermelon crop in the Perishability system failed due to flooding of the experimental field. The data of these crops were excluded from the calculations because of the exceptionality of floods in this region.
Statistical analysis of differences between systems was performed by analysis of variance using Genstat 12 [14]. As all four plots of one treatment received the same amount of pesticides, statistical analysis of differences in pesticide use among systems was not possible.
Correlation between model values (Table 4), crop data [12], and field experiment values were established by linear regression through the origin of model values or crop data on values of the field experiment. r2 was calculated as the corrected sum of squares of the dependent variable (SSy) minus the sum of squares of residuals (SSe) over the corrected sum of squares of the dependent variable (SSy): r2 = (SSySSe)/SSy.

3. Results

3.1. Crop Performance

The cold period in 2008 caused a delay in planting and the temporary flooding in the same year caused some crops to fail. Subsequent crop choice had to take account of the season and the time left to the next scheduled crop. Therefore, some crops grown in the field differed from the crops in the designed systems. Actual crops and crop planting dates in the vegetable production systems in the field experiment are presented in Table 5 and Table 6.
Following the outcome of the modeling based on the preliminary database, in the Biodiversity system tossa jute was sown in June, although the preferred sowing period in practice actually is February–March. Because of the end of the preferred consumption season, the final harvest of the tossa jute was in September, leaving a growth duration in the field of only 95 days instead of the 167 days as designed originally. The following crops: garland chrysanthemum, tomato, Welsh onion, amaranth, and watermelon were then planted earlier than scheduled.
In general, there was considerable variation in profit, labor requirement, costs of pesticide use, and amounts of insecticides and fungicides used among different crops in the six systems as well as among crops of the same species. Variations were, amongst other reasons, caused by weather conditions, such as low temperatures, influencing crop growth, labor required for weed control, the occurrence of pests and diseases, occasional crop failure, and prices received for the products.
As many crops were grown only once or twice in the experiment, no analysis of factors determining profits for individual crops could be made. For crops that were grown five to eight times, regression analysis of profit on yield, local price, production costs or costs of pesticides, showed that the profitability of individual crops was dependent on different factors. For spinach, no significant relations were found. For Chinese kale, profitability was significantly positively related to yield level (p < 0.05). Profit of Welsh onion was significantly related to local price (p < 0.01). Profit of tomato was positively influenced by local price (p < 0.05) and negatively influenced by costs of pesticide use (p < 0.01).

3.2. Comparison of the Six Systems

Profits significantly varied among the six systems (Table 7). The Profitability system had the highest profit. At local prices only the Profitability and Labor systems had higher profits than the Traditional system. The profit of the Perishability system was considerably lower than that of the Traditional system, mainly caused by crop failure (leek) and crop loss because of flooding (watermelon). At potential prices, however, all systems except the Perishability system yielded a higher profit than the Traditional system.
As compared with the Traditional system, the total labor requirement increased with all permanent vegetable production systems. Labor-day income with local product prices, however, did only slightly increase in the case of the Labor system and decreased significantly with the Biodiversity and Perishability systems. Potential labor-day income increased considerably with the Labor system and for the other systems was equal to the Traditional system.
The costs of pesticide use of each permanent vegetable production system were higher than those of the Traditional system (Table 8), which was due to the nature of the crops grown. In general, vegetable crops are more susceptible to pests and diseases than rice. The costs of pesticide use of the Labor and Perishability systems were the highest since the highest amounts of insecticides and fungicides were applied.

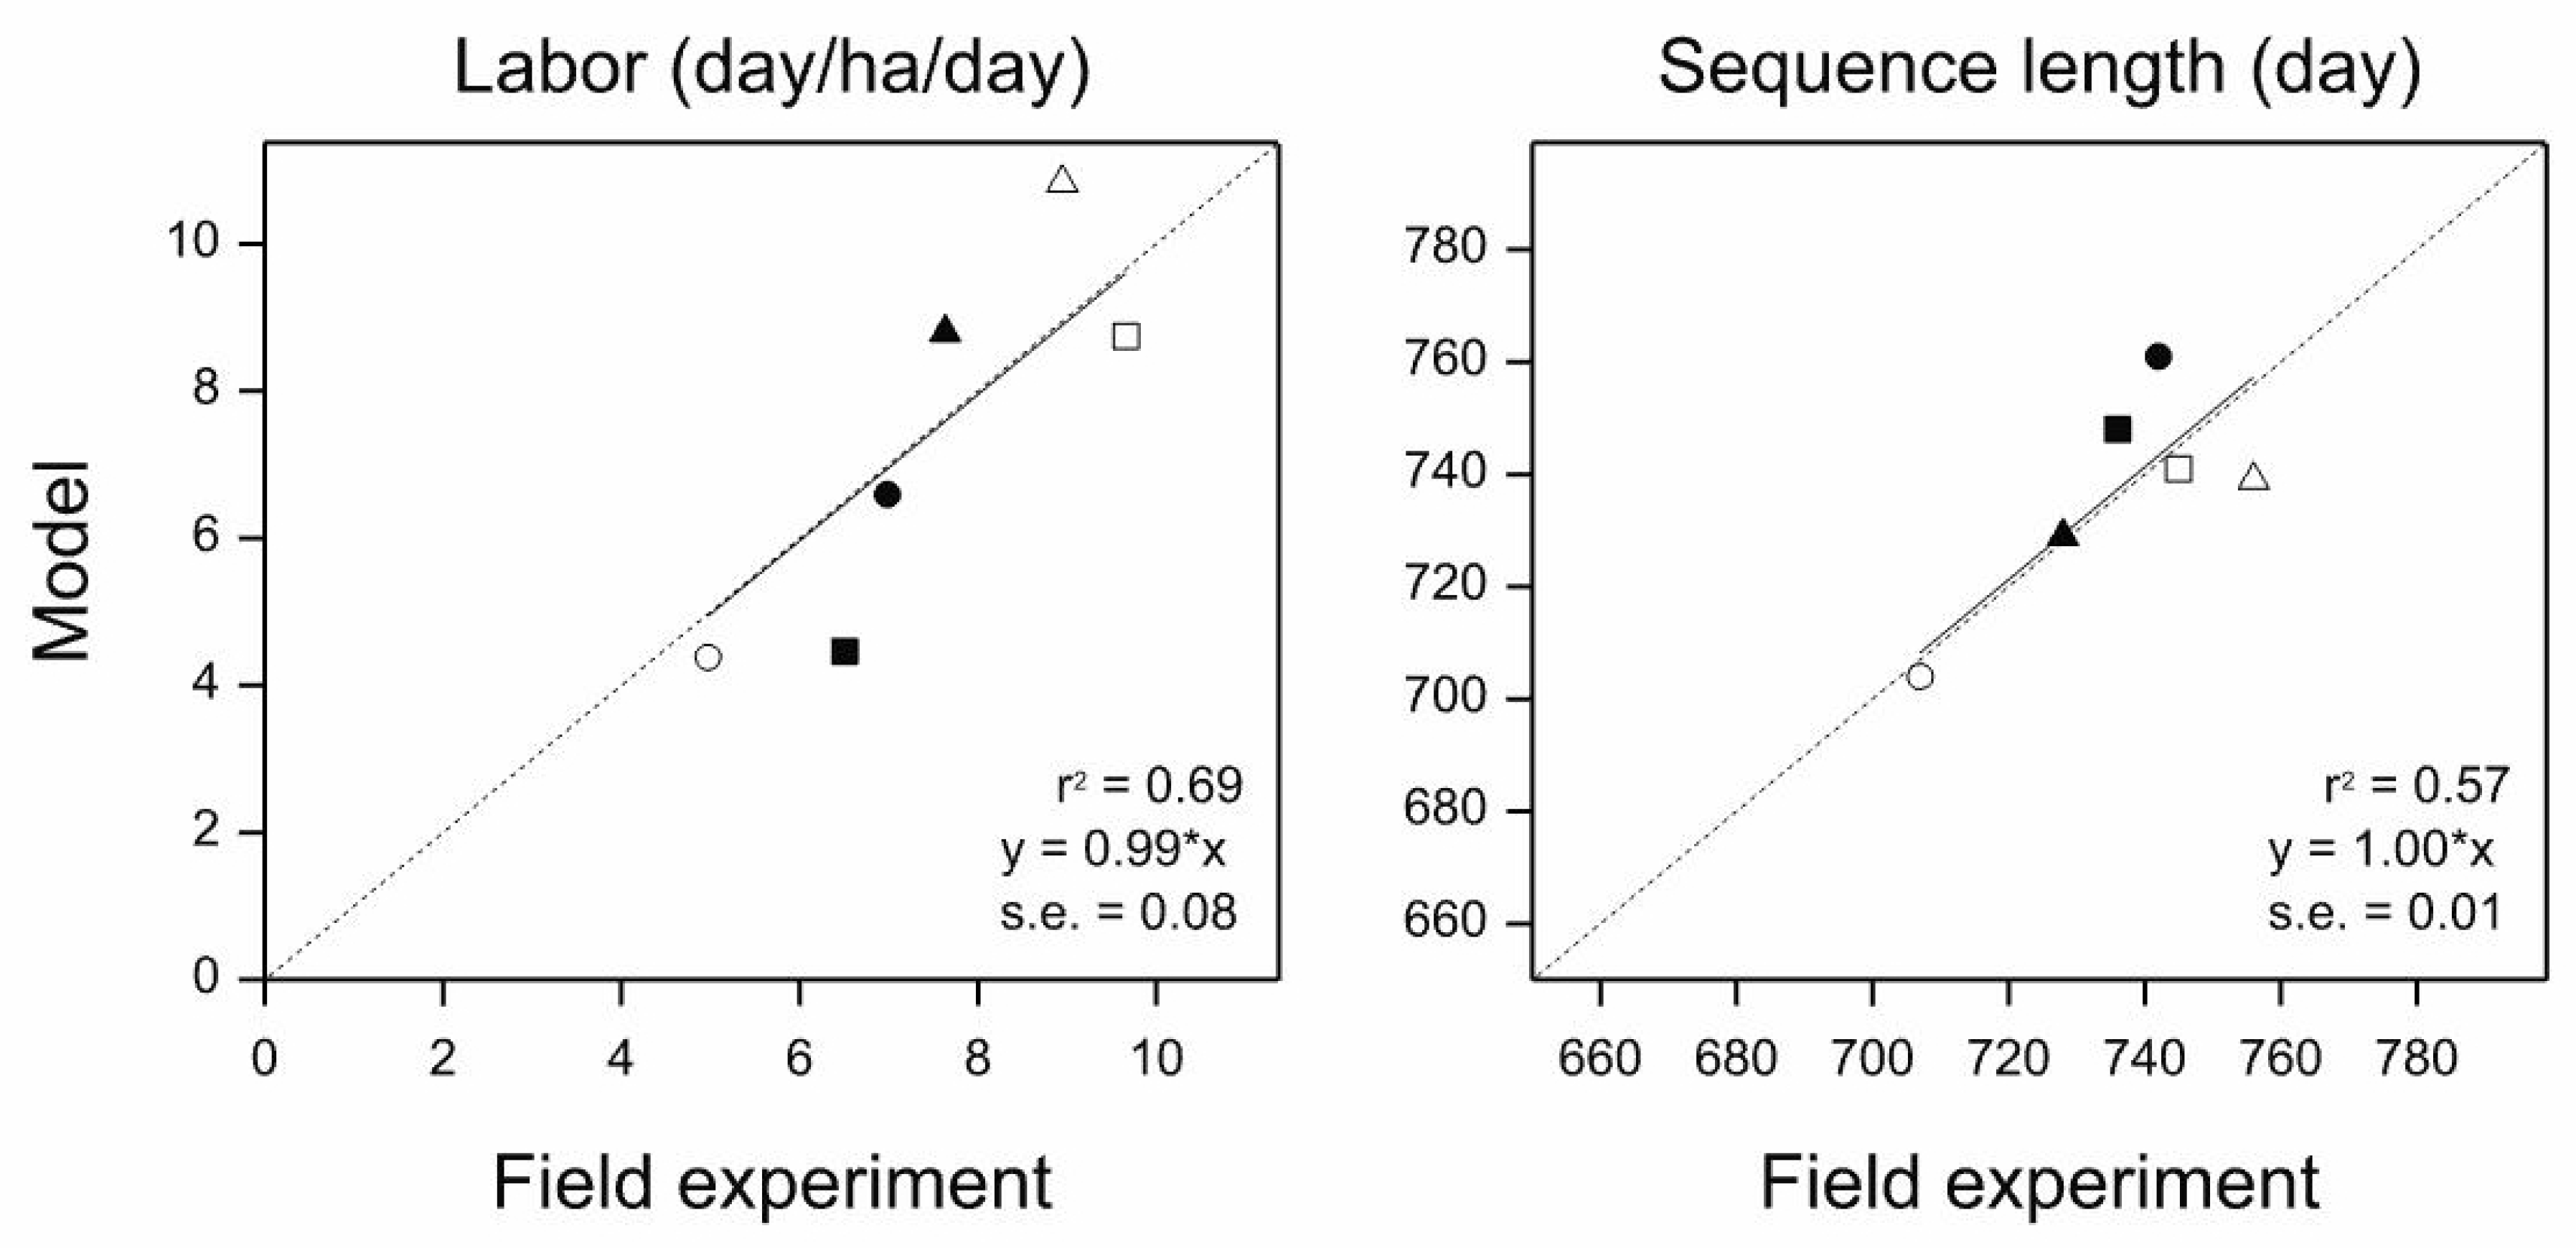
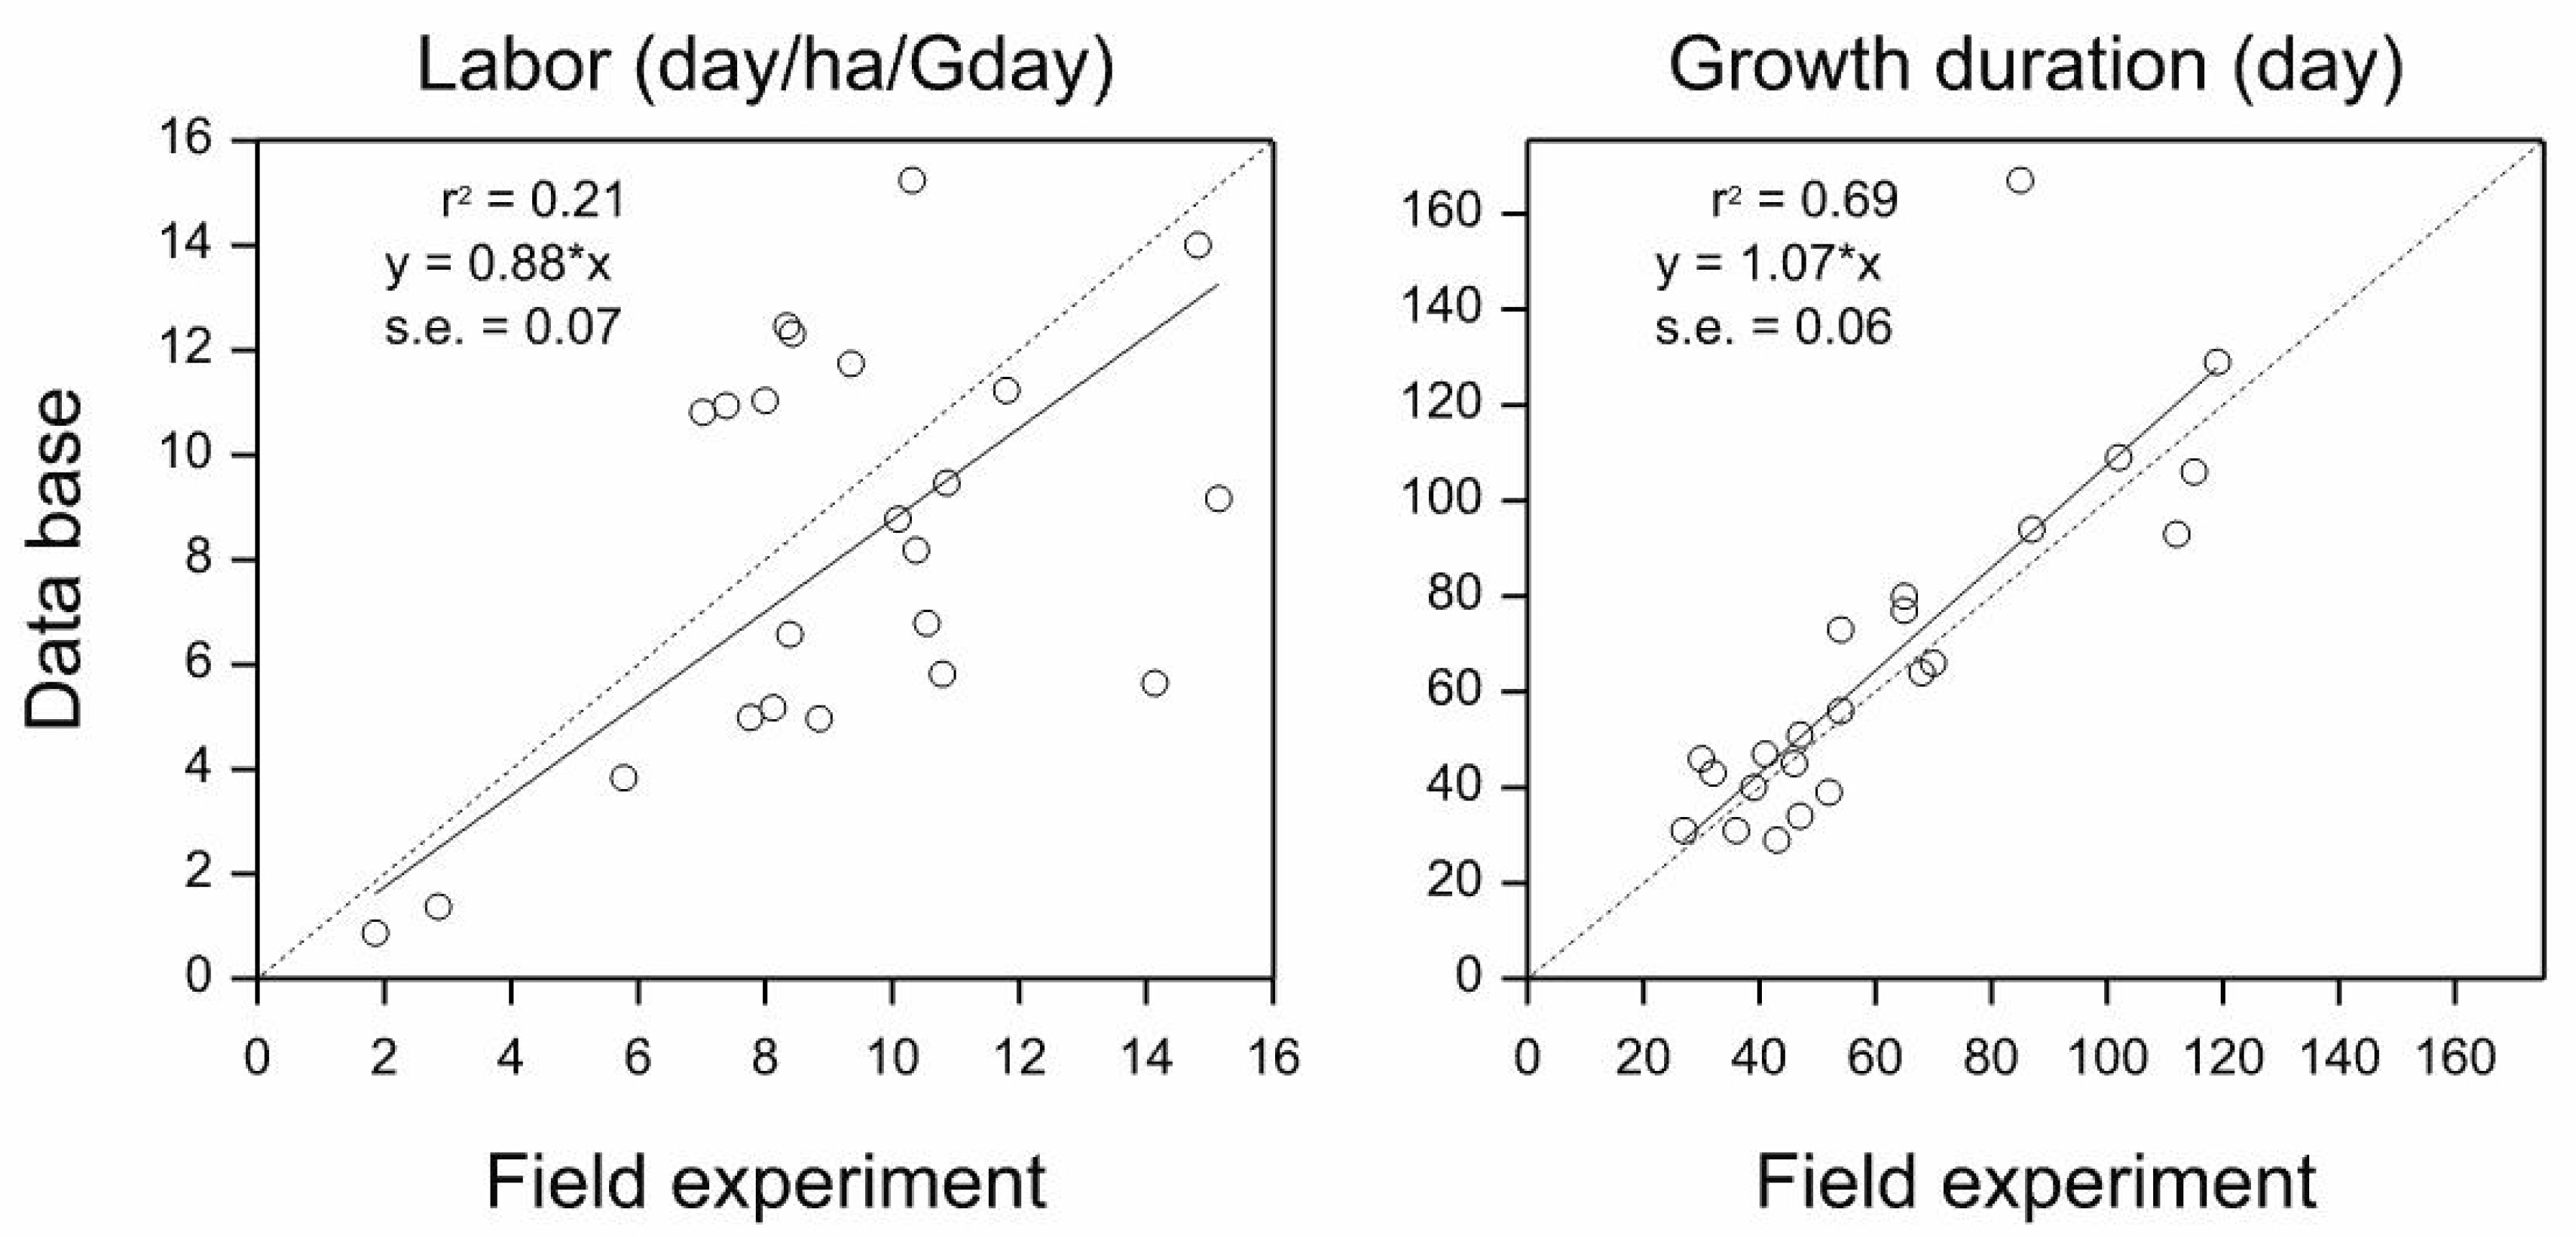
3.3. Performance of the PermVeg Model

There was reasonable agreement between the model data for crop systems labor requirements and the data obtained in the field experiment (Figure 2). The same applied to the length of the crop sequences. The model data on profit and cost of pesticide use of crop systems correlated poorly with those from the field experiment (r2 could not be calculated because SSy < SSe and r2 = 0.20, respectively).
Correlation between data on crop labor requirement from the database and from the field experiment was not particularly strong, but data on crop growth duration correlated quite well, except for one outlier (Figure 3). The outlier concerned tossa jute, for reasons explained above.

4. Discussion

4.1. The Six Systems

4.1.1. Profitability

The objective of reaching a high profitability in vegetable production was indeed achieved in the permanent vegetable production system Profitability. The profit of the Profitability system at local prices was 1.9 times higher than that of the Traditional system. This result is consistent with results in China [15], where it was found that the profit of a permanent vegetable production system was 1.8 times higher than that of a vegetable–rice system. When products would be directly sold at city wholesale market prices, the profitability would be even higher.

4.1.2. Labor

In line with the model predictions the Labor system had the lowest labor requirement of the permanent vegetable production systems tested and it was slightly higher than in the Traditional system. Since high profits were obtained in the Labor system, the labor-day income was the highest of all systems studied, including the Traditional system. The Labor system is thus an attractive option for vegetable production when labor is scarce.

4.1.3. Pesticide

Among the permanent vegetable production systems, the costs of pesticide use in the Pesticide system were not conclusively low. Although a crop sequence with the lowest cost of pesticide use was selected from the database, it is the actual need for control of pests and diseases and the price of the pesticides used, that determine the costs of pesticide use. In this case, especially the comparatively high use of fungicides contributed to the costs of pesticide use. Apparently, it is difficult to select for low costs of pesticide use based on historical records.

4.1.4. Biodiversity

The aim of the Biodiversity system was to increase crop biodiversity by allowing only one crop of a botanical family in the two-year sequence, with the underlying aim to prevent build-up of pest and disease incidence in subsequent crops. Amongst others due to crop failures, the system did not perform well in terms of profitability, although potential profitability was higher. No clear effect was found of the Biodiversity system on insecticide or fungicide use. To clearly identify and confirm an effect, long term testing of this system may be required.

4.1.5. Perishability

When evaluated in terms of profitability the Perishability system scored negatively, or neutral, in comparison with the Traditional system. The costs of pesticide use were high with this system. Based on the present results, it is difficult to recommend the Perishability system for crop production in rural areas.

4.1.6. Traditional

The Traditional system acted as reference for the permanent vegetable production systems. Its profitability can likely be considerably increased by direct marketing at a city wholesale market.

4.2. The PermVeg Model

The PermVeg model data correlated reasonably well with the field experiment data for labor requirement and sequence length of the crop systems. Especially crop growth durations as measured in the field experiment correlated well with the data of the PermVeg data base. This confirms that the model is a useful tool to design crop sequences.
The data of the PermVeg model for profit did not relate well to those of the field experiment. Profit is especially subject to product price variability, both within and between years, influencing profitability. It appeared that for individual crops yield level, product price, costs of pesticide use, or a combination of these factors, may have a significant effect on profitability, illustrating the variability in vegetable production and marketing performance. In addition, the model aims at a maximum presence of crops in the field, assuming only five-day intervals between crops. The model assumes also that all crops will be productive. In the field experiment, the profitability was lower because intervals between crops often exceeded five days and some crops failed completely.
The model also did not correlate well for costs of pesticide use. Types and prices of pesticides in the database, as provided by RRD farmers, may have differed from those used in the field experiment. There are many different types of pesticides, with varying prices, used in the RRD. About 150 new types of pesticides were registered each year during the period of 2001–2007 [16]. However, during Feb 2018–Feb 2019, 16 new types of pesticides were registered, and 380 types of pesticides (belonging to two active ingredients) were banned [17].
PermVeg, however, is a simple model which can easily be applied. Researchers and extension officers can understand and operate the model to generate all options of crop sequences for a defined scenario, using farmer supplied default values for unknown variables. Researchers or extension officers can thereby support local farmers in the decision-making process of choosing the most suitable crop sequence of a permanent vegetable system for a given location. A user-friendly version of the PermVeg model is now freely available for downloading at [18].

4.3. Labor

All permanent vegetable production systems required more labor than the Traditional system. This finding is in line with what was found in China [15], where permanent vegetable production required 1.47 times more labor than a vegetable–rice rotation system. As such, permanent vegetable production systems increase employment opportunities in rural and peri-urban areas.
Although labor requirement in permanent vegetable production systems was higher, labor-day income did not necessarily increase and in case of low profitability, it even decreased. Nevertheless, potential labor-day income of all permanent vegetable production systems was at least equal to that of the Traditional system. With equal labor-day incomes among systems, all extra labor, when supplied from the household itself, helps to increase household income. In case labor has to be hired, household income will only increase when day wages paid are lower than the labor-day income derived from permanent vegetable production systems. In the present research, only the Labor system increased potential labor-day income, confirming the defined low labor requirement scenario of this system.

4.4. Pesticide Use

Permanent vegetable production systems had higher costs of pesticide use than the Traditional system. This result is again consistent with results found in China [15], where the costs of pesticide use of a permanent vegetable production system were 2.5 times higher than those of a vegetable–rice rotation system. Vegetable crops require more pesticides than rice [19]. For the Red River Delta, it was found [20] that costs of pesticide use of vegetable crops in the cool season (about 4 months), were 8–10 times higher than those for rice in the remaining time of the year. In addition, in the tropics, crops can be grown year-round and pests and diseases can flourish year-round as well [21].
Since vegetables are necessary for a healthy and balanced diet, since vegetable production improves farmers’ income [22] and since there is an increasing demand for vegetables by the growing populations of the big cities, year-round vegetable production is likely to become essential for the RRD. More research should therefore be initiated with the aim to reduce undesirable effects of pesticide use on the environment and human health.
The use of pesticides in vegetable production is in decline in many parts of the world, but not in Vietnam [23]. Moreover, farmers in Vietnam often demonstrate inadequate knowledge on how and when to apply pesticides [24]. At the same time, the state governance of pesticide use and trade in Vietnam is weak, resulting in illegal imports and use of dangerous pesticides [25]. These factors together increase the risk of injudicious and incorrect use for the environment and human health.
Practical methods to reduce pesticide use are using disease-resistant vegetable varieties and rotating host species with species that are not hosts to common diseases, using film-coated seeds for seedling insect control, using biological pesticides [26], good water management to reduce soil-borne disease incidence, and balanced nutrition for vegetable crops.
In a humid tropical environment, the use of plastic shelters [27,28] can be an option to reduce crop disease infection, especially in the heavy rainfall season.

4.5. Risks in Crop Production

At local prices, profits of some permanent vegetable production systems did not significantly differ from that of the Traditional system or were even lower than that of the Traditional system. This was mainly because in these systems, crops failed due to adverse weather conditions or diseases, i.e., production risks. Sometimes low prices, a marketing risk, played a role.
Due to the sensitive nature of the vegetable crops, both physically and in terms of pest and disease susceptibility, production risks in vegetable cultivation have frequently been emphasized [3,29]. The risks with production in the field may be higher during the off-season than during the main production season, whereas marketing risks, i.e., low prices, often occur during the peak supply season [3,6].
Initial observations in the RRD indicated that soil structure after flooded rice was not favorable for vegetable production [7]. Observations on the soil of the six vegetable production systems indicated that bulk density at 0.05–0.10 m and soil acidity decreased with permanent vegetable production, as well as with vegetable production in rotation with flooded rice [13]. Apparently, soil conditions after flooded rice can be improved in a rather short time under intensive vegetable production.

4.6. Marketing

A considerable difference was found between profit with selling locally and potential profit with selling at a city wholesale market. The method of selling the product, therefore, plays an important role for the income of vegetable growers. However, the small landholdings of farmers [4], resulting in small product volumes, represent a problem in marketing their products. One option to improve the marketing of vegetable products for small farmers, is for farmers to work together in cooperatives to improve the efficiency of marketing [4,30]. In addition, marketing through direct contracts between growers and traders [28], instead of relying on contacts with local middle men, can help growers to better plan production and harvest, in order to secure higher and more stable prices. Another option is that a company rents a large area of land from small land farmers to produce vegetables and distributes the products in its own shops. This is, for example, done by the VinGroup [31]. It produces vegetables in Ecofarms and distributes products through their VinMart systems throughout the country.

4.7. Final Comments

The situation in the Red River Delta today with regard to vegetable production is much the same as compared to 10 years ago. The main reason for lack of change is the small landholdings per household, making it difficult to change production methods [4]. Our work, although conducted 10 years ago, is as relevant today as it was at the time of conducting the research. The same applies to our recommendations to improve the situation [4,12].

5. Conclusions

The model scenarios of high profitability and low labor requirement were confirmed by the results of the field experiment. Both systems of permanent vegetable production can improve farmers’ income in the RRD, generate employment for rural and peri-urban areas and contribute to year-round regional supply of vegetables for the growing urban population of the RRD. However, family household income will mostly only improve if the additional labor required can be supplied by the family household itself or can be hired at day wages lower than the labor-day income derived from permanent vegetable production. Realizing a higher product price by developing new marketing systems is important to increase the profitability of vegetable production. An option to reduce labor costs of the permanent vegetable production systems could be to combine the land into large farms, in order to be able mechanize land preparation, sowing, transplanting, weeding, and (partly) harvesting.
Pesticide use increases with permanent vegetable production systems. Research on effective pest and disease control is required to reduce pesticide use and to decrease the risk of pesticide residues for farmers, the environment, and consumers.
The PermVeg model can be used to design crop sequences and estimate labor requirements for permanent vegetable production systems. While using default values for profit and costs of pesticide use, the model can be used to explore potentially profitable crop sequences.

Author Contributions

Conceptualization, A.E.; Data curation, A.E.; Formal analysis, P.H.; Funding acquisition, A.E.; Investigation, P.H.; Methodology, A.E.; Project administration, A.E.; Resources, P.H.; Software, P.H. and A.E.; Supervision, A.E., J.N., and P.S.; Validation, A.E., J.N., and P.S.; Visualization, A.E., J.N., and P.S.; Writing—original draft, P.H.; Writing—review & editing, A.E., J.N., and P.S.

Funding

This research was funded by the Dutch Ministry of Economic Affairs as part of the strategic research program KB1 Global Food Security: Scarcity and Transition.

Acknowledgments

This research was carried out by Wageningen University and Research. We thank Fresh Studio Innovations Asia, Dalat, Vietnam, for providing vegetable prices of the Long Bien wholesale market in Hanoi. We thank Wim van den Berg at Applied Plant Research, Lelystad, the Netherlands, for statistical assistance and valuable comments on the manuscript.

Conflicts of Interest

The authors declare no conflict of interest. The funders had no role in the design of the study; in the collection, analyses, or interpretation of data; in the writing of the manuscript, or in the decision to publish the results.

References

  1. Johnson, G.I.; Weinberger, K.; Wu, M.-H. The vegetable sector in tropical Asia: Importance, issues and a way ahead. Acta Hort. 2009, 809, 15–34. [Google Scholar] [CrossRef]
  2. Food and Agriculture Organization of the United Nations. FAOSTAT. Available online: http://faostat.fao.org (accessed on 1 May 2019).
  3. Ali, M. Horticulture revolution for the poor: Nature, challenges and opportunities. Available online: https://www.researchgate.net/profile/Mubarik_Ali/publication/254965287_Horticultural_Revolution_for_the_Poor_Nature_Challenges_and_Opportunities/links/54295dc10cf26120b7b63bfe/Horticultural-Revolution-for-the-Poor-Nature-Challenges-and-Opportunities.pdf (accessed on 1 May 2019).
  4. Huong, P.T.T.; Everaarts, A.P.; Neeteson, J.J.; Struik, P.C. Vegetable production in the Red River Delta of Vietnam: I. Opportunities and constraints. NJAS-Wag. J. Life Sci. 2013, 67, 27–36. [Google Scholar] [CrossRef]
  5. Thuy, N.T.T.; Wu, M.-H.; Lai, T.V. Northern Vietnam. In The vegetable sector in Indochina countries. Farm and household perspectives on poverty alleviation; Ali, M., Ed.; AVRDC: Tainan, Taiwan, 2002; pp. 113–153. [Google Scholar]
  6. An, H.B.; Vagneron, I.; Thinh, L.N.; Moustier, P.; Dam, D.D.; Nam, N.V.; Hang, L.T.; Thoai, T.Q. Spatial and institutional organization of vegetable markets in Hanoi; CIRAD, Montpellier and RIVAF: Hanoi, Vietnam, 2003. [Google Scholar]
  7. Everaarts, A.; Ha, N.T.T.; Hoi, P.V. Agronomy of a rice-based vegetable cultivation system in Vietnam: Constraints and recommendations for commercial market integration. Acta Hort. 2006, 699, 173–179. [Google Scholar] [CrossRef]
  8. Anh, D.T.; Huan, D.D.; Dat, N.S.; Chien, D.D.; Phong, L.V. Analysis of vegetable value chains in Hatay province. Available online: http://agro.gov.vn/images/2007/05/Vegetable_in_HaTay_(E).pdf (accessed on 1 May 2019).
  9. Anh, D.T.; Huan, D.D.; Dat, N.S.; Chien, D.D.; Phong, L.V. Analysis of vegetable value chains in Thai Binh province. Available online: http://www.sme-gtz.org.vn/Portals/0/AnPham/7-%20Analysis%20of%20safe%20vegetables%20value%20chain%20in%20Hai%20Phong-ENG.pdf (accessed on 1 May 2019).
  10. Huong, P.T.T.; Everaarts, A.P.; van den Berg, W.; Neeteson, J.J.; Struik, P.C. PermVeg: A model to design crop sequences for permanent vegetable production systems in Red River Delta, Vietnam. J. Agron. Crop Sci. 2014, 200, 302–316. [Google Scholar] [CrossRef]
  11. Dogliotti, S.; Rossing, W.A.H.; van Ittersum, M.K. ROTAT, a tool for systematically generating crop rotations. Eur. J. Agron. 2003, 19, 239–250. [Google Scholar] [CrossRef]
  12. Huong, P.T.T.; Everaarts, A.P.; Neeteson, J.J.; Struik, P.C. Vegetable production in the Red River Delta of Vietnam: II. Profitability, labor requirement and pesticide use. NJAS-Wag. J. Life Sci. 2013, 67, 37–46. [Google Scholar] [CrossRef]
  13. Everaarts, A.P.; Pham, T.T.H.; Neeteson, J.J.; Struik, P.C. Vegetable production after flooded rice improves soil properties in the Red River Delta, Vietnam. Pedosphere 2015, 25, 130–139. [Google Scholar] [CrossRef]
  14. Payne, R.W.; Harding, S.A.; Murray, D.A.; Soutar, D.M.; Baird, D.B.; Glaser, A.I.; Channing, I.C.; Welham, S.J.; Gilmour, A.R.; Thompson, R.; Webster, R. The guide to GenStat Release 12. Part 2: Statistics; VSN International: Hemel Hempstead, UK, 2009. [Google Scholar]
  15. Lu, H.; Bai, Y.; Ren, H.; Campbell, D.E. Integrated emergy, energy and economic evaluation of rice and vegetable production systems in alluvial paddy fields: Implications for agricultural policy in China. J. Environ. Manag. 2010, 91, 2727–2735. [Google Scholar] [CrossRef] [PubMed]
  16. Hoi, P.V.; Mol, A.P.J.; Oosterveer, P.J.M. Pesticide distribution and use in vegetable production in the Red River Delta of Vietnam. Renew. Agric. Food Syst. 2009, 24, 174–185. [Google Scholar] [Green Version]
  17. Plant Protection Department. Available online: http://www.ppd.gov.vn/index.php?language=vi&nv=laws&op=view-97-Thong-tu-so-032016TT-BNNPTNT (accessed on 1 May 2019).
  18. veg IMPACT NL, Wageningen University and Research. PermVeg model. Available online: www.vegimpact.com (accessed on 1 May 2019).
  19. Huang, J.; Qiao, F.; Zhang, L.; Rozzelle, S. Farm Pesticide, Rice Production and Human Health; Center for Chinese Agricultural Policy, Chinese Academy of Sciences: Beijing, China, 2003. [Google Scholar]
  20. Linh, N.V. Agricultural innovation: Multiple grounds for technology policies in the Red River Delta of Vietnam. Ph.D. Thesis, Wageningen University, Wageningen, The Netherlands, 2001. [Google Scholar]
  21. Ewel, J.J. Designing agricultural systems for the humid tropics. Ann. Rev. Ecol. Syst. 1986, 17, 245–271. [Google Scholar] [CrossRef]
  22. Dinham, B. Growing vegetables in developing countries for local urban populations and export markets: Problems confronting small-scale producers. Pest Manag. Sci. 2003, 59, 575–582. [Google Scholar] [CrossRef] [PubMed]
  23. Hoi, P.V.; Mol, A.P.J.; Oosterveer, P.; van den Brink, P.J.; Huong, P.T.M. Pesticide use in Vietnamese vegetable production: A 10-year study. Int. J. Agr. Sustain. 2016, 14, 325–338. [Google Scholar] [CrossRef]
  24. Nguyen, T.M.; Le, N.T.T.; Havukainen, J.; Hannaway, D.B. Pesticide use in vegetable production: A survey of Vietnamese farmers’ knowledge. Plant. Protect. Sci. 2018, 54, 203–214. [Google Scholar] [Green Version]
  25. Hoi, P.V.; Mol, A.; Oosterveer, P. State governance of pesticide use and trade in Vietnam. NJAS-Wag. J. Life Sci. 2013, 67, 19–26. [Google Scholar] [Green Version]
  26. Finch, S.; Collier, R.H. Integrated pest management in field vegetable crops in northern Europe—With focus on two key pests. Crop. Prot. 2000, 19, 817–824. [Google Scholar] [CrossRef]
  27. Arya, L.M.; Pulver, E.L.; Genuchten, M.T.V. Economic, environmental and natural resource benefits of plastic shelters in vegetable production in a humid tropical environment. J. Sustain. Agric. 2001, 17, 123–143. [Google Scholar] [CrossRef]
  28. Ha, T.T.T. Sustainability of peri-urban agriculture of Hanoi: The case of vegetable production. Ph.D. Thesis, Hanoi University of Agriculture, Hanoi, Vietnam, 2008. [Google Scholar]
  29. Francisco, S.R.; Ali, M. Resource allocation tradeoffs in Manila’s peri-urban vegetable production systems: An application of multiple objective programming. Agric. Syst. 2006, 87, 147–168. [Google Scholar] [CrossRef]
  30. Moustier, P.; Figuié, M.; Loc, N.T.T.; Son, H.T. The role of coordination in the safe and organic vegetable chains supplying Hanoi. Acta Hort. 2006, 699, 297–305. [Google Scholar] [CrossRef]
  31. VinGroup. Vincom Retail—Vingroup. Available online: http://vingroup.net/en-us/home.aspx (accessed on 1 May 2019).
Figure 1. Monthly total rainfall and mean monthly temperature from May, 2007 to May, 2009 in Hanoi (Lang Ha Meteo Station).
Sustainability 11 02719 g001
Figure 2. Regression through the origin of the model outcome data on the data of the field experiment at system level (Profitability (□), Labor (■), Pesticide (∆), Perishability (●), Biodiversity (▲) and Traditional (○)).
Sustainability 11 02719 g002
Figure 3. Regression through the origin of the data base data on labor requirement and crop growth duration on the data of the field experiment at crop level.
Sustainability 11 02719 g003
Table 1. Soil properties of the experimental site (0–20 cm of raised bed).
Texture (%)Sand49
Silt42
Clay9
pH-H2O6.1
Organic carbon (%)1.03
N total (%)0.11
P total (%)0.04
K total (%)0.17
P available (mg/100g soil)28.0
K available (mg/100g soil)6.79
CEC (meq/100g soil)9.15
Table 2. Crops in the vegetable production systems tested in the field experiment. Numbers between brackets indicate the first and last month (January is Month 1) of the suitable crop planting period [12].
No.Family SpeciesCommon Name (Suitable Planting Period, Month-Month)Sown (S)/Trans-Planted (T)Typical Growth Duration (Days)
1Amaranthaceae
Amaranthus tricolorAmaranth (1-12)S31
2Chenopodiaceae
Spinacia oleraceaSpinach (9-2)S29
3Compositae
Chrysanthemum coronariumGarland chrysanthemum (9-2)S40
4Cruciferae
Brassica juncea var. rugosa
Wrapped heart mustard (4-8)S51
5Brassica oleracea var. gongylodesKohlrabi (7-9)T56
6Brassica oleracea var. alboglabraChinese kale (4-10); (11-3)T47; 34
7Brassica rapa var. parachinensisGreen choy sum (4-8); (9-3)S34; 31
8Brassica rapa ssp. chinensisGreen pakchoi (8-2)T43
9Raphanus sativusRadish (3); (8-9)S46; 35
10Cucurbitaceae
Benincasa hispida
Wax gourd (2-3); (4-6); (10); (12-1)T95; 77; 93; 127
11Citrullus lanatusWatermelon (2-3); (8-9)T77; 64
12Leguminosae
Pisum sativum
Snow pea (11-12)S93
13Liliaceae
Allium ampeloprasum var. porrum
Leek (3-6); (8-2)T66; 61
14Allium cepa var. cepaOnion (9)T106
15Allium cepa var. ascalonicumShallot clove + leaves (9-1)T
(cloves)
73
16Allium fistulosumWelsh onion (1-12)T39
17Malvaceae
Corchorus olitorius
Tossa jute (2-3)S167
18Poaceae
Zea mays var. rugosa
Sweet corn (4-9)T80
19Oryza sativaRice (1-2); (6-7)T109; 94
20Solanaceae
Solanum lycopersicum
Tomato (8-2)T129
21Umbelliferae
Apium graveolens
Celery (9-4)T45
Table 3. Crop sequences of vegetable production systems generated by the PermVeg model.
Profitability: Welsh onion—Chinese kale—Amaranth—Watermelon—Chinese kale—Spinach—Tomato—Chinese kale—Welsh onion—Watermelon—Snow pea—Chinese kale—Amaranth
Labor: Sweet corn—Kohlrabi—Onion—Tomato—Wax gourd—Kohlrabi—Sweet corn—Tomato
Pesticide: Amaranth—Chinese kale—Welsh onion—Watermelon—Green pakchoi—Welsh onion—Spinach—Radish—Welsh onion—Tossa jute—Spinach—Welsh onion—Green choy sum—Amaranth
Biodiversity: Chinese kale—Tossa jute—Garland chrysanthemum—Tomato—Welsh onion—Amaranth—Watermelon—Spinach—Snow pea—Celery
Perishability: Wrapped heart mustard—Leek—Watermelon—Tomato—Celery—Leek—Kohlrabi—Watermelon—Tomato—Radish
Traditional: Rice—Chinese kale—Welsh onion—Spinach—Rice—Rice—Chinese kale—Welsh onion—Spinach—Rice
Table 4. Model results for the crop sequences of Table 3 as based on the data of Huong [13] (kVND = thousand Vietnamese Dong).
SystemLength
(Days)
Profit
(kVND/ha/day)
Labor Requirement
(day/ha/day)
Costs of Pesticide Use
(kVND/ha/day)
Profitability7415618.725
Labor7483334.518
Pesticide73943310.810
Biodiversity7294228.820
Perishability7614126.621
Traditional7042224.49
Table 5. Crops and crop planting dates (dd-mm-yy) in the field experiment for the production systems Profitability, Labor and Pesticide.
Vegetable Production System
ProfitabilityLaborPesticide
CropPlanting DateCropPlanting DateCropPlanting Date
Welsh onion01-05-07Sweet corn01-05-07Amaranth02-05-07
Chinese kale28-06-07Kohlrabi16-07-07Chinese kale15-06-07
Amaranth21-08-07Onion22-09-07Welsh onion02-08-07
Watermelon15-09-07Tomato11-03-08Watermelon20-09-07
Chinese kale04-12-07Wax gourd07-07-08Green pakchoi15-12-07
Spinach21-01-08Kohlrabi19-09-08Welsh onion18-01-08
Tomato15-03-08Garland chrysanthemum15-11-08Spinach23-03-08
Chinese kale03-07-08Tomato03-01-09Radish03-05-08
Welsh onion28-08-08 Welsh onion05-06-08
Green choy sum20-10-08 Tossa jute27-07-08
Snow pea08-12-08 Spinach 116-10-08
Chinese kale08-04-09 Spinach22-11-08
Welsh onion10-01-09
Green choy sum22-03-09
Amaranth24-04-09
1 Failed due to flood.
Table 6. Crops and crop planting dates (dd-mm-yy) in the field experiment for the production systems Biodiversity, Perishability and Traditional.
Vegetable Production System
BiodiversityPerishabilityTraditional
CropPlanting DateCropPlanting DateCropPlanting Date
Chinese kale01-05-07Wrapped heart mustard02-05-07Rice25-06-07
Tossa jute08-06-07Leek26-06-07Chinese kale01-10-07
Garland chrysanthemum17-09-07Watermelon31-08-07Welsh onion27-11-07
Tomato12-11-07Tomato10-11-07Spinach19-01-08
Welsh onion22-03-08Celery21-03-08Rice12-03-08
Amaranth14-05-08Leek12-05-08Rice02-07-08
Watermelon24-06-08Kohlrabi08-08-08Chinese kale06-10-08
Spinach10-09-08Watermelon 118-10-08Shallot27-11-08
Spinach 108-10-08Tomato15-11-08Rice16-02-09
Spinach22-11-08Radish10-04-09
Snow pea09-01-09
1 Failed due to flood.
Table 7. Effect of the different vegetable production systems on profit at local prices, potential profit at city wholesale market prices, labor requirement, labor-day (Lday = 8 h/day) income at local prices, and potential labor-day income at city wholesale market prices (kVND = thousand Vietnamese Dong)
SystemProfit (kVND/ha/day)Potential Profit (kVND/ha/day)Labor Requirement (day/ha/day)Labor-day Income (kVND/Lday)Potential Labor-day Income (kVND/Lday)
Profitability321 e797 c9.7 f33 bc83 a
Labor277 de877 c6.5 b42 c135 b
Pesticide238 cd763 c8.9 e27 b85 a
Biodiversity102 ab545 b7.6 d13 a71 a
Perishability89 a504 ab7.0 c13 a72 a
Traditional168 bc406 a5.0 a34 bc82 a
LSD (p = 0.05)711320.31018
Significancep < 0.001p < 0.001p < 0.001p < 0.001p < 0.001
Means with common letter are not significantly different at p ≤ 0.05.
Table 8. Effect of the different vegetable production systems on costs of pesticide use and use of insecticides and fungicides (ai = active ingredient; kVND = thousand Vietnamese Dong)
SystemCosts of Pesticide Use (kVND/ha/day)Insecticide (ai) (g/ha/day)Fungicide (ai) (g/ha/day)
Profitability307.332.3
Labor3926.763.0
Pesticide295.443.3
Biodiversity2412.642.6
Perishability3818.560.0
Traditional154.811.9

