Article

Economic Impact and Risk Assessment of Sand and Dust Storms (SDS) on the Oil and Gas Industry in Kuwait

1
Crisis and Decision Support Program, Environment and Life Sciences Research Center, Kuwait Institute for Scientific Research, P.O. Box 24885, Safat 13109, Kuwait
2
Techno-Economics Division, Kuwait Institute for Scientific Research, Safat 13109, Kuwait
3
Meteorology Department, Directorate General of Civil Aviation, P.O. Box 35, Hawalli 32001, Kuwait
*
Author to whom correspondence should be addressed.
Sustainability 2019, 11(1), 200; https://doi.org/10.3390/su11010200
Submission received: 12 December 2018 / Revised: 25 December 2018 / Accepted: 27 December 2018 / Published: 3 January 2019
(This article belongs to the Special Issue Dust Events in the Environment)

Abstract

:
There is a lack of published research on the economic effect and the risk associated with sand and dust storms (SDS) worldwide. The objectives of this study are to estimate the economic impact of SDS on the oil and gas industry in Kuwait, to estimate a risk index for each loss, and to recommend a sustainable system for the mitigation of the damaging effects and economic losses of infrastructures. Hot spots of wind erosion, wind corridors, and dust frequency and severity formed the basis to locate the most susceptible oil and gas fields and operations. Ten sectors with potential loss vulnerabilities were evaluated: exploration, drilling, production, gas, marine, soil remediation, project management, water handling, maintenance, and research and development. Sand encroachment, although not a sector per se, was also considered. The results indicate that sand, and to lesser extent dust, are damaging and costly to the oil and gas infrastructure of Kuwait, with an economic cost estimation of US$9.36 million, a total of 5159 nonproductive lost hours, and 347,310 m3 of annual sand removal. A risk assessment identified three sectors with the highest risk indices (RI): drilling (RI = 25), project management (RI = 20), and maintenance (RI = 16). Sand encroachment also constituted a high risk (RI = 25). Mitigation of sand storms using a hybrid biological–mechanical system was shown to be cost-effective with an equivalent saving of 4.6 years of sand encroachment. The hazard implications of sand storm events continue to be a major concern for policy-makers given their detrimental economic impacts, and require that government officials wisely allocate investment budgets to effectively control and mitigate their damaging effects.

1. Introduction

1.1. Sand and Dust Storms: Definition, Sources, and Trajectories

Sand and dust storms (SDSs) are the result of wind erosion by either natural or anthropogenic factors. Dust storms are formally defined by the World Meteorological Organization (WMO) as the result of surface winds raising large quantities of dust into the air and reducing visibility at eye level to less than 1000 m [1]. There is no strict distinction between the definitions of sand versus dust storms [2]. However, the distinction can be based on either grain size or transport trajectory. In general, sand-size particles are larger than about 0.06 mm, and, in desert dust, most sandy particles will stay within several meters of the ground surface. The transport trajectories of sand storms are commonly entrained within the local source, while for dust storms the transport is transboundary; that is, from local and distant (regional/global) sources. Dust events have been defined by Tozer and Leys [3] as those with total suspended particles (TSP) greater than 100 μg/m3. Other studies have defined dust events when particulate matter with an aerodynamic diameter below 10 μm (PM10) is above 200 μg/m3 [4,5] or above 150 μg/m3 [6].
Natural and anthropogenic activities combined add to the phenomena of SDSs. Climate change is a potential driver of wind erosion [7] leading to a higher drought frequency and greater aridity. Drought differs from most other hazards in that it develops slowly over time, and its onset is generally difficult to detect. Drought is not solely a natural physical phenomenon because its impacts can be exacerbated by human activities and water supply. Severe water scarcity, vegetation degradation, and animal overgrazing have intensified land aridity. About 40% of the world’s surface is drylands [8]. Wind erosion can be measured directly in the field or indirectly using Geographic Information System (GIS) and remote-sensing techniques. Field measurements are applied using instruments that evaluate the erosion rate by analyzing wind-borne particles, or in wind tunnels, where a constant stream of air is applied [9]. GIS mapping is a useful tool to present land degradation and degrees of desertification [10]. A risk index can then be determined based on erosion exposure and system vulnerabilities (i.e., land use and economic development) [11,12].
The Sahara desert constitutes the largest source of atmospheric desert dust, followed by Arabia, western China, and Australia. Desert dusts commonly transport over long distances. The maximum dust concentrations (measured as PM10 levels) in long-distance transport ranged from 500 km from North Syria and Iraq to Limassol, Cyprus [13] to 16,000 km from the Gobi desert to the western coast of the U.S. [14,15].
Kuwait, like many countries in western Asia and the Middle East, is subject to SDSs throughout the year. The events occur in a somewhat random pattern; however, the drivers of the events are meteorological and soil conditions in source areas, which are both local and transboundary. Many of the dust storms that impact Kuwait originate from the north of the country, and transport dust and sand from close neighbors (Iraq and Saudi Arabia); however, the dust trajectories can also transform dust from Iran and Egypt [16]. Eight major SDS trajectories have been identified from satellite-derived data: 1. The Mesopotamian flood plain, 2. The western desert of Iraq, 3. The Ahwar marshes, 4. Ahwaz-Iran, 5. The Nafud desert, 6. The empty quarter desert, 7. Bandar Lenga-Iran, and 8. Hurmuz [17]. Yassin et al. [18] identified specific air mass trajectories for each season and concluded that Shamal winds from southern Iraq and Syria act as the main contributor to Kuwait’s SDSs, which typically prevail between February and April.

1.2. Economic Studies of SDSs

Research on the economic impacts of SDSs is relatively limited given the significance of desert dust as a hazard to national income and human societies [7]. A total of only nine studies of the economic impact of SDSs and wind erosion have been identified (Table 1). Al-Hemoud et al. [19] studied the impact of SDS events in Kuwait on crude oil export and air transport for the years 2001–2014. Meibodi et al. [20] estimated the total annual costs of SDS events in Iran and Iraq. Tozer and Leys [3] estimated the economic impact of a single large dust storm “Red Dawn” on 23 September 2009 in New South Wales, Australia. Miri et al. [21] estimated the total cost of dust storms over four years (2000–2005) for the Sistan region in the southeast of Iran. Ekhtesasi and Sepehr [22] estimated the direct cost of wind erosion in Yazd, Iran. Ai and Polenske [23] studied the economic impact of yellow dust storms for Beijing, China in 2000. Jeong [24] estimated the average cost of yellow dust storms in South Korea for the year 2002. Williams and Young [25] estimated the annual off-site cost of wind erosion for South Australia. Lastly, Huzsar and Piper [26] estimated the average annual off-site cost of wind erosion in New Mexico, U.S.

1.3. Economic Impact and Evaluation of SDSs
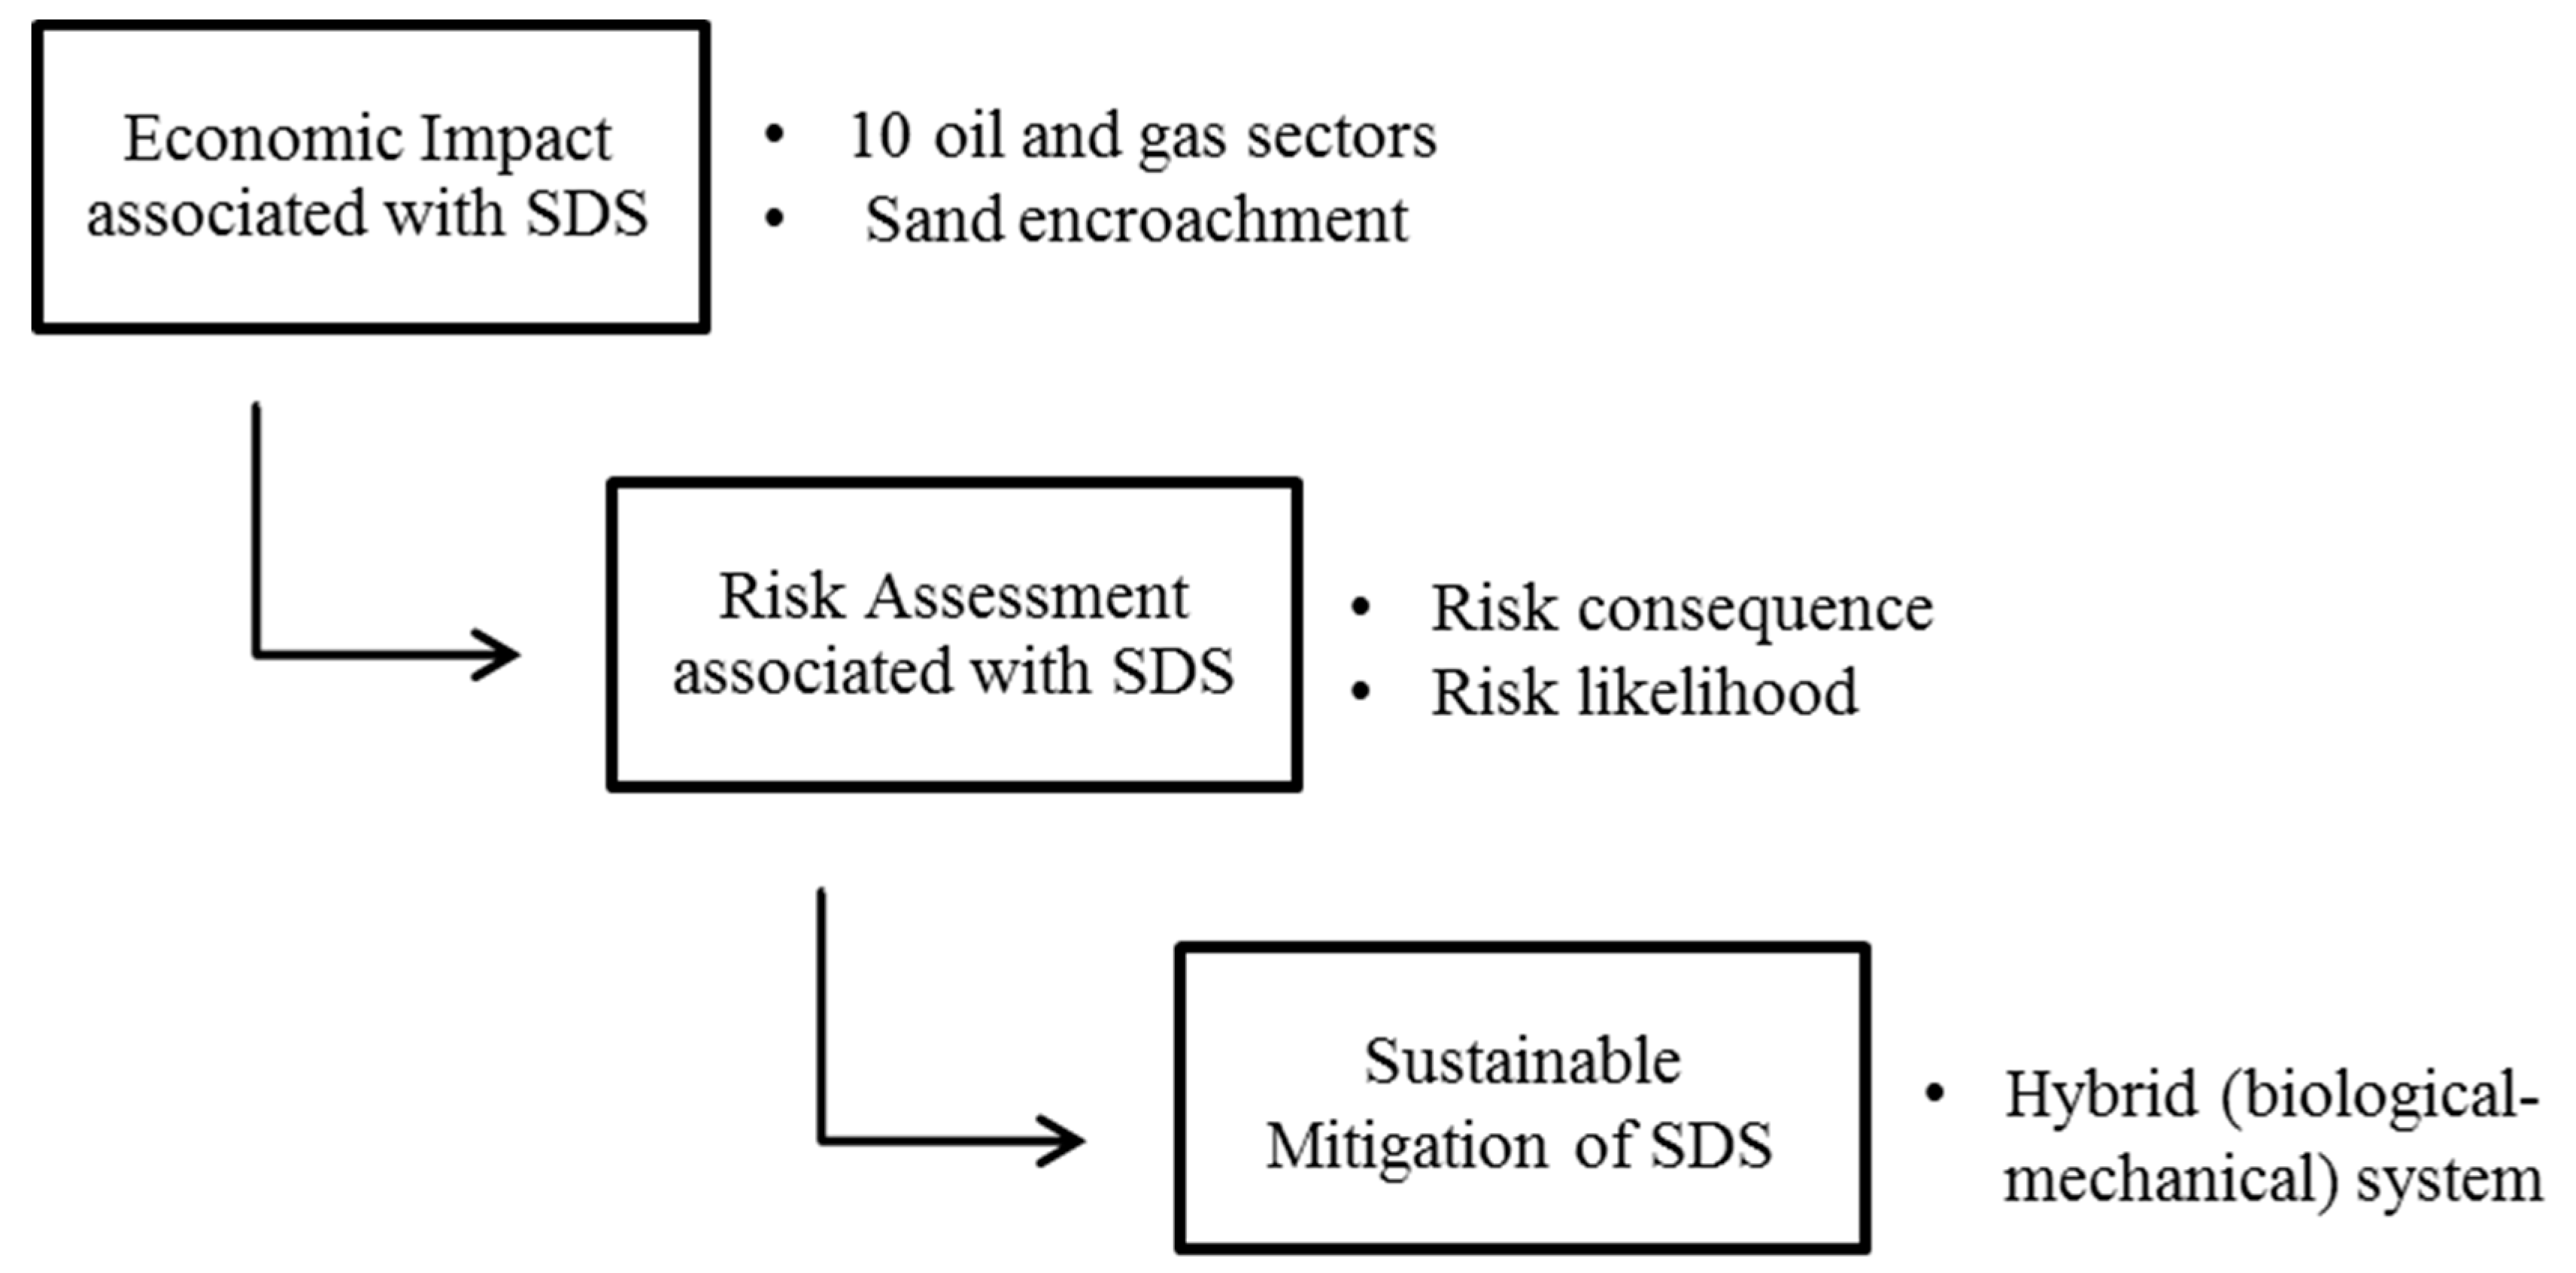
SDSs affect most segments of an economy, either directly or indirectly. Direct effects are those that are immediate consequences of events, for example the shutdown of marine terminals, airline delays, road accidents, detrimental health effects (i.e., respiratory diseases), reduced commercial activities (i.e., a low number of customers in shops), a loss of agricultural production due to crop damage and livestock deaths, cleaning and landscaping in residential premises, and damage to road signs and posts. Indirect effects are secondary outcomes that may occur following direct effects. For example, reduced commercial and transport activities may decrease the number of products in retail stores, airline delays and cancellations may reduce the number of guests staying in hotels, and delays in construction work may increase the time duration for project completion. Other less obvious indirect effects are opportunity costs; for instance, a delayed shipment of exports (air, land, marine) or a delayed delivery of products to commercial stores. The economic impact of SDSs also depends on the level of economic activity within an economy [3,7,23]. Regions or locations with a significantly higher level of economic activity, such as cities with major infrastructure or transport hubs, will be more impacted by SDS than locations with less infrastructure or populations.
Economic evaluation methods are needed to estimate the economic burden of SDS events on the most vulnerable sectors of a society and to provide decision-makers with sustainable mitigation control measures. The biggest challenge for any economic impact assessment of SDSs is identifying suitable basic data and an economic method that captures most of the costs of an event or series of events. Another issue that arises is due to the uncertainty of SDS events and the expected number of events in any one period, and if any preparation occurs before an event. SDS events could last for only a few hours, a few days, or occur successively in a single day. For example, the dust event that affected Sydney in 2009 was a once-only event [3], whereas SDS events are more common occurrences in other parts of the world, such as eastern Asia (China, Mongolia, South Korea), western Asia and the Middle East (Kuwait, Iran, Iraq, Saudi Arabia), northern Africa and the Sahara (Mali, Mauritania, Egypt), and Australia. Because of the regular occurrence of SDSs in these regions, inhabitants may take corrective action to reduce their negative impact or simply ignore the infrequent events, and, as a result, there may be no estimated impact on segments of the economy.
A total of six evaluation techniques are commonly used in the economic assessment of SDS events. These are: 1. Input-Output “I-O”, 2. Market Value “MV”, 3. Contingent Valuation “CV”, 4. Bottom-Up and Top-Down “BU/TD”, 5. Benefits Transfer “BT”, and 6. Questionnaire-Type “Q-T”. The “I-O” method is a form of macroeconomic analysis based on the interdependencies between economic sectors or industries. It is commonly used to evaluate both tangible and intangible economic impacts by studying the decreased demand/supply in a commodity or a sector with the decrease in demand/supply of another commodity or sector. It has been used to evaluate the economic impact of SDSs by studying, for instance, the relationship between construction delays caused by dust storms and the amount of available raw material and utilities, and the equilibrium of trade and catering services [23]. The “MV” method evaluates the economic impacts by multiplying the productivity loss by the market value; for instance, field crop loss during a sand storm can be estimated from the farm sale price, or work productivity loss from absent employees can be estimated from regular wages [24]. The “CV” method is a survey-based technique to analyze the cost–benefit of nonmarket values. An application example is the willingness-to-pay for restoring soil erosion from SDS events to obtain fertilized soil, or the willingness-to-accept to give up camping in desert areas to restore ecosystem damage from SDSs. The “BU/TD” method is used to estimate expenses by listing all individual base elements of a system and working upward by linking similar elements together (“BU”), or by specifying the overall system and refining it in greater detail to the base elements (“TD”). An example of the “BU” method is estimating the economic loss due to dust storms from four sectors of the economy (oil export delays, airline cancellations, traffic accidents, agriculture degradation) [19]. An example of the “TD” method is estimating the cost of damage to roads by analyzing the damage incurred to road signs, asphalt surface abrasion, and road maintenance [21]. The “BT” method uses economic estimates from other studies rather than conducting an original valuation study. This method is helpful when time or resources are limited and has been used in several studies [3,19,25]. The “Q-T” method is very common in economic studies and involves acquiring feedback from participants through mailed surveys or personal interviews [21,22,26].
An empirical study was carried out with data obtained for eight years (2010–2017) to quantify the economic impact and assess the risk of SDS events on the oil and gas industry in Kuwait. Vulnerable oil and gas sectors were identified, and their potential economic impacts were estimated. A risk assessment was carried out to prioritize the extent of potential losses to the oil and gas industry using risk indices. Ultimately, mitigation and control measures were recommended to reduce the damaging impact caused by SDS events.

2. Methods

An economic impact analysis and a risk assessment study were conducted to determine the effects of SDS events on the oil and gas operations within Kuwait. First, we estimated the economic impact of SDS events on Kuwait’s oil and gas sectors that have high vulnerabilities to losses. Second, we assessed the risk associated with each sector using a risk assessment matrix that was developed to evaluate the impact severities and occurrence frequencies associated with SDS events. Finally, we recommend sustainable prevention and control techniques to mitigate the damage effects of SDSs and reduce the economic losses to the oil and gas industry. Figure 1 presents a diagram of the study’s objectives.
The economic impact of SDS events is driven by the infrastructure of the affected sectors [3,23]. Kuwait’s economic losses from SDSs are expected to be largely associated with oil and gas operations because the oil and gas sector accounts for about 40% of the country’s Gross Domestic Product (GDP) and about 92% of export revenues. Oil reserves in Kuwait make up 8% of the oil reserves in the world, and it is Organization of the Petroleum Exporting Countries (OPEC’s) third largest oil producer and estimated to hold approximately 101 billion barrels [27]. There are two major oil and gas companies in Kuwait: 1. Kuwait Oil Company (KOC), which in 1938 drilled the country’s first commercial oil well in the Burgan oil field and began its commercial export of crude oil in 1946; and 2. Kuwait Gulf Oil Company (KGOC), which was established in 2002 and shares the natural resources of oil equally with Saudi Arabia in the neutral zone between the two countries, including half of the 5 billion barrels in the Kuwaiti–Saudi neutral zone. Most of Kuwait’s oil reserves are located in the 70-billion-barrel Greater Burgan field situated in the southeastern part of Kuwait, which is the second largest conventional oil field in the world and is operated by KOC. It includes three producing subfields: Burgan itself (500 km2), Magwa (180 km2), and Ahmadi (140 km2) (Figure 2). The figure also shows the two oil fields located in the neutral zone, Wafra and S. Fawaris, which are jointly operated by KGOC (Kuwait side) and Chevron (Saudi Arabia side).
In Kuwait, soil losses through wind erosion and deflation processes are the most widespread form of environmental hazards. The risk of aeolian erosion was determined using GIS mapping. Hot spots of wind erosion were delineated through the integration of remote sensing, GIS, and ground truth. Visual analyses of Landsat images from 2010 (30 m resolution) indicated bright areas of different sizes. The ground truth of these areas showed that they are bare of vegetation and showed clear indicators of deflation. The ArcGIS S/W 10.5 was applied to create the hot spot polygons. Currently, these hot spots act as local entrainment sources for sand and dust. The use of GIS techniques allows for the parametric characterization of the factors involved in the processes of soil degradation, and these techniques have been applied in previous studies [9,10]. In the terrestrial environment of Kuwait, five hot spots were identified for wind erosion. These hot spots are present due to both water and wind erosion. They are located within three major wind corridors, which run from the northwest toward the southeast (Figure 3). The five spots are: 1. 1044.2 km2, which includes segments of Wafra roads toward KGOC, 2. 543.7 km2, which covers the Minagish and Umm Gudair western oil fields, 3. 3653.4 km2, which covers the kra’Almru oil field, 4. 445.7 km2, which covers segments of the Raudhatain oil field, and 5. 836.25 km2, which covers segments of the Sabriyah and Bahrah oil fields.
The estimation of the economic impact of SDSs on Kuwait’s oil and gas operations was carried out between 2010 and 2017. A total of 10 sectors were investigated: 1. Drilling Operations, 2. Production Operations, 3. Gas Operations, 4. Exploration, 5. Port and Marine Operations, 6. Soil Remediation, 7. Project Management, 8. Water Handling, 9. Maintenance, Support, and Reliability, and 10. Research and Development. Sand encroachment, although not a sector per se, was also investigated. For each of the 10 sectors, the impacts of SDS events were estimated by their nonproductive lost hours, and their economic impacts were calculated accordingly. For the sand encroachment activity, the amount of sand removed in m3 was calculated, and its economic cost was estimated.
A risk assessment was carried out to qualitatively determine the hazard impact of SDS events on the oil and gas operations in Kuwait. The most commonly used qualitative risk assessment index is based on the MIL-STD-882D [28]. The matrix represents the undesired consequence (severity) on one axis and the probability (likelihood of occurrence) on the other. In this study, the risk estimation was based on the two components of risk: severity of the impact and likelihood of the occurrence of SDS events. Severity was defined as the consequence of the undesirable outcome of SDSs and measured in terms of three impacts: human injury/fatality, asset damage, and nonproductive time. Each of these three impacts has five order-of-magnitude increments, starting from negligible (de minimis) (score 1) to very high (score 5). The second component of risk is likelihood, which is interpreted in terms of exposure time [29]. Likelihood was defined as the recurrence frequency of SDS events per year. The likelihood scale was based on historical records of SDS events for 56 years (1961–2017) and was subdivided into five increments, starting from very unlikely (≤1 SDS/year) (score 1) to very likely (≥8 SDSs/year) (score 5). The risk was finally calculated as a score and was defined as the product of consequence (severity) and probability (likelihood), which gives a range of values spanning from a risk index of 1 (very low risk) to 25 (very high risk). The severity of SDS events was determined first for each oil sector, followed by the likelihood of the SDS recurrence frequency. Table 2 and Table 3 show the consequence (severity) and probability (likelihood) ratings associated with the SDS events, respectively.

3. Results

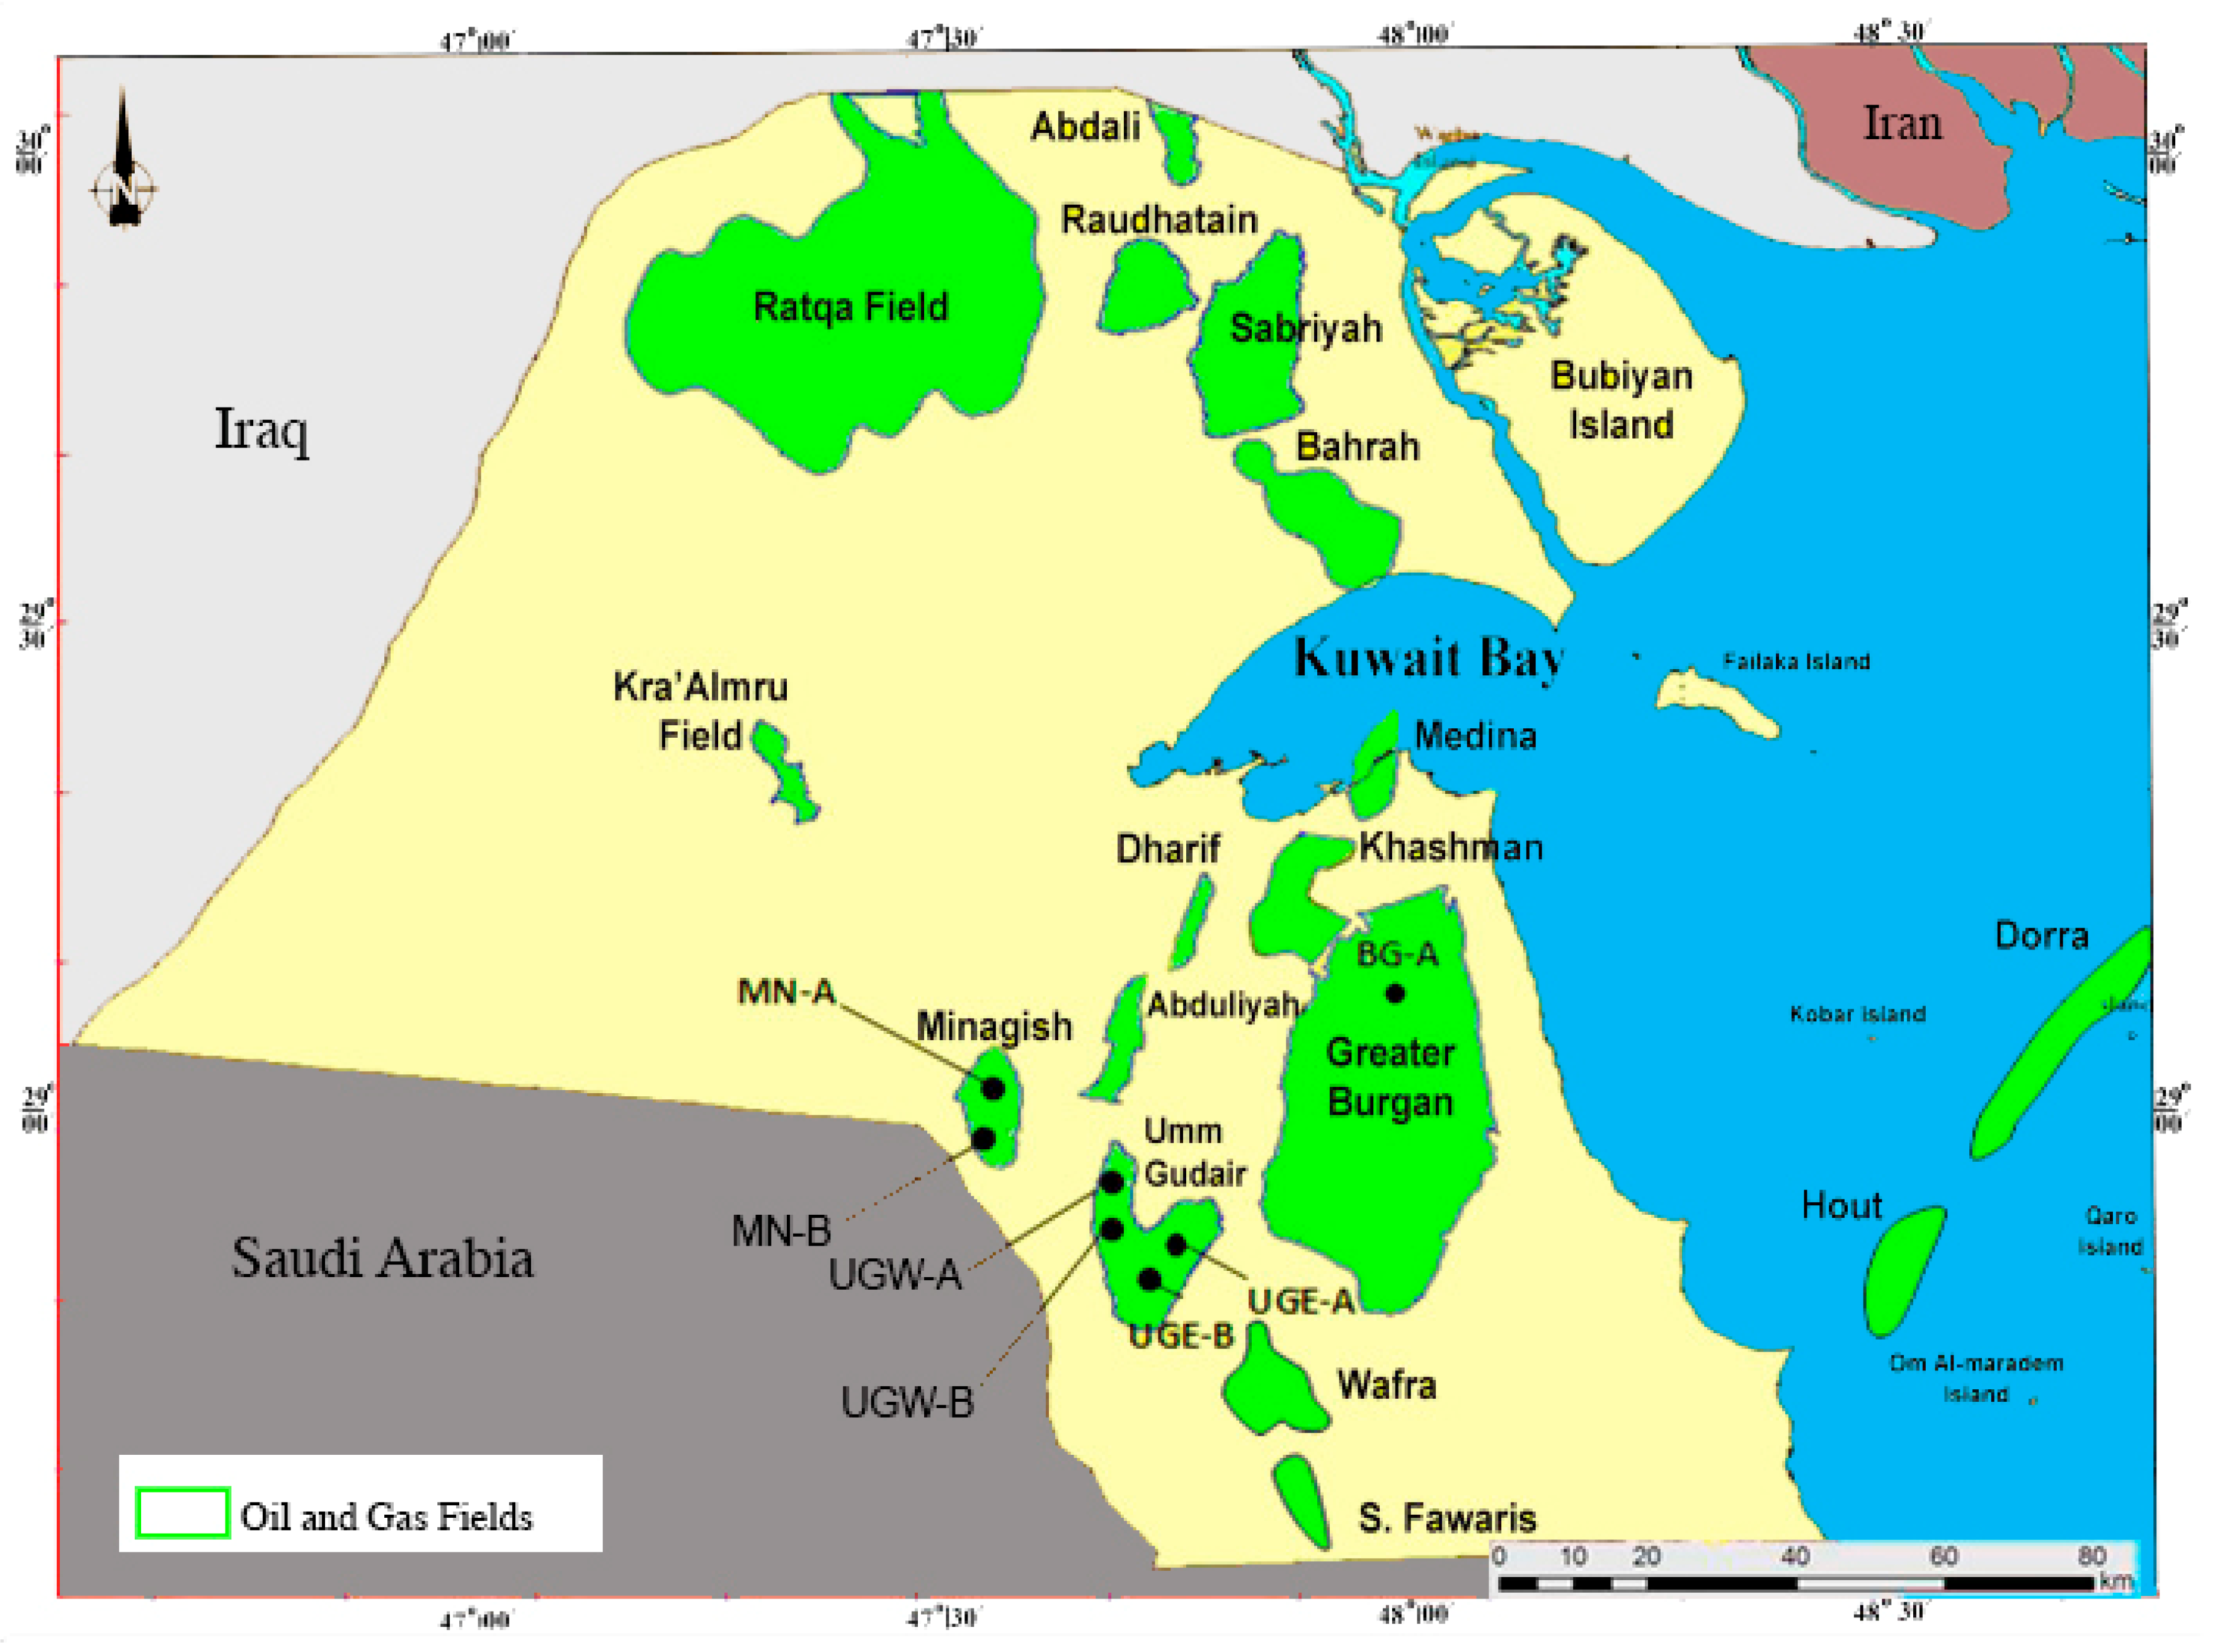
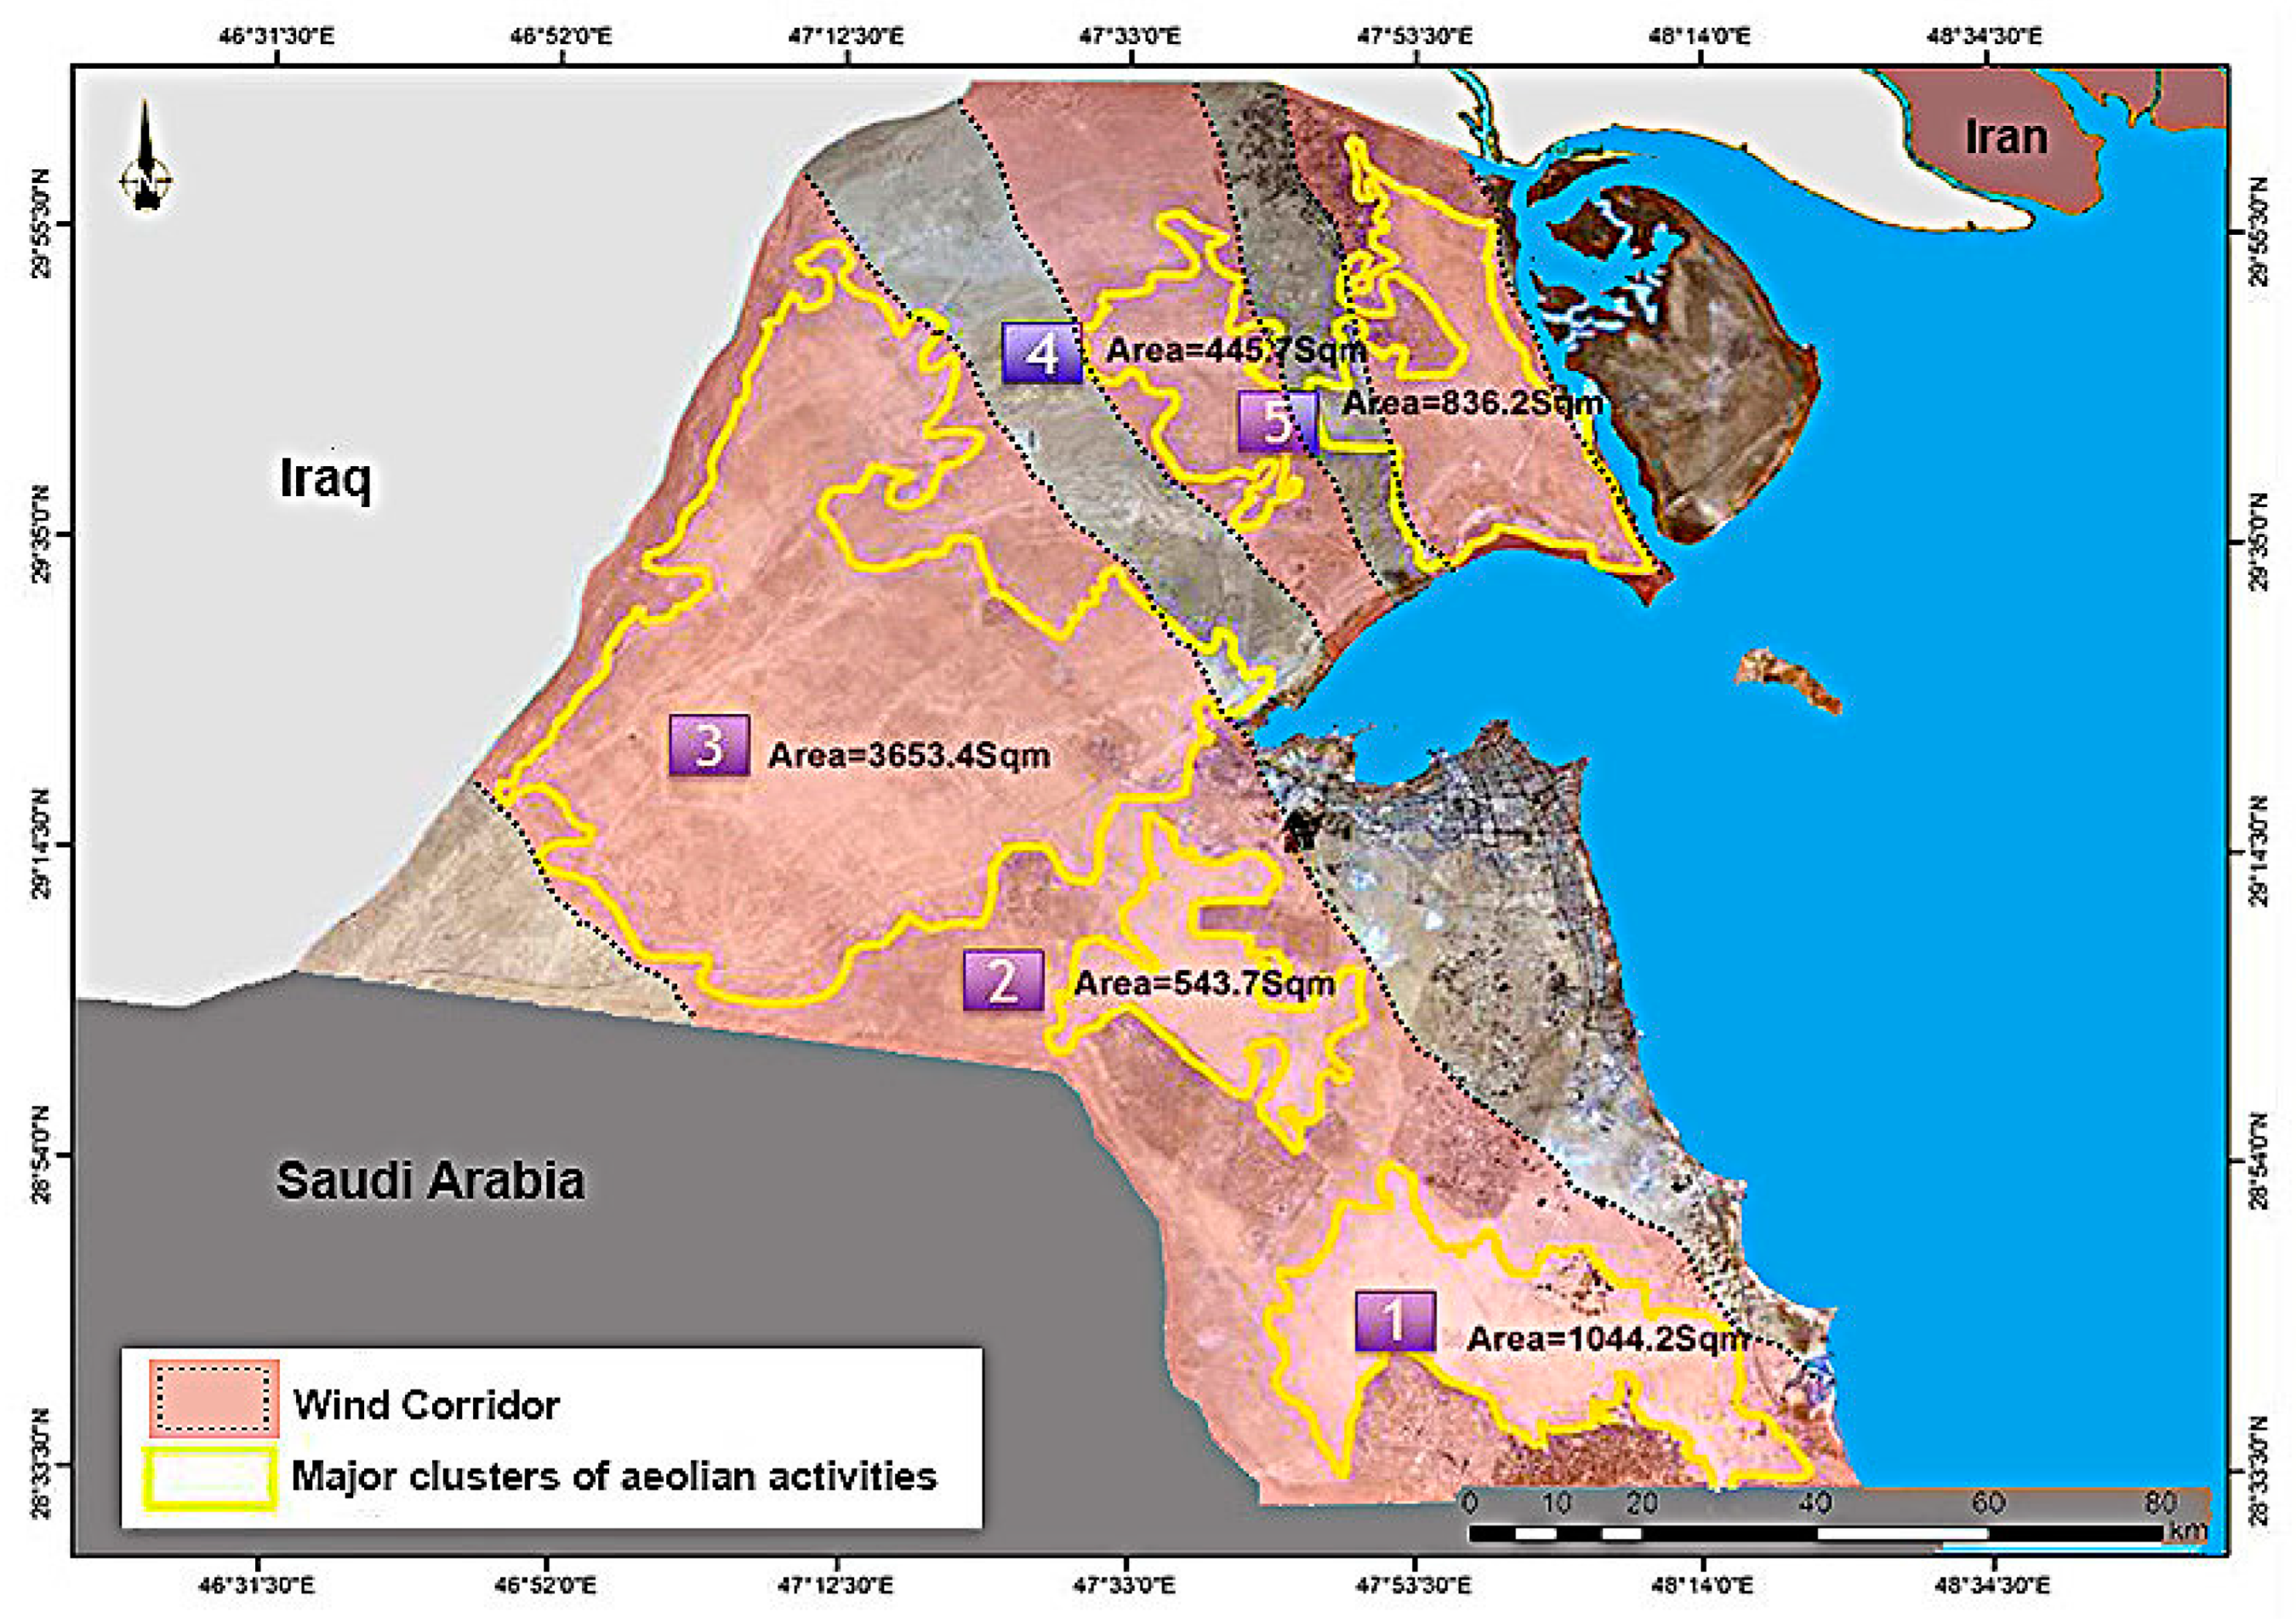
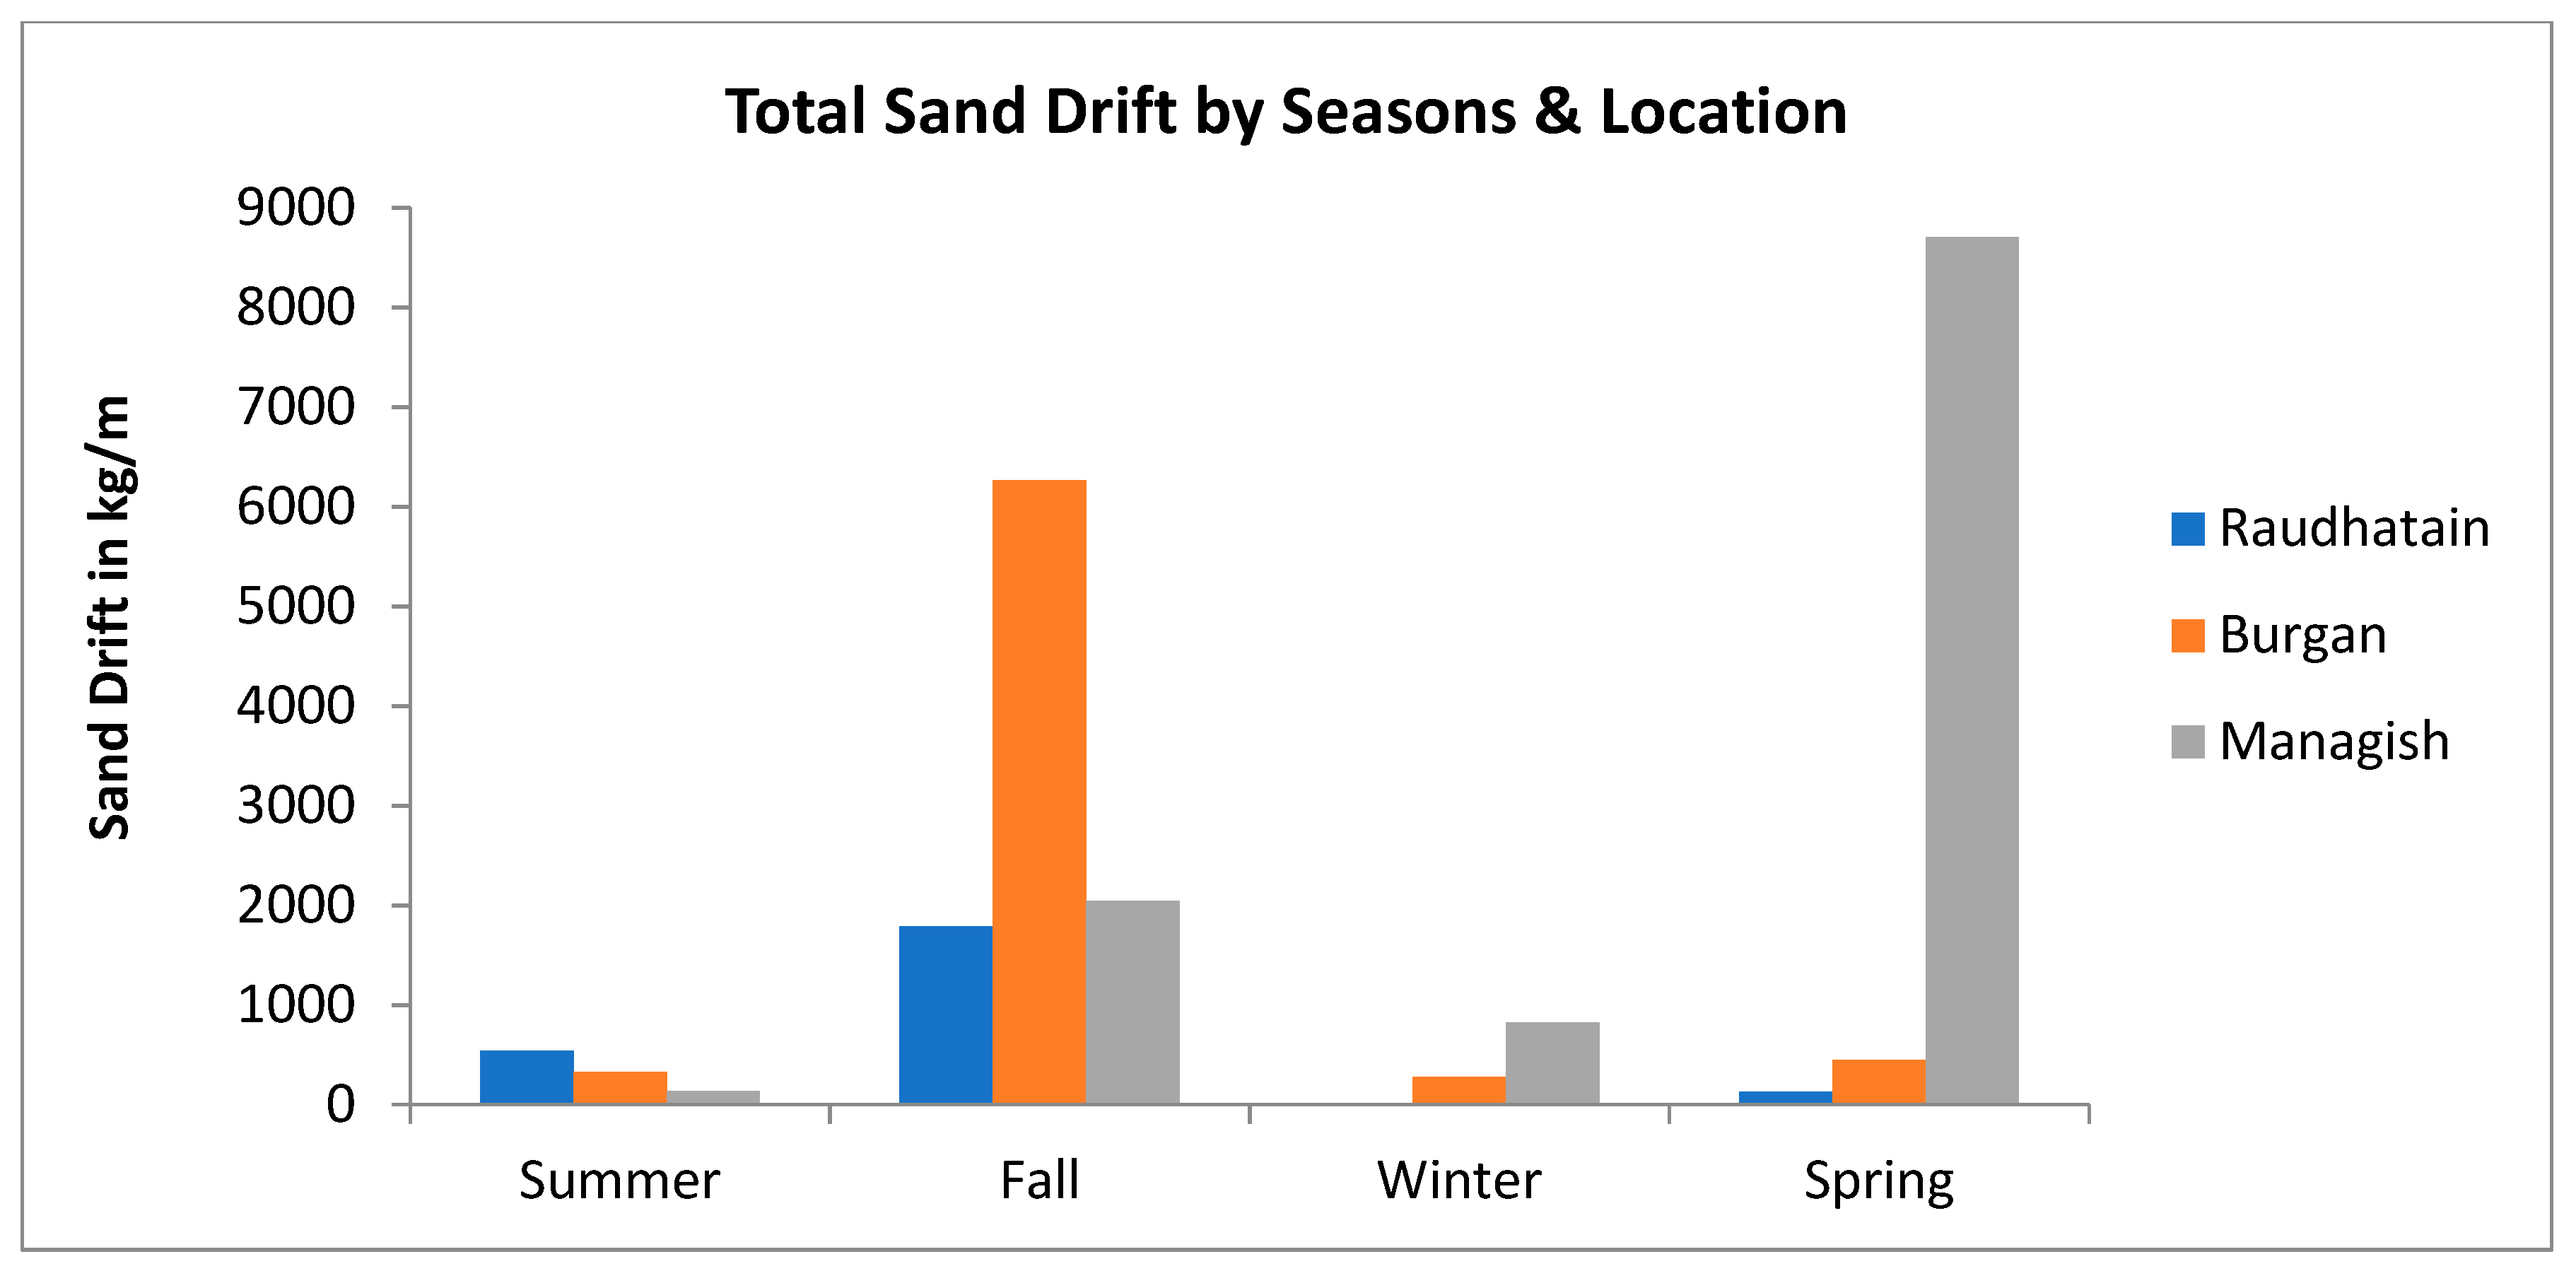
3.1. SDS Frequency and Severity in Kuwait

During the last five decades (1961–2017), Kuwait experienced some dry seasons with an annual average rainfall of 112 mm. The rainfall in Kuwait is sparse and irregular, and its rainy seasons extend between November and April. The annual average rainfall for the studied period (2010–2017) was 84.6 mm, and fluctuated between a minimum amount of 34.4 in 2010 and a maximum amount of 126.7 in 2012. This remarkable rainfall irregularity resulted in significant changes in the rates of sand accumulations. Figure 4 shows the total numbers of dust storms for the studied period (2010–2017). During this period, there were a total of 49 dust storm (DS) events with an average of about 6 DSs/year. The spring season (March to May) recorded the highest number of DS events (29 total) relative to the other months. Spring is considered a transition season in Kuwait with atmospheric instability associated with transient depressions from the west and south of the country that result in “Alsarrayat” [18]. According to Saeed and Al-Dashti [30], winter Shamal takes place between November and March, whereas the summer Shamal (also known locally as ‘Simoom’ or ‘the wind of 120 days’) takes place between June and August. For the studied period, the maximum number of DS events was recorded in 2012 (14 DSs), while the minimum number was recorded in 2016 and 2017 (2 DSs each). Figure 5 shows the wind roses from Kuwait Meteorological Stations for the period of study. It is apparent that the main direction of the wind in Kuwait is the north-northwest, with 19%, 15%, 21%, and 28.5% for the fall, spring, winter, and summer, respectively. Due to the fragile dry areas with little or no vegetation, winds can remove sand, silt, and clay-sized particles from the surface and transport them in the form of dust and sand storms over great distances. Fine surface particles need 0.2 ms−1 of wind velocity to be set in motion [31]. The Minagish and Burgan oil fields are the most affected by sand drift, as these areas are surrounded by 88.5% of the local sources of mobile sand and dust that result from the hot spots of wind erosion previously shown in Figure 3. As shown in Figure 6, the Burgan and Minagish areas have the highest sand accumulation due to their downwind locations from the prevailing northwesterly winds. Significant sand movement was observed during the spring and fall for the Minagish and Burgan areas, respectively, with a total amount of sand drift of 8701 kg m−1 and 6264 kg m−1, respectively, in which sand drift from the northwesterly direction was dominant [32]. Low sand drift was recorded during the wet winter season (December and January) due to the direct influence of rainfall on sand encroachment. Insignificant sand drifts were also noticed during the summer because of the low number of dust storms and the relatively wet seasons during the study period.

3.2. SDS Impact on Oil and Gas Operations

3.2.1. Drilling Operations

SDS events caused major delays in drilling operations at both KOC and KGOC. During the drilling and completion services of KOC, from 2015 to 2017, a total of 11 SDS events affected the operations in 18 oil wells and 13 rigs. The total nonproductive time was equal to 32.5 h (equivalent to 4 days), resulting in a loss estimated at 18,525 KD ($60,000). On the other hand, a total of 104 SDS events occurred from 2010 to 2015, resulting in 479.5 h of nonproductive time (equivalent to 60 days) and an estimated loss of 176,706 KD ($580,000) to KGOC drilling operations. Figure 7 shows a recent photo of accumulated sand on an oil well.

3.2.2. Production Operations

A network of oil and gas pipelines covers a large portion of Kuwait’s land (Figure 8). KOC production operation facilities are designed to run around the clock, even in severe weather conditions. Production from gathering centers (GCs) is maintained at the optimum level during SDS events. However, there are many hazards to KOC oil and gas productions during SDS: 1. Intense wind erosion causes shifting sands, which threaten roads, flow lines, and other facilities, 2. Sand encroachment results in an inconvenient working atmosphere, 3. Shifting sands and suspended dust cause health problems to employees, 4. Accumulated sand along flow lines retards and delays maintenance programs and sometimes results in flow line explosions, 5. The disappearance of segments of flow lines underneath creeping sand, and 6. Thick sand accumulations along flow lines accelerate corrosion problems. Furthermore, SDS events cause delays in well surveillance and maintenance activities due to the wells being inaccessible because of limited visibility, poor pathways, and safety issues. Figure 9 shows sand accumulation over pipelines.

3.2.3. Gas Operations

Some gas operations are rescheduled during SDS events. However, in general, rescheduling does not take a long time. Some delay was witnessed in the activities of new projects, and at commissioning stages; for instance, gas flares cannot be ignited during SDS events and high wind.

3.2.4. Exploration

The effects of SDS events on exploratory operations, mainly seismic acquisition and exploratory drilling activities, depend on the established manual of permitted operations (MOPD) at each work site. The MOPD was developed based on low visibility, high wind speed, and other adverse weather conditions (SDSs, lighting, thunder, and rainfall), and the criteria are to stop all operations in the case of such conditions. In general, during SDS events, explorations go on standby for short durations only.

3.2.5. Port and Marine Operations

Given the majority of oil in Kuwait is exported as either crude or refined oil, SDS events can limit the transport of oil tankers, increase the mid-sea waiting time, delay the arrival time, and extend loading and unloading times. During bad weather conditions, including SDSs, a total of 830 h (equivalent to 35 days) were lost due to berthing suspensions in KOC’s port and marine operations in 2016. The highest delays for berthing suspensions were recorded in December (201 h) and January (145 h), and the lowest were recorded in June (12 h) and August (15 h). No berthing suspensions were recorded during July and October. Both opportunity costs and charter costs were also involved from delayed shipping due to the loss in income of the time value of money and extended charter daily rates, respectively. However, both opportunity and charter costs were not included in the final cost estimation because of data scarcity.

3.2.6. Soil Remediation

Outdoor activities in six project locations of soil remediation were suspended during SDS events. The projects involve excavation and transportation of heavy oil-contaminated soil from three lots to landfills. The total bidding prices for the three lots were equal to KD 45.5 M ($150 M). In one project in North Kuwait, a total of 52.2 h (equivalent to 6.5 days) were suspended during SDS events in 2016. With an average bidding price of KD 15 M ($50 M) and a project duration of 5 years (15,600 h), the estimated cost per hour was KD 975 ($3217), corresponding to an annual loss of KD 50,925 ($168,050).

3.2.7. Project Management

SDSs affect many project management activities, including: 1. Replacement of crude oil pipelines, 2. Construction of new dry crude tanks, 3. Well surveillance workshops, 4. Replacement of separators and scrubbers, 5. Construction of remote header manifolds, 6. Upgrade of chemical injection, 7. Provision of power supply and lighting, 8. Installation of new effluent water transfer pipelines from GCs, and 9. Jurassic project management. A total of 2165 h (equivalent to 270 days) were lost due to SDSs for the period 2010–2016.

3.2.8. Water Handling

The following impacts from SDS were recorded for water handling activities: 1. Difficulties in approaching water injection flowlines and water injection wells for routine operations and maintenance activities, 2. Covering of instrumentation devices and associated tapings, 3. Delays in routine operational activities, and 4. Difficulties in waste cleanup and wastewater collection and handling.

3.2.9. Maintenance, Support, and Reliability

Work stoppages have been observed heavily for the painting, stenciling, and colour coding of equipment and piping during SDS events. The delayed activities include surface preparation and painting of instrument compressor areas, pipelines, and valves and the painting of roof tanks. The total delayed time for the years 2014–2016 was 199 h (equivalent to 25 days).

3.2.10. Research and Development (R&D)

The primary objectives of the R&D group are to oversee the design and construction of facilities to ensure the efficient delivery of research projects and manage the Center of Excellence to achieve an integrated vision for optimization, collaboration, and synergy across the upstream subsidiaries. The R&D group spends approximately 30,000 KD ($99,000) per year to study the hazard implications of dust storms and mitigate sand deposition on KOC facilities and infrastructures. A total of three projects were completed on R&D activities: 1. The protection of flow lines from creeping sand in the Minagish oil field (2008), 2. The protection of the Burgan oil field from sand deposition (2006), 3. The protection of three oil fields (Raudhatain, Minagish, and Burgan) from sand transportation and deposition (1995–1999).

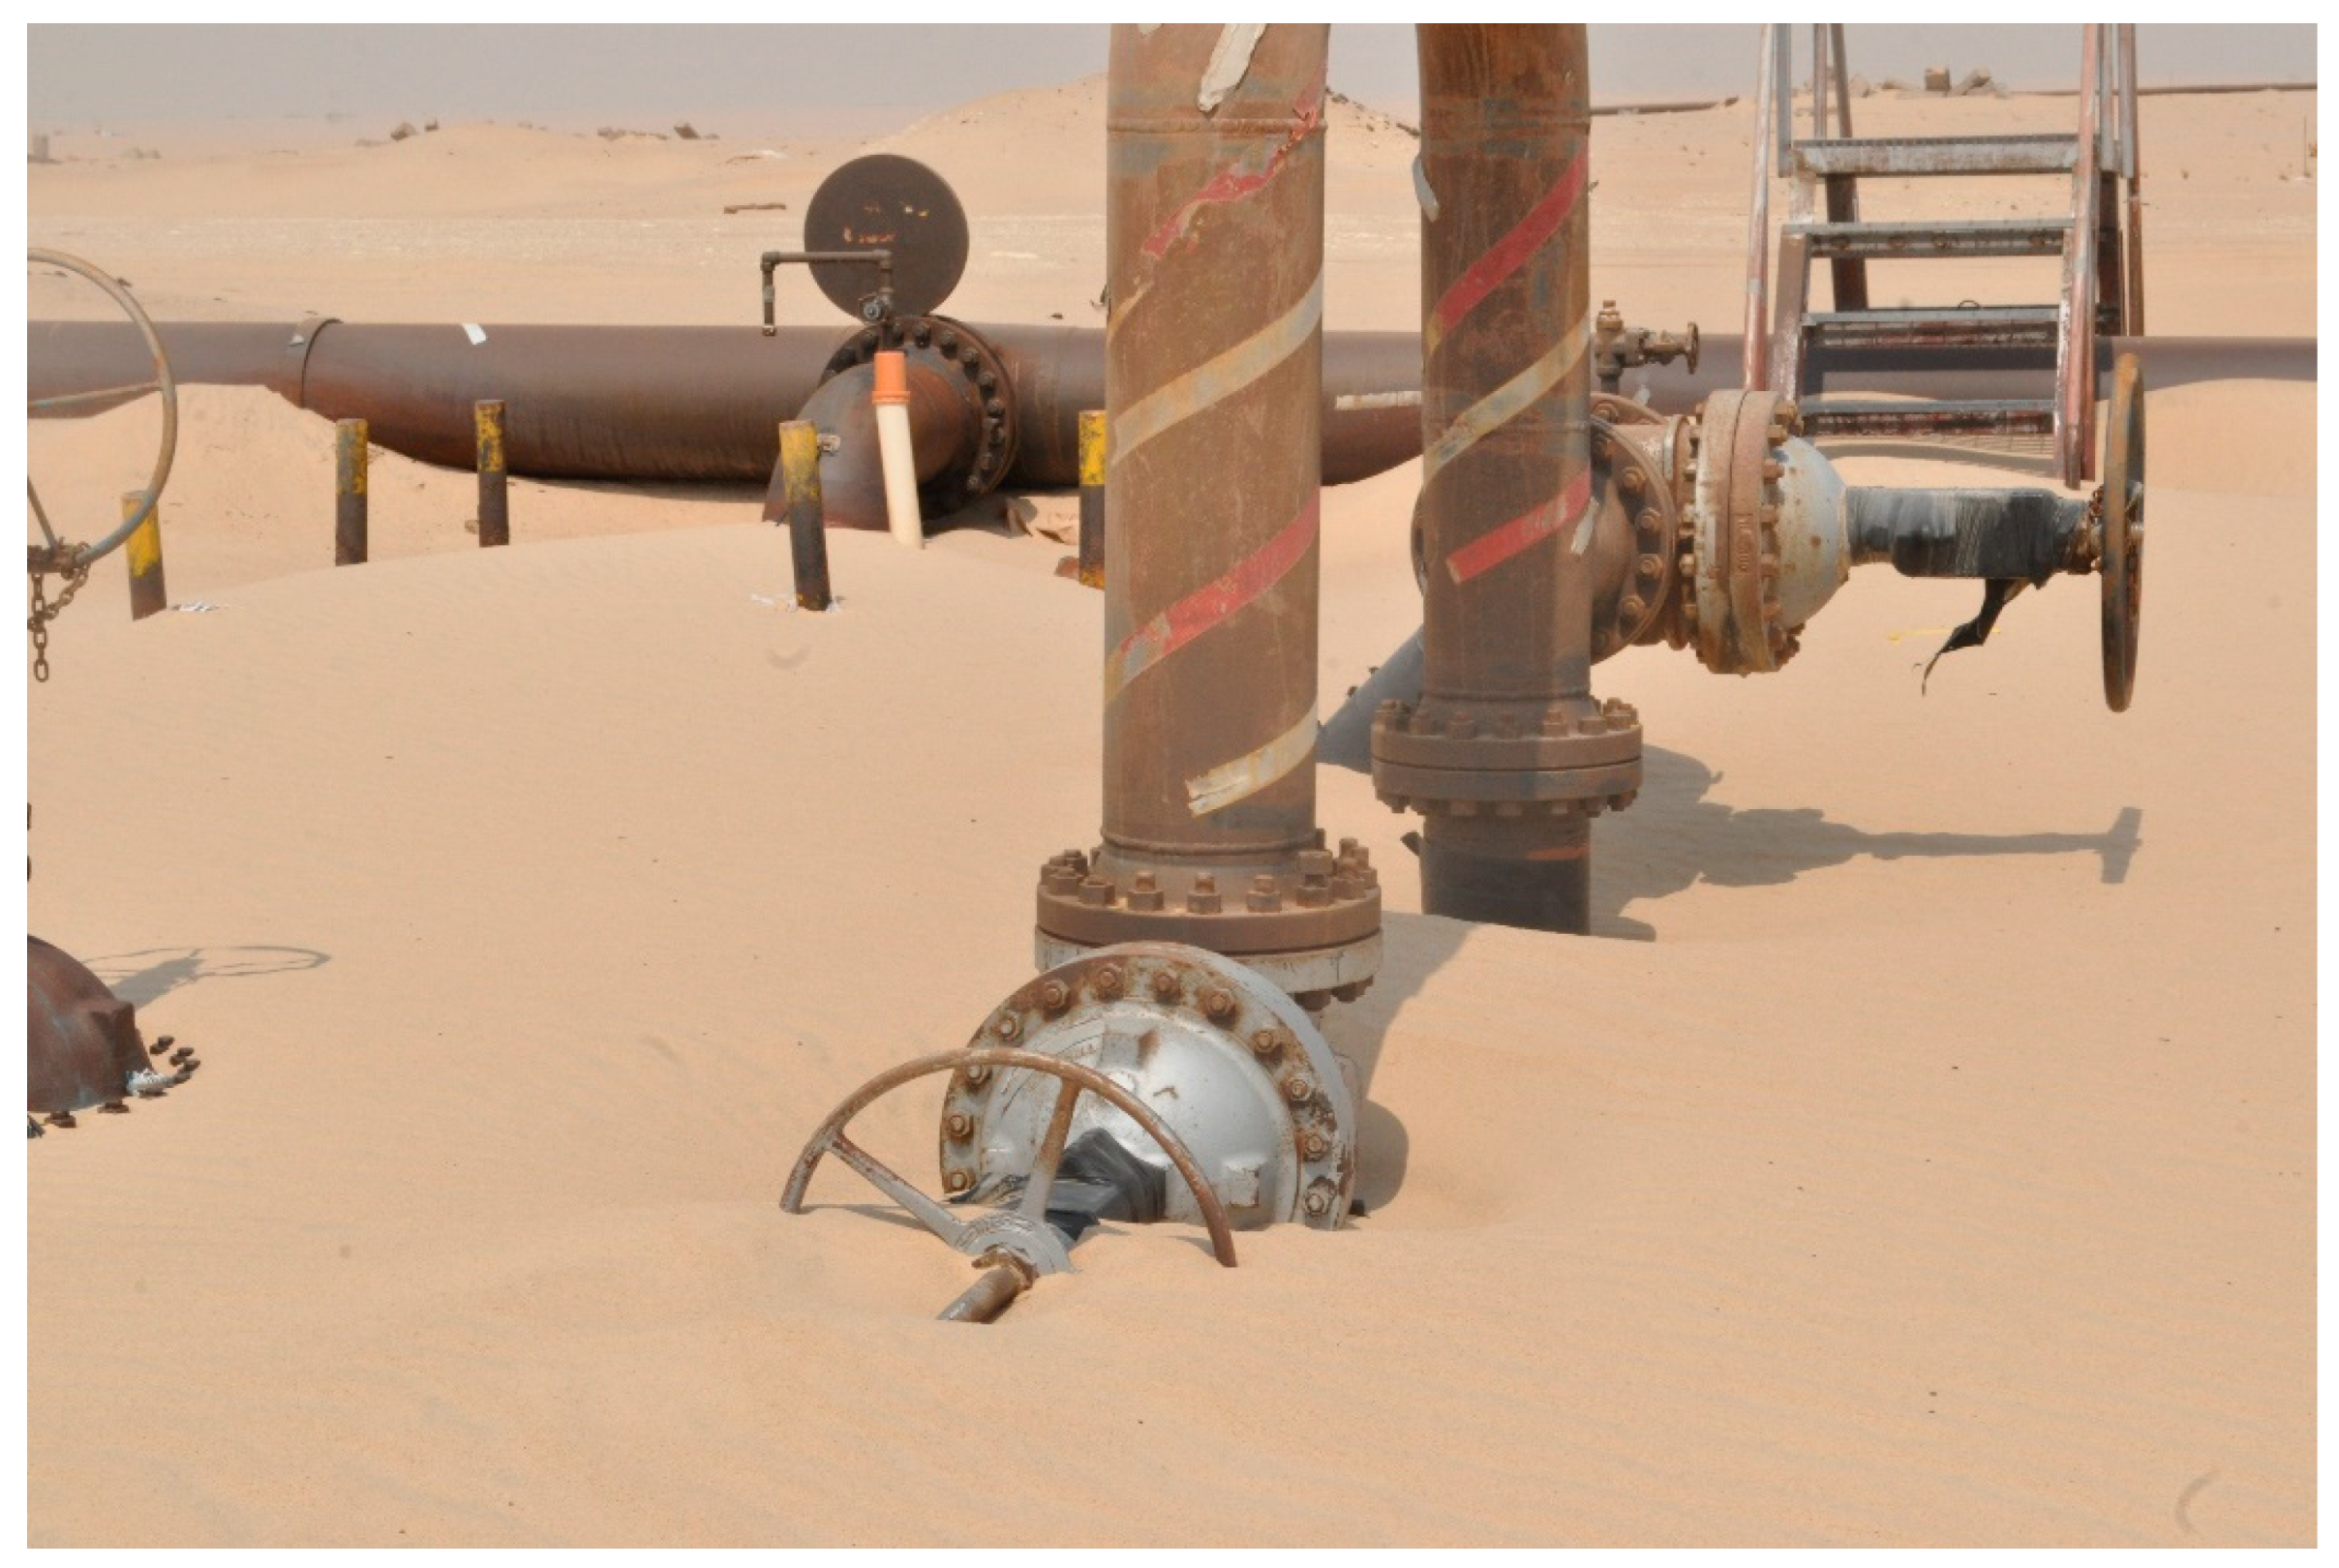
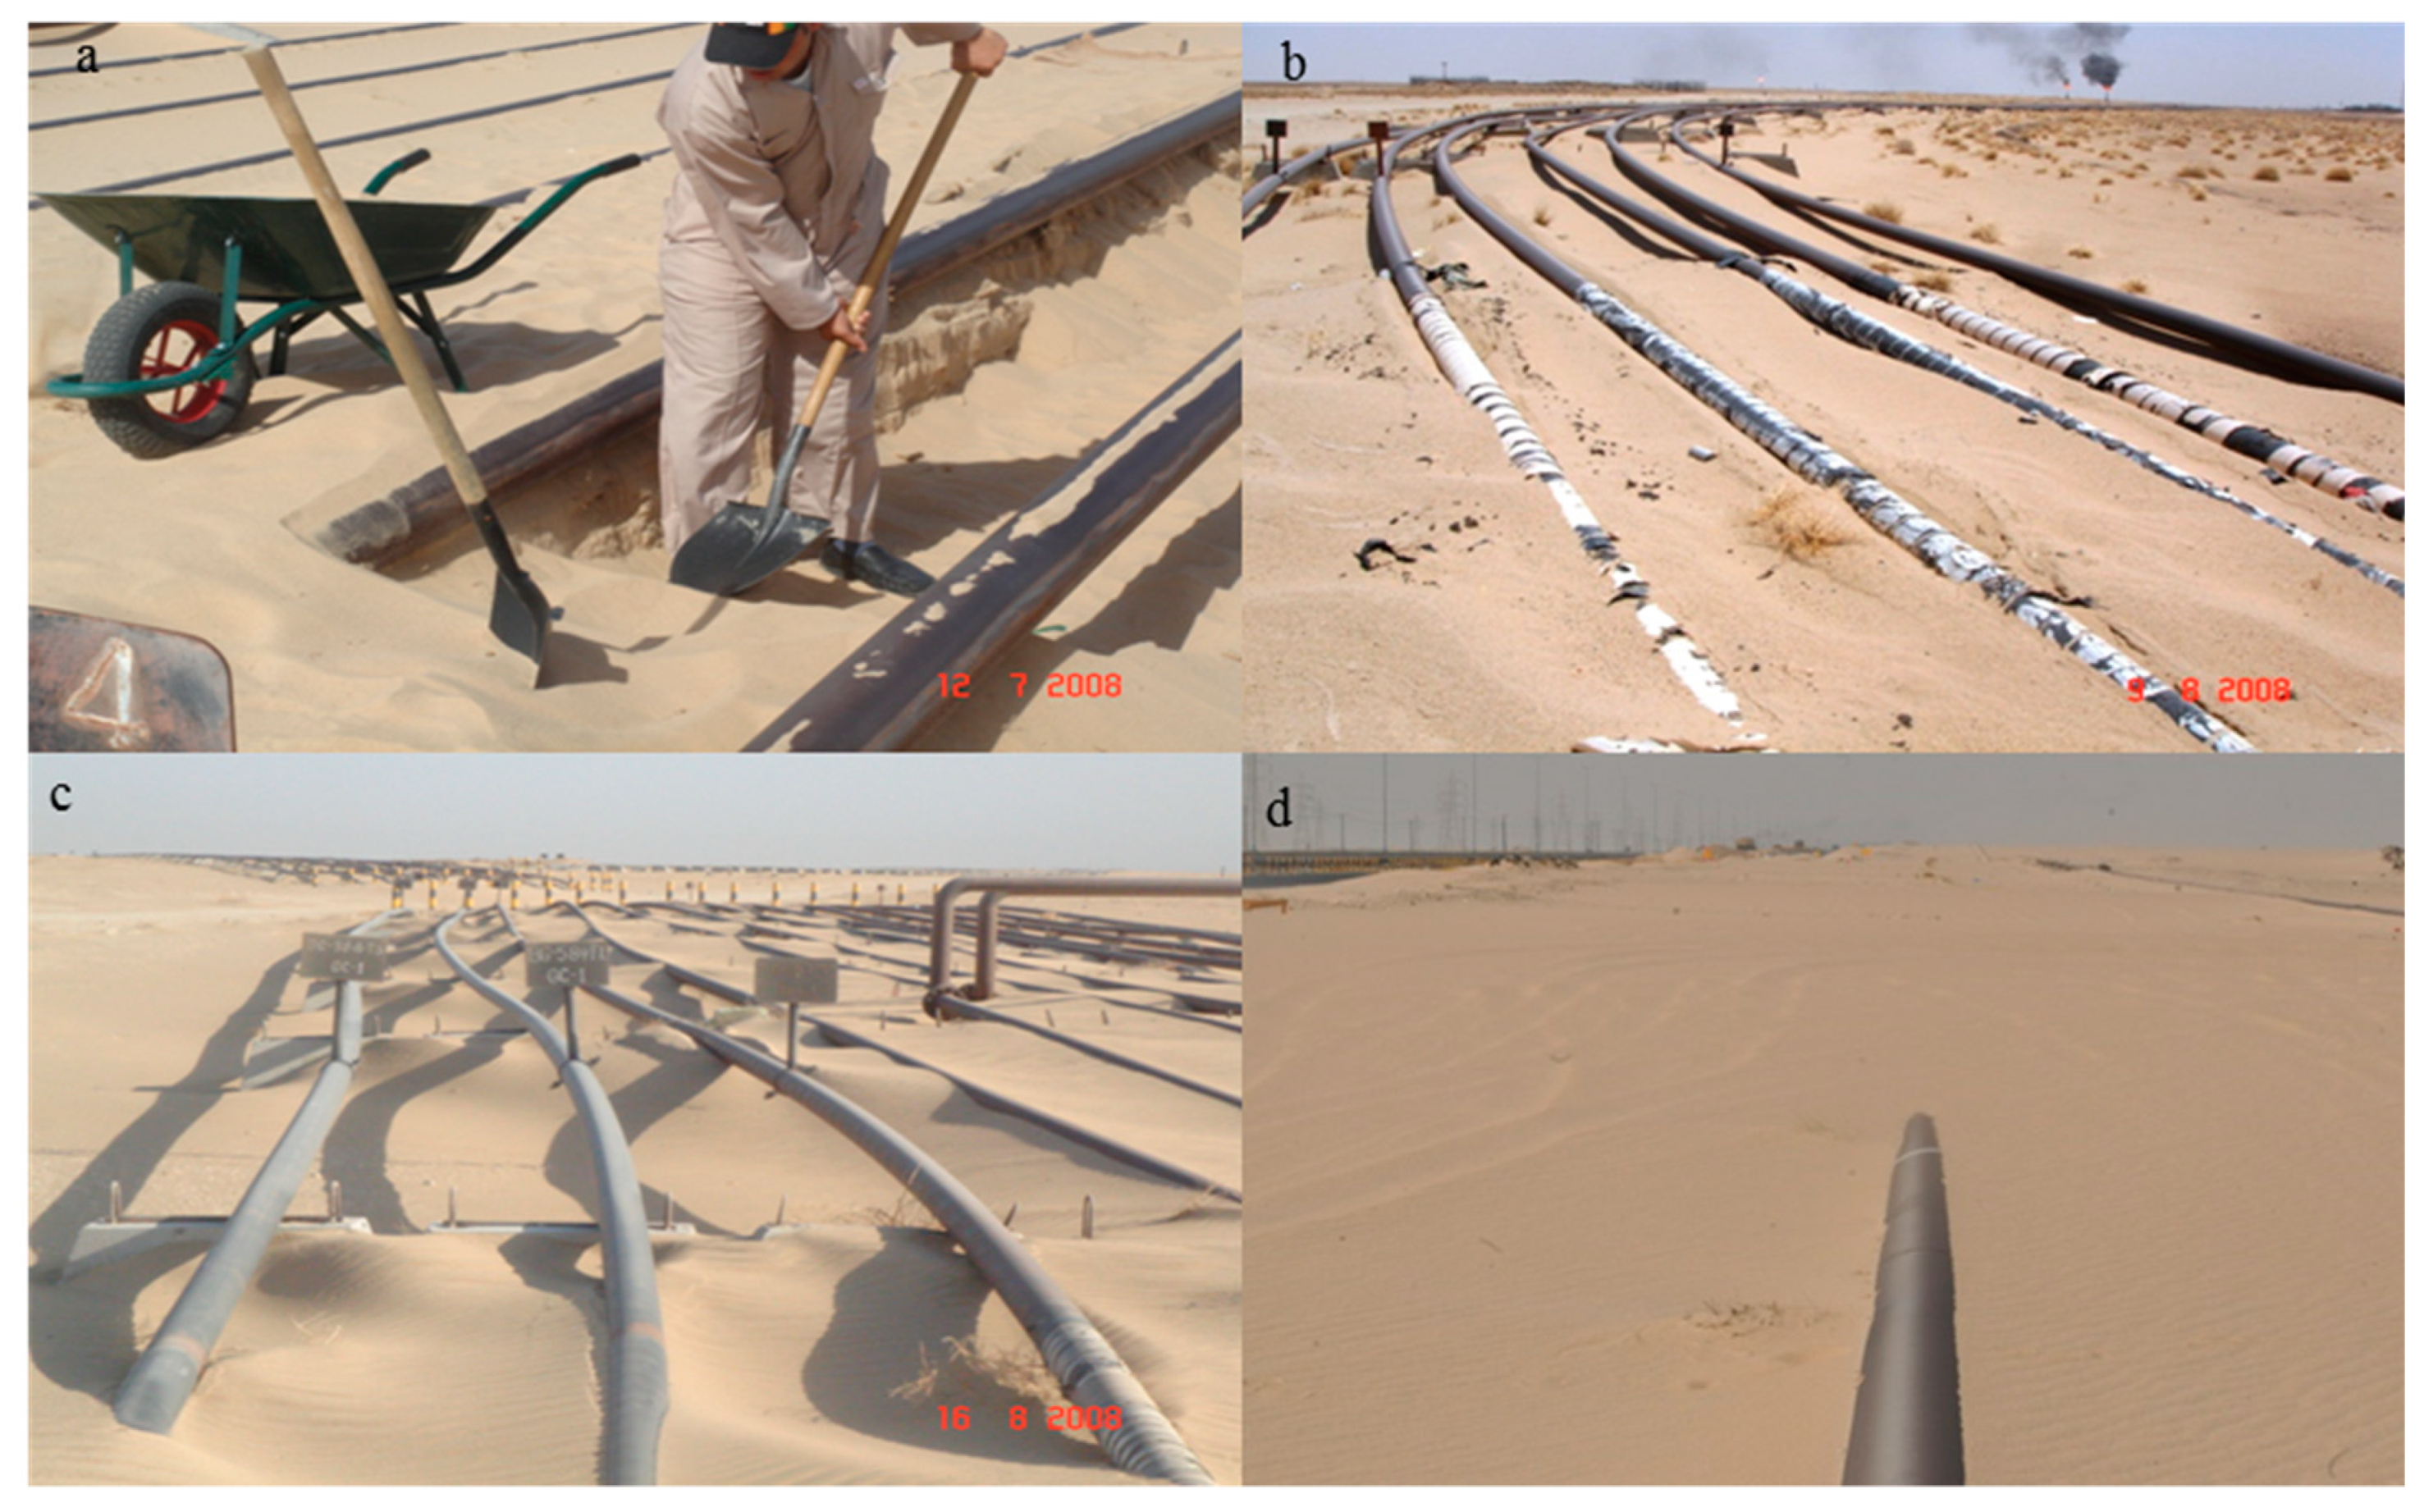
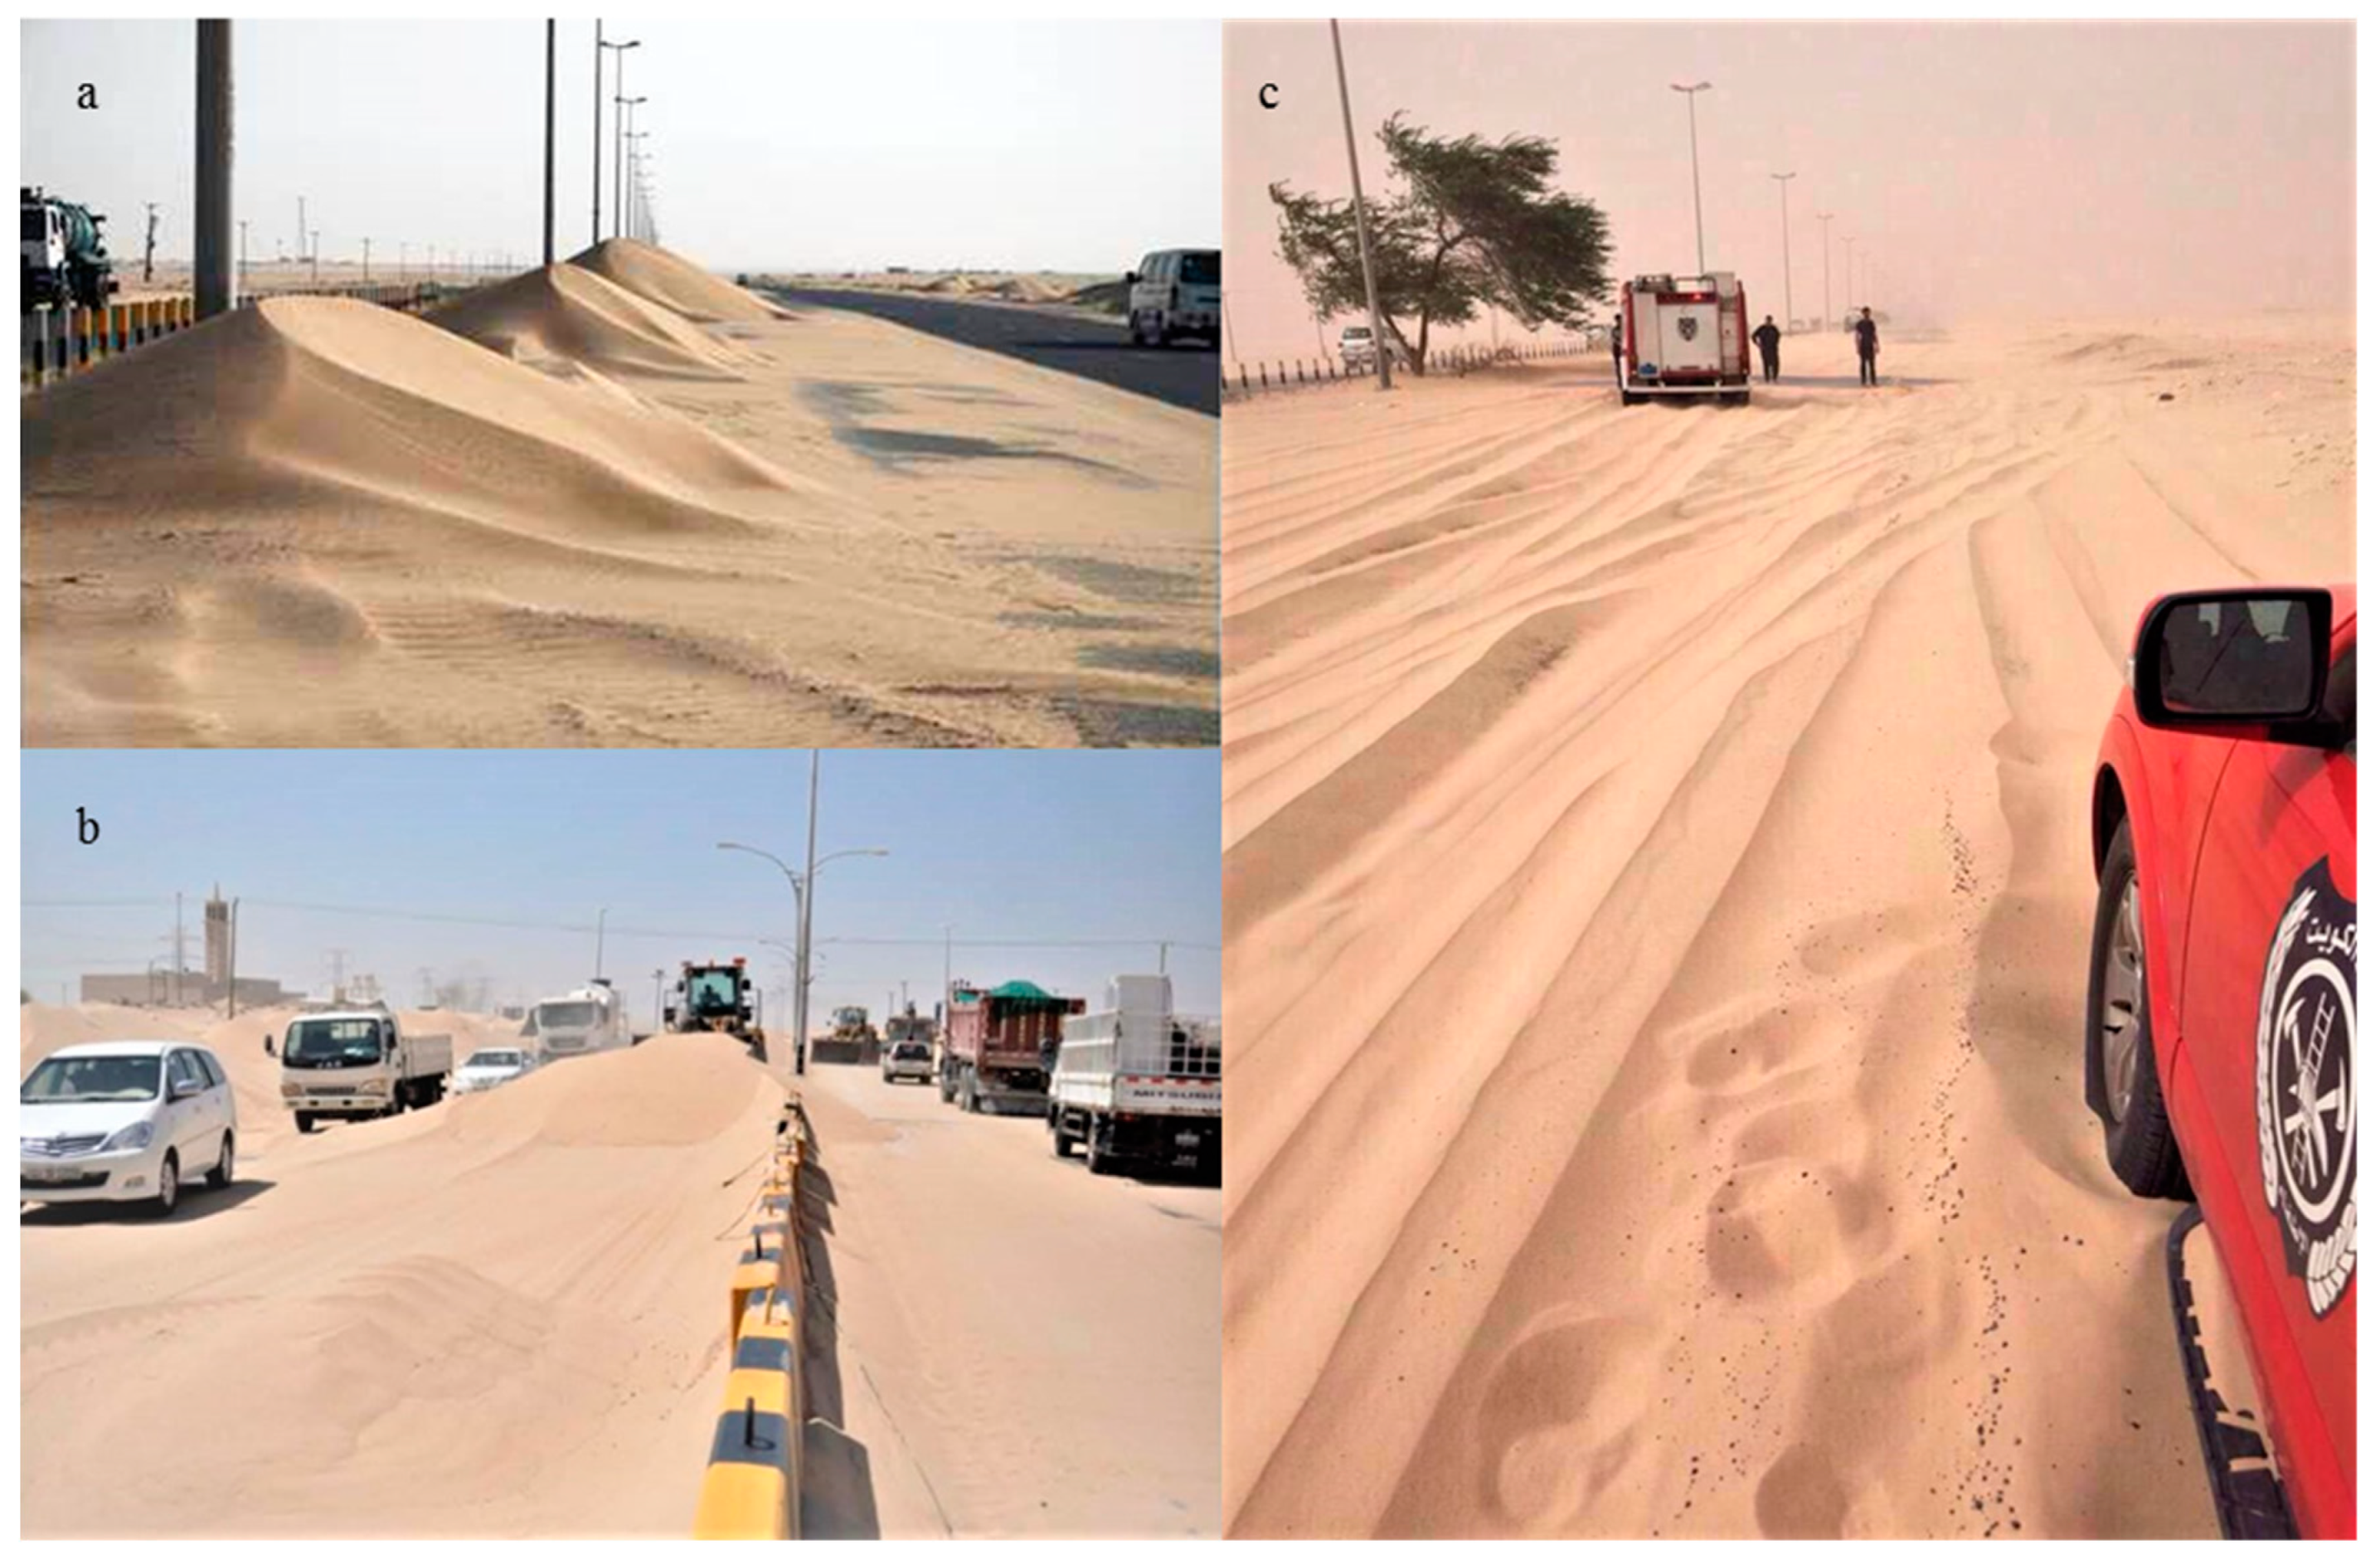
3.2.11. Sand Encroachment

Active mobile sand in Kuwait is transported dominantly from two main directions: North and Northwest [33]. Sand encroachment constitutes a major hazard to oil and gas operations, both on-roads and on-facilities. There are five major roads that lead to KOC and KGOC destinations. The total road lengths range from 33 km (Wafra–Mina Abdullah road) to 100 km (Salmi road), and the percentage of threatened road segments to total road lengths varies between 76% and 44%, respectively. Figure 10 shows a severe sand encroachment along Wafra–Mina Abdullah road leading to KGOC oil terminals and how the severity of sand encroachment constitutes a hazardous condition even to rescue operations. During 2012, a total of 347,310 m3 of sand was accumulated on KOC’s oil premises. The cost for cleanup services was estimated at 277,848 KD ($916,900), which equates to 0.800 Fils m−3 ($2.75 m−3). This cost may be a little overestimated, since 2012 had a higher than average number of SDS events; no previous data were available to validate this cost estimation.
Table 4 summarizes the SDS impact and cost for the oil sector. The total cost was estimated at KD 2,727,898 ($9.09 M), which is equivalent to KD 2,809,735 ($9.36 M) expressed at 2018 prices with a 3% annual inflation rate. The data represents that 85% of the total economic cost from SDS events on the oil and gas operations results from the drilling operation and sand encroachment activities.

3.3. Risk Assessment Matrix

The risk assessment matrix is shown in Table 5. This is a 5 × 5 matrix that combines the consequence “severity” in columns (scores 1 to 5) and the probability “likelihood” in rows (scores 1 to 5). The matrix displays the joint components of risk that were previously presented in Table 2 and Table 3. Multiplication of the scores of consequence by the probability equates to a risk index “RI” with a range of values from 1 to 25. The results indicate that the highest risk indices identified from SDS events are determined by the following three sectors: drilling operations (RI = 25), project management (RI = 20), and maintenance and support (RI = 16); sand encroachment, not a sector per se, also constituted a high risk (RI = 25), while the lowest risk index is represented by the research and development sector (RI = 6). The high-risk index category (red colour zone) indicates that the risk is intolerable and an adequate control measure should be established to bring the risk level to at least ‘medium’ before the activity is resumed. The medium risk category (orange colour zone) indicates that the activity should be performed with extreme caution and that additional mitigation or control measures should be established. The low risk category (green colour zone) indicates that the risk is tolerable and no additional control measures are required. The drilling operations and sand encroachment sectors have the ‘worst-credible’ risk index, and should therefore be lowered to risk acceptance limits by the reduction of either SDS impact severities or recurrence frequencies.

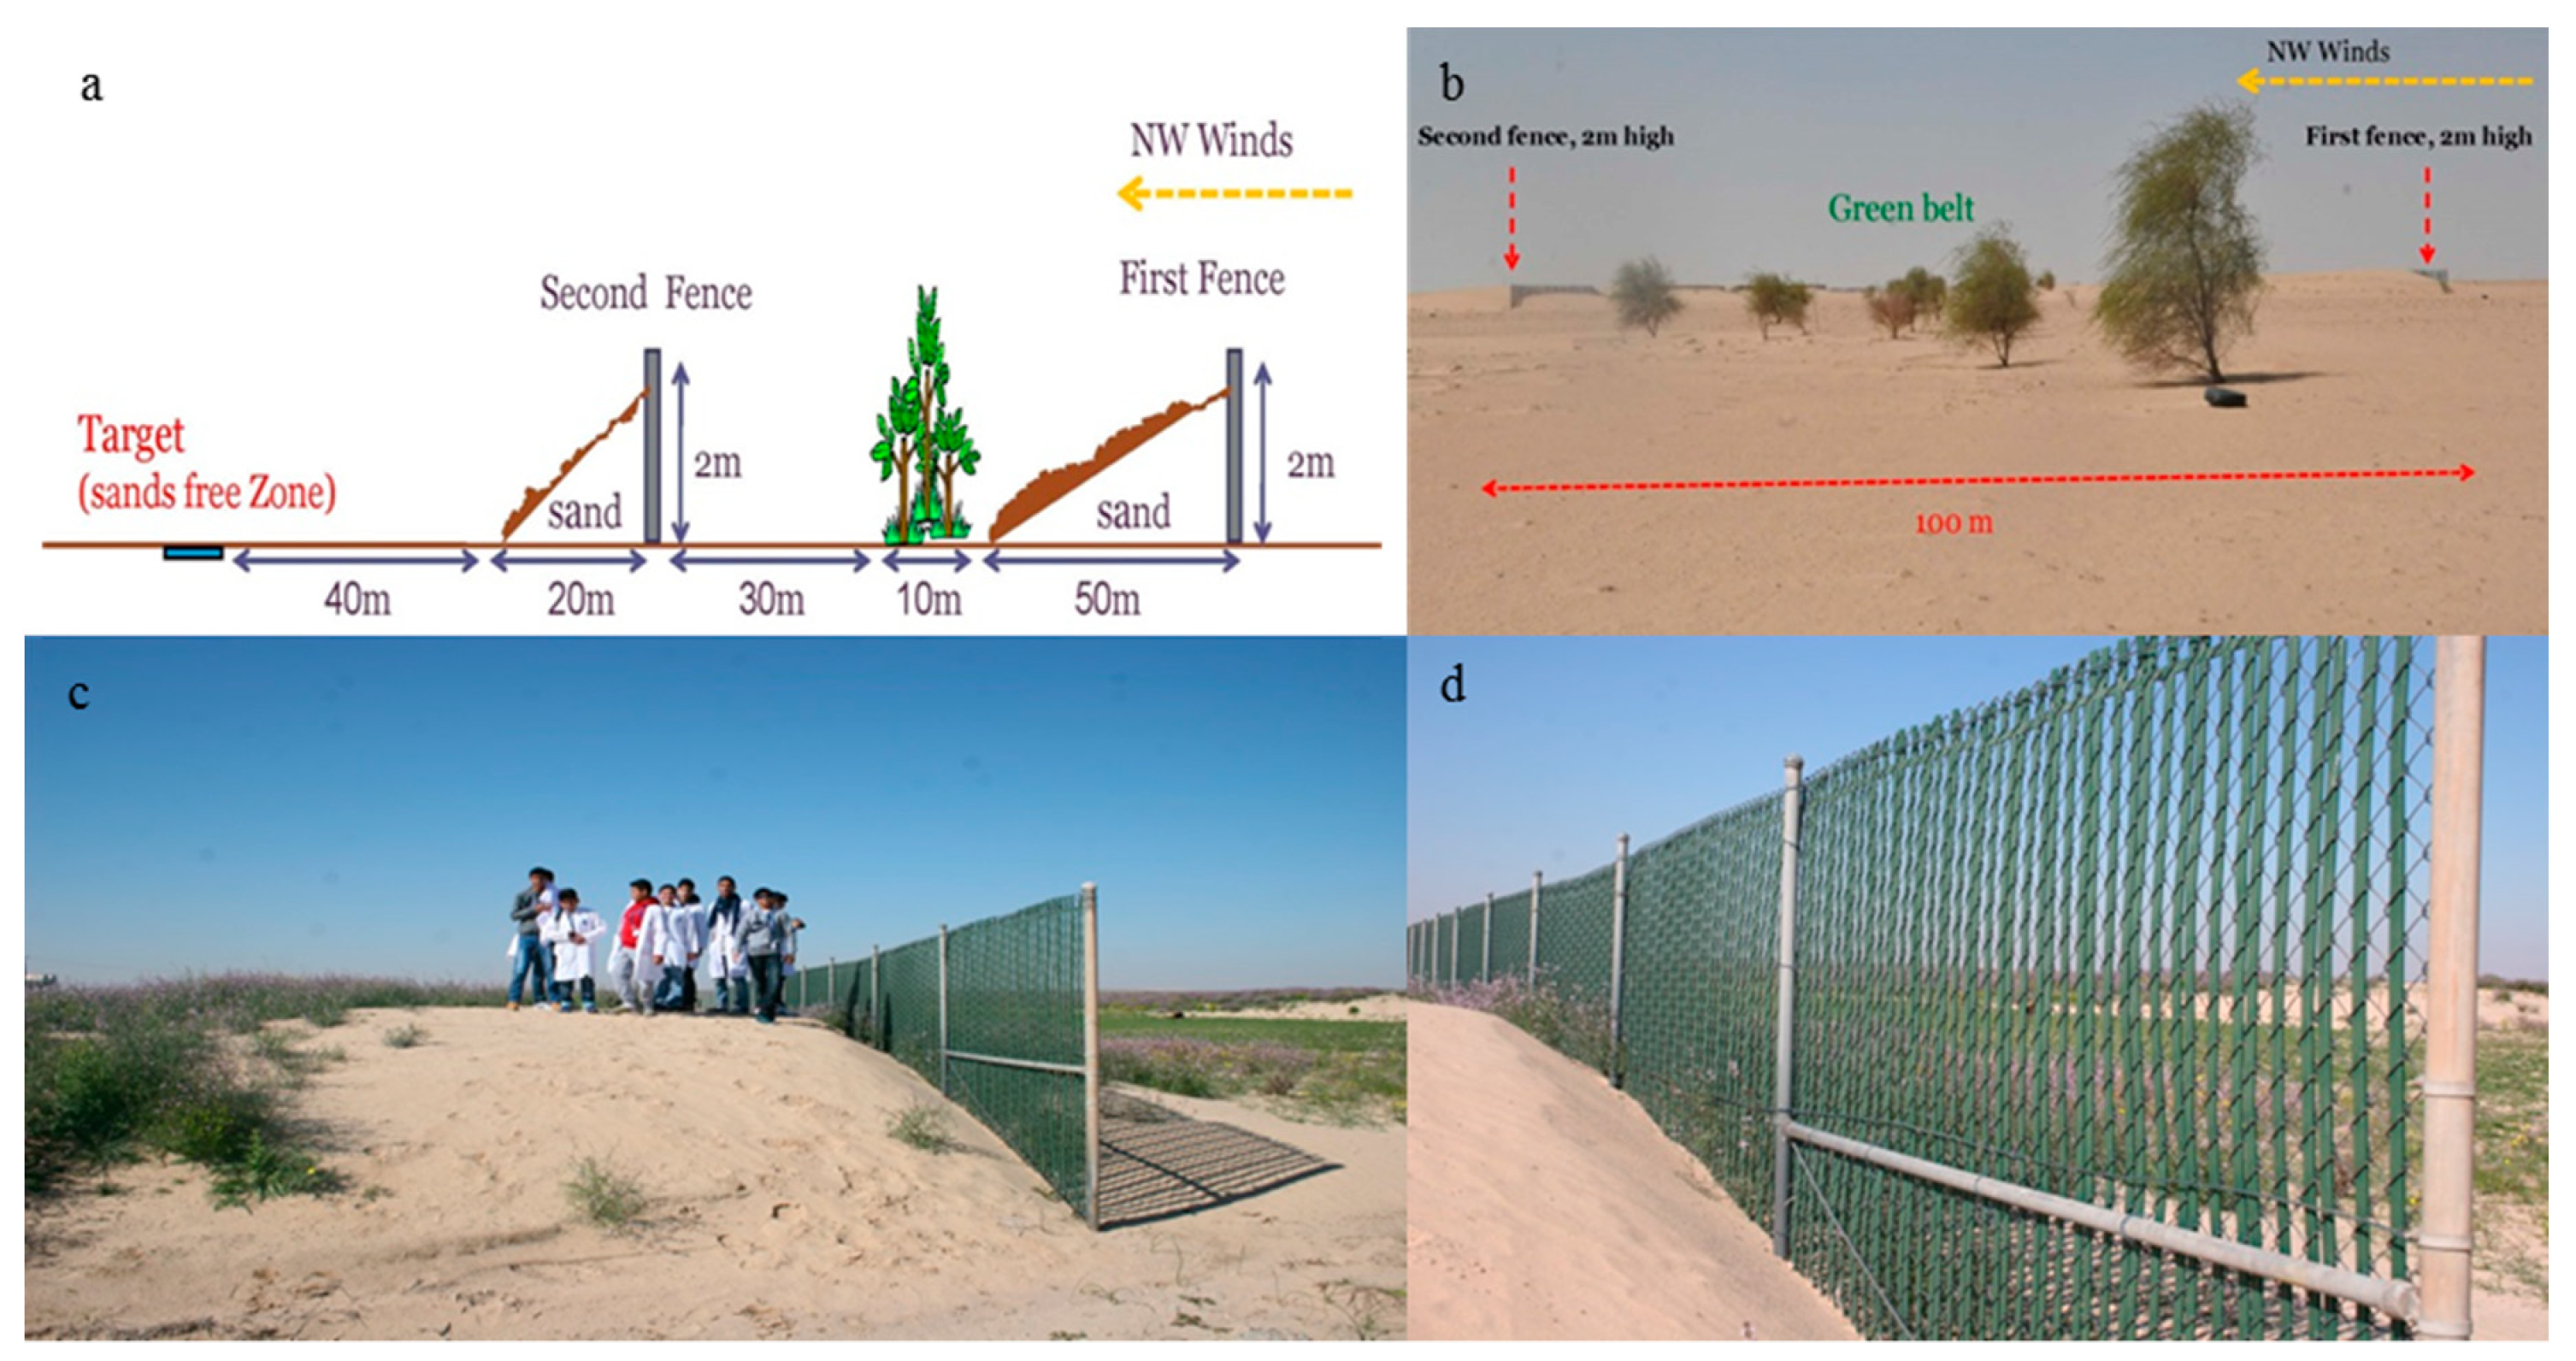
3.4. Mitigation and Control of SDS

Three mitigation and control measures are recommended to reduce the damaging impact from SDS events. Two mechanical systems and one hybrid biological–mechanical system are proposed. Table 6 describes these mitigation systems in order of priority, including their sustainability and estimated costs. The most-recommended system is an integrated biological–mechanical control system that consists of two impounding fences (2 m high, chain-link types with slats) situated 90–100 m apart with three rows of drought-resistant trees (Prosopis Juliflora and Acacia Etbaica) in the middle distance between the two fences. The total effectiveness of this integrated system is between 25 and 30 years. The unit cost of this proposed system is about 60,000 KD ($198,000) per 1 km, including chain-linked fences, trees, and irrigation for one year. The estimated cost of this system to the highest road segment under SDS threat (23.14 km of Wafra–Mina Abdullah Road) is projected to be KD 1,388,400 ($4,581,720), an amount that is equivalent to the cost of sand encroachment for five years. This system has been used effectively in the Kabd area, Kuwait (Figure 11).

4. Discussion

Measuring the cost associated with SDSs requires knowledge of the severity and the likelihood of occurrences of SDS events and their impact on the economy. SDS events of high severity may not frequently occur, such as the Red Dawn dust storm that caused major disruptions to many sectors of the economy; however, more frequent SDS of lower severity may affect many sectors of the economy. Given the aridity of Kuwait and that drylands cover most of the land surfaces in the northwestern countries surrounding Kuwait, SDS events are expected to continue because of their long-range transport. Under the environmental conditions of Kuwait (a scarcity of water supplies, including rainfall, a high wind speed, a diurnal temperature during dusty days [34], and fragile soils and degraded vegetation [35,36]), sand encroachment has led to serious economic losses. Oil fields and highways are under the threat of shifting sands [37,38]. The majority of highways are attacked by sands. With new oil exploration drillings and oil well petroleum discoveries, it is expected that soil erosion will increase. The impact of SDS events on Kuwait’s economy could be tremendous given the nation’s level of infrastructure and oil economic sector.
The sand encroachment phenomenon is a dramatic environmental problem that affects the majority of development facilities in the desert of Kuwait. Mitigating sand drift on the oil and gas industry of Kuwait is of paramount importance, since oil export compromises 90% of the government’s revenue. It was observed that the zone of severe sand encroachment extends in a northwestern–southeastern direction for about 167 km. It stretches between Al-Huwaimaliyah in the northwestern portion and Wafra in the extreme southeastern part of the country. Within this zone, mobile sand has severely encroached upon the Minagish and Burgan oil fields. On the other hand, Raudhatain, which lies in the northern part of the country, lies in the slight sand encroachment zone. The average annual amounts of sand drift in the Minagish, Burgan, and Raudhatain oil fields were estimated to be 11.7, 7.3, and 2.4 million kg m−1 per year, respectively. The Minagish area is, in general, slightly undulated. Depressions and hills are very rare in this area. Two types of surface sediments were found, namely lag deposits and mobile sand. Mobile sand sheets are dominant, and cover more than 80% of the area. The area is almost barren of vegetation, and only sparse vegetation exists; this can also be attributed to the net of oil pipes and roads. The Burgan area is generally flat, and the lag deposits occupy the central part of the Burgan oil field. The Raudhatain area is typically rich in topographic features compared with the other two study areas. The area is mainly covered by gravel lag sheets. The gravel occurrence ranges from 3 to 10%, and the rest of the lag sheet is composed of a mixture of pebbles and granules. The occurrence of mobile sand is very limited. The main factors contributing to the deposits of sand in this area are the vegetation and the net of pipelines. The vegetation acts as a natural trap for aeolian sand, and the pipelines act as windbreaks that force the sand-laden wind to deposit its load around them. The largest sand encroachment was observed during 2012 due to the high number of dust storms witnessed during this year.
Risk assessment is a useful tool to evaluate the vulnerability of systems and has been used extensively in many natural hazard applications, including droughts [39]. Potential hazards were analyzed using a risk assessment matrix to evaluate the existing conditions of the oil sectors’ vulnerabilities to the SDS events in Kuwait. The most vulnerable oil sectors impacted by SDS events were shown to be the drilling operations, production management, and maintenance, support, and reliability sectors. The research and development group of KOC spends $100,000 per year on projects to develop sustainable control measures to prevent the harmful impact of sand encroachment on its operations. This study considered the investment in strategies of mitigation and control of SDS. A hybrid system was proposed that has been used successfully since 2004 in two locations: one area is located at the Kuwait Institute for Scientific Research (KISR) Kabd Research and Innovation Station, and the second area is located at the Wafra–Mina Abdullah road heading toward KGOC and KOC oil terminals. The cost and maintenance of the system were equivalent to a 5-year projected cost from sand encroachment. The least-cost-plus-loss principle states that as prevention and control expenditures increase, the SDS damage plus impact-mitigation costs should decrease steadily. The hybrid system was used at such a level that the total cost of operation and SDS losses were optimally minimized. Stabilizing sandy soil by using such a system also contributed to a reduction in the intensity of dust storms.
All costs estimated in this study are direct costs and considered conservative because many costs were based on their previous years’ prices and were not adjusted for inflation or currency exchange rates. Moreover, opportunity costs from lost operations and penalty costs from late project delivery were not estimated. Many of the contract values of KOC’s projects are in the range of millions of KDs. The indirect costs of damages by SDSs are expected to be at least 4.5 times higher than the direct costs [22]. Absenteeism costs and motor vehicle accident costs due to SDSs, which are two significant indirect costs that add to the cost of loss of productivity, have not been considered in this study. The 33 km Wafra–Mina Abdullah road leading to KOC and KGOC oil terminals has recently been referred to as the ‘death road’, and it is considered the most vulnerable road in Kuwait with 76.6% of its length under a direct SDS damage effect.

5. Conclusions

This study provides a comprehensive and integrated approach to the assessment of SDS events: an economic impact analysis, a risk assessment, and mitigation techniques. Sand, and to lesser extent dust, were shown to be damaging and costly to the infrastructure of Kuwait. The economic cost was estimated at US$9.36 million to the oil and gas industry alone. This estimated cost is considered conservative because indirect costs were not calculated, and some oil and gas sectors provided incomplete data. The qualitative risk assessment process presented in this study provides an effective and practical tool for identifying system vulnerabilities associated with natural hazards (e.g., meteorological and geologic). The oil and gas drilling operations were shown to be the most vulnerable to SDS events with a maximum risk index equal to 25. The mitigation of sand storms using a hybrid biological–mechanical system can be a cost-saving endeavor. Given that drylands cover about 50% of Kuwait’s land surface, the hazards of SDS events constitute a high risk to the nation’s oil sector economy. The hazard implications of SDS will continue to be of considerable importance to the economy of Kuwait at large. To more accurately measure the impact of SDS on the whole economy, it would be necessary to undertake a more comprehensive analysis utilizing surveys, interviews, and more in-depth data identification and collection. This would enable a complete picture of the SDS impact and cover other sectors in the economy that have not been included in this article.

Author Contributions

A.A.-H. developed the research methodology, calculated the economic costs, provided the risk assessment matrix, and finished writing the manuscript; A.A.-D. provided significant details on dust fallout characteristics and sandstorm trajectories and revised the manuscript; R.M. developed the control and mitigation biological–mechanical hybrid control system and provided all photos and revised the manuscript; M.A.-S. guided the research theme; A.N. estimated the economic costs of SDS events and developed Figure 3; H.A.-D. provided and analyzed the meteorological data and presented the wind roses; and N.A-D. assisted in all figure and sketch diagram layouts.

Funding

This research was funded by Kuwait Foundation for the Advancement of Sciences (KFAS), grant number 2012-4401-01, and Kuwait Environment Public Authority (KEPA) (KISR EC109C).

Acknowledgments

This work has been carried out at KISR and was funded by both the KEPA through a task entitled ‘risk assessment study for dust storms’ and KFAS.

Conflicts of Interest

The authors declare no conflict of interest.

References

  1. McTainsh, G.; Pitblado, J. Dust storms and related phenomena measured from meteorological records in Australia. Earth Surf. Process. Landf. 1987, 12, 415–424. [Google Scholar] [CrossRef]
  2. Shepherd, G.; terradellas, E.; Baklanov, A.; Kang, U. Global Assessment of Sand and Dust Storms; UNEP: Nairobi, Kenya, 2016. [Google Scholar]
  3. Tozer, P.; Leys, J. Dust storms—What do they really cost? Rangel. J. 2013, 35, 131–142. [Google Scholar] [CrossRef]
  4. Thalib, L.; Al-Taiar, A. Dust storms and the risk of asthma admissions to hospitals in Kuwait. Sci. Total Environ. 2012, 433, 347–351. [Google Scholar] [CrossRef] [PubMed]
  5. Draxler, R.; Gillette, D.; Kirkpatrick, J.; Heller, J. Estimating PM10 air concentrations from dust storms in Iraq, Kuwait and Saudi Arabia. Atmos. Environ. 2001, 35, 4315–4330. [Google Scholar] [CrossRef]
  6. Middleton, N.; Yiallouros, P.; Kleanthous, S.; Kolokotroni, O.; Schwartz, J.; Dockery, D.; Demokritou, P.; Koutrakis, P. A 10-year time-series analysis of respiratory and cardiovascular morbidity in Nicosia, Cyprus: The effect of short-term changes in air pollution and dust storms. Environ. Health 2008, 7, 39. [Google Scholar] [CrossRef] [PubMed]
  7. Middleton, N.J. Desert dust hazards: A global review. Aeolian Res. 2017, 24, 53–63. [Google Scholar] [CrossRef]
  8. United Nations Convention to Combat Desertification (Secretariat). Global Alarm: Dust and Sandstorms from the World’s Drylands; United Nations Publications: Bangkok, Thailand, 2001. [Google Scholar]
  9. Martínez-Graña, A.M.; Goy, J.L.; Zazo, C. Water and Wind Erosion Risk in Natural Parks—A Case Study in “Las Batuecas–Sierra de Francia” and “Quilamas” Protected Parks (Central System, Spain). Int. J. Environ. Res. 2014, 8, 61–68. [Google Scholar] [CrossRef]
  10. Martínez-Graña, A.M.; Goy, J.L.; Zazo, C. Cartographic procedure for the analysis of aeolian erosion hazard in natural parks (Central System, Spain). Land Degrad. Dev. 2015, 26, 110–117. [Google Scholar] [CrossRef]
  11. Noy, I.; Yonson, R. Economic Vulnerability and Resilience to Natural Hazards: A Survey of Concepts and Measurements. Sustainability 2018, 10, 2850. [Google Scholar] [CrossRef]
  12. Wood, N. Understanding Risk and Resilience to Natural Hazards; US Geological Survey: Vancouver, WA, USA, 2011.
  13. Mamouri, R.-E.; Ansmann, A.; Nisantiz, A.; Solomos, S.; Kallos, G.; Hadjimitsis, G. Extreme dust storm over the eastern Mediterranean in September 2015: Satellite, lidar, and surface observations in the Cyprus region. Atmos. Chem. Phys. 2016, 16, 13711–13724. [Google Scholar] [CrossRef]
  14. Husar, R.; Tratt, D.; Ascichtel, S.; Falke, S.; Li, F.; Jaffe, D.; Gasso, S.; Gill, T.; Laulainen, N.; Lu, F.; et al. Asian dust events of April 1998. J. Geophys. Res. 2001, 106, 18317–18330. [Google Scholar] [CrossRef] [Green Version]
  15. Jugder, D.; Shinoda, M.; Sugimoto, N.; Matsui, I.; Nishikawa, M.; Park, S.-U.; Chun, Y.-S.; park, M.-S. Spatial and temporal variations of dust concentrations in the Gobi Desert of Mongolia. Glob. Planet. Chang. 2011, 78, 14–22. [Google Scholar] [CrossRef]
  16. Cao, H.; Amiraslani, F.; Liu, J.; Zhou, N. Identification of dust storm source areas in West Asia using multiple environmental datasets. Sci. Total Environ. 2015, 502, 224–235. [Google Scholar] [CrossRef] [PubMed]
  17. Al-Dousari, A.; Doronzo, D.; Ahmed, M. Types, indications and impact evaluation of sand and dust storms trajectories in the Arabian Gulf. Sustainability 2017, 9, 1526. [Google Scholar] [CrossRef]
  18. Yassin, M.; Almutairi, S.; Al-Hemoud, A. Dust storms backward Trajectories’ and source identification over Kuwait. Atmos. Res. 2018, 212, 158–171. [Google Scholar] [CrossRef]
  19. Al-Hemoud, A.; Al-Sudairawi, M.; Neelamanai, S.; Naseeb, A.; Behbehani, W. Socioeconomic effect of dust storms in Kuwait. Arab. J. Geosci. 2017, 10, 18. [Google Scholar] [CrossRef]
  20. Meibodi, A.; Abdoli, G.; Taklif, A.; Morshedi, B. Economic modeling of the regional policies to combat dust phenomenon by using game theory. Procedia Econ. Financ. 2015, 24, 409–418. [Google Scholar] [CrossRef]
  21. Miri, A.; Ahmadi, H.; Ekhtesasi, M.; Panjehkeh, N.; Ghanbari, A. Environmental and socio-economic impacts of dust storms in Sistan Region. Iran. Int. J. Environ. Stud. 2009, 66, 343–355. [Google Scholar] [CrossRef]
  22. Ekhtesasi, M.; Sepehr, A. Investigation of wind erosion process for estimation, prevention, and control of DSS in Yazd–Ardakan plain. Environ. Monit. Assess. 2009, 159, 267. [Google Scholar] [CrossRef]
  23. Ai, N.; Polenske, K. Socioeconomic impact analysis of yellow-dust storms: An approach and case study for Beijing. Econ. Syst. Res. 2008, 20, 187–203. [Google Scholar] [CrossRef]
  24. Jeong, D. Socio-economic costs from yellow dust damages in South Korea. Korean Soc. Sci. J. 2008, 35, 1–29. [Google Scholar]
  25. Williams, P.; Young, M. Costing Dust: How Much Does Wind Erosion Cost the People of South Australia; CSIRO Land Water: Glen Osmond, South Australia, 1999. [Google Scholar]
  26. Huszar, P.; Piper, S. Estimating the off-site costs of wind erosion in New Mexico. J. Soil Water Conserv. 1986, 41, 414–416. [Google Scholar]
  27. OPEC. OPEC Annual Statistical Bulletin; Organization of the Petroleum Exporting Countries: Vienna, Austria, 2017. [Google Scholar]
  28. Eller, R.; Zemore, M.; Kady, R. Standard Practice for System Safety (MIL-STD 882D and E); U.S. Department of Defense: Wright-Patterson AFB, OH, USA, 2000.
  29. Clemens, P.; Simmons, R. The Risk Exposure Interval-Too Often an Analyst’s Trap. J. Syst. Saf. 2001, 37, 8–16. [Google Scholar]
  30. Saeed, T.; Al-Dashti, H. Optical and physical characterization of “Iraqi freedom” dust storm, a case study. Theor. Appl. Climatol. 2011, 104, 123–137. [Google Scholar] [CrossRef]
  31. Brimblecombe, P. Air Composition and Chemistry; Cambridge University Press: Cambridge, UK, 1996; ISBN 0521453666. [Google Scholar]
  32. Al-Sudairawi, M.; Misak, R.; Kwarteng, A.; Abdulla, J.; Al-Dousari, M.; Gharib, I.; Zaghloul, M.; Ahmed, M.; Boctor, N.; Abdulla, O. Study of Sand Control at KOC Operation Areas of Southeast, West and North Kuwait; Final Report; Kuwait Institute for Scientific Research: Safat, Kuwait, 1999. [Google Scholar]
  33. Al-Dousari, A. Sedimentological, Geomorphological and Mineralogical Characteristics of Mobile Sand and Anchored Dunes in Northwestern Kuwait; Royal Holloway, University of London: Egham, UK, 2003. [Google Scholar]
  34. Sabbah, I.; Leon, J.-F.; Sorribas, M.; Guinot, B.; Cordoba-Jabonero, C.; de Souza, A.; Al Sharifi, F. Dust and dust storms over Kuwait: Ground-based and satellite observations. J. Atmos. Sol.-Terr. Phys. 2018, 179, 105–113. [Google Scholar] [CrossRef]
  35. Pimentel, D.; Harvey, C.; Resosudarmo, P.; Sinclair, K.; Kurz, D.; McNair, M.; Crist, S.; Shpritz, L.; Fitton, L.; Saffouri, R.; et al. Environmental and economic costs of soil erosion and conservation benefits. Science 1995, 267, 1117–1123. [Google Scholar] [CrossRef] [PubMed]
  36. Riksen, M.; De Graaff, J. On-site and off-site effects of wind erosion on European light soils. Land Degrad. Dev. 2001, 12, 1–11. [Google Scholar] [CrossRef]
  37. Al-Dousari, A.; Ahmed, M.; Al-Dousari, N.; Al-Awadhi, S. Environmental and economic importance of native plants and green belts in controlling mobile sand and dust hazards. Int. J. Environ. Sci. Technol. 2018, 1–12. [Google Scholar] [CrossRef]
  38. Ahmed, M.; Al-Dousari, A.; Al-Mutairi, M. A Study of the Cost and History of Sand Encroachment Problems in Kuwait; Final Report; Kuwait Institute for Scientific Research: Safat, Kuwait, 1999. [Google Scholar]
  39. Dabanli, I. Drought hazard, vulnerability, and risk assessment in Turkey. Arab. J. Geosci. 2018, 11, 538. [Google Scholar] [CrossRef]
Figure 1. The steps of the study.
Sustainability 11 00200 g001
Figure 2. A map of Kuwait showing the locations of oil and gas fields (green colour).
Sustainability 11 00200 g002
Figure 3. A map of Kuwait showing the five wind erosion hot spots and three wind corridors.
Sustainability 11 00200 g003
Figure 4. Dust storms (2010–2017) represented as annual (a) and monthly (b).
Sustainability 11 00200 g004
Figure 5. Wind roses for the four seasons in Kuwait (2010–2017): fall (a), spring (b), winter (c), and summer (d) (Source: Meteorological Department of the Directorate General of Civil Aviation (DGCA)).
Sustainability 11 00200 g005
Figure 6. Total sand drift (sand transport) for the three most-affected oil fields in Kuwait.
Sustainability 11 00200 g006
Figure 7. Sand deposition on an oil well (Wafra oil field, September 2018).
Sustainability 11 00200 g007
Figure 8. The oil and gas pipeline network in the Greater Burgan and Minagish oil fields (blue colour).
Sustainability 11 00200 g008
Figure 9. Shoveling encroaching sand from buried oil pipelines in the Minagish oil field (July 2008) (a), sand encroachment over oil flow lines at the Raudhtain oil field (August 2008) (b,c), and sand encroachment over a flow line at the Wafra oil field (September 2018) (d).
Sustainability 11 00200 g009
Figure 10. Shifting sand on both sides of the main road leading to Kuwait Gulf Oil Company (KGOC) (August 2018) (a,b), a rescue fire truck is stuck in the sands after a severe SDS on the south Kuwait–Wafra Road (c) (June 2015).
Sustainability 11 00200 g010
Figure 11. A sketch diagram (a) and a photo (b) of the biological–mechanical mitigation system currently in use, students standing on the other side of the fence in the Kabd area (September 2018) (c), a close view of the fence (d).
Sustainability 11 00200 g011
Table 1. The economic impact studies related to sand and dust storm (SDS) events.
Year of SDSSDS EventImpactCountrySDS Event CostReference *
12001–2014 A total of 115 SDSs Oil export, airline delayKuwait City1. $824,311 per oil tanker
2. $28,180 daily tactical airline
Al-Hemoud et al. [19]
22013Unidentified SDS Health, transportation (road and air), agriculture (cultivation and gardening)Iran, Iraq1. $1.0435 B: Iran
2. $1.404 B: Iraq
Meibodi et al. [20]
323/9/2009A single SDS ‘Red Dawn’ Cleaning, air transport, construction, commercial, absenteeism, emergency services, farming, CO2-eNew South Wales, AustraliaA$S299 MTozer and Leys [3]
42000–2005A total of 335 SDSsCleaning, Car accidents, road damage, health, schools closed, house equipment Sistan, Iran$124.85 MMiri et al. [21]
5Annual Unidentified SDSCleaning, health, electronics, car accidents, airline delay, signs, posts, irrigation Yazd, Iran$6.82 MEkhtesasi and Sepehr [22]
62000A yellow dust stormManufacturing, agriculture, construction, trade, householdBeijing, China$485.8 MAi and Polenske [23]
72002A yellow dust stormHealth, cleaning, aviation, decrease in amenitySouth Korea$5600 MJeong [24]
8AnnualUnidentified SDSHealth, households, power supply, car accidents, road maintenance, air transportSouth Australia A$23 MWilliams and Young [25]
9AnnualUnidentified SDSHouseholds interior and exterior cleaning, road maintenance, landscapingNew Mexico, USA $466 MHuzsar and Piper [26]
* Table is arranged by the reference year of publication (from recent to oldest).
Table 2. The consequence (severity) rating for impacts associated with SDS hazards (KD: Kuwait Dinar).
(1)
Negligible
(2)
Slight
(3)
Moderate
(4)
High
(5)
Very High
ImpactHuman Injury/FatalityNone Minor cuts or bruises: first aid Serious injury: time off for recovery Serious injury: long-term disability One or more fatalities
Asset DamageKD <1000 KD 1000–10,000 KD 10,000–100,000 KD 100,000–1 M KD >1 M
Non-Productive Time<8 h 8–48 h49–168 h169–336 h≥337 h
Table 3. The probability (likelihood) rating for occurrences associated with SDS hazards.
Likelihood of OccurrenceRecurrence Frequency
(1) Very Unlikely≤1/year
(2) Unlikely2–3/year
(3) Possible4–5/year
(4) Likely6–7/year
(5) Very Likely≥8/year
Table 4. The SDS economic impact on the oil and gas operations in Kuwait (2010–2017).
Oil SectorDateImpactCostCost—2018 Prices (KD)
1. Drilling Operations: KOC1/4/15–11/1/1732.5 h18,52519,081
                                      : KGOC17/4/10–10/7/15479.5 h176,706182,007
2. Production Operations1/1/16–31/12/16280 h141,096 *145,329
3. Gas Operations1/1/16–31/12/16280 h141,096 *145,329
4. Exploration1/1/16–31/12/16280 h141,096 *145,329
5. Port and Marine Operations1/1/16–31/12/16 830 h418,250 *430,798
6. Soil Remediation22/2/16–15/12/1652.5 h50,925 *52,453
7. Project Management8/4/10–28/12/162165 h1,090,978 *1,123,708
8. Water Handling1/1/16–31/12/16280 h141,096 *145,329
9. Maintenance, Supp., and Reliab.17/8/14–16/8/16 199 h100,279 *103,288
10. Research and Development1/1/10–31/12/10280 h *30,00030,900
11. Sand Encroachment **1/1/12–31/12/12347,310 m3277,848286,183
Total 5158.5 h
~645 days
2,727,898 KD
~US$9.09 M
2,809,735 KD
~US$9.36 M
* Estimated; ** Sand encroachment is not considered an oil sector per se; h: hours of non-productive time. KOC, Kuwait Oil Company.
Table 5. The risk assessment matrix associated with SDS hazards.
Consequence (Severity)
(1)
Negligible
(2)
Slight
(3)
Moderate
(4)
High
(5)
Very High
Probability (Likelihood)(1) Very UnlikelyLowLowLowLowMedium
(2) UnlikelyLowLowLow
RD
MediumMedium
PMO
(3) PossibleLowLowMedium
SR
MediumHigh
(4) LikelyLowMedium
PO, GO, E, W
MediumHigh
MS
High
PM
(5) Very LikelyLowMediumHighHighHigh
DO, SE
DO: Drilling operations; PO: Production operations; GO: Gas operations; E: Exploration; PMO: Port and Marine Operations; SR: Soil Remediation, PM: Project Management; W: Water handling; MS: Maintenance, Support, and Reliability; RD: Research and Development; SE: Sand Encroachment. Red Colour: High Risk; Orange Colour: Medium Risk; Green Colour: Low Risk.
Table 6. Mitigation and control systems designed to reduce SDS damage impacts.
PriorityEstablishedComponents Sustainability Durability Cost of 1 km Length
12004Integrated mechanical–biological: Double impounding fences (about 100 m apart and 2 m high) and three rows of drought-resistant trees in the middle High (Integrated mechanical and biological measures)High 25–30 years (currently in use)Total $198,000: $132,000 cost of 2000 m of chain-link fences + $66,000 (cost of 600 trees and irrigation for one year)
21988Mechanical: Double impounding fences (2 m high, about 50 m apart) Medium (mechanical double fences)Medium 15–20 years (field result) Total $132,000: Cost of 2000 m length of chain-link fences (cost of 1-meter length is $65)
32008Mechanical: Single porous fence, 30–40 m upwind side of the road Low (mechanical single fence)Less than 10 years (field result) Total $26,500 (cost of 1-meter length is $25)

