Article

Urban Sprawl Sustainability of Mountainous Cities in the Context of Climate Change Adaptability Using a Coupled Coordination Model: A Case Study of Chongqing, China

1
School of Construction Management and Real Estate, Chongqing University, Chongqing 400044, China
2
International Research Center for Sustainable Built Environment, Chongqing University, Chongqing 400044, China
*
Author to whom correspondence should be addressed.
Sustainability 2019, 11(1), 20; https://doi.org/10.3390/su11010020
Submission received: 23 October 2018 / Revised: 15 December 2018 / Accepted: 17 December 2018 / Published: 20 December 2018
(This article belongs to the Special Issue Urban Sprawl and Sustainability)

Abstract

:
In recent years, a noticeable contradiction has emerged between the disorderly sprawl and fragile climate environment of many cities, especially in mountainous cities. Therefore, this paper respectively constructed evaluation indicators for urban sprawl sustainability (USS) and climate change adaptability (CCA). Next, a coupling coordination degree model was used to measure the coordinated development of USS and CCA. Finally, this paper analyzed the coordinated development type of USS and CCA in the Chongqing metropolitan area from 2007 to 2017. The results of this paper show that USS and CCA have gradually shifted to coordinated development in the Chongqing metropolitan area during the study period. However, there were obvious regional differences in the type of coordinated development in the Chongqing metropolitan area. The coordinated development degree of USS and CCA in nine districts ranged from 0.635 to 0.721 in 2017. It can be divided into three types: slightly coordinated development with lagging CCA; slightly coordinated development with lagging USS; and moderately coordinated development with lagging CCA. Those districts should give priority to the use of Nature-Based Solutions (NBS), and multi-center and multi-group approaches to enhance the coordinated development between USS and CCA, which is also helpful for mountainous cities in China and other countries.

1. Introduction

Amid climate warming, extreme climate changes or natural phenomena such as droughts, floods, heat waves, debris flows, sandstorms, and fog have negatively affected the sustainable operation of cities [1,2]. Climate change and urban sprawl are equally important global environmental phenomena in the 21st century, and their relationship is becoming close. On the one hand, climate change brings many adverse effects on urban systems, hindering the sustainable development of socio-economic-ecological systems [3,4]. Climate disorder has increased extreme weather and meteorological events, with significantly effects on areas with high concentrations of population and material assets [4,5,6]. On the other hand, urban sprawl can increase traffic flow, destroy habitats of animals and plants, and increase energy consumption, making climate change more serious [7,8,9]. In light of social and economic development, modern metropolitan areas are expanding, and the population base of cities is increasing. Unreasonable urban planning and land use patterns lead to the decline of urban climate change adaptability. Therefore, ways to urban sprawl sustainability while adapting to climate change have become a key issue in urban sustainable development.
Mountainous cities are cities that are distributed mainly in mountainous areas, hills and rugged plateaus, which have different urban morphologies and ecological environments than plains and plateau cities [10]. Constrained by their own unique geological, hydrological, land, ecological environments, and natural resources, mountain cities are characterized by high sensitivity, weak compressive capacity, and poor self-adaptability [10,11]. In specific times and spaces, compared with other types of cities, mountainous cities are more vulnerable to climate change. And as western mountainous cities are in a period of rapid urban sprawl—affecting urban populations, spaces, economies, and other aspects—the impacts of climate change are even more serious. Therefore, the coupling relationship of climate change adaptability and urban sprawl sustainability in mountainous cities has become an important aspect of current urban sustainable development research.
Coupling is a concept derived from the physical relationship between two (or more) subjects [12]. For example, when two pendulums are connected to a spring, their vibrations fluctuate and interact with each other. This interaction is called pendulum coupling. From an ecosystem perspective, coupling refers to the interaction, mutual evolution, and subsequent development of two or more system elements (or subsystems) [12]. Similarly, the phenomenon of interaction and mutual evolution between urban sprawl and climate change systems can be called urban sprawl–climate change coupling. It means that the population size, industrial composition, spatial structure, and social development level of an urban sprawl system interacts with climate change factors such as atmosphere, water, and energy. In the 1990s, Grossman, Kruger, Shafik, Banderyapadje, and Panayotto defined the Environmental Kuznets Curve (EKC), which laid a theoretical foundation for further research in related fields [12,13]. Scholars initially explored the mechanism of the interaction of urban sprawl–climate change system, including the feasible path of their coordinated development. Population growth, economic development, energy consumption, and spatial expansion during urban sprawl have caused coercion on climate change [14,15,16]. At the same time, climate change constrains urban sprawl through population expansion, urban infrastructure, energy activities, and policy intervention [4,17,18,19]. The sprawl of mountainous cities is a double-edged sword for climate change. On the one hand, urban sprawl helps optimize industrial structure, improve energy consumption, and improve climate change emergency management efficiency [8,20]. On the other hand, urban sprawl increases the consumption of resources, reduces the area of urban green space, destroys the ecological balance, and aggravates the degree of climate change [9,20]. Therefore, insisting on “low carbon, ecological, green” development is an important way to alleviate the contradiction between urban sprawl and climate change.
Scholars drew on the methods of environmental science, ecology, and physics, such as the coupling coordination model, the gray correlation method, the PSR framework model, and system dynamics to discuss the coupling relationship between urban sprawl and the ecological environment, which is helpful to analyze the coupling mechanism between urban sprawl and climate change. Some scholars have summarized the spatial distribution characteristics of the coupling degree between urban sprawl/urbanisation and the environment in 34 provinces (cities and districts) in China from the national level [20,21,22]. Some scholars have taken the domestic urban agglomeration as their research object to analyze the coupling relationship between urban sprawl/urbanisation and the environment in Chengdu-Chongqing region, Beijing-Tianjin-Hebei region, the Pearl River, and the Yangtze River Delta region [23,24,25,26]. Other scholars have conducted research at the provincial level to evaluated the degree of them in Beijing, Shanghai, and Chongqing [12,13,27,28]. Nevertheless, those studies have some shortcomings in the study. First, although scholars have discussed the coupling and coordinating relationship of urban sprawl–climate change. However, due to the diversity of urban types, the huge gap in urban sprawl process and the complexity of ecological environments, the coupling and coordinating relationship between urban sprawl and climate change has different characteristics in different types of cities. Previous studies have concentrated on coastal plain cities or resource-based cities. Limited research exists on mountain areas with lagging urban sprawl that are vulnerable to climate change. Second, empirical studies at the national and regional levels have mainly explored the coupling mechanism between urban sprawl and the ecological environment. However, there is a certain difference between climate change and the ecological environment. Limited research takes note of this and further explores the coordination development between urban sprawl sustainability (USS) and climate change adaptability (CCA). Therefore, it is necessary to deeply analyze the the coupling and coordination relationship between USS and CCA in mountainous cities in China to promote coordinated development in both systems and ensure the sustainability of urban economies and society.
The remaining sections of this paper are summarized as follows. After introducing the background to this paper and the analysis of the coupling mechanism between urban sprawl and climate change, the coupling coordination degree model was used to measure the coordinated development of USS and CCA. The results are briefly described in Section 4, and discussed in detail in the next section. Finally, the conclusion of this paper is summarized, and the policy implications are outlined.

2. Analysis of Coupling Mechanism between Urban Sprawl and Climate Change

A city is a typical social-ecological system, in which various complex elements with and depend on each other [29]. In the process of social and economic development, mountainous cities are expanding, their already large urban population bases are growing, and unreasonable urban planning and land use patterns have led to the decline of CCA [30]. Climate change, in turn, seriously affects the sustainability of urban sprawl. Meanwhile, mountainous cities have their own complex vertical topography and landforms. Cold winters and hot summers, high humidity, and high static wind rates are the main climatic characteristics of mountainous cities [10]. Compared with cities that are situated on plains, disorderly climate change in mountainous cities has a greater effects on urban infrastructure, old buildings, water resources, and the ecological environment.

2.1. Climate Change Affects Urban Sprawl

Natural elements such as temperature, water and landforms have formed different climate systems through interactions between different geological ages, playing a corresponding function at different times. According to the Intergovernmental Panel on Climate Change (IPCC) in its report, global climate change is clearly occurring, and its impacts on cities are increasingly evident, especially in developing countries [17]. These influences include population sprawl, social structural changes, industrial restructuring, and spatial structure changes, all of which ultimately affect the sustainability of urban sprawl [30]. In the following subsections, the impact of climate change on urban sprawl factors such as population, infrastructure, and energy is analyzed.

2.1.1. Climate Change Affects Urban Population Sprawl

First, climate change has an impact on the economic, social, and natural environment that is closely related to urban residents. Climate change has changed the demand for resource production, goods, and services, and has affected the economic conditions that support housing [4]. In turn, these developments have affected the spread of urban populations. At the same time, climate change affected energy transmission, buildings, urban infrastructure, and industrial structures, causing changes to living environments, affecting the spread of urban populations [1,16,30]. Human habitats are currently experiencing environmental problems, including water and energy shortages, waste disposal, and transportation, which may be exacerbated by extreme weather [1,2,25,31]. According to the IPCC in its report, the occurrence of heavy precipitation events in most areas has increased the risk of flooding and damage to human settlements [17]. Second, climate change has adverse effects and risks on urban human health [4,32]. For example, due to the rapid development of the Chongqing metropolitan area, the urban heat island effect has been strengthened, showing that the city center has more hot days, higher extreme temperatures, longer temperature durations than the suburbs [33]. Coupled with the high population density of the city, the air pollution situation in the city is more serious, which further aggravates the harm of heat waves to human health. Finally, the meteorological conditions caused by climate change are also the cause of the increase in haze weather, including static weather, thin mixed layers, and few days of precipitation. Haze weather phenomena can have indirect negative effects on the health of residents, such as exacerbating chronic diseases and changing the immune structure of the human body [33,34]. In short, climate change has many impacts on the population, leading to disordered population migration, which also leads to more serious social problems.

2.1.2. Climate Change Affects Urban Infrastructure

Increasingly, extreme climate and weather events caused by climate change have damaged urban transportation, energy, and municipal infrastructure and caused significant economic losses [35]. For example, climate change has led to a more uneven distribution of precipitation, and local heavy rains within cities have increased, which poses challenges to urban drainage design standards and safe operation of urban infrastructure [36,37]. Urban infrastructure is closely related to the natural environment and is vulnerable to climate factors [37,38]. For example, climate change has a profound impact on the construction and maintenance of transport infrastructure. Especially in mountainous cities, the risk of debris flow and landslides should be considered when constructing transport infrastructure. Regarding waterway transportation, for example, rising sea levels have made the sediment entrance of rivers retroactive, increasing the cost of inland waterway transportation. In addition, the construction of urban infrastructure in China lags behind other developed countries. Subway density in Beijing and Shanghai is only about a quarter of subway density in Singapore and London. Road density in Beijing and Shanghai is less than a quarter of New York and London [35]. In sum, climate change has a greater impact on infrastructure in cities than outer metropolitan areas. However, the vulnerability of urban infrastructure to climate change has seriously affected urban sprawl processes, including population mobility, industrial structure, and spatial structure. Once urban infrastructure is damaged by climate change, it will inevitably have an important impact on urban sprawl.

2.1.3. Climate Change Affects Energy Activities

Changes in meteorological conditions caused by climate change have specific impacts on energy activities. Changes in precipitation affect hydroelectric power generation; low temperature and high temperature weather affects household energy demand; frequency and intensity of drought and flood change energy demand for irrigation and drainage irrigation; and extreme weather events cause interruption of energy supply [34,35]. In addition, climate variability will increase under climate change conditions, thereby increasing the annual variability of regional carbon uptake. Due to the increasing number of extreme weather events and other disturbance events, there is a large uncertainty in the soil organic carbon pool and its stability. This impacts the effectiveness of energy-related policies, such as energy conservation measures and greenhouse gas emission reduction measures. However, the energy activity is an important input factor for urban sprawl [5,36,37]. Energy activities have significant effects on urban population sprawl, industrial structure adjustments, and spatial layouts [37,39]. For example, the energy consumption of primary and tertiary industries is lower than that of secondary industries, which require greater energy consumption. Therefore, changes in energy activities will affect changes to industrial structures. Compared with other developed countries, China is in the middle of industrialization, the proportion of the secondary industry is too large, about 38.9%, the proportion of the tertiary industry is only about 56.3%, while the proportion of the tertiary industry in the United Kingdom, the United States and France is about 78% [20]. With the further development of China’s industrialization, the energy structure and industrial structure also need to be adjusted, which ultimately affecting the sustainability of urban sprawl.

2.2. Effects of Urban Sprawl on Climate Change

Urban sprawl has the following characteristics: low density, decentralized, a single form development, residents tend to depend on motor vehicles, and consumption of large amounts of agricultural and ecological land [20,40]. Amid further acceleration of urban sprawl processes, it has brought some serious impacts on the city’s environment, economy, and society, such as waste of land resources, traffic congestion, low population density in built-up areas, spatial isolation of the rich and the poor, declining environmental quality, and out of control of urban and rural development space [41]. Next, we analyzed the impact of urban sprawl on climate change from the aspects of population, economy, and space.

2.2.1. Impact of Population Sprawl on Climate Change

Cities are highly concentrated populations and economic activities, and are also highly concentrated areas of carbon emissions, with huge greenhouse gas emissions. Urbanization drives economic development and large-scale migration of people to cities, resulting in a multiplication of greenhouse gas and pollutant emissions [41]. Population sprawl has changed people’s production methods, living styles, transportation methods, and consumption concepts. The dependence of urban population on modern architecture and comfortable transportation has not only increased the consumption of fossil fuels, but also increased greenhouse gas emissions, which in turn has aggravated climate change. First, changes in population size have a climate effect. Under the limited ecological carrying capacity, the population size continues to increase, and the most direct impact is the increase in the total amount of carbon dioxide and other greenhouse gases produced [16]. Second, changes in population distribution have an impact on climate change. Urban sprawl leads to dispersed living, increased dependence on private cars, and increased traffic flow, resulting in excessive energy consumption and greenhouse gas emissions [39,40]. As population density in the central area of a city decreases, the average travel distance for urban residents becomes longer, increasing energy consumption and greenhouse gas emissions through urban traffic [40]. Massive emissions of greenhouse gases in a concentrated area can cause local heat island effects, exacerbating climate change. Finally, demographic changes have a climate effect. The population structure is the distribution of various natural and social demographic characteristics of a country or region, including the natural structure and social structure of the population. And the demographic changes are mainly reflected in the impact of population aging and changes in family patterns on climate change. An aging population will lead to a smaller family size, an ageing structure of the working population, carbon intensity of energy consumption, and increased carbon emissions per capita [16,34]. The miniaturization of the family size means an increase in the number of households and a decrease in the size of households, resulting in an increase in per capita carbon emissions. In addition to being subject to objective conditions, the impact of population on carbon emissions is also subject to subjective awareness, that is, human behavior has a large impact on carbon emissions. In general, population sprawl affects climate change primarily through carbon and greenhouse gas emissions.

2.2.2. Impact of Economic Sprawl on Climate Change

The historical process of urban sprawl in western developed countries shows that urban sprawl is a market-oriented self-organization process under economic development and population growth. There is a close relationship between urban sprawl and the adjustment of urban economic structure, and the impact of changes in economic structure on climate change is also obvious [20,26]. The rationality of the economic structure is directly related to climate change, environment, and ecological improvement. The economic structure is mainly characterized by the industrial structure, and the so-called industrial structure is the three-industry classification method of the global general classification standard [20]. The primary industry mainly includes agriculture, forestry, animal husbandry, and fishery; the secondary industry includes mining, manufacturing, electricity, gas and water production and supply, and construction; and the tertiary industry includes all other industry except the primary and the secondary industry [20]. The adjustment of the industrial structure is also the change in the proportion of the three industries, and the changes in the three industries will directly affect the climate change. The unreasonable industrial structure will release a large amount of waste heat and harmful gases and aerosol particles, causing air pollution. At the same time, it will change the transparency of the atmosphere and the radiant heat energy budget, providing abundant condensation nuclei for the formation of clouds, thus changing the local climate. Reasonable determination of the economic structure makes it a deterrent to urban sprawl to ease the pressure of climate change.

2.2.3. Impact of Spatial Sprawl on Climate Change

Urban sprawl caused changes in the urban spatial form including floor area ratio, building density, building height, and street space, changing space-atmosphere material and energy exchange, affecting local climate, causing regional meteorological and environmental problems [42,43]. Urban sprawl has replaced various types of buildings and transportation infrastructures with natural surfaces, changing land use and coverage, which will change the dynamics of the local atmosphere, thermal structures, and their specific pollution dynamics. With the massive expansion of the population to the city, the original suburban natural environment has undergone fundamental changes. Vegetation-covered pastures are paved with impermeable building materials, and low farmhouses on flat or gentle slopes are replaced by tall buildings and crosswise valleys, which greatly change the nature of the underlying surface and the state of the natural environment. The harmful gases and dust in the air above the city are high, and the turbidity of the air is large, so the sunshine hours and the direct solar radiation intensity are less than four neighbors. However, due to the large amount of waste heat released from the city and the special nature of the underlying surface, the indoor temperature is significantly higher than the surroundings. The isotherms of the horizontal temperature field form a closed circle centered on the city. This kind of urban high-temperature zone is ubiquitous, like an island on the sea surface corresponding to a closed contour, so it is called “urban heat island” [31,34,42]. Especially in Chongqing, a mountainous city, because of the great difference in the height between urban buildings and street canyons, it is just like the cliff canyons, which makes the roughness of the underlying surface much higher than that of the wild suburbs. The stability of the atmosphere over the city is poor, and the intensity of air turbulence is large. Although it is conducive to the vertical dilution and diffusion of air pollutants, the surrounding heat island auxiliary circulation causes the diffused air to flow back into the urban area, further aggravating the urban heat island effect. With the disorderly sprawl of cities, the heat island effect is also increasing, and the area is gradually expanding, which greatly increases the pressure on cities to adapt to climate change.

3. Materials and Methods
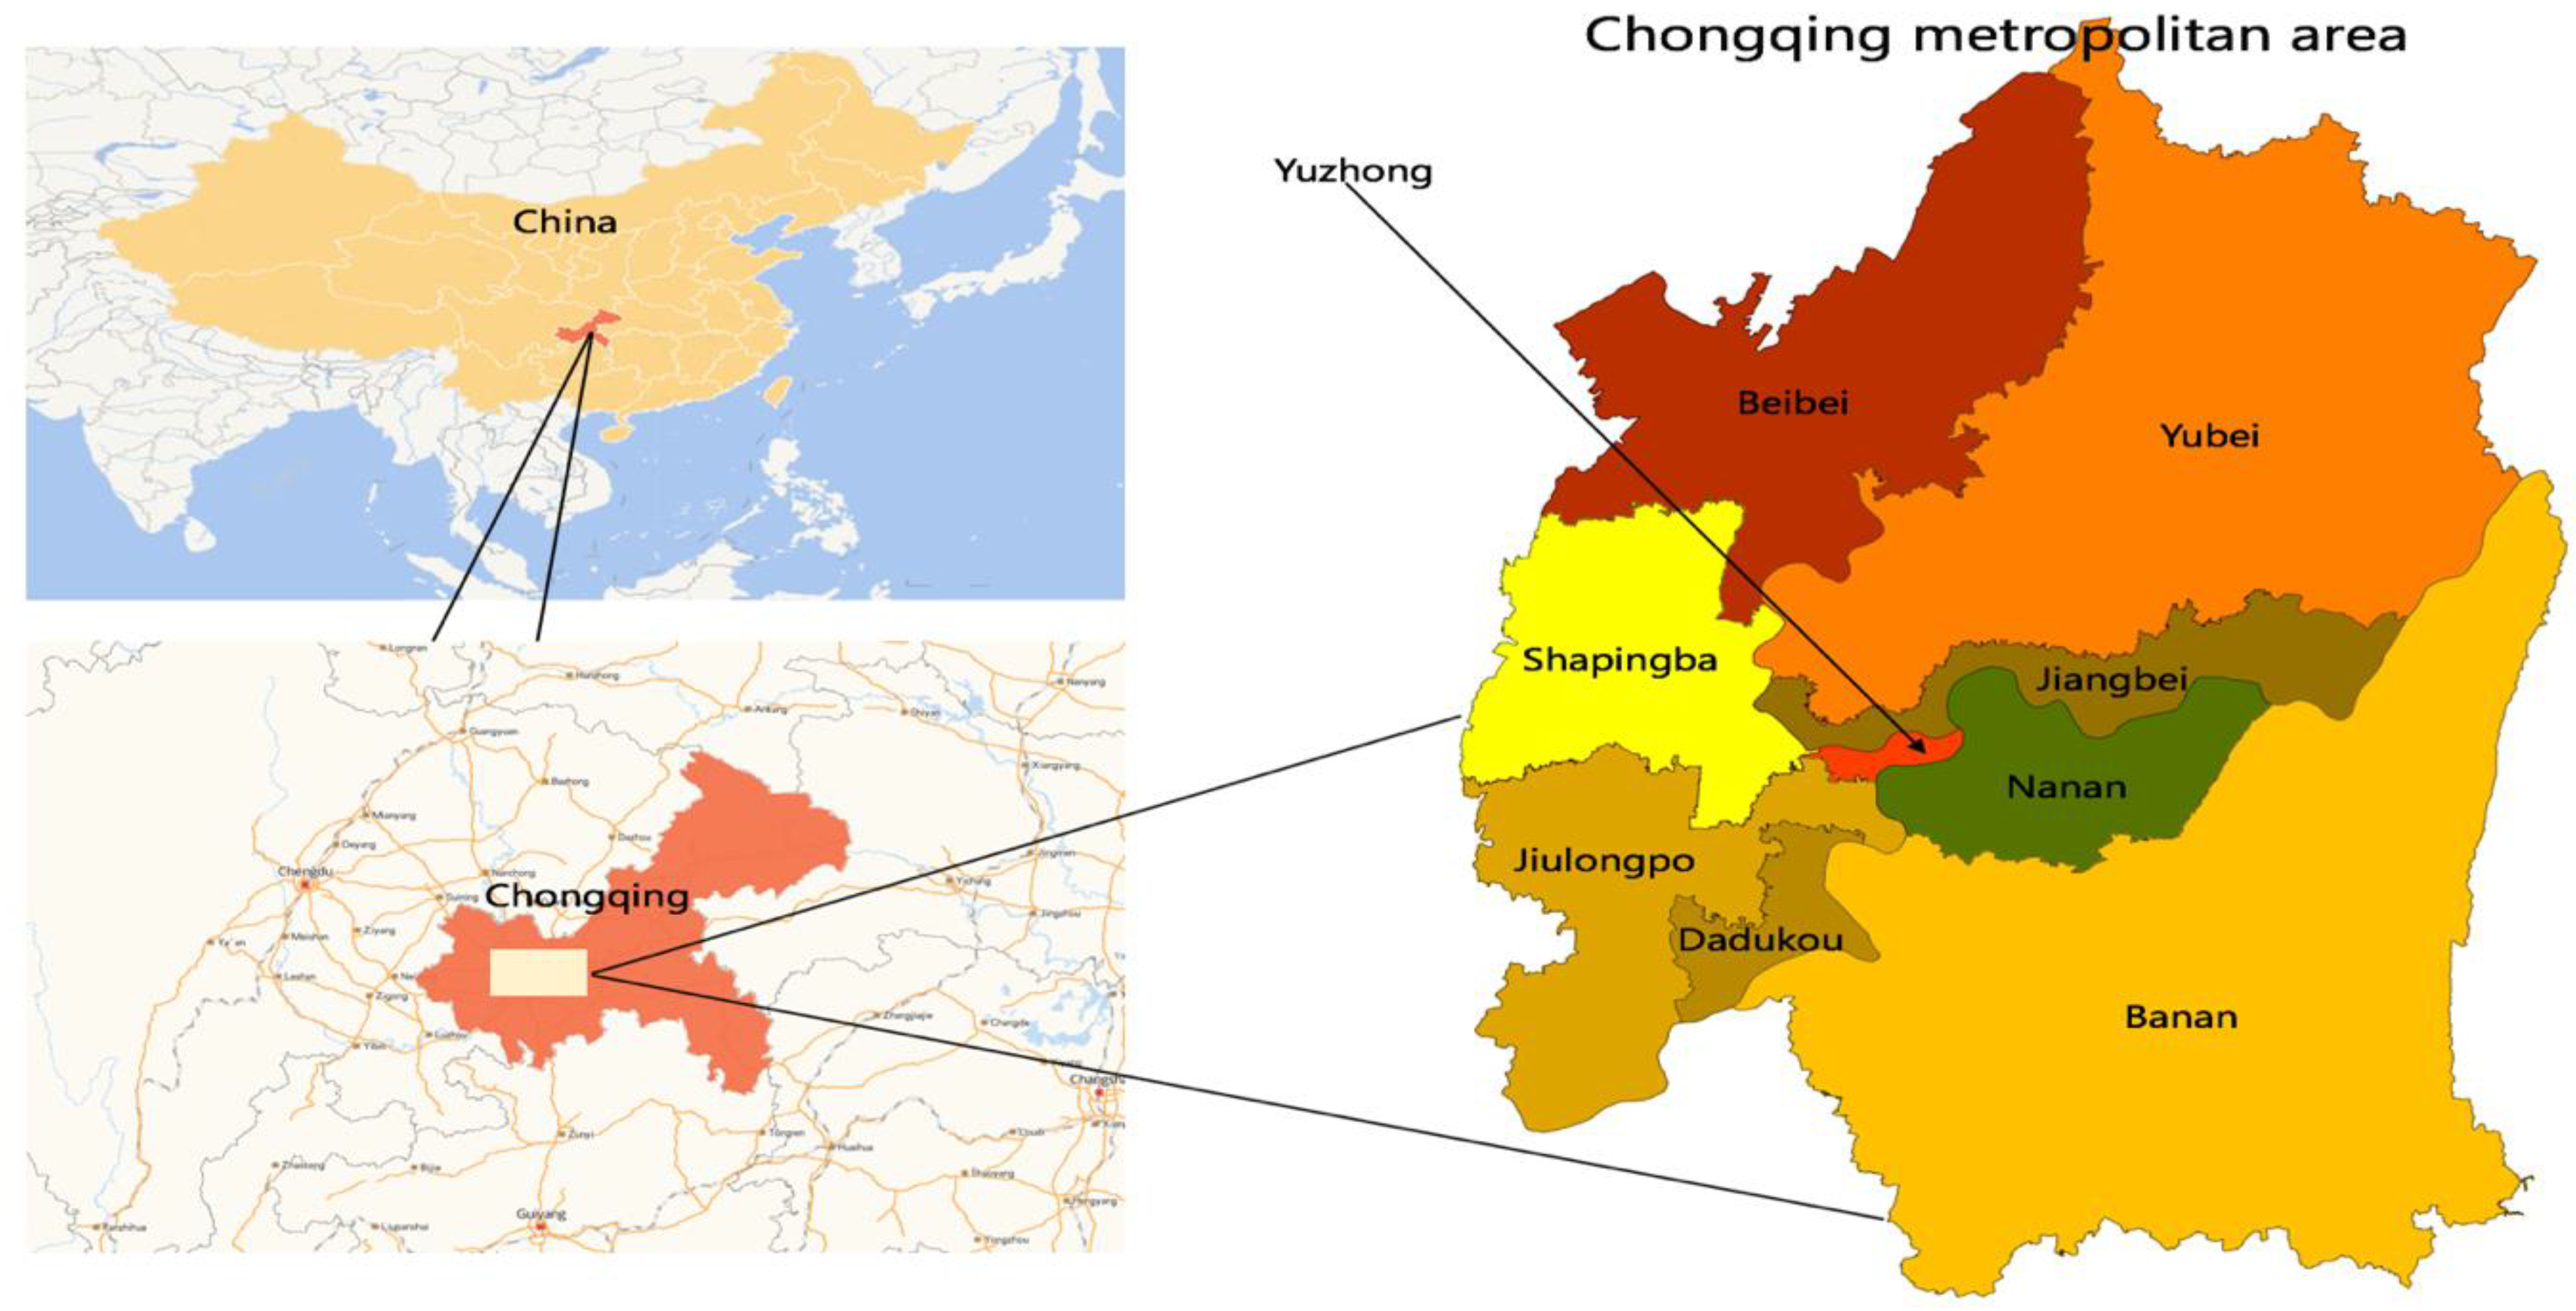
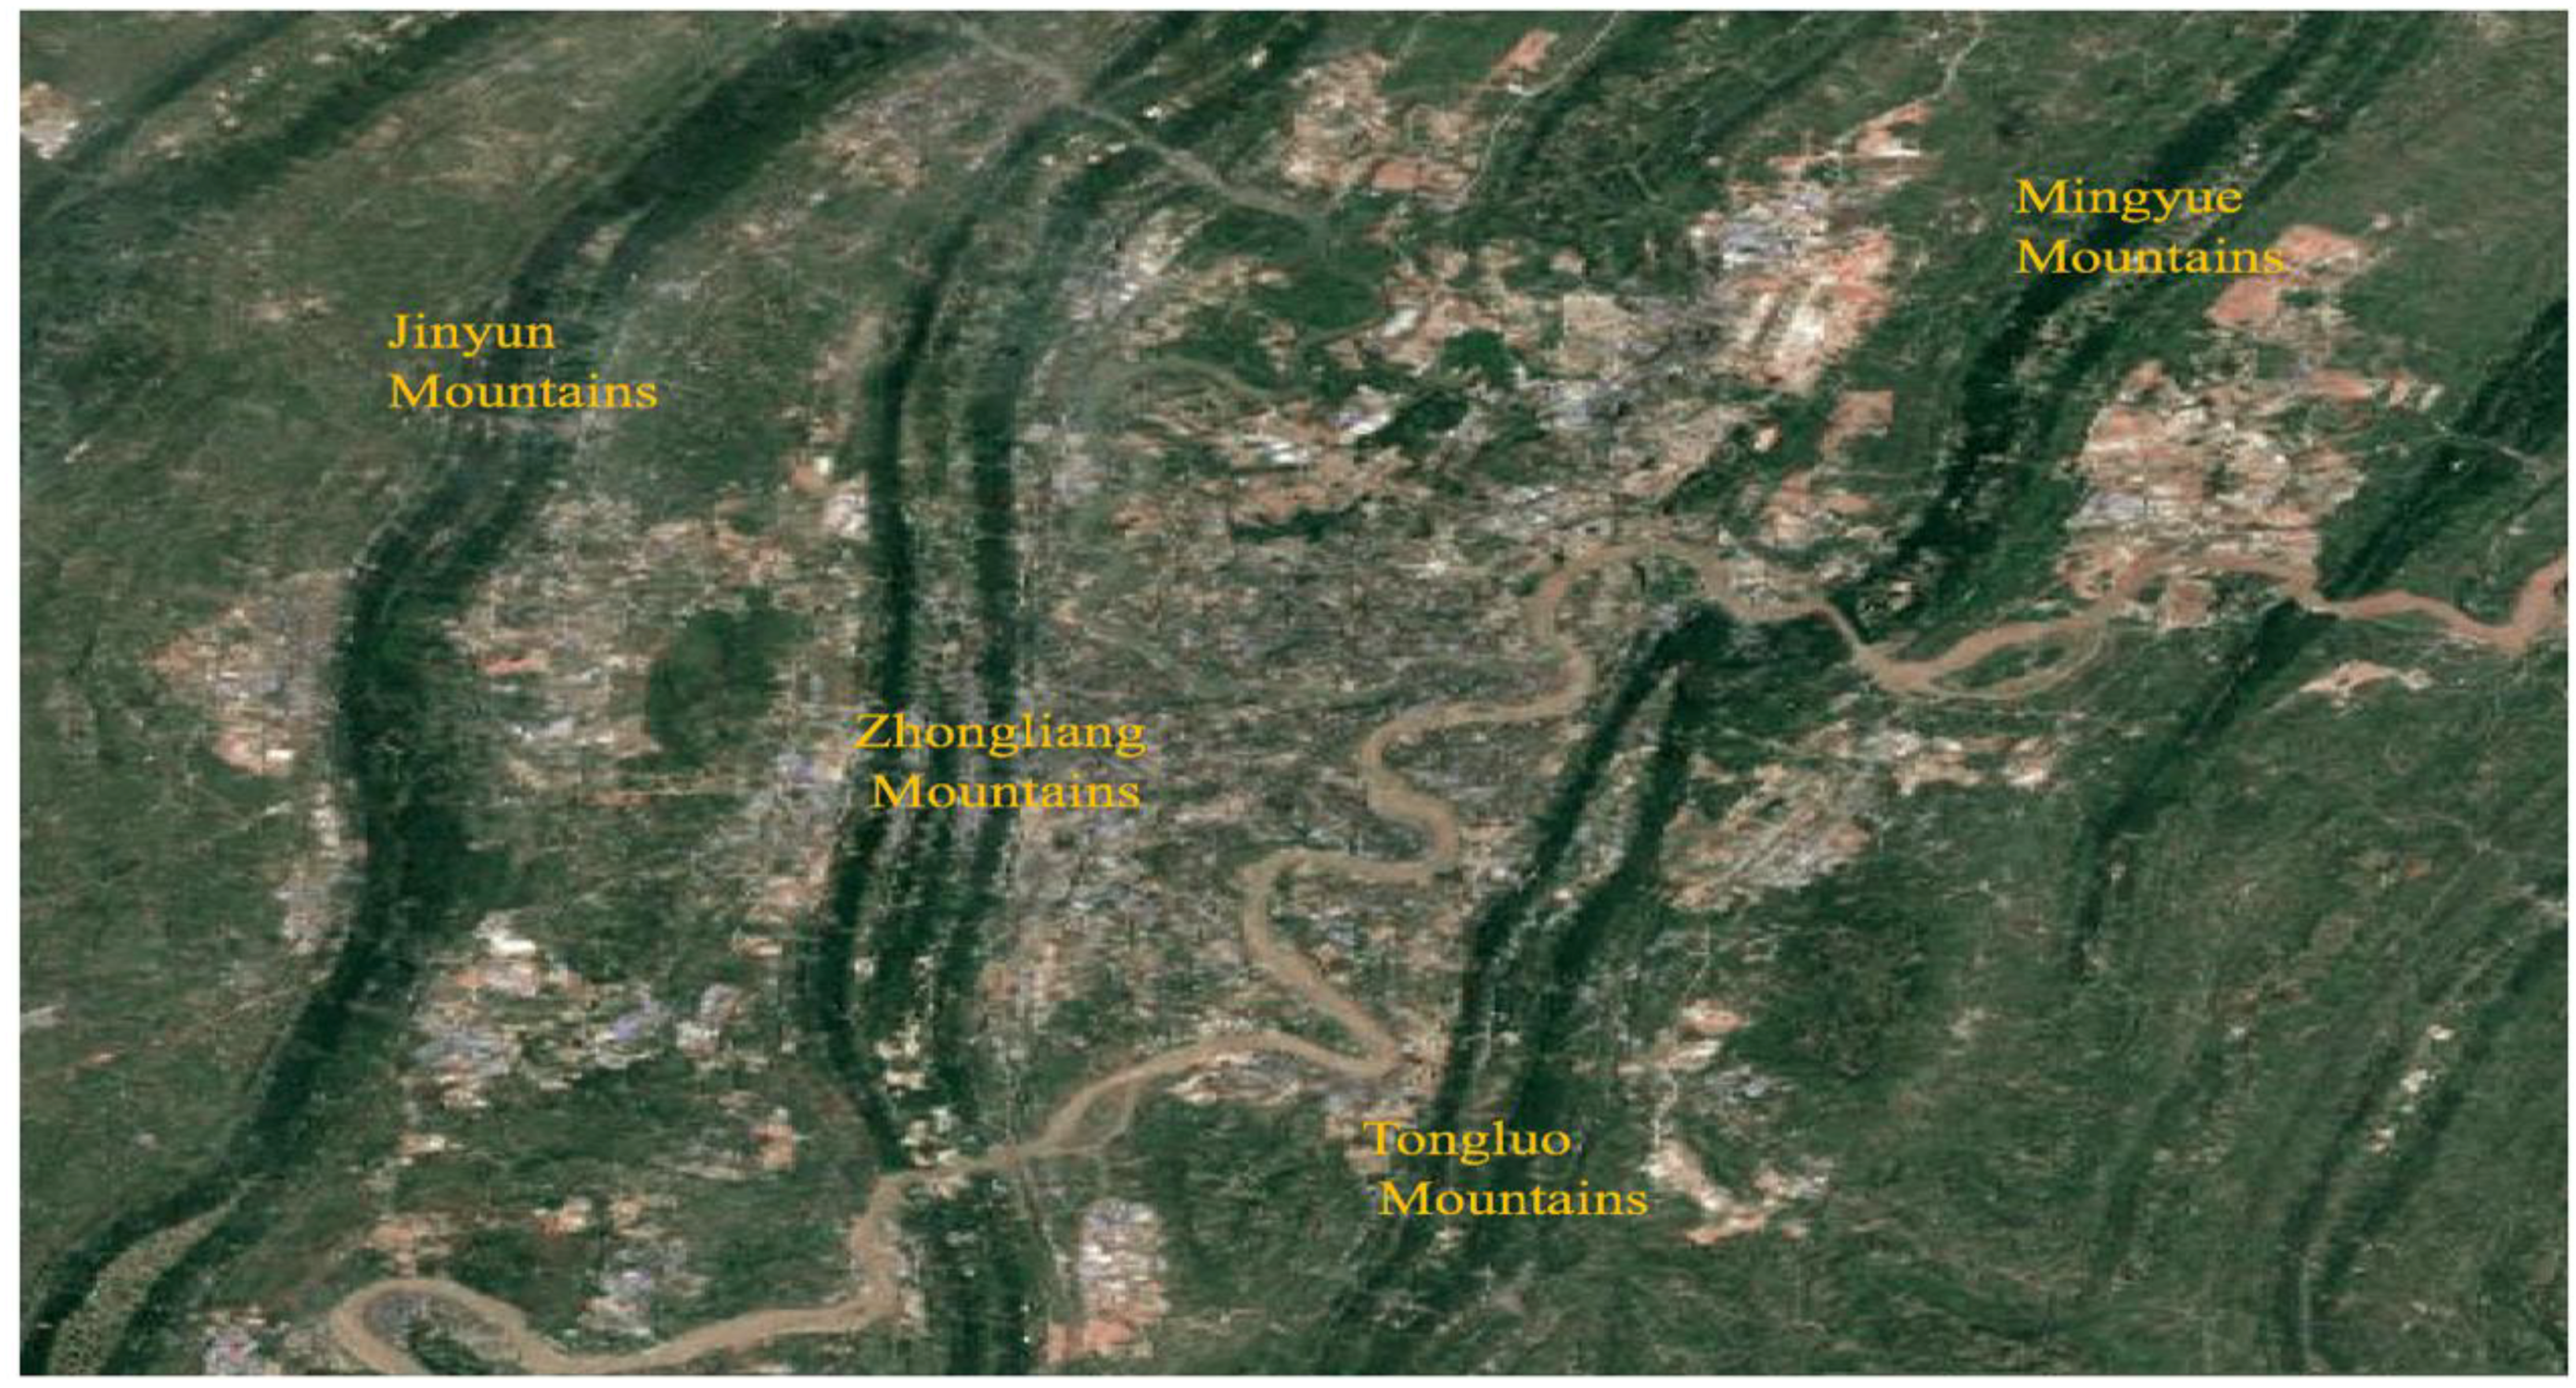
3.1. Study Area

Chongqing is located in the southwestern China on the upper reaches of the Yangtze River, with an area of 82,400 square kilometers (Figure 1). The surface of Chongqing is undulating with a wide range of height differences. The highest altitude in Chongqing is 2792 m, and the lowest altitude is 73 m. Chongqing is a city with complex geomorphological types and various types of landforms. On the whole, it has the characteristics of continuous distribution of mountains and waters. The topography of Chongqing is mainly mountainous and hilly, supplemented by plains and valleys. Mountainous areas account for about 60% of the city’s area; hills account for about 30%; and plains account for about 10% [31]. The geomorphology of Chongqing is deeply controlled by geological structure. Except for the Ta-pa Mountains, mountain ranges around the city are distributed in parallel, mostly in northeast to southwest. The mainly mountain ranges in Chongqing are the Jinyun Mountains, the Zhong Liangshan Mountains, the Tongluo Mountains and the Mingyue Mountains (Figure 2). Chongqing is a typical mountainous city with a large area and a wide distribution of slopes. In China, Chongqing is known as the “mountain city”. On the other hand, Chongqing has a mid-subtropical monsoon humid climate. The city’s monsoon climate is remarkable, mainly for the obvious change in wind direction between the winter and summer months. In addition, the differences between the city’s annual high and low figures for temperature and sunshine are large, and the regional distribution of precipitation varies greatly [41]. Chongqing’s annual average temperature extremes range fromt 43 degrees Celsius to minus two degrees Celsius [44]. The city’s total sunshine hours range from 1000 in the winter months to 1800 in the summer months. Chongqing remains frost-free for longer than surrounding areas outside the city. Its annual rainfall is abundant, ranging from 1000 to 1450 mm [44]. Under the influence of these regional and climatic characteristics, urban sprawl and climate effects in the Chongqing metropolitan area are different than in plain areas, with distinct characteristics.
Since Chongqing became a province-level municipality under the direct control of central government in 1997, the city’s administrative area has grown in scope. Unlike other municipalities in China, Chongqing is more akin to a province when it comes to municipal management. Chongqing’s special administrative structure is an obstacle to obtaining accurate and objective urban statistics. Most official population statistics for policymaking purposes capture the Chongqing metropolitan area. Therefore, based on the availability and validity of the data required for this paper, the Chongqing metropolitan area was selected as the area of geographic focus for this study. This area includes Yuzhong, Jiangbei, Yubei, Shapingba, Nanan, Banan, Jiulongpo, Dadukou, and Beibei. The Chongqing metropolitan area covers an area of 5472.82 square kilometers. At the end of 2017, the total resident population of the Chongqing metropolitan area was 8,650,600, and the population density was 1581 people per square kilometer [45].

3.2. Data Processing

Relevant data needed in this paper were selected from the Chongqing Statistical Yearbook (2008–2018), the Chongqing Environmental Statistics Bulletin (2008–2018), the Chongqing Statistical Bulletin on National Economic and Social Development (2008–2018), the China Statistical Yearbook (2008–2018), and Chongqing Meteorological Bureau. Missing data were supplemented using the moving average method.
Because the units of each index in the available data were different, all index data have been standardized in order to minimize the risk of errors. There are two types of evaluation indicators: positive and negative (representing positive and negative effects). After standardization, each indicator sits between zero or one. The following equation was used for this calculation formula:
Positive   indicator :   a i j = b i j x j X j x j
Negative   indicator :   a i j = X j b i j X j x j
where a i j represents the normalized value of the indicator j in year i , b i j is the original value of the indicator j in year i , and X j represents the maximum value of the indicator j , and x j represents the minimum value of the indicator j .

3.3. Methods

3.3.1. Indicators for Urban Sprawl Sustainability and Climate Change Adaptability

Urban sprawl and climate change are complex systems in and of themselves. The interaction between urban sprawl and climate change constitutes an even more complex system. Urban sprawl is affected by many factors, including improvement in urbanization processes and economic development. As a complex system, urban sprawl consists entity change processes involving local populations, including toward non-agricultural activities, urban concentration and expansion of urban built-up areas. Besides, urban sprawl consists of virtual change processes involving the transfer of the urban economy, society, culture, and lifestyle to the suburbs [7,9,16,20,42,43]. The disorderly sprawl of cities has heightened the frequency of extreme climate events, with associated social, economic, ecological and other impacts [31,34]. At present, there is no uniform criteria for the selection of evaluation indicators of the symmetric relationship between urban sprawl and climate change. Therefore, when selecting the evaluation indicators for urban sprawl sustainability and climate change adaptability, this paper mainly considered the following three aspects. (1) Choose data with a higher frequency of use. (2) Choose data that is accessible and scientific. (3) Choose data with reflects the characteristics of urban sprawl and climate change in the Chongqing metropolitan area. Drawing on the research results of published literatures and the unresolved problems regarding mountain city sprawl and climate change, an inclusive evaluation system was constructed to assess urban sprawl from four perspectives: population, economic, spatial and social sprawl [16,20,40,46,47]. The population sprawl index, covering the proportion of urban population and population change rate, can directly reflect the sustainability level of regional urban sprawl, mainly selecting urban household population, urban population density, urban natural population growth rate, and urban floating population [16,24,25,27,32,40]. Economic sprawl reflects the development process of urban sprawl from consumption and production, and included per capita GDP, economic growth rate, per capita disposable income of urban households and proportion of added value to GDP from secondary and tertiary industries [15,20,23,25,28,46]. The spatial sprawl index included highway mileage, built-up area, urban spatial intensity, and operational mileage of urban rail transit [7,8,10,20,46]. Realizing the high quality of people’s living standards and the completion of infrastructure in the region is an important function for USS. Therefore, this paper selected popularization rate of compulsory education, urban social security coverage, road area per capita, per capita household electricity consumption, urban rail transit per capita mileage, centralized treatment rate of sewage and refuse as the evaluation index of social sprawl [12,13,14,20,46,47].
In addition, according to the definition of IPCC, adaptability refers to the ability of natural and artificial systems to make adjustments to changing environments. CCA can be considered as an adjustment of natural and anthropogenic systems to actual or expected climate change factors and their effects to enhance human and socio-economic activities [48]. “Pressure-State-Response” (PSR) framework was proposed by Rapport and Friend in 1979, and was gradually used to study environmental issues [49]. In recent years, PSR has been widely used in the evaluation of ecological security, sustainable land use and natural resource carrying capacity. The climate change system is a multi-level, open, and complex giant system, similar to the ecosystem. When the system is subjected to external pressure, the state would change, and human beings respond to this change. Therefore, the CCA evaluation system was constructed based on PSR can be composed of three different but closely related indicator types: pressure, state, and response. Among them, the pressure comes from human activities and natural changes, mainly including nine indicators, such as extreme minimum temperature, maximum daily precipitation [1,5,18,22,48,49]; the state characterizes the changes in the structure of the climate change system under the combined effects of various pressures, including mainly green area coverage rate in built-up area, groundwater resources and other two indicators [2,5,7,11,22,25,31]; the response is the effect of the measures taken to deal with changes in the system structure, mainly expressed by air quality standard days, industrial SO2 removal and other four indicators [18,24,33,34,36,47,48,50]. The results of this process are shown in Table 1 and Table 2.

3.3.2. The Weight of Each Indicator

Selecting scientific indicators is key to measuring the coupling coordination degree between USS and CCA. The determination of each indicator weight is an important step toward obtaining objective and reiable evaluation results. We compared and analyzed the advantages, disadvantages, and applicability of various commonly used index weighting methods. These included the expert scoring method, analytic hierarchy process, entropy method, and coefficient of variation method. In order to reflect the weight of each index more objectively and to avoid the influence of human factors on the index weight, this paper adopted the variation coefficient method. This formula is calculated through the following equation:
w j = ρ j / j = 1 n ρ j .
ρ j = σ j / x j ¯
w j represents the weight value of the indicator j , ρ j is the variation coefficient of the indicator j , σ j is the standard deviation of the indicator j , and x j ¯ represents the average value of the indicator j in the study period (j = 1, 2, 3, …, n).

3.3.3. Measuring Levels of USS and CCA

The evaluation model was constructed using the linear weighting method to measure levels of USS and CCA. The specific formula of the modelwas as follows:
U S S i / C C A i = j = 1 n w j × a i j
Here, wi represented the weight of the indicator j, aij represented the normalized value of the indicator j in year i, USSi indicated the level of urban sprawl sustainability in year i, and CCAi represented the climate change adaptability level of year i.

3.3.4. The Coupled Coordination Degree Model

From an ecosystem perspective, coupling refers to the interaction, mutual evolution, and subsequent development of two or more system elements (or subsystems). In this way, coupling reflects the dynamic relationships of interdependence, coordination and mutual promotion between systems [12,13]. Referring to the concept and model of capacitive coupling in physics, we can generalize a coupling degree model of multi-system interaction to analyze two systems. In this study, the coupling degree model was expressed as [12]:
C n = { ( e 1 × e 2 . e m ) / [ ( e i + e j ) ] } 1 n
Cn represented the coupling coefficient of multiple systems, and e i and e j , respectively, represented the comprehensive evaluation indexes of multiple systems. For the purposes of coupling effect analysis, the coupling degree model was simplified to:
C = { f ( U S S ) × f ( C C A ) [ f ( U S S ) + f ( C C A ) ] 2 } 1 2
C represented the coupling degree between USS and CCA, f ( U S S ) represented the system function of USS, f ( C C A ) represented the system function of CCA. When C→0, the coupling degree is very small, indicating a low level of the coordinated development. When C→1, the coupling degree is the largest, indicating a high level of the coordinated development.. Coupling degree can be applied to analyze the interaction between systems. However, it can not express the level of coordinated development of systems. Therefore, it is necessary to construct a coupled coordination degree model to measure the degree of coordinated development and to avoid studying situations with a low level of system development but a high degree of coordination. The model of measuring degree can be expressed as:
D = ( C × T ) 1 2
T = η f ( U S S ) + θ f ( C C A )
In this formula, D denotes the coordinated development degree between systems, C denotes the coupling degree, T denotes the comprehensive levels of USS and CCA, and η and θ are undetermined parameters. The value of T indicates the comprehensive development level of urban sprawl sustainability and climate change adaptability. The larger the value of development degree, the higher the development level indicated by T . η and θ reflect the importance of the two systems respectively. This paper drew on the practice of general quantitative research, making η = θ = 0.5.

3.3.5. Level and Grade of Coordination Degree of USS and CCA

The higher the degree of coordination, the greater the extent of coordinated development between systems. According to the results of this paper’s coordination degree measurement, combined with the urban sprawl sustainability and climate change adaptability comprehensive evaluation index used in this paper, the coordination degree can be divided into 10 grades and three levels [12,13], as shown in Table 3.

4. Results and Discussion

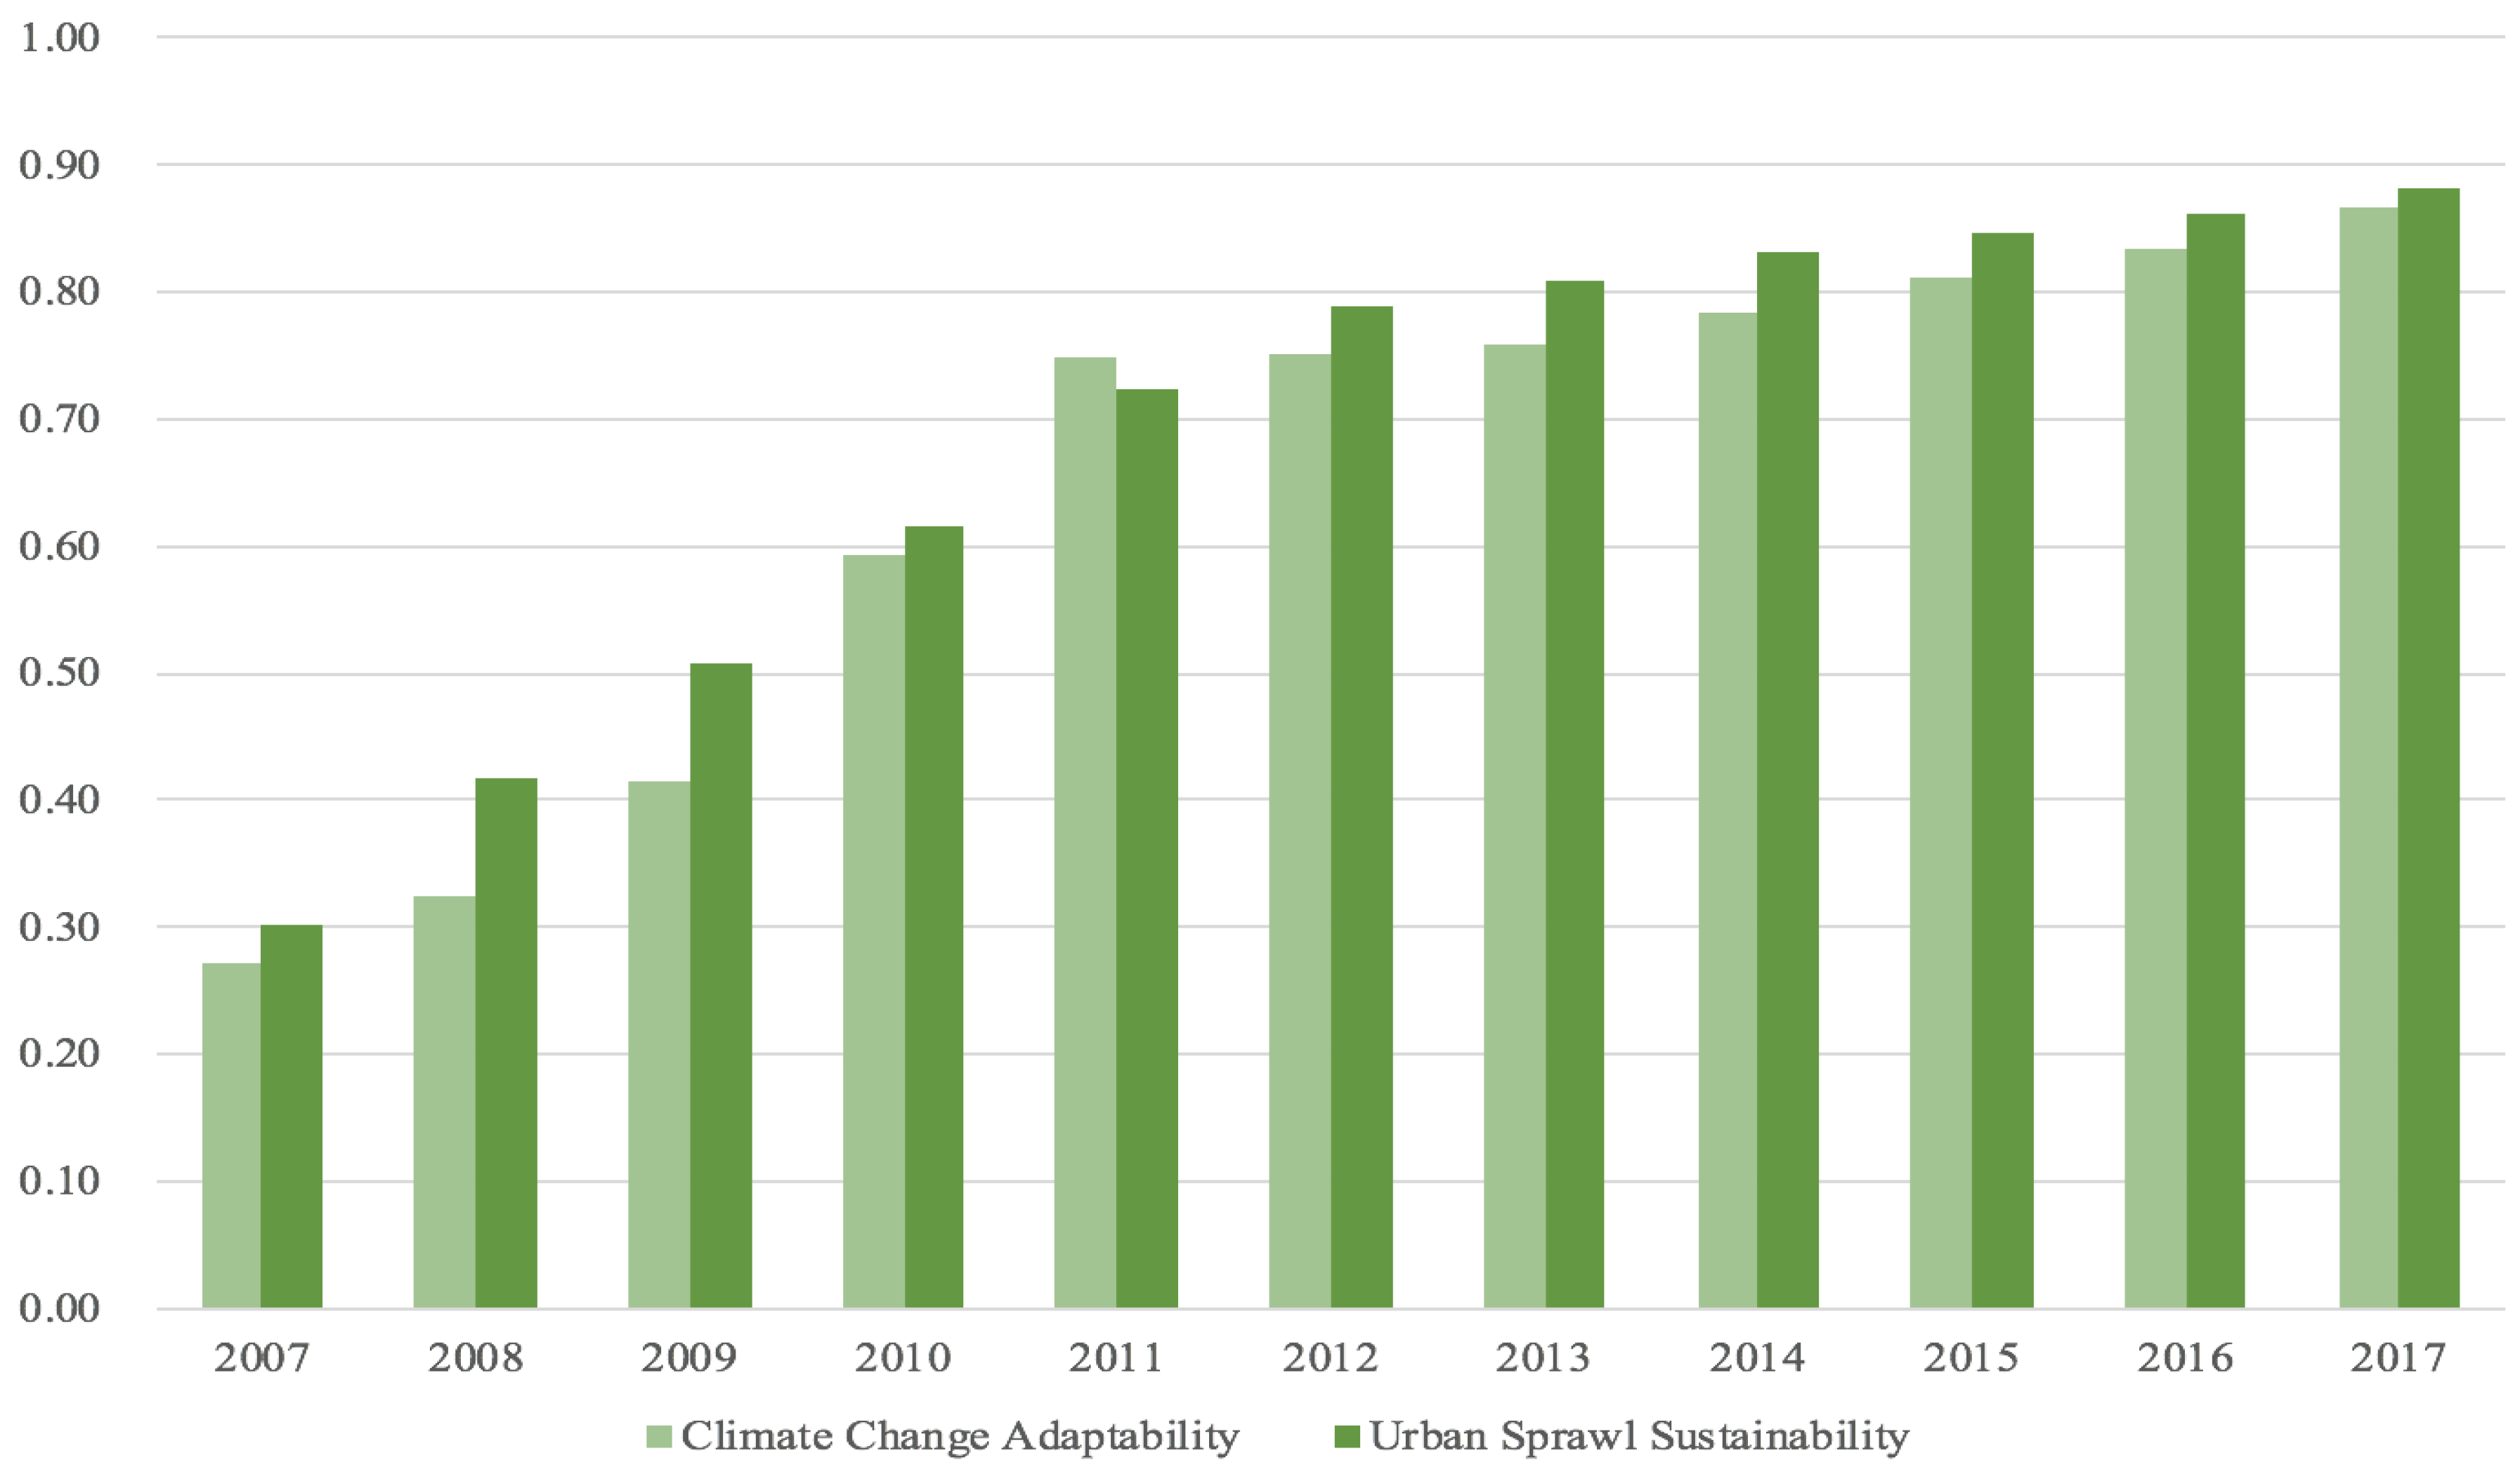
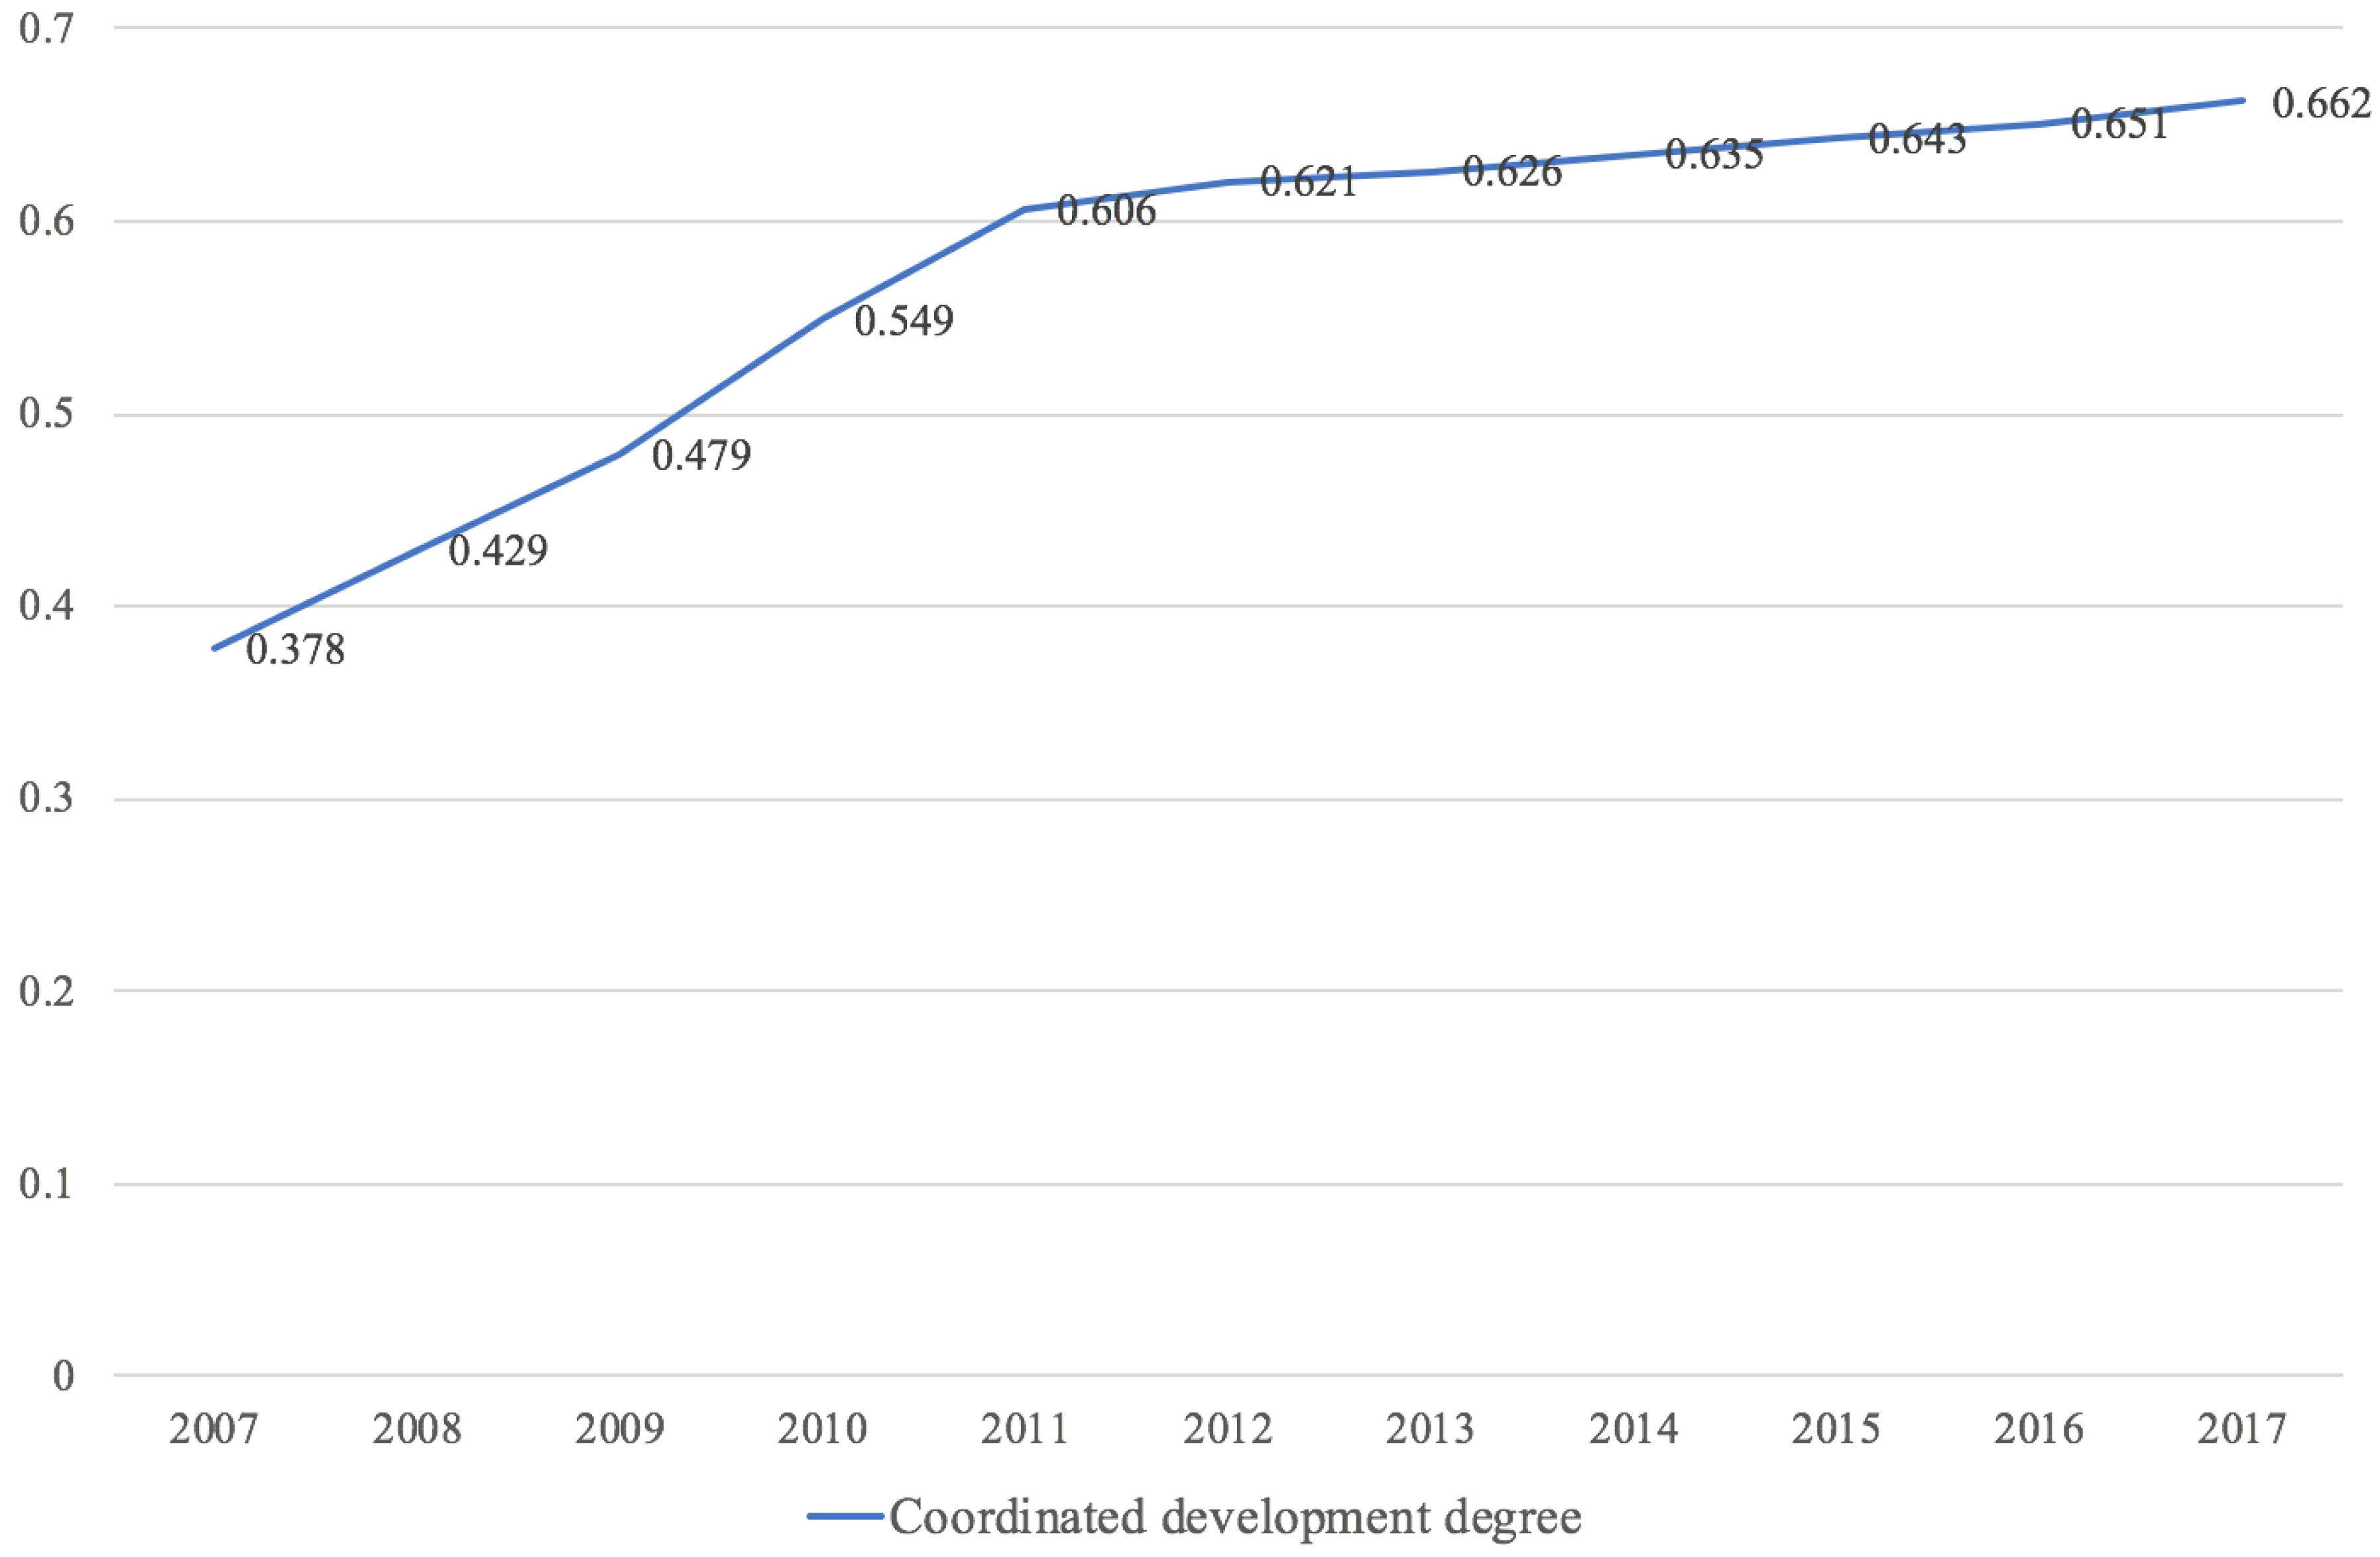
4.1. Time Series Evolution Law of Coordinated Development Degree between USS and CCA in Chongqing Metropolitan Area

The comprehensive level of urban sprawl sustainability and climate change adaptability, and their respective coordinated development degrees, were obtained using data for the Chongqing metropolitan area from 2007 to 2017 (Table 4, Figure 3 and Figure 4). As shown in Table 4, the coordination degree between USS and CCA in Chongqing metropolitan area was between 0.369 and 0.674 from 2007 to 2017. This suggests that USS and CCA in the Chongqing metropolitan area have risen gradually, from a period of uncoordinated development to a transition period, to coordinated development. There are some differences between the comprehensive levels of USS and CCA, indicating a USS lag type and CCA lag type.
Coordinated development for USS and CCA in Chongqing in the past 10 years has their own characteristics. First, the degree of coordinated development between USS and CCA has increased year by year. Their coordinated development has gradually changed, from slightly uncoordinated development to slightly coordinated development. This change is mainly due to measures taken by Chongqing administrators in recent years, such as relocating major polluting enterprises, constructing urban infrastructure, rational division of urban functional areas, continuous improvement of underground comprehensive corridors, and urban ecological environment. These measures have enhanced the ability of Chongqing metropolitan area to mitigate climate change. Meanwhile, Chongqing metropolitan area administrators have gradually strengthened their control over the intensity of land development and utilization in recent years, steadily improving the level of USS in Chongqing metropolitan area.
Second, over the last decade, the sustainability of urban sprawl in Chongqing metropolitan area has improved significantly. Due to recent improvements in internal and external functions in Chongqing metropolitan area, such as the increased construction of urban infrastructure and continuous improvements in urban environmental governance, USS in the Chongqing metropolitan area reached 0.883 in 2017, more doubling from 0.301 in 2007. However, being a mountainous city, urban development space in the Chongqing metropolitan area is extremely limited. For this reason, it is difficult to connect the metropolitan area’s various regions, as well as regions within the wider area. The land available for urban development in Chongqing metropolitan area and its surrounds is limited, making urban sprawl in the area highly vulnerable to climate change.
Third, CCA levels in Chongqing metropolitan area showed an obvious upwards trend over time. The metropolitan area’s extremes for minimum temperature, annual precipitation, and other climatic characteristics have changed over time because of its geographical location, climatic environment, geomorphological conditions, population sparawl, and increased urban water consumption. However, due to the Chongqing municipal government’s focus on mitigating climate change and protecting the ecological environment, the level of CCA has increased year by year. Results of this paper show that the Chongqing metropolitan area’s climate and ecological environment have developed over time. However, levels of CCA have fluctuated over time. In addition, construction affecting the metropolitan area’s climate and ecological environment has been inconsistent, leading to discrepancies in comprehensive levels of CCA.

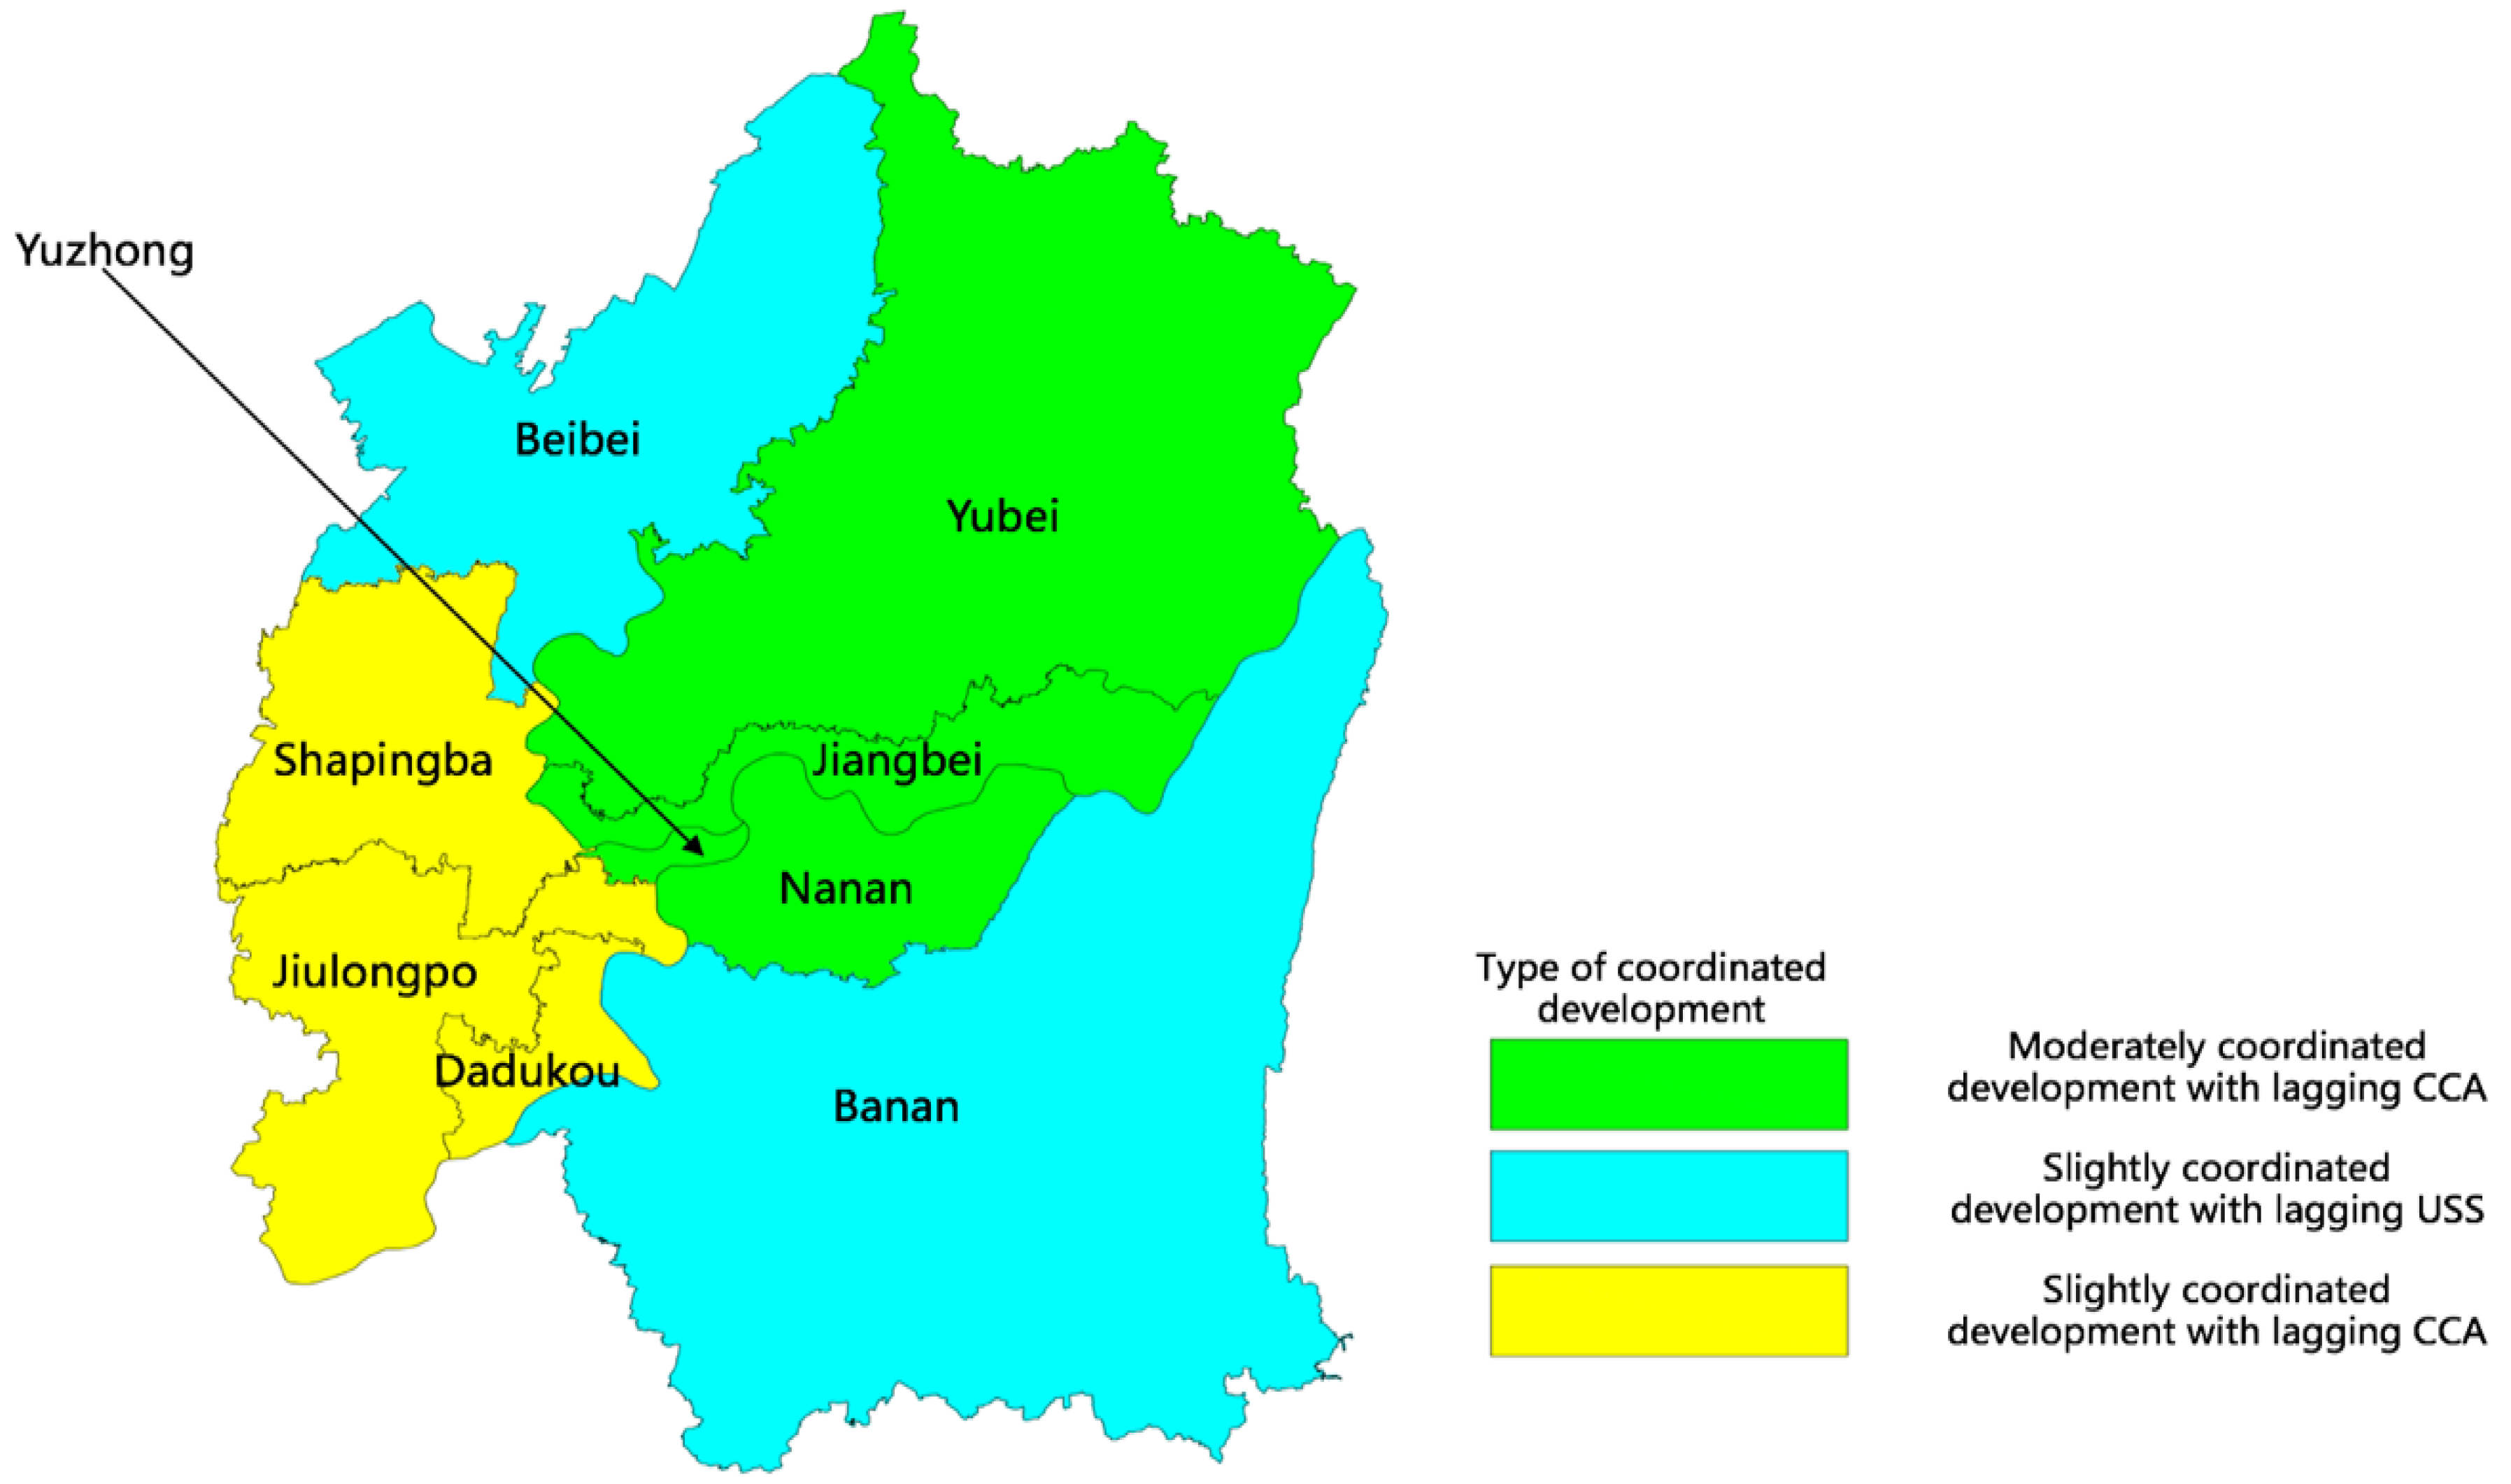
4.2. Spatial Difference Analysis of Coordinated Degree of USS and CCA in Chongqing Metropolitan Area

The coordinated development degree for nine districts of Chongqing metropolitan area was obtained by using the standardized values for the comprehensive levels of USS and CCA in 2017. Results are shown in Table 5. Next, the spatial difference of the coordinated development degree between USS and CCA in Chongqing metropolitan area was analyzed.
Overall, the coordinated development between USS and CCA in the Chongqing metropolitan areas in 2017 ranged from 0.635 and 0.721. These figures basically conforms to the spatial distribution law of “five functional areas”. Of these, five districts within the range of slightly coordinated development between USS and CCA. The city’s other districts are within the range of moderately coordinated development. From these results, we can see the city’s sustainability of urban sprawl has improved rapidly. At the same time, climate change adaptability in nine districts was also improved, with the coupling effect between USS and CCAbecoming more and more coordinated. In addition, the results show a difference in coordinated development between districts. In particular, spatial differences in CCA became more obvious, and some districts’ adaptability to climate change did not improve.
According to this paper’s figures regarding degrees of coordinated development, combined with relative levels of USS and CCA in 2017, the coordinated development of the nine districts can be roughly divided into three types. These are slightly coordinated development with lagging CCA ( 0.60 D 0.69 ,   f ( U S S ) f ( C C A ) ), slightly coordinated development with lagging USS ( 0.60 D 0.69 ,   f ( U S S ) f ( C C A ) ), and moderately coordinated development with lagging CCA ( 0.70 D 0.79 ,   f ( U S S ) f ( C C A ) ). These types are shown in Figure 5.

4.2.1. Slightly Coordinated Development with Lagging CCA

From Table 3, Table 5 and Figure 5, it can be seen that the coordinated development was slightly coordinated for USS and CCA in Shapingba, Dadukou and Jiulongpo in 2017. Coordinated development degrees for USS and CCA in the three districts weree 0.658, 0.649, and 0.635, respectively. Comprehensive levels of CCA lagged clearly behind comprehensive levels of USS. Shapingba, Dadukou, and Jiulongpo were among the city’s first major urban districts, and processes of the urban sprawling have been rapid in these areas, especially in recent years. In 2017, the disposable income of urban residents in the three districts was 34,553 yuan, 35,038 yuan, and 34,940 yuan respectively. These figures align with average disposable income in the Chongqing metropolitan area. Urbanization rates among each area’s permanent population was 95.08%, 93.00%, and 97.41% respectively, among the highest in the Chongqing metropolitan area. The three areas’ urbanization has reached the later stage in a typical S-shaped curve, becoming relatively stable. However, comprehensive levels of USS in Shapingba, Dadukou and Jiulongpo exceeded comprehensive levels of CCA. In addition, the areas’ climate change adaptability remains at a low level. In recent years, amid rapid sprawl, total amounts of urban energy consumption, and total carbon dioxide emissions have increased significantly. However, the areas’ green coverage rates and air quality standards in urban built-up areas have not risen simultaneously, which is unfavorable to improve the level of CCA. Considering the pressures of economic, spatial, and social sprawl on climate change adaptability in these districts, administrators in regions prone to this type of development should emphasize industries including modern services, information technology, and the arts and culture in order to maintain coordinated development between USS and CCA [49,51]. At the same time, these districts should also apply the advanced technology of NBS (Nature-Based Solutions) to address development issues, such as the restoration of urban swampy peatlands, construction of “green roofs”, and removal of all buildings in ventilation corridors [52]. For example, swamp peatlands are an important carbon sink source. However, degraded peatland loses this function, becoming a source of greenhouse gas emissions, with negative impacts on climate change adaptability. Urban planners can mitigate this effect through construction of wooden drainage ditches, which slow down the rate of rainwater discharge, and restore animal habitats, plants, and carbon sinks in peatlands. Second, green roofs enhances urban green areas, improving quality of life for residents and helping the city to actively adapt to climate change. Finally, ventilation corridors are connected to surrounding rivers or meadow valleys, and constitutes an urban green leisure corridor that purifies the city’s air. The ventilation corridor adopts natural wind and greening methods to enhance the air mobility, alleviate the heat island effect, dilute air pollution, and reduce urban haze.

4.2.2. Slightly Coordinated Development with Lagging USS

From the results of this paper, it can be seen that development is slightly coordinated for USS and CCA in Beibei and Banan. Their coordinated development degrees are 0.656 and 0.655, respectively, barely reaching the stage of coordinated development. However, comprehensive levels for USS are smaller for CCA. In 2017, the urbanization rates of the resident population of Beibei and Banan were 82.3% and 80.38%, respectively, below the average of the metropolitan area. Per capita GDP in Beibei and Banan in 2017 was 63,566 yuan and 67,651 yuan, respectively, below some other districts [45]. As important agricultural areas, Banan and Beibei’s economies are based on low economic efficiency. Growth rates for urban road traffic facilities and medical security have lagged behind the urban sprawl process. It is mainly due to the limitations posed by the location and economic development conditions. Meanwhile, Beibei and Banan, as suburbs in Chongqing’s developed urban economic circle, have sound ecological environments. In recent years, both areas’ air quality and urban sewage treatment rates have risen, becoming among the highest in the metropolitan area through implementation of measures such as repurposing farmland as forests, control of the ecological environment, soil and water conservation, clean energy projects, and headroom projects, and increased urban greening coverage rates. Therfore, their adaptability to climate change is higher than other districts. Higher climate change adaptability may provide a good material basis for sustainable urban sprawl in Beibei and Banan. In turn, this could assist the development of urban economy and allow for further expansion of public space. Compared with other districts in the metropolitan area, the level of USS is low. However, the rate of new urbanization in the area is appropriate to its size. On the one hand, new urbanization is necessary to support an area’s population growth, social and economic capacity; to support household registration system reforms; to appropriately expand the size of towns; to improve the quality of urban infrastructure construction and public service systems; and to vigorously develop green industries, such as eco-friendly agriculture and tourism [53,54,55]. On the other hand, in the process of sustainable urban sprawl, it is important to protect the natural environment and enhance livability in order to make a town feel cohesive prospective residents. These goals can be achieved by increasing green coverage in built-up areas, reducing the total amount of carbon emissions from domestic waste, and working toward coordinated development between USS and CCA [56,57].

4.2.3. Moderately Coordinated Development with Lagging CCA

As shown in Figure 5, development is moderately coordinated for USS and CCA in Yuzhong, Jiangbei, Yubei, and Nanan. These areas have coupling coordination degrees of 0.721, 0.715, 0.713, and 0.701, respectively. Coordinated development in these districts is better than elsewhere in the Chongqing, metropolitan area, but their comprehensive level of CCA lags behind USS. Yuzhong, Jiangbei Yubei, and Nan’an are located along the Yangtze and Jialing Rivers, in the economic center of the Chongqing metropolitan area [10]. And the GDP per capita in 2017 was 170,528 yuan, 100,618 yuan, 89,477 yuan, and 111,023 yuan, respectively, far higher than the average in Chongqing metropolitan area. Urbanization rates of the permanent population were 100%, 99.20%, 91.53%, and 95.37%, respectively, among the city’s highest. Urbanization in these areas has reached the later stage of a typical S-curve, representing a stable or even reversed stage of urbanization stage. Each region has a highly developed economy and urbanization rate, with moderate improvements in climate change adaptability as a result. Since 2015, when widespread construction of flexible cities, sponge cities and climate-adapted cities began in China, local governments in these districts have increased their investment in climate change adaptation. Adaptability to climate change in these areas is basically consistent with improvements in urban sprawl sustainability in the four districts. In addition, from the results of this paper, it can be seen that, although the population sprawl in these districts has gradually reduced the pressure to CCA, the pressures of spatial and economic sprawl persist. However, due to large investments in capital, technology, and personnel in each district, climate change pressure has been alleviated to an extent. Overall sustainability of urban sprawl and adaptability to climate change in each district has improved, and each is moving gradually towards a more coordinated development stage. To improve climate change adaptability, policymakers in each district could employ NBS to promote syngergies between urban-climate systems. NBS makes urban environments more sustainable and less resource-consuming [52]. In addition, NBS can also improve the social well-being of residents and may create more inclusive and engaged communities [52]. NBS include novel technologies that effectively mitigate climate change, such as green roofs made of cork, ecolanes made of recycled rice husk, bio-based degradable weed mats, expanded-cork green-roofs to improve water retention, air purification measures, and thermal insulation in the existing buildings.

5. Conclusions and Policy Implication

Based on theories of the coupling relationship between urban sprawl and climate change, this paper evaluated comprehensive levels of USS and CCA. Next, their coordinated development degree in the Chongqing metropolitan area was calculated using a coupling coordinated development degree model. Due to the influence of economic development, urban construction and environmental input, comprehensive levels of USS and CCA in the Chongqing metropolitan area show different development trajectories. Their coordinated development degree also presents various types, mainly including slightly coordinated development with lagging CCA, slightly coordinated development with lagging USS, and moderately coordinated development with lagging CCA.
Because of differences in geographical location, topographical gradients, climate, rainfall, and other natural conditions, many types of urban layout structure exist in mountainous areas. Generally speaking, when the population of mountainous cities exceeds a certain scale, layout structure modes of centralization and decentralization should be considered in order to avoid the blind sprawl. Concentration is the essence of urban civilization and efficiency, while dispersal is the basic feature of the natural environment in mountainous cities. Through combining these two dynamics organically, coordination of sustainable sprawl in modern mountainous cities is possible, along with enhanced adaptability to climate change amid urban densification. In addition, this approach is an option for urban planners to harmonize the specific mountain climate environment with the space requirements of mountainous cities.
As a typical mountainous city, Chongqing has seen rapid economic development since 1997, and especially in the last decade. However, the city’s level of coordinated development between urban sprawl sustainability and climate change adaptability highlights the obvious spatial differences. Today, the city’s original urban sprawl mode is subject to greater pressure and contradictions. The city’s population is concentrated in its metropolitan centre, increasing the demand for construction land, resulting in faster development in the Chongqing metropolitan area. This unsustainable urban sprawl has a serious impact on CCA, and the adaptability of those regions to climate change has not improved amid rapid economic and social development. In light of ongoing urbanization across the city, each region of the Chongqing metropolitan area should adopt measures to harmonize the city’s mountain climate environment with its physical space. All regions of the Chongqing metropolitan area should attempt to address the contradiction between urban sprawl and climatechange, striking a balance mechanism between urban development and natural evolution [34,58]. It is imperative to bulid a comprehensive development model that supports work–life balance in residential areas, so as to reduce the energy consumption and improve work efficiency and quality of life [40]. To this end, city planners could employ the concepts of multi-center and group structure to alleviate the problems related to climate change, such as traffic congestion caused by population spread, increased energy consumption, and an increased heat island effect [31]. Finally, government decision makers should adopt advanced NBS technologies—for example, keeping green natural isolation zones and ecological corridors between groups such as steep slopes, gullies, farmland, woodland, and wetlands. These are important organic components of the spatial layout structure of mountain cities. This approach also supports processes of ventilation, cooling, dust reduction, noise reduction, air purification, water storage, disaster reduction, and disaster prevention, and biological reproduction of the green space system. NBS can improve environmental quality, creating a harmonious urban-ecological relationship [52,56,59]. By making full use of various advanced development concepts to form a space structure of “organic dispersion, fragmentation and concentration, division and balance, multi-center, and cluster”, this approach embodies the philosophy of highly intensive integration of mountainous cities and climate and landscape culture in China. This model should guide sustainable development efforts in the Chongqing metropolitan area.
This research and its policy implications contribute to the sustainable development of mountainous cities in China, as well as to mountainous cities in other countries, such as Kathmandu in Nepal and Ankara in Turkey. Administrators in these countries should focus on using advanced urban development concepts, including NBS, multi-center and multi-group development, and promoting overall synergy between human residents and nature. This paper has analyzed coordinated development for USS and CCA based on spatiotemporal dimensions. However, their coordinated development involves many factors. Only representative and available indicators were selected for this paper’s evaluation system. Therefore, this research has some limitations. In future research, collection of more data would allow a more objective evaluation of the degree of coordinated development between USS and CCA. In turn, insights from this data would support formulation of sustainable urban development policies.

Author Contributions

Conceptualization, Y.W. and P.X.; methodology, Y.W.; formal analysis, Y.W.; data curation, Y.W.; writing—original draft preparation, Y.W.; visualization, Y.W.; supervision, P.X.; funding acquisition, P.X.

Funding

This study was supported by a joint grant from Project No. 2017CDJSK03XK19, 2018CDXYJG0047 supported by the Fundamental Research Funds for the Central Universities, and Project No. 2018ZD02 supported by the Social Science Planning Projects in Chongqing, China.

Conflicts of Interest

The authors declare no conflict of interest.

References

  1. Qing, D. Climate change science and human sustainable development. Prog. Geogr. 2014, 33, 874–883. [Google Scholar]
  2. Huang, J.P.; Ji, M.X.; Liu, Y.P. A Summary of studies on climate change in arid and semi-arid areas. Clim. Chang. Res. 2013, 9, 9–14. [Google Scholar]
  3. Cui, S.H.; Xu, L.L.; Huang, Y.F.; Wang, J.; Li, Y.; Li, Y.; Yang, Y.; Zhou, Y. Progress and prospect of study on urban spatial patterns to cope with climate change. Prog. Geogr. 2015, 34, 1209–1218. [Google Scholar]
  4. Schuur, E.A.G.; McGuire, A.D.; Schädel, C.; Grosse, G.; Harden, J.W.; Hayes, D.J.; Hugelius, G.; Koven, C.D.; Kuhry, P.; Lawrence, D.M.; et al. Climate change and the permafrost carbon feedback. Nature 2015, 520, 171. [Google Scholar] [CrossRef] [PubMed]
  5. Urry, J. Climate Change and Society. In Why the Social Sciences Matter, 2nd ed.; Michie, J., Cooper, C.L., Eds.; Palgrave Macmillan: London, UK, 2015. [Google Scholar] [Green Version]
  6. Climate Change. Impacts, Adaptation and Vulnerability: Regional Aspects, 1st ed.; Cambridge University Press: London, UK, 2014. [Google Scholar]
  7. Wang, J.T.; Zang, J.X.; Lu, X.C.; Zhao, Y.F. The different impacts of urban private transportation and public transportation on urban sprawl: An empirical test based on panel data of 65 large and medium-sized cities in China. Econ. Geogr. 2018, 38, 74–81. [Google Scholar]
  8. Cheng, Y.H.; Lu, J. A review of urban sprawl studies. Urban Dev. Res. 2016, 23, 45–50. [Google Scholar]
  9. Gan, L. Urban and rural sustainable development. Urban Plan. Forum 2013, 21, 125–136. [Google Scholar]
  10. Liu, Y.; Fan, P.; Yue, W.; Song, Y. Impacts of land finance on urban sprawl in China: The case of Chongqing. Land Use Policy 2018, 72, 420–432. [Google Scholar] [CrossRef]
  11. Li, J.; Deng, W.; Zhang, J.F.; Li, S.J.; Huang, R.; Zhang, K.Q. Problems and countermeasures of water security in southwest mountain resource-based cities under the background of climate change: A case study of Kunming Dongchuan. Mt. Res. 2016, 34, 772–779. [Google Scholar]
  12. Li, Y.; Li, Y.; Zhou, Y.; Shi, Y.; Zhu, X. Investigation of a coupling model of coordination between urbanization and the environment. J. Environ. Manag. 2012, 98, 127. [Google Scholar] [CrossRef]
  13. He, J.; Wang, S.; Liu, Y.; Ma, H.; Liu, Q. Examining the relationship between urbanization and the eco-environment using a coupling analysis: Case study of Shanghai, China. Ecol. Indic. 2017, 77, 185–193. [Google Scholar] [CrossRef]
  14. Congedo, L.; Munafò, M. Urban Sprawl as a Factor of Vulnerability to Climate Change: Monitoring Land Cover Change in Dar es Salaam, 2nd ed.; Springer: New York, NY, USA, 2014. [Google Scholar]
  15. Dadi, D.; Azadi, H.; Senbeta, F.; Abebe, K.; Taheri, F.; Stellmacher, T. Urban sprawl and its impacts on land use change in Central Ethiopia. Urban For. Urban Green. 2016, 16, 132–141. [Google Scholar] [CrossRef]
  16. Yao, C.R. Mechanism of population change on climate change in the urbanization process: Theoretical framework and co-integration test. Urban Dev. Res. 2012, 19, 86–91. [Google Scholar]
  17. IPCC. Climate Change 2014: Synthesis Report. In the Fifth Assessment Report of the Intergovernmental Panel on Climate Change, 1st ed.; Pachauri, R.K., Meyer, L.A., Eds.; IPCC: Geneva, Switzerland, 2014. [Google Scholar]
  18. Wu, S.H.; Luo, Y.; Wang, H.; Gao, J.B.; Li, C.Z. China’s climate change impacts and adaptation: Situation and outlook. Chin. Sci. Bull. 2016, 10, 1042–1054. [Google Scholar]
  19. Gao, X.; Yang, F. Coupling degree of urbanization and ecological environment in Northwest China. Urban Probl. 2016, 12, 26–33. [Google Scholar]
  20. Chen, Y.; Sun, J.; Lu, J. The impact of urban sprawl and industrial structure on environmental pollution. Urban Probl. 2018, 36, 25–37. [Google Scholar]
  21. He, Z.; Shi, X.; Wang, X.; Xu, Y. Urbanisation and the geographic concentration of industrial SO2 emissions in China. Urban Stud. 2017, 54, 1–18. [Google Scholar] [CrossRef]
  22. Hao, Y.; Chen, H.; Wei, Y.M.; Li, Y.M. The influence of climate change on CO2 (carbon dioxide) emissions: An empirical estimation based on Chinese provincial panel data. J. Clean. Prod. 2016, 131, 667–677. [Google Scholar] [CrossRef]
  23. Wu, S.; Zhou, S.; Chen, D.; Wei, Z.; Dai, L.; Li, X. Determining the contributions of urbanization and climate change to NPP variations over the last decade in the Yangtze River Delta, China. Sci. Total Environ. 2014, 472, 397–406. [Google Scholar] [CrossRef] [PubMed]
  24. Song, W.; Deng, X.; Yuan, Y.; Wang, Z.; Li, Z. Impacts of land-use change on valued ecosystem service in rapidly urbanized North China Plain. Ecol. Model. 2015, 318, 245–253. [Google Scholar] [CrossRef] [Green Version]
  25. Wang, X.; Liao, J.; Zhang, J.; Shen, C.; Chen, W.; Xia, B. A numeric study of regional climate change induced by urban expansion in the Pearl River delta, China. J. Appl. Meteorol. Clim. 2014, 53, 346–362. [Google Scholar] [CrossRef]
  26. Li, X.; Yang, L.; Ren, Y.; Li, H.; Wang, Z. Impacts of urban sprawl on soil resources in the Changchun–Jilin Economic Zone, China, 2000–2015. Int. J. Environ. Res. Public Health 2018, 15, 1186. [Google Scholar] [CrossRef] [PubMed]
  27. Lin, X.Q.; Wang, D.; Liu, X. Eco-environmental response and driving force of urban space expansion in Beijing. Ecol. Environ. Sci. 2015, 7, 1159–1165. [Google Scholar]
  28. Zhang, Y.; Yang, Q.Y.; Min, J. An analysis of coupling between the bearing capacity of the ecological environment and the quality of new urbanization in Chongqing. Acta Geogr. Sin. 2016, 71, 817–828. [Google Scholar]
  29. Masson, V.; Marchadier, C.; Adolphe, L.; Bonhomme, M.; Bretagne, G.; de Munck, C.; Hallegatte, S.; Hidalgo, J.; Houet, T.; et al. Adapting cities to climate change: A systemic modelling approach. Urban Clim. 2014, 10, 407–429. [Google Scholar] [CrossRef] [Green Version]
  30. Shi, L.; Cui, S. Research progress of climate change effects on urban ecosystem. Environ. Sci. Technol. 2010, 33, 193–197. [Google Scholar]
  31. Liu, C.; Li, Y. Spatio-Temporal features of urban heat island and its relationship with land use/cover in mountainous city: A case study in Chongqing. Sustainability 2018, 10, 1943. [Google Scholar] [CrossRef]
  32. Luo, X.L.; Du, Y.D.; Zheng, C. Human health risk zoning caused by high temperature heat waves in Guangdong. Clim. Chang. Res. 2016, 12, 139–146. [Google Scholar]
  33. He, J.Y.; Luo, S.Q. A survey of knowledge, attitudes, behaviors and influencing factors of climate change among community residents in Chongqing. J. Environ. Hyg. 2017, 5, 343–347. [Google Scholar]
  34. Shi, J.; Mu, H.Z. Study on the sustainable development of climate change in big cities—Taking Shanghai as an example. Resour. Environ. Yangtze Basin 2016, 25, 1–8. [Google Scholar]
  35. Chou, J.M.; Dong, W.J.; Yan, X.D. Discussion on the mechanism and ways of the impact of climate change on socioeconomic system. Chin. J. Atmos. Sci. 2016, 40, 191–200. [Google Scholar]
  36. Ding, J. Study on climate change indicator system in environmental impact assessment of transportation planning. Environ. Pollut. Control 2012, 34, 85–90. [Google Scholar]
  37. Barnes, J. The future of the Nile: Climate change, land use, infrastructure management, and treaty negotiations in a transboundary river basin. WIREs Clim. Chang. 2017, 8, 1015–1026. [Google Scholar] [CrossRef]
  38. Demuzere, M.; Orru, K.; Heidrich, O.; Olazabal, E.; Geneletti, D.; Orru, H.; Bhave, A.G.; Mittal, N.; Feliu, E.; Faehnle, M. Mitigating and adapting to climate change: Multi-functional and multi-scale assessment of green urban infrastructure. J. Environ. Manag. 2014, 146, 107–115. [Google Scholar] [CrossRef] [PubMed]
  39. Sánchez Rodríguez, R.A.; Morales Santos, A.E. Vulnerability assessment to climate variability and climate change in Tijuana, Mexico. Sustainability 2018, 10, 2352. [Google Scholar] [CrossRef]
  40. Zeng, C.; Liu, Y.; Stein, A.; Jiao, L. Characterization and spatial modeling of urban sprawl in the Wuhan Metropolitan Area, China. Int. J. Appl. Earth Obs. 2015, 34, 10–24. [Google Scholar] [CrossRef]
  41. Ren, G.Y. Urbanization as a major driver of urban climate change. Adv. Clim. Chang. Res. 2015, 12, 1–6. [Google Scholar] [CrossRef]
  42. Fang, Y.; Pal, A. Drivers of urban sprawl in urbanizing China—A political ecology analysis. Environ. Urban. 2016, 28, 599–616. [Google Scholar] [CrossRef]
  43. Liu, L.; Peng, Z.; Wu, H.; Jiao, H.; Yu, Y.; Zhao, J. Fast identification of urban sprawl based on K-means clustering with population density and local spatial entropy. Sustainability 2018, 10, 2683. [Google Scholar] [CrossRef]
  44. Chongqing Meteorological Bureau. Available online: http://www.cqmb.gov.cn/ (accessed on 28 September 2017).
  45. Chongqing Municipal Bureau of Statistics. Available online: http://www.cqtj.gov.cn/ (accessed on 15 January 2018).
  46. Milan, B.F.; Creutzig, F. Municipal policies accelerated urban sprawl and public debts in Spain. Land Use Policy 2016, 54, 103–115. [Google Scholar] [CrossRef]
  47. Ewing, R.; Meakins, G.; Hamidi, S.; Nelson, A.C. Relationship between urban sprawl and physical activity, obesity, and morbidity–update and refinement. Health Place 2014, 26, 118–126. [Google Scholar] [CrossRef] [PubMed]
  48. Challinor, A.J.; Watson, J.; Lobell, D.B.; Howden, S.M.; Smith, D.R.; Chhetri, N. A meta-analysis of crop yield under climate change and adaptation. Nat. Clim. Chang. 2014, 4, 287–291. [Google Scholar] [CrossRef] [Green Version]
  49. Wang, Q.; Li, F.C.; Li, G.R.; Mu, C.L. Health assessment of the upper Yangtze River protection forest based on the “Pressure-State-Response” framework. Resour. Environ. Yangtze Basin 2010, 19, 953–958. [Google Scholar]
  50. Urban, M.C. Accelerating extinction risk from climate change. Science 2015, 348, 571–573. [Google Scholar] [CrossRef] [PubMed] [Green Version]
  51. Mu, H.Z.; Wu, P. Urbanization, industrial structure optimization and urban-rural income gap. Economist 2016, 22, 37–44. [Google Scholar]
  52. Xiang, P.; Wang, Y.; Deng, Q. Inclusive nature-based solutions for urban regeneration in a natural disaster vulnerability context: A case study of Chongqing, China. Sustainability 2017, 9, 1205. [Google Scholar] [CrossRef]
  53. Zhang, M.; Wang, Y. Research progress on urban area climate change vulnerability and response options. Environ. Sustain. Dev. 2015, 40, 28–32. [Google Scholar]
  54. Yoon, E.J.; Lee, D.K.; Kim, H.G.; Kim, H.R.; Jung, E.; Yoon, H. Multi-Objective land-use allocation Considering landslide risk under climate change: Case study in Pyeongchang-gun, Korea. Sustainability 2017, 9, 2306. [Google Scholar] [CrossRef]
  55. Creutzig, F.; Agoston, P.; Minx, J.C.; Canadell, J.G.; Andrew, R.M.; le Quéré, C.; Peters, G.P.; Sharifi, A.; Yamagata, Y.; Dhakal, S. Urban infrastructure choices structure climate solutions. Nat. Clim. Chang. 2016, 6, 1054. [Google Scholar] [CrossRef]
  56. Chapman, R.; Howden-Chapman, P.; Capon, A. Understanding the systemic nature of cities to improve health and climate change mitigation. Environ. Int. 2016, 94, 380–387. [Google Scholar] [CrossRef]
  57. Zhou, Q. A review of sustainable urban drainage systems considering the climate change and urbanization impacts. Water 2014, 6, 976–992. [Google Scholar] [CrossRef]
  58. Tong, M.X.; Hansen, A.; Hanson-Easey, S.; Cameron, S.; Xiang, J.; Liu, Q.; Sun, Y.; Weinstein, P.; Han, G.S.; Williams, C.; et al. Infectious diseases, urbanization and climate change: Challenges in future China. Int. J. Environ. Res. Public Health 2015, 12, 11025–11036. [Google Scholar] [CrossRef] [PubMed]
  59. Lee, J.S.; Kim, J.W.; Rosen, M.A. Assessing strategies for urban climate change adaptation: The case of six metropolitan cities in South Korea. Sustainability 2018, 10, 2065. [Google Scholar] [CrossRef]
Figure 1. Location of Chongqing.
Sustainability 11 00020 g001
Figure 2. Mountainous regions in Chongqing metropolitan area.
Sustainability 11 00020 g002
Figure 3. Tendencies toward urban sprawl sustainability (USS) and climate change adaptability (CCA) in Chongqing metropolitan area from 2007 to 2017.
Sustainability 11 00020 g003
Figure 4. Coordinated development degree between USS and CCA in Chongqing metropolitan area from 2007 to 2017.
Sustainability 11 00020 g004
Figure 5. Types of coordinated development for USS and CCA in the nine districts in 2017.
Sustainability 11 00020 g005
Table 1. Index system for urban sprawl sustainability.
Primary IndicatorsWeightSecondary IndicatorsWeight
Population sprawl0.261Urban household population proportion (%)0.038
Urban population density (persons/km2)0.102
Urban natural population growth rate (‰)0.095
Urban floating population (10,000 people)0.026
Economic sprawl0.274Per capita GDP (Yuan)0.105
Economic growth rate (%)0.064
Per capita disposable income of urban households (Yuan)0.069
Proportion of added value to GDP from secondary and tertiary industries (%)0.036
Spatial sprawl0.257Highway mileage (km)0.036
Built-up area (km2)0.073
Urban spatial intensity (%)0.097
Operational mileage of urban rail transit (km)0.051
Social sprawl0.208Popularization rate of compulsory education (%)0.027
Urban social security coverage (%)0.021
Road area per capita (km2/per capita)0.023
Per capita household electricity consumption (ton/per capita)0.068
Urban rail transit per capita mileage (km/per capita)0.031
Centralized treatment rate of sewage and refuse (%)0.038
Table 2. Index system for climate change adaptability.
Primary IndicatorsWeightSecondary IndicatorsWeight
Climate change pressure0.325Extreme minimum temperature (°C)0.032
Maximum daily precipitation (mm)0.026
Annual mean temperature (°C)0.035
Annual precipitation (mm)0.028
Percentage of sunshine (%)0.029
Total energy consumption (10,000 tons of standard coal)0.081
Total urban water consumption (10,000 tons)0.024
Total industrial wastewater discharge (10,000 tons)0.037
Total carbon dioxide emissions (million tons/MT)0.033
Climate change state0.324Green area coverage rate in built-up area (%)0.061
Per capita public green area (%)0.084
Groundwater resources (m3)0.078
Per capita water resources (m3)0.101
Climate change response0.351Air quality standard days (days)0.027
Industrial wastewater discharge compliance rate (%)0.101
Industrial SO2 removal (10,000 tons)0.052
Comprehensive utilization of industrial solid waste (10,000 tons)0.067
Environmental protection investment as a percentage of GDP (%)0.039
Total carbon emission reduction of domestic waste (10,000 tons)0.065
Table 3. Classification of coordinated development degree.
DegreeGradeLevel
0–0.09Extreme uncoordinated developmentUncoordinated development
0.10–0.19Seriously uncoordinated development
0.20–0.29Moderately uncoordinated development
0.30–0.39Slightly uncoordinated development
0.40–0.49Barely uncoordinated developmentTransitional development
0.50–0.59Barely coordinated development
0.60–0.69Slightly coordinated developmentCoordinated development
0.70–0.79Moderately coordinated development
0.80–0.89Exceedingly coordinated development
0.90–1.00Superiorly coordinated development
Table 4. Comprehensive level and Coordinated development degree of USS and CCA in Chongqing metropolitan area from 2007 to 2017.
Year20072008200920102011201220132014201520162017
Climate change adaptability0.2730.3250.4150.5920.7490.7520.7590.7850.8120.8350.866
Urban sprawl sustainability0.3010.4170.5080.6150.7230.7890.8080.8310.8470.8630.883
Coordinated development degree0.3780.4290.4790.5490.6060.6210.6260.6350.6430.6510.662
Table 5. Coordinated development degree of each district of Chongqing metropolitan area in 2017.
YuzhongYubeiJiangbeiShapingbaJiulongpoDadukouBeibeiBananNanan
CCA0.8820.8850.8720.8390.8240.8060.9040.8990.855
USS0.9510.9210.9050.8990.8620.8120.8220.8190.903
D10.7210.7150.7130.6580.6490.6350.6560.6550.701
1 D stands for coordinated development degree development.

