Case Report

Housing and the City: A Spatial Analysis of Residential Building Activity and the Socio-Demographic Background in a Mediterranean City, 1990–2017

1
Department of Agricultural and Forestry Sciences (DAFNE), Tuscia University, via San Camillo de Lellis, 5, I-01100 Viterbo, Italy
2
Council for Agricultural Research and Economics (CREA), Viale Santa Margherita 80, I-52100 Arezzo, Italy
3
Global Change Research Institute of the Czech Academy of Sciences, Lipová 9, CZ-37005 České Budějovice, Czech Republic
*
Author to whom correspondence should be addressed.
Sustainability 2019, 11(2), 375; https://doi.org/10.3390/su11020375
Submission received: 12 November 2018 / Revised: 6 January 2019 / Accepted: 9 January 2019 / Published: 13 January 2019
(This article belongs to the Special Issue Urban Sprawl and Sustainability)

Abstract

:
Fluctuations in residential building activity are becoming progressively more intense over time and space in advanced economies and especially in Europe, fueling real estate market segmentation and making the performance of the construction industry increasingly unpredictable. If non-linear urbanization paths are the result of economic downturns consolidating progressively more volatile real estate markets, the present study investigates the impact of recent building cycles on long-term urban expansion in a Mediterranean city (Athens, Greece), using multiple clustering techniques run on a large set of building activity and socio-demographic indicators. Changes over time in building activity were evaluated considering 12 spatially-explicit indicators derived from the analysis of building permits released by Greek municipalities between 1990 and 2017. By referring to different analysis’ scales (macro-scale: settlements, meso-scale: buildings, micro-scale: dwellings), indicators allow a comprehensive investigation of multiple dimensions and characteristics of construction markets at four-time intervals of 7 years each (1990–1996, 1997–2003, 2004–2010, 2011–2017). Spatio-temporal variability in building activity was further investigated considering 12 contextual indicators assessing the basic socio-demographic attributes of local municipalities. Cluster analysis allows identification of distinctive, local-scale responses of real estate markets to economic cycles (expansion–stagnation–recession) in both short- and long-term horizons and relate them to the dominant socio-demographic context. Density of new buildings, average floors per new building, density of buildings’ additions and number of building permits per inhabitant were found to be the most sensitive indicators to economic downturns in the study area. Infrastructure-driven development, as a result of the 2004 Olympic Games, has produced relevant short-term alterations in residential construction markets, complicating urbanization trends at the local scale. Multi-scale indicators from building permit records provide a useful insight in the diachronic mechanisms of urban growth, with implications for regional planning and design of sustainable development practices.

1. Introduction

Having a measurable impact on land-use efficiency and urban sustainability, real estate is one of the largest economic activities worldwide influencing settlement morphology and shaping built environments [1]. Empirical evidence indicates that building activity in metropolitan areas is following increasingly complex and non-linear paths, becoming progressively less influenced by traditional economic forces (agglomeration factors) oriented along the urban gradient and being more associated with demographic dynamics, migration, gentrification, accessibility and cultural/natural attractiveness [2]. With the sequential urban phases observed since the 1990s, real estate markets became increasingly volatile and segmented, contributing differently to urban and metropolitan change [3]. By this way, non-linear fluctuations in real estate development have been frequently associated with discrete changes driving settlement densification or dispersion [4].
While sources of temporal fluctuations in real estate development were sometimes investigated using multidimensional approaches [5], the relationship between local construction markets and the related economic, social and political contexts was poorly studied and may still require an in-depth exploratory data analysis with the aim to ascertain the importance of spatio-temporal variations in residential building activity as an indirect response to economic cycles and socio-demographic transformations at local scale [6]. Building activity has been demonstrated to reflect economic downturns, displaying local attributes that alter the timing of expansion and decline. For instance, fluctuations in building activity at both country and regional scales have been observed before and after economic recessions, with differential impacts on land development. These changes have frequently produced spatial outcomes reflecting a rapid evolution of urban forms and metropolitan structures at large [7]. However, identification of real estate sub-markets based on a characteristic profile of building activity (e.g., in terms of density, vertical profile, dwelling size and volume) has been less explored in advanced economies [8,9,10]. With this perspective in mind, research linking local-scale mechanisms of urban (and economic) expansion and socio-demographic transformations with real estate development paths and segmentation in construction markets is increasingly required to provide interpretative frameworks that may reconnect long-term and short-term changes in metropolitan spatial structures [11].
European cities represent relevant examples of the inherent transformations of construction and housing patterns that reflect changes in societies and regional economic systems over recent decades [12]. However, urbanization patterns and processes across Europe were (and still are) characterized by a relevant spatial heterogeneity [13,14,15]. For instance, earlier studies have evidenced the specificity of Southern European urban areas compared with northern and western counterparts as far as real estate development, housing and construction patterns, planning regulations and settlement informality are concerned [16,17,18,19,20]. Although with different intensity, family-oriented welfare regimes coupled with a substantial lack of housing policies had a pivotal influence on recent urban expansion in Mediterranean Europe [17,21,22].
In Spain as in Italy, in Greece as in Portugal, home equity was frequently considered a financial buffer, leveraging high rate of home-ownership even among middle-low class households [23]. Land ‘legalization’, continuous revisions of rent level, changes in the building code, and industrial decline, together with bureaucratic inertia, clientele politics and pressures by landowners characterized Mediterranean urbanization, at least up to the early 1990s [24,25,26,27]. These conditions implied a continuous and semi-dense urban expansion into fringe land [28]. Fostering a compact growth of residential settlements around central cities in several metropolitan regions, this development pattern has de facto consolidated the existing mono-centric model, depressing the latent potential to polycentrism, e.g., discouraging growth of employment sub-centers physically distinct from central cities [29,30,31]. In other words, the expansion of large Mediterranean cities is increasingly reflective of more general cyclic waves of urbanization, suburbanization and re-urbanization typical of transitional social contexts increasingly sensitive to economic cycles [28].
Based on these premises, further research is needed to investigate the role of economic cycles in shaping recent urbanization patterns and processes in southern European metropolitan areas experiencing sequential phases of expansion and decline that culminated in the 2007 financial crisis [32]. By verifying the hypothesis that non-linear urbanization paths are the result of sequential phases of economic growth and decline, this study proposes a spatial analysis of building activity over multiple time scales in a Mediterranean city (Athens, Greece), as a case example of sequential economic cycles since the early 1990s [18,23,24,25,27,31]. Athens is a representative case of complex, non-linear expansion paths in southern European cities, attracting multidisciplinary studies and giving room to contrasting interpretations on the relationship between urbanization, economic cycles and socio-demographic local contexts [15,21,22,28,33,34,35].
Our approach was based on the notion of ‘urban trajectories’ across various spatio-temporal scales and metropolitan dimensions [36]. While long-term trajectories of urban systems were investigated using heuristic methodologies grounded on the assessment of one or few urban components [37], the present study proposes a multidimensional framework evaluating long-term changes in building activity and the resulting impact on urban expansion and metropolitan spatial structures. The analysis was grounded on a vast set of quantitative indicators derived from quantitative information on building permits released by Greek municipalities. Building permits data disaggregated at the municipal scale are demonstrated to represent different spatial and functional dimensions of urban growth in an effective and simple way [38], allowing the identification of local-scale responses of the construction industry to economic cycles under place-specific housing and socio-spatial patterns.

2. Methodology

2.1. Study Area

The area investigated in this study includes the mainland part of the administrative region of Attica (3000 km2) including Athens, the capital of Greece, and the Piraeus’ harbor, together with the island of Salamina, whose population mainly commutes into the greater Athens’ area. The area consists of nearly 30% flat land (including Greater Athens, Messoghia, Marathon and Thriasio plains), 20% upland and 50% mountainous land (Parnitha, Penteli, Imitos and Egaleo mountains) administered by 114 municipalities and local communities each releasing building permits, of which 58 municipalities form the greater Athens’ area (430 km2). Since the early 1950s, Attica concentrated more than 30% of Greek population, hosting 3.8 million inhabitants in 2011 (1248 inhabitants/km2) with an annual growth rate stabilizing at 0.2% after decades of uneven demographic expansion with annual rates persistently above 2%.

2.2. Elementary Building Permit Data

Municipal data encompassing 27 years between 1990 and 2017 were derived from the annual census of all issued residential building permits (of any kind and value) in Greece carried out by the Hellenic Statistical Authority (ELSTAT). The survey was held in co-operation with local administrative authorities that collect on a yearly basis questionnaire on the building activity compiled by professional engineers in the Town Planning Offices that release the building permits. Surveyed variables include number of new buildings and/or building additions, and the related surface area and volume, including public and private properties. Using data at the spatial level of municipalities allows full comparability along the study period. To identify differential spatial trends in building activity across short- and medium-term intervals, the study period was partitioned into four-time intervals of 7 years.

2.3. Building Activity Indicators

Following earlier studies [38], a vast set of indicators was derived from building permits released by Greek municipalities situated in the study area with the aim to provide a comprehensive picture of long-term building activity in Athens, (i) identifying relevant analysis’ dimensions at local scale and (ii) linking urban morphology with economic cycles at regional scale. Dimensions of urban growth investigated in this study include (i) the city’s vertical profile; (ii) the city’s horizontal profile; (iii) house size preferences; (iv) greenfield/brownfield development (i.e., regeneration and re-use of urban spaces); (v) land consumption and (vi) urban centrality (e.g., competitiveness among municipalities in releasing building permits as a proxy for economic attractiveness of public/private investments and primary/secondary residences).
A total of 12 indicators were derived from elementary data previously described and calculated by aggregating the building permits issued in each time interval studied at the municipal scale. The selected indicators provide a diachronic assessment of average characteristics and typology of buildings (Table 1).
Resident population and land surface for each municipality of the study area were derived from data collected on the behalf of the national censuses of population and households held by ELSTAT in 1991, 2001 and 2011. For each time interval, the spatial distribution of each indicator was mapped using shapefiles of municipal boundaries provided by ELSTAT.

2.4. Background Indicators

Background indicators were calculated at the same spatial scale with the aim of profiling the territorial and socioeconomic local context characterizing each municipality of the study area. Indicators included topographic and territorial metrics of (i) elevation; (ii) proximity to the sea coast line; (iii) municipal area; as well as (iv) a climate quality index; (v) a soil quality index and (vi) an indicator measuring number of years after approval of the first town plan (0 means no plan still approved, 2017 was considered the reference year for calculation). The linear distance of each municipality from the centroid of 6 urban centers (Athens, Piraeus, Maroussi—the municipality hosting the new Olympic Stadium, Markopoulo Messoghias—a municipality close to the international airport and acting as the center of the rapidly-expanding Messoghia suburban district, Aspropyrgos—an economic centre in western Attica—and Oropos—a rural center in northern Attica) was also calculated, producing other six indicators (vii–xii). Distances were calculated by computing polygon centroids with ArcGIS 9.3 package (ESRI Inc., Redwoods, CA, USA).

2.5. Data Analysis

Building activity indicators were analyzed using a mix of multivariate (hierarchical clustering, k-means clustering) and inferential (non-parametric correlations) statistical techniques. Descriptive statistics were calculated for all the time windows illustrated in Section 2.3. Maps of relevant indicators were finally prepared.

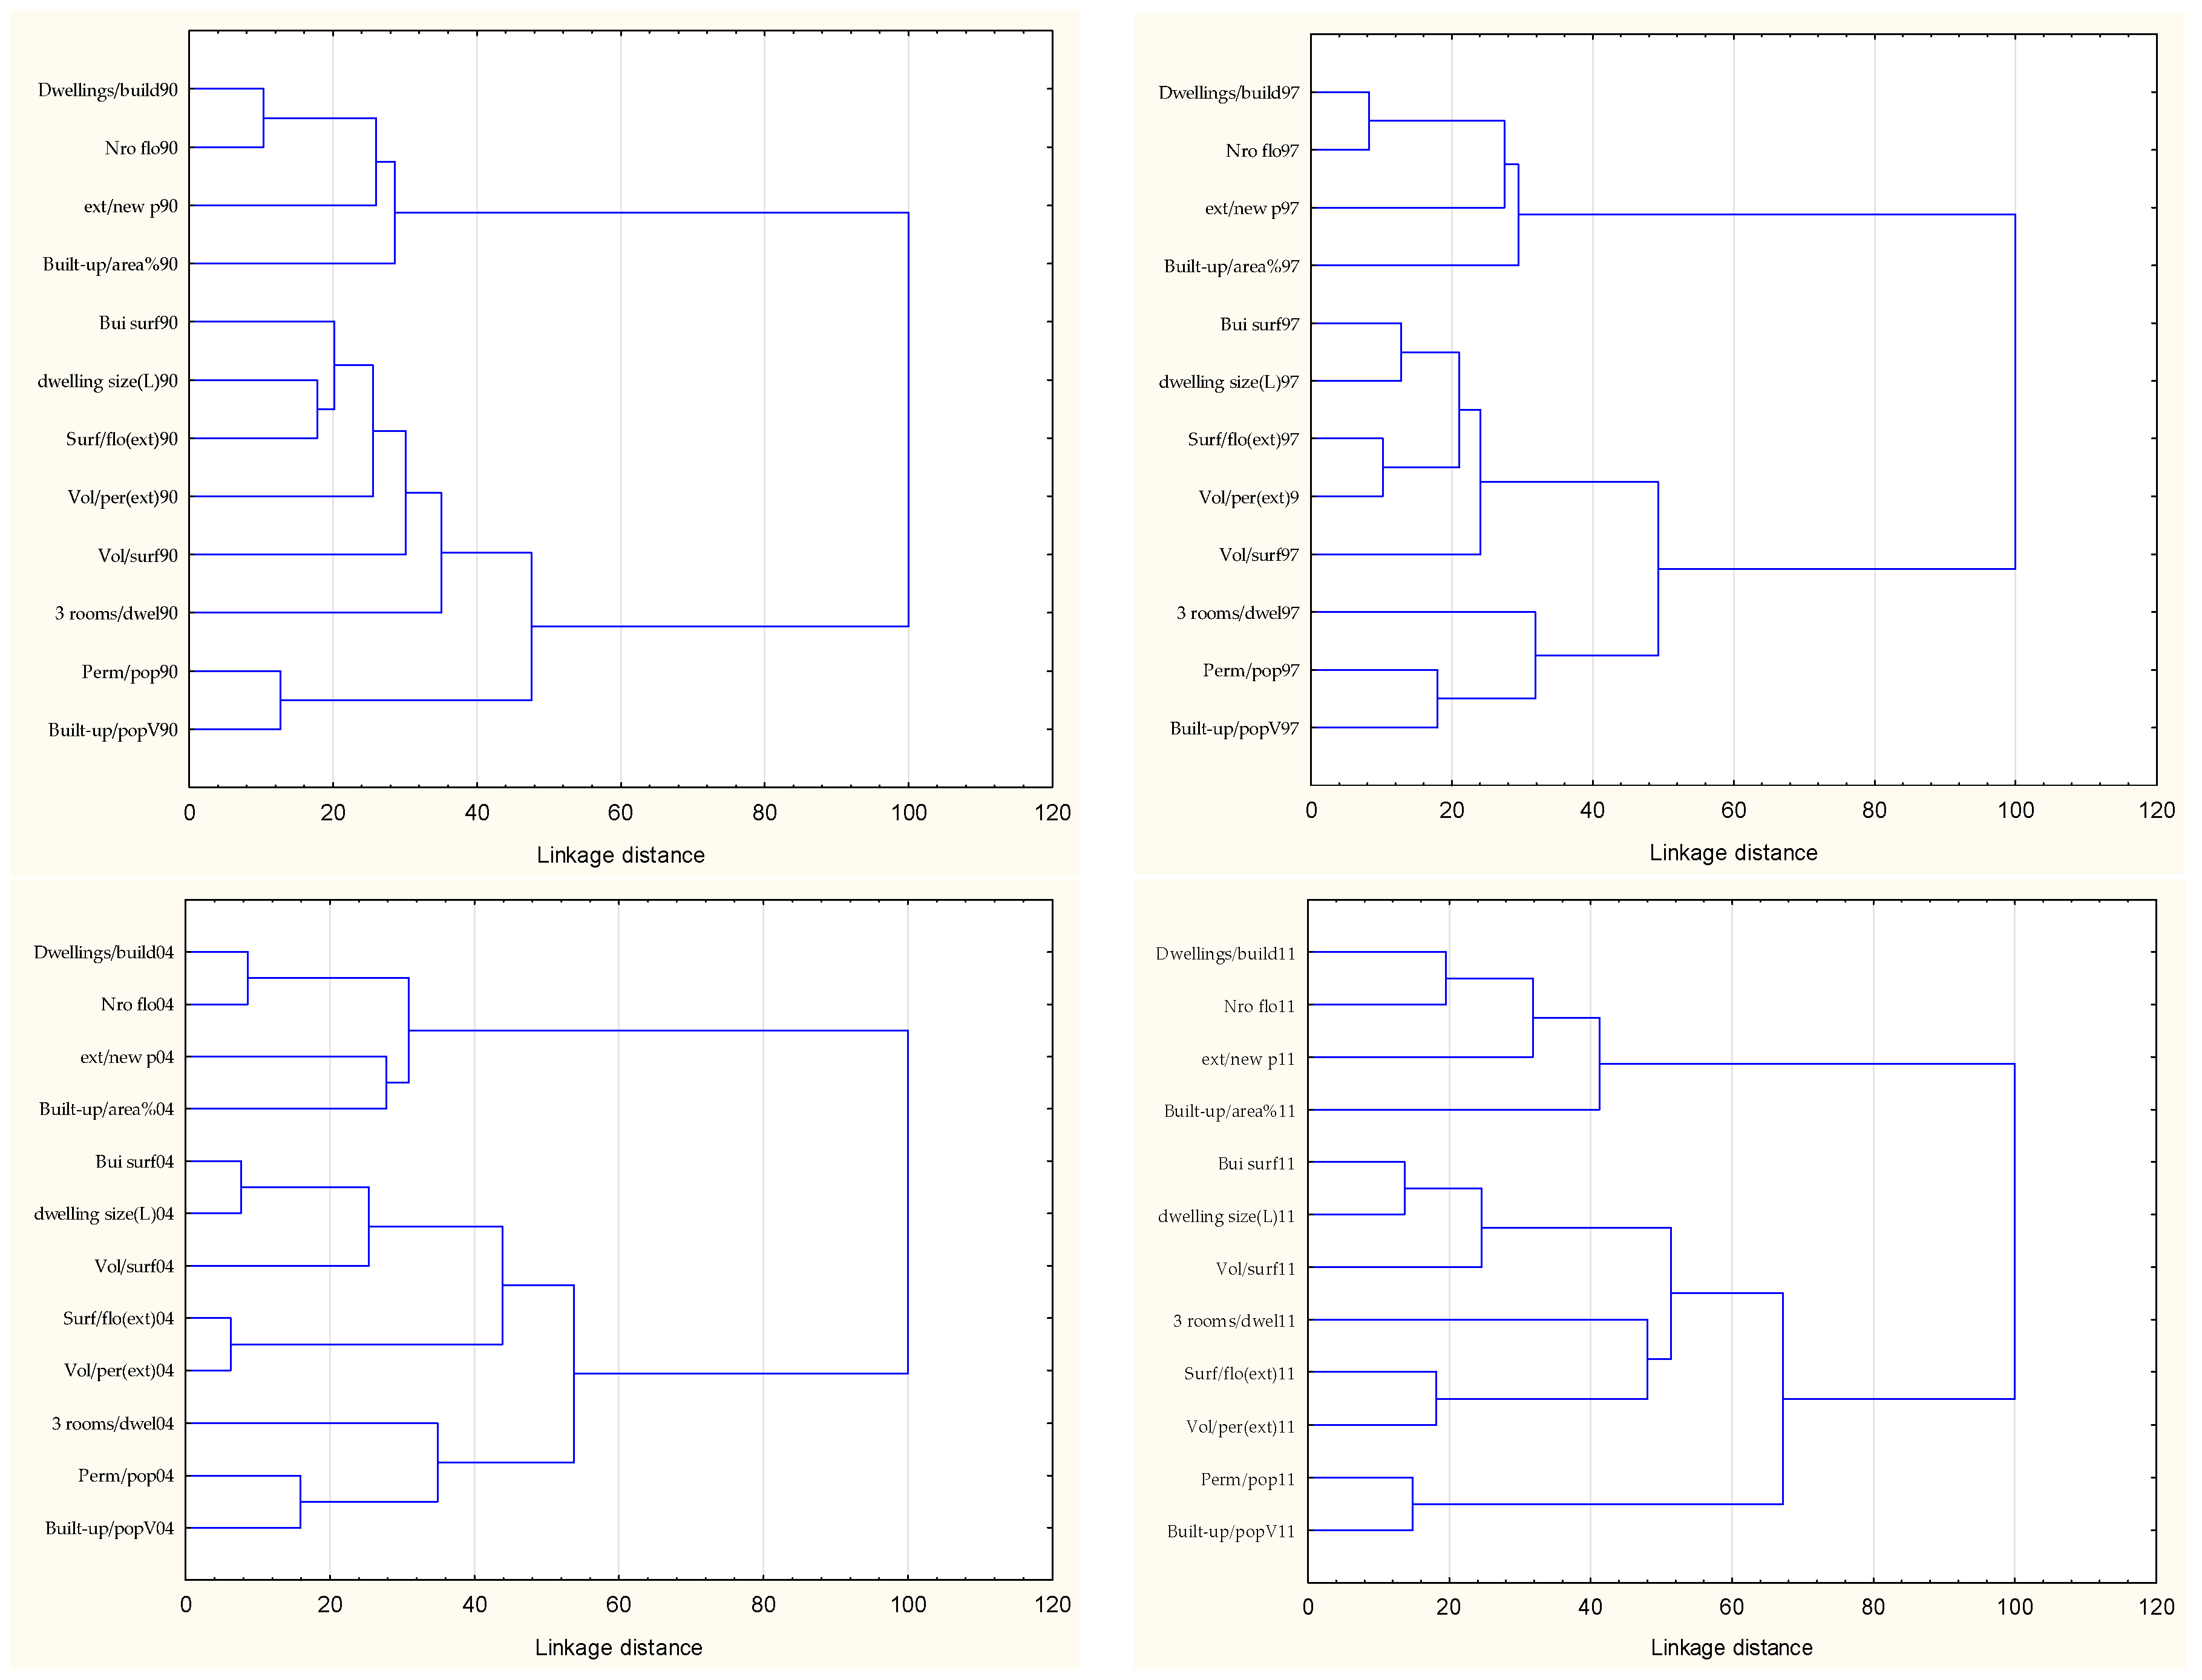
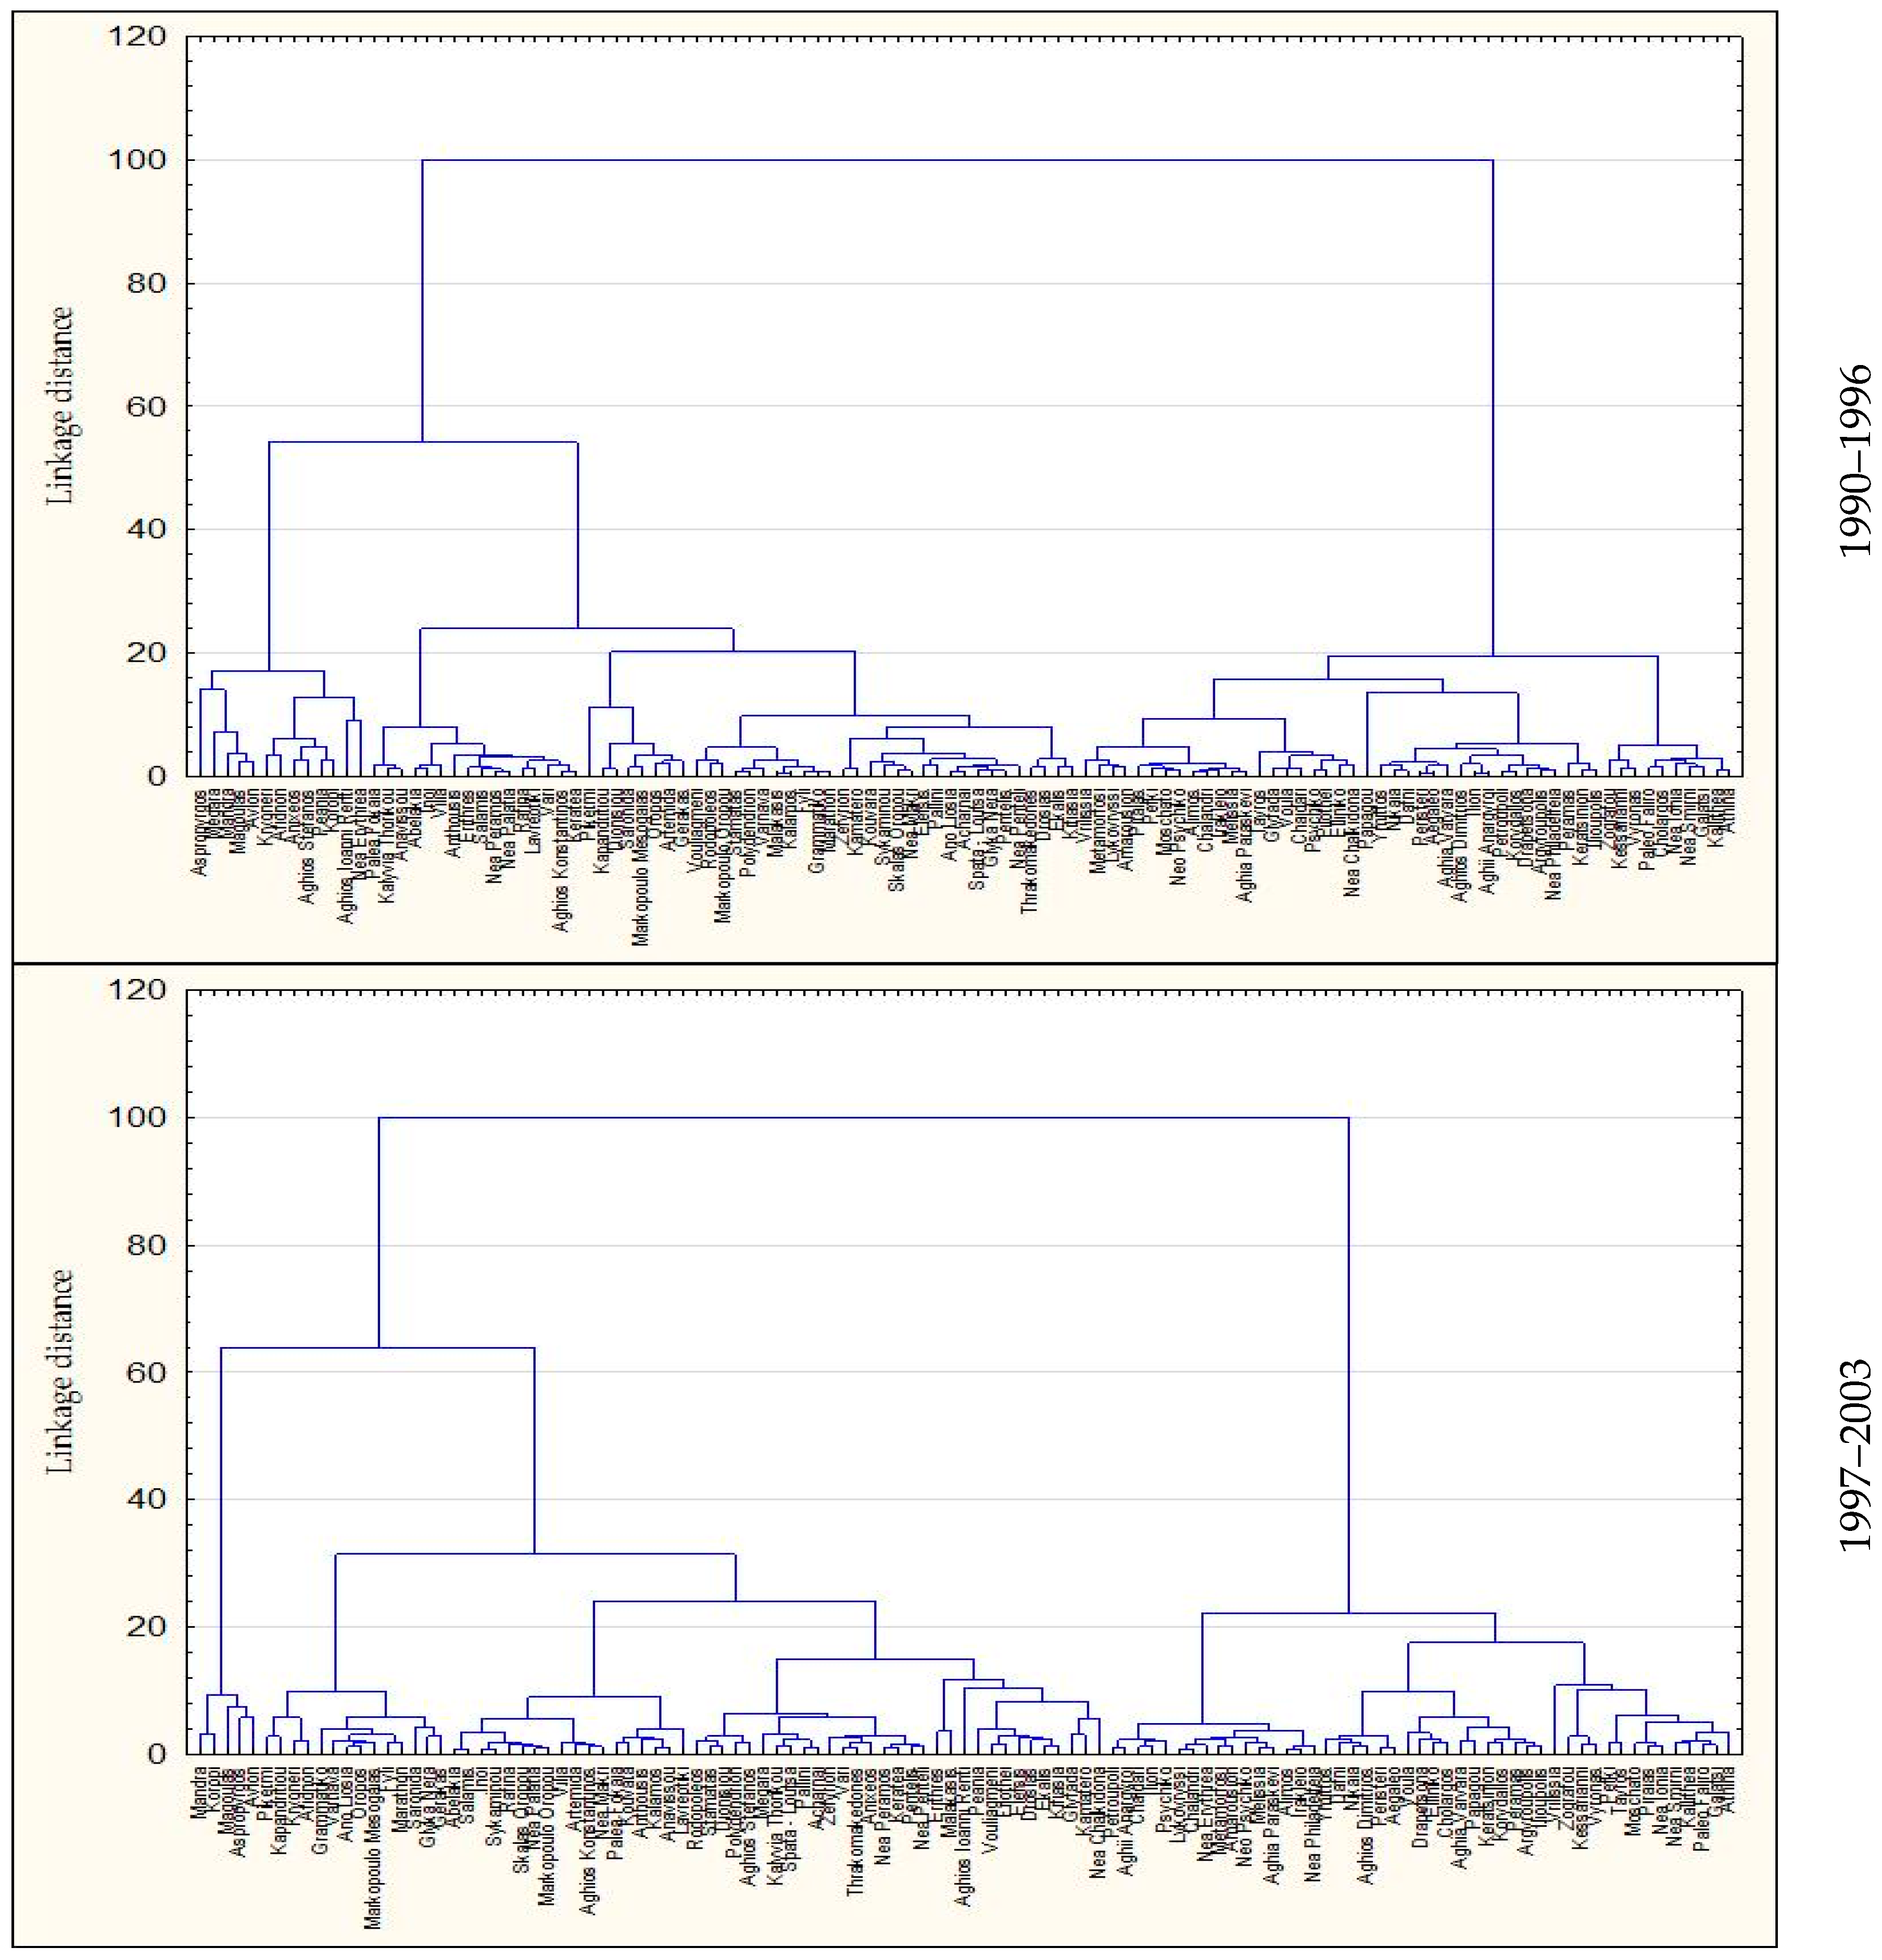
2.5.1. Hierarchical Clustering

Hierarchical clustering (HC) is a statistical approach aimed at deriving a cluster hierarchy from a data matrix. Most clustering techniques use specific metrics that quantify the distance among pairs of elements and a linking criterion that specifies the dissimilarity of two sets of elements (clusters) as a function of the similarity (measured with an appropriate geometric distance) among elements in the two sets. The choice of an appropriate metric influences the shape of the clusters, since some elements can be closer by using one distance and more distant by using another. Among the most common metrics, the Euclidean distance implemented with Ward’s agglomeration rule has been used to derive classification trees (dendrograms) from a data matrix composed of 12 (standardized) indicators of building activity at the spatial scale of municipalities (n = 115). Dendrograms were used to graphically assess similarity (or divergence) in the spatial distribution of building activity indicators separately for each investigated time interval [39]. Analysis’ variables were standardized prior to clustering. Indicators assuming a similar spatial pattern clustered together in the same dendrogram branch. Homogeneous variables were identified using a similarity threshold at 60% linkage distance.

2.5.2. K-Means Clustering

Real estate market segmentation may be achieved by applying cluster techniques that allow identification of homogeneous sub-markets based on specific metrics of building activity [40,41,42,43,44]. Due to its inherent limits, complexity and heterogeneity, urban real estate markets can be segmented into sub-markets by analyzing consistent associations among performances (characteristics) and economic attributes [45,46,47]. Related to the real estate market, cluster analysis was applied for several purposes, e.g., to represent the relations among real estate prices and urban transformations [40,46,48,49]. In our case, identification of real estate sub-markets based on building activity metrics may provide further information on latent mechanisms of urban growth during economic expansion and recession.
The K-means technique is a clustering algorithm that allows partition of a set of objects into K groups based on their attributes, intended as individual elements of a vector space. In the present work, a k-means clustering was run separately for each time interval studied on the same data matrix illustrated in Section 2.5.1, with the aim to identify real estate sub-markets (and their changes over time) based on the analysis of building activity indicators. Municipalities were partitioned in four groups, according to the optimal partition defined using the cubic clustering criterion. For each cluster and time interval, average and standard deviation of each indicator were calculated. Characteristic indicators for each cluster were defined when the related standardized value assumes values higher than |1|. Maps also were prepared to illustrate cluster’s membership of each municipality in the study area.

2.5.3. Non-Parametric Correlations and Two-Way Joining

Maps were used to illustrate spatial variations in building activity over time. A non-parametric Spearman rank correlation analysis (CA) was used to investigate pair-wise relationships between indicators of building activity and a set of contextual indicators profiling municipalities according to background territorial and socioeconomic conditions (see Section 2.3), testing for significance at p < 0.05 after Bonferroni’s correction for multiple comparisons.
An overall analysis was also carried out by calculating the percentage of significant correlations in total comparisons by (i) building activity indicators (n = 12); (ii) contextual indicators (n = 12); and (iii) time periods (n = 4). A two-joining clustering run on a data matrix constituted of pair-wise Spearman rank coefficients between building activity and contextual indicators was finally adopted with the aim of summarizing results of the correlation analysis. Two-way joining is a multivariate technique analyzing two-dimensional data matrices under the assumption that both cases (building activity) and variables (contextual indicators) contribute to the uncovering of meaningful latent patterns. Two-way clustering produces a graph ordering cases and variables based on similarity patterns. This graph illustrates the distribution of standardized scores (with zero-average) for each case and variable using different colors. Identification of similar (positive or negative) scores for a group of variables and cases allows definition of specific clusters.

3. Results

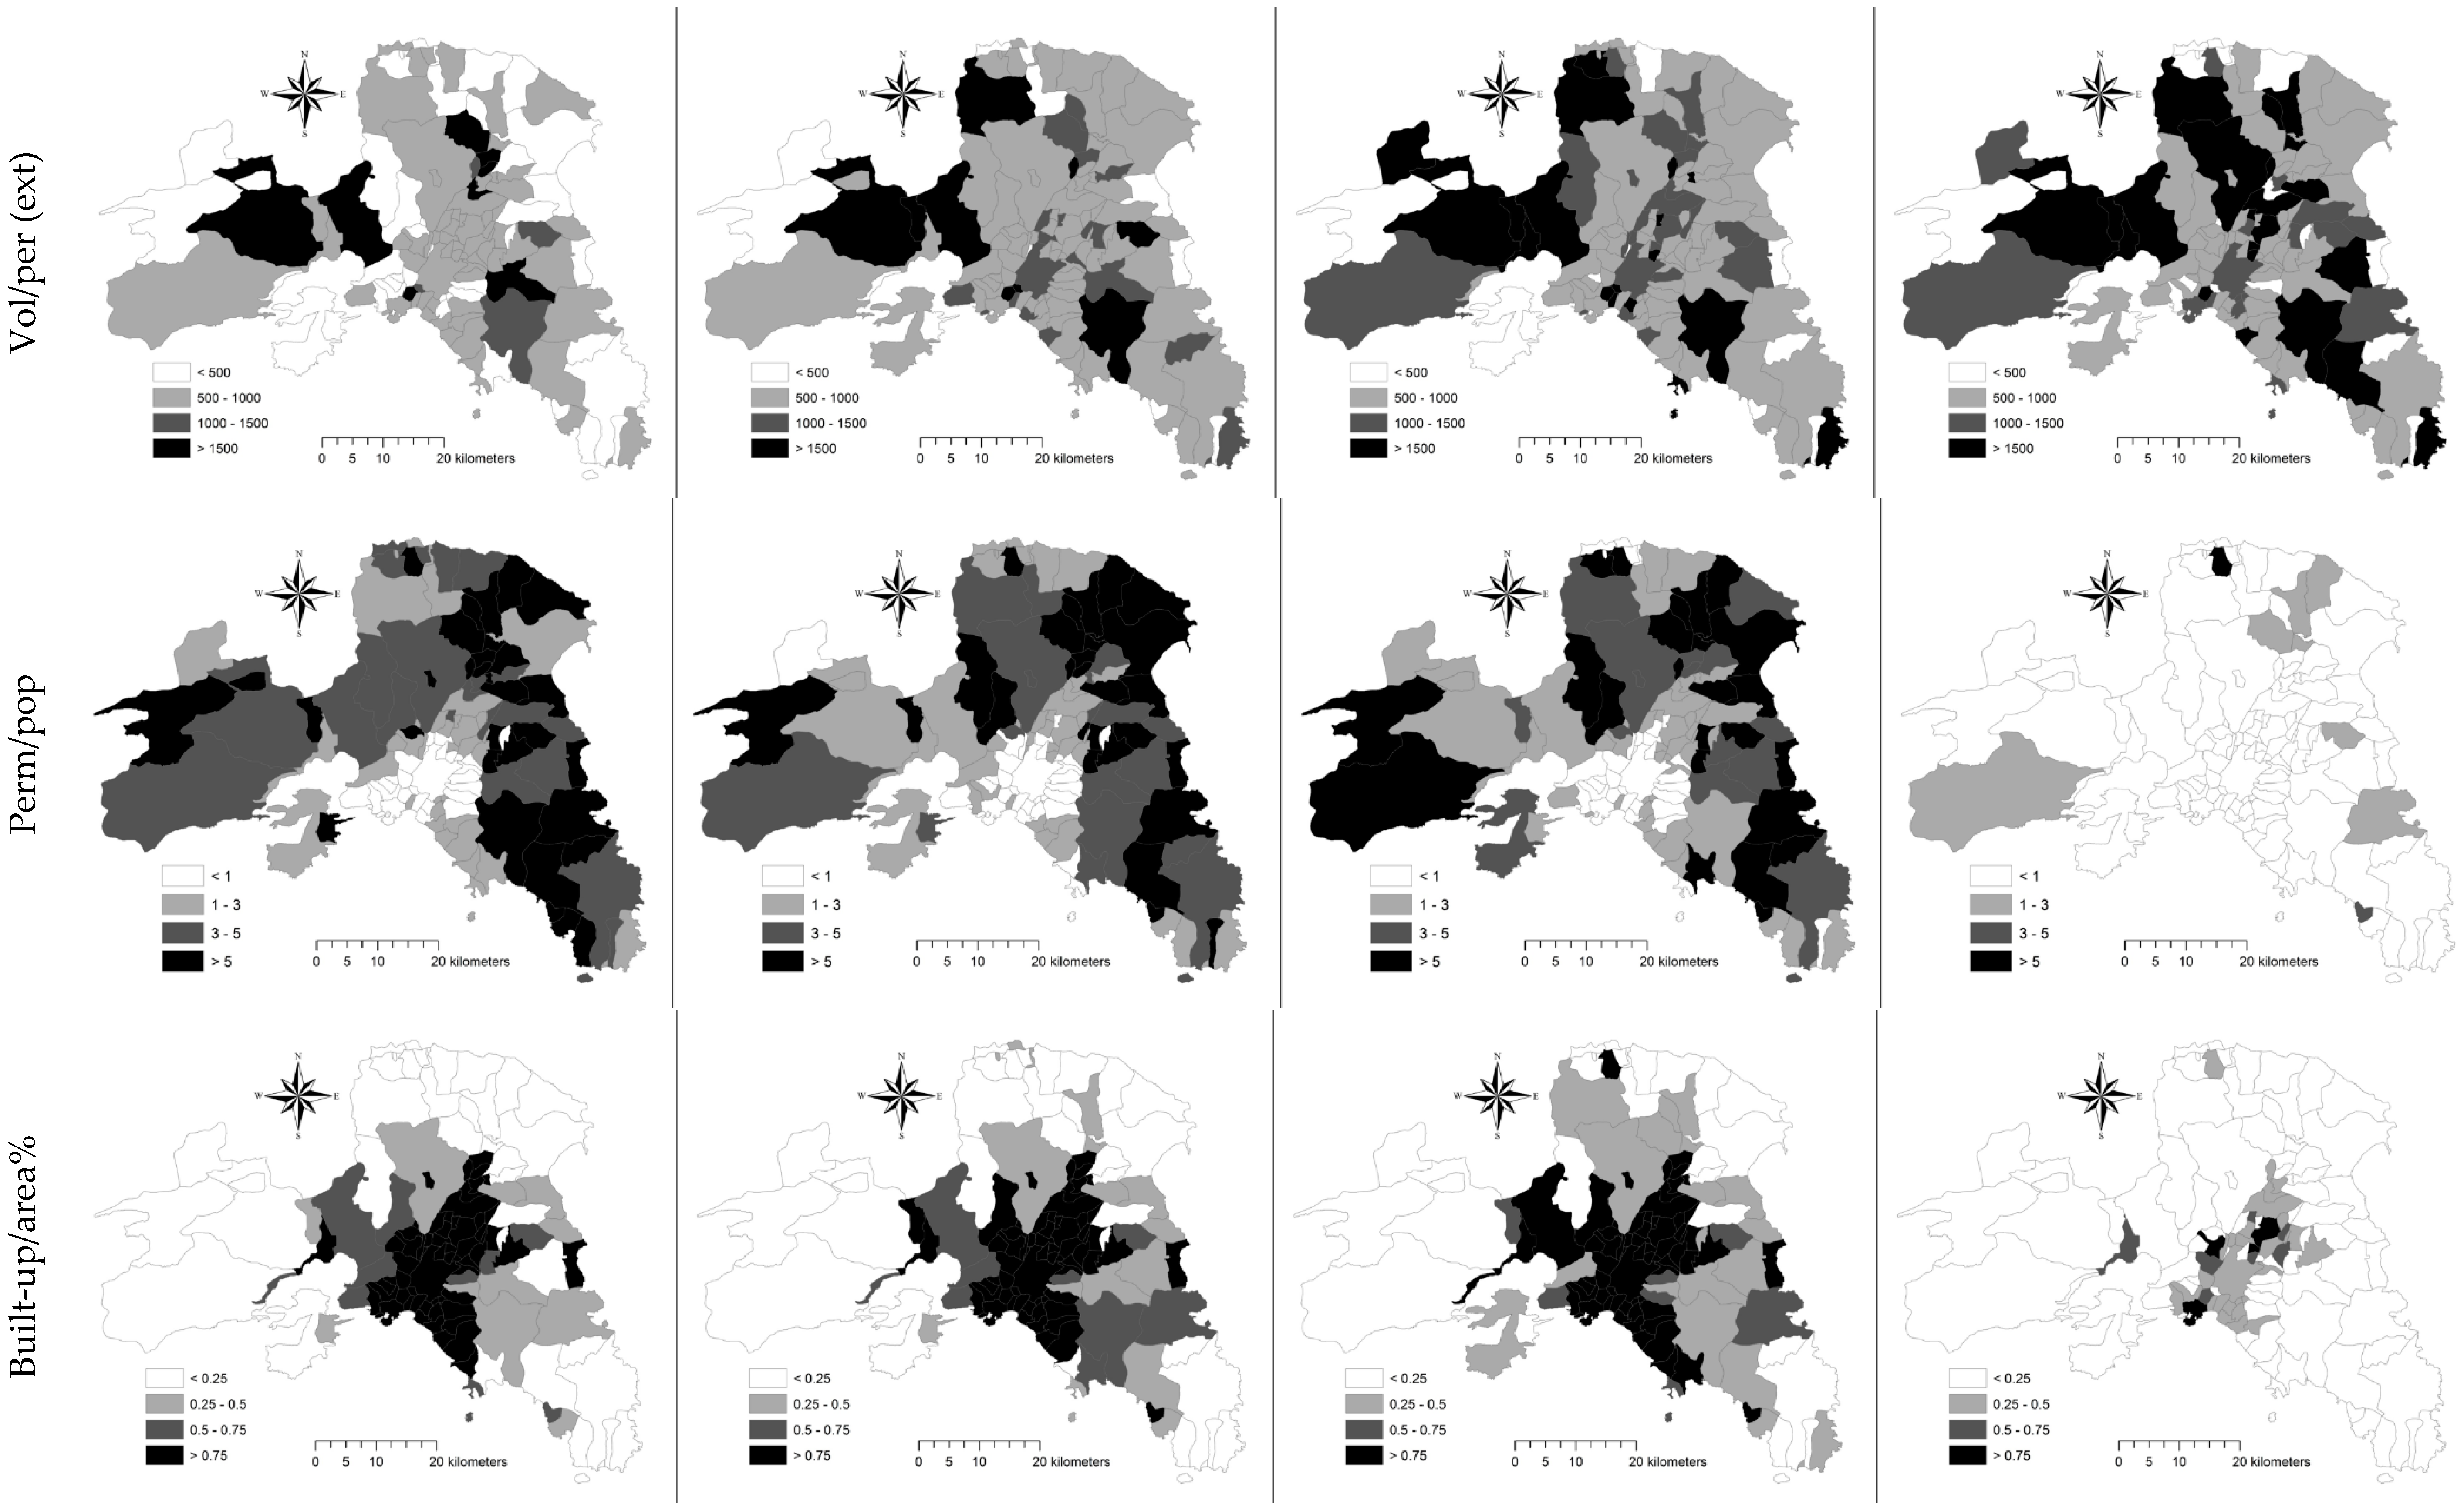
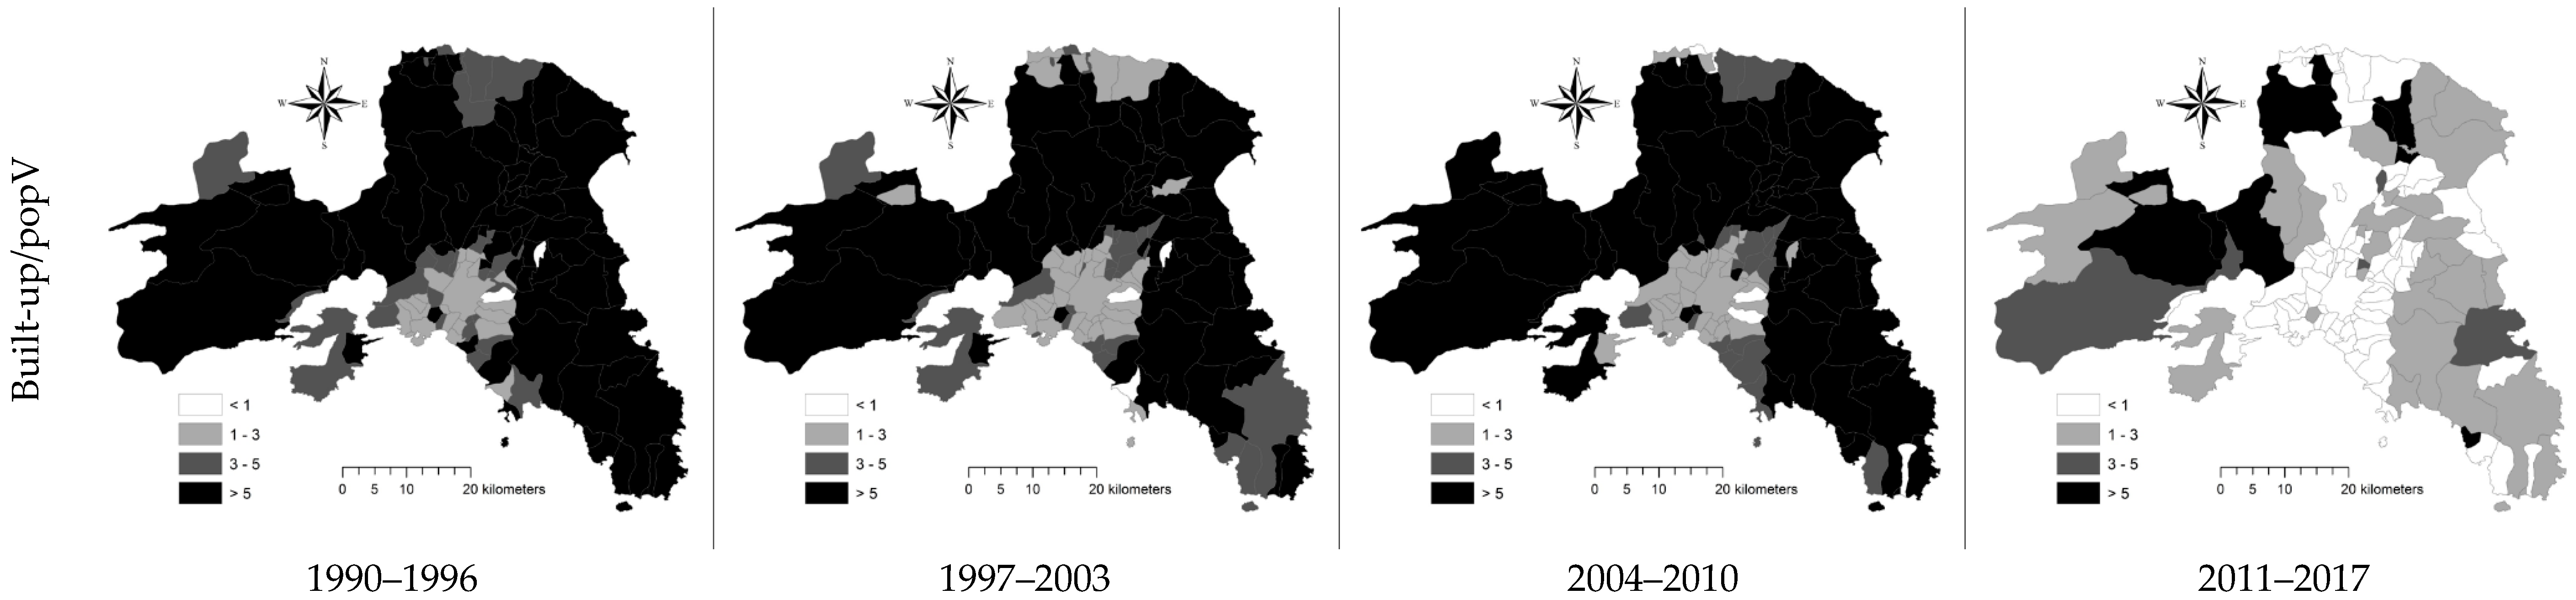
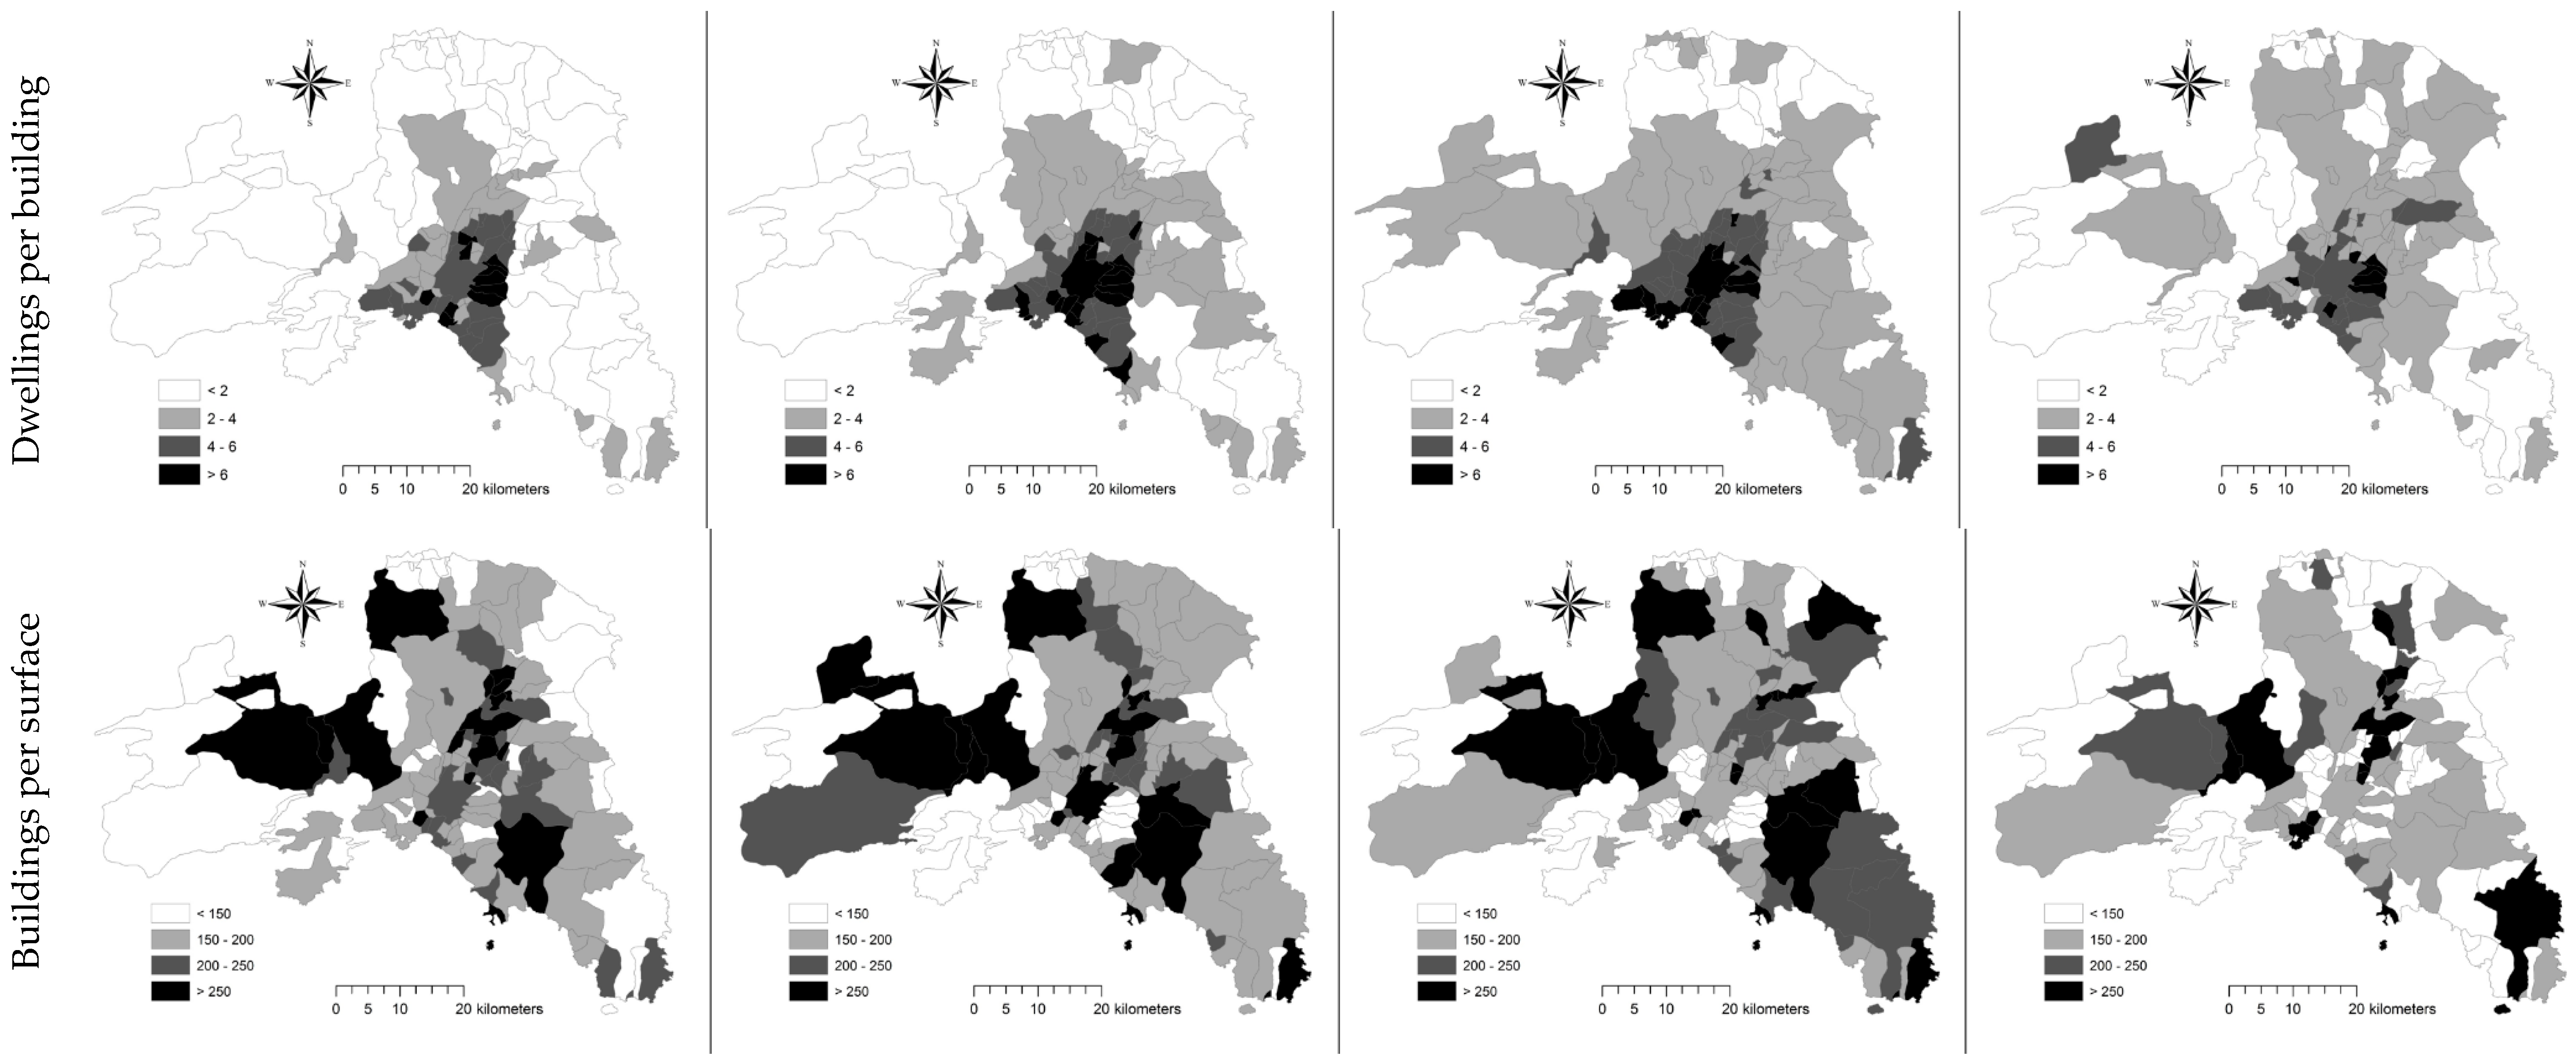
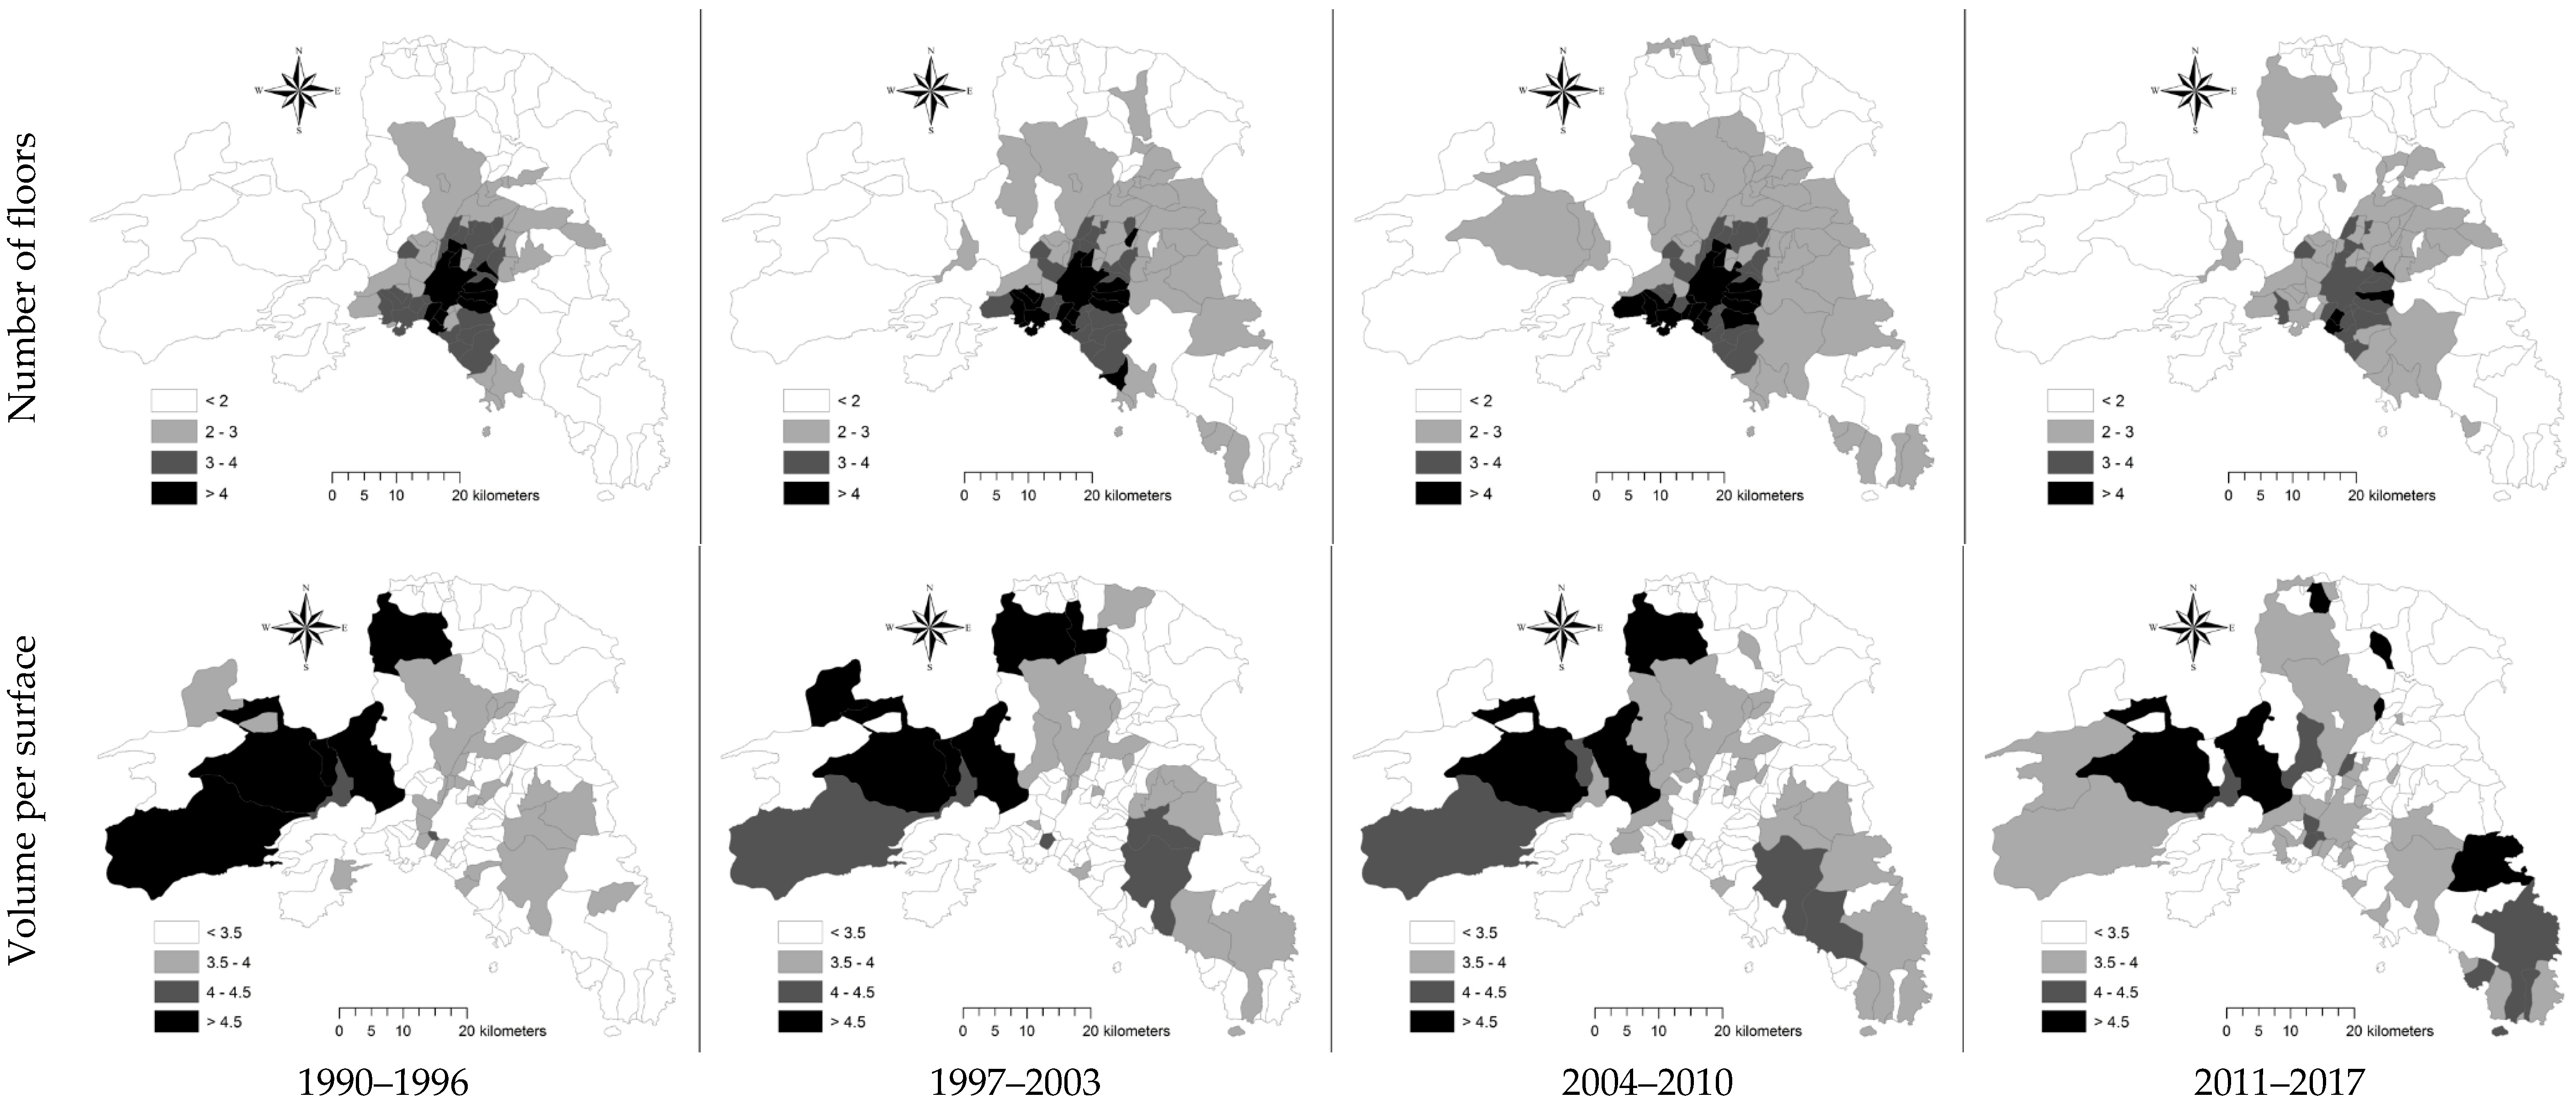
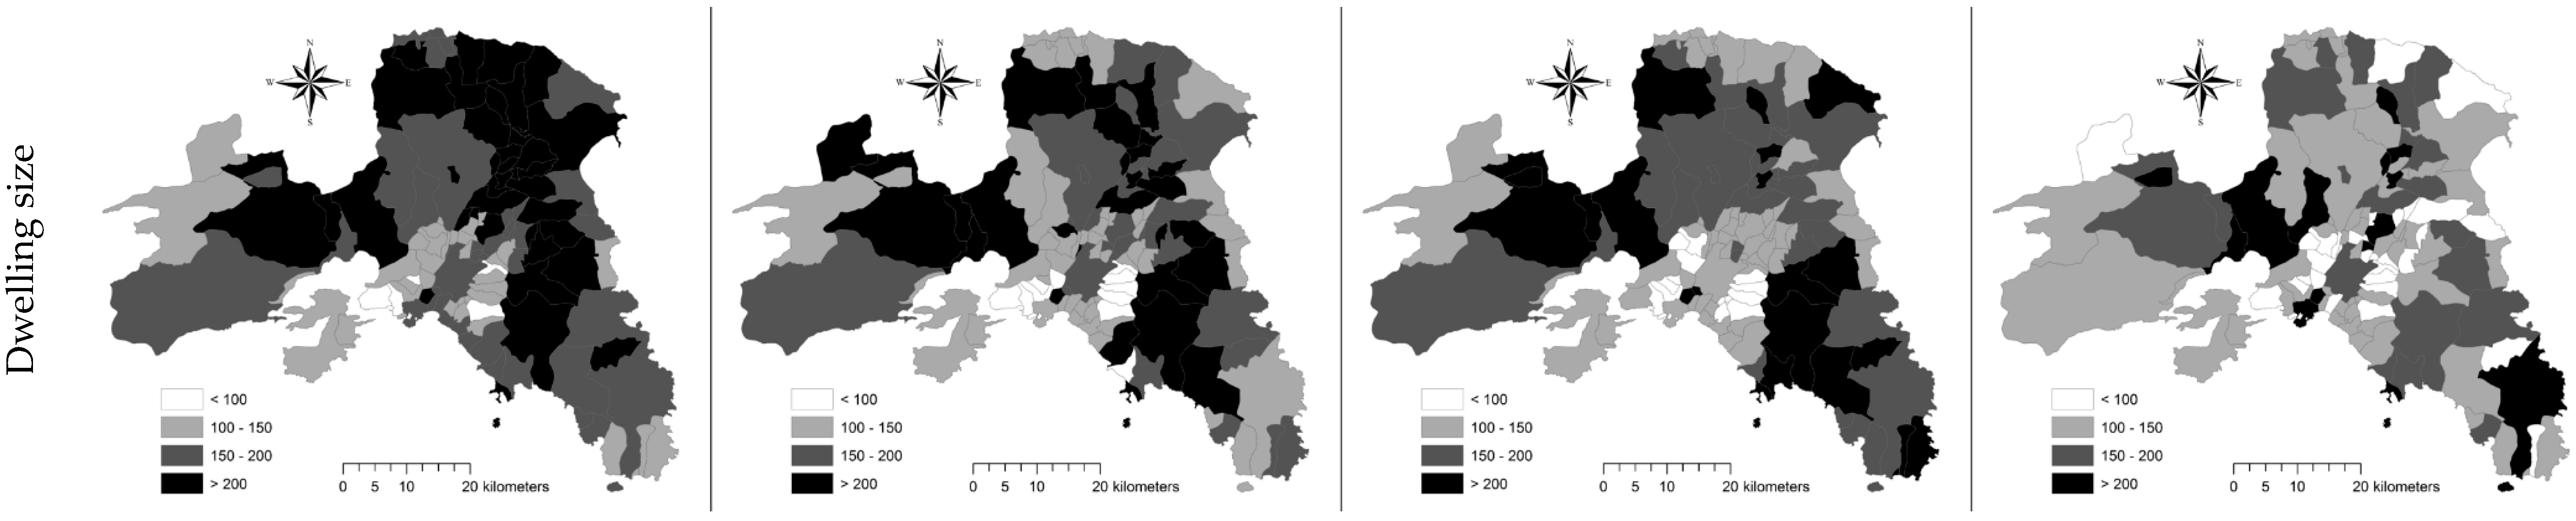
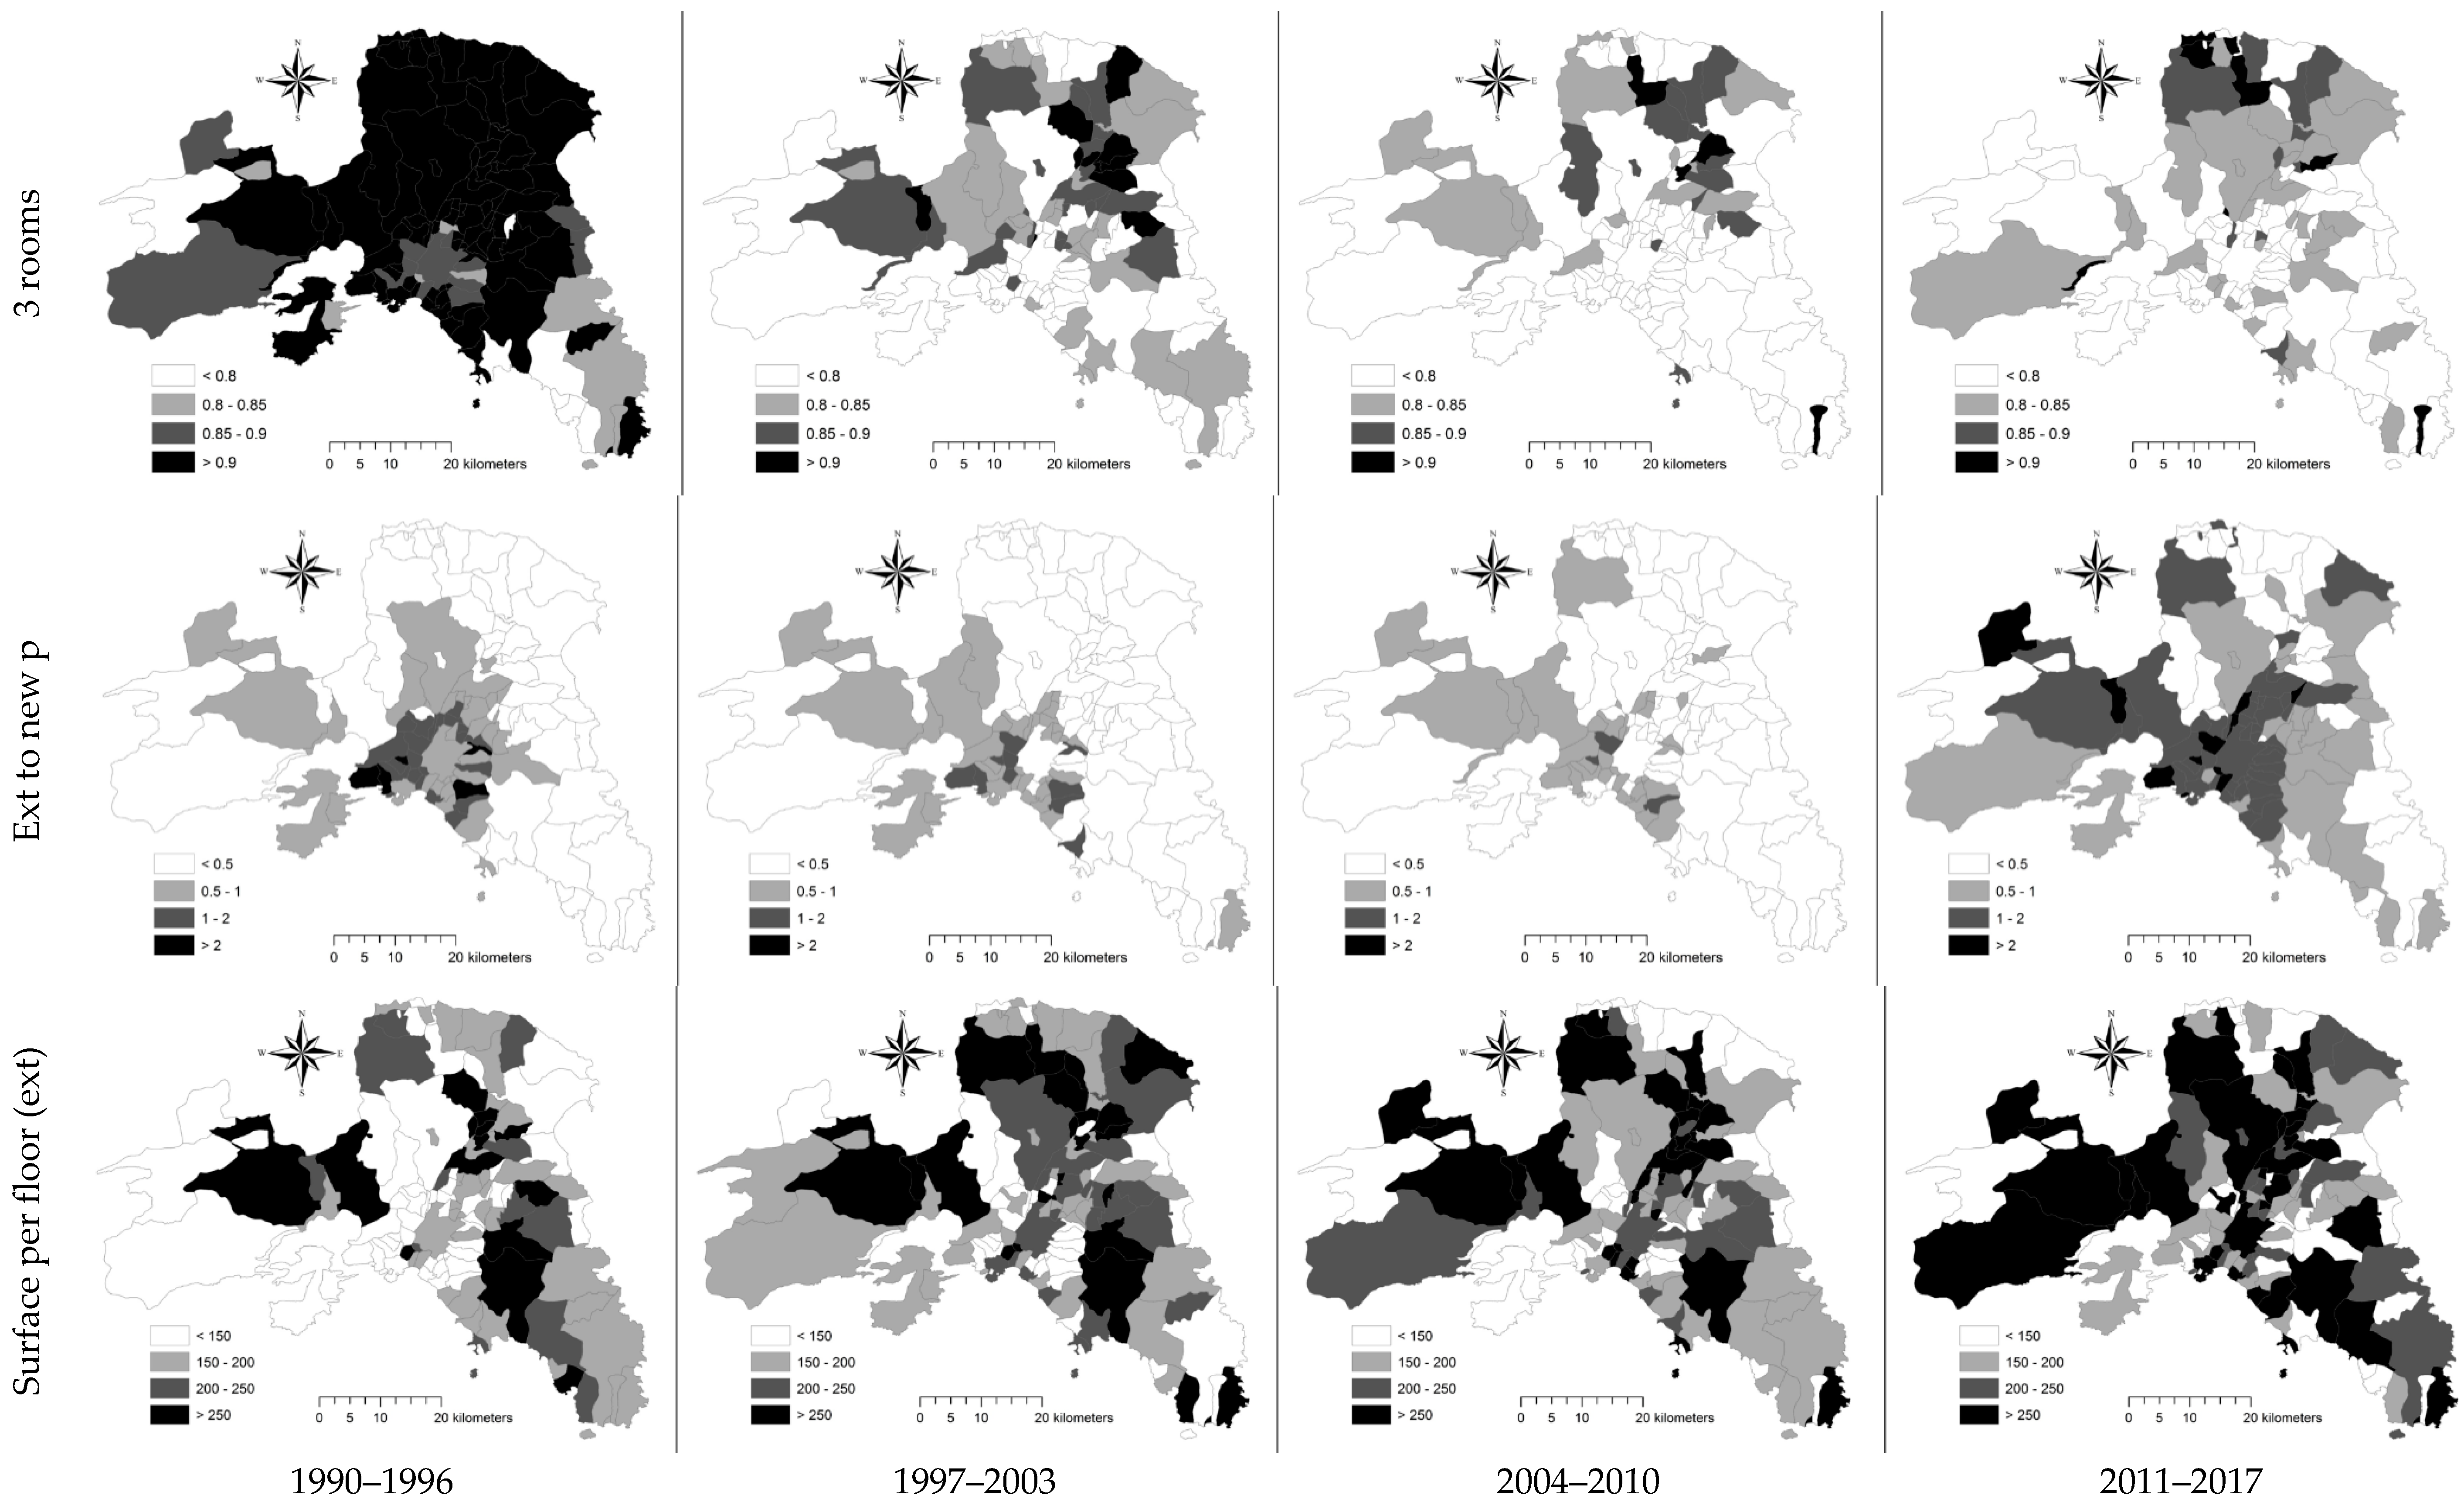
3.1. Descriptive Analysis

Figure 1 illustrates the spatial distribution of four indicators of building activity investigating urban dynamics at settlement scale. Such indicators outline a radio-centric expansion of Athens, with variable intensity according to the studied time interval. The highest intensity of urban growth was observed during the first time period (1990–1996), maintaining relatively high in the two subsequent time intervals (1997–2003 and 2004–2010). The last interval (2011–2017) was characterized by moderate settlement growth in suburban areas and a slight recovery of building activity in central districts, mainly driven by building expansion rather than new constructions.
Analysis of buildings’ characteristics (Figure 2) corroborates the assumption of a recent radio-centric expansion with variable intensity and spatial direction over time, justifying a diachronic, local-scale analysis of building activity in Athens. Vertical profile of buildings consolidated a center–periphery gradient at all time intervals. The number of dwellings per building was an honest indicator of urban centrality during both economic expansion and crisis. Conversely, the spatial distribution of volume-to-surface building ratio was used to outline suburban locations—mainly in western Attica during periods of economic expansion, decreasing with the most recent recession. The number of buildings per surface area was likely the most variable indicator over space, highlighting specific peri-urban and rural locations.
Analysis of a dwelling’s characteristics (Figure 3) outlined more evident differences over time, suggesting a considerable impact of economic downturns on housing preferences. A classical rural-urban divide was observed for average dwelling size, weakening markedly during the recession. The spatial distribution of large dwellings may confirm this trend. Concentrating on fringe districts during economic expansion, building extensions increased in number, surface and volume during the recession, with a particularly heterogeneous spatial pattern in the Greater Athens’ area and in western Attica. Finally, the surface-per-floor ratio was oriented along a suburban–urban gradient during economic expansion and shifted to a more mixed spatial pattern during crisis, reaching the highest values in central locations (Athens, Piraeus) as well as in some rural places (especially in western, south-eastern and north-western Attica).

3.2. Hierarchical Clustering of Indicators and Locations

Hierarchical clustering outlines similarities and divergences in the spatial pattern of building activity indicators, evidencing a relatively stable structure over time (Figure 4). The cluster located in the upper part of each dendrogram (including dwellings per building, average number of floors, the ratio of extension to new building permits and the share of new built-up area in total municipal land) was constant at all time intervals. As shown in earlier analysis (see Section 3.1 and Figure 1, Figure 2 and Figure 3), the spatial distribution of such indicators follows a characteristic urban–rural gradient, reflecting changes in the vertical profile of buildings associated with urban concentration and densification processes. Composition of a second cluster (lower part of each dendrogram) was more variable (per capita number of permits and per capita new built-up area), including the share of dwellings with 3 rooms in total dwellings only during economic expansion (1997–2003 and 2004–2010). These indicators outline fringe locations with accelerated building activity. In these areas, temporal variations in building activity were higher during the recession. A central cluster included all the remaining indicators (at the scale of dwellings or buildings), with marked spatial-temporal fluctuations reflecting variability in housing preferences and latent trends toward horizontal city growth and brownfield development respectively during economic expansion and crisis.
Taken together, cluster analysis identified a gap between urban and rural municipalities with some relevant exceptions. The right cluster in Figure 5 includes strictly urban municipalities at all time intervals (Athens is the last municipality in the right side). This cluster includes a relatively constant number of municipalities for the first (1990–1996) and the second (1997–2003) period. Municipalities belonging to this cluster increased moderately in the third period (2004–2010) and more evidently in the last period (2011–2017) corresponding to economic recession. In this case, some peri-urban municipalities were clustered together with urban locations. The rural cluster outlined a reverse pattern, with elements reducing in number from economic expansion to crisis. The sub-cluster at the left side of each dendrogram was also relatively stable and includes typical suburban locations growing rapidly during economic expansion. Composition of this sub-cluster changed significantly with recession, including both rural locations (Oropos), marginal urban locations (Agios Ioannis Rentis) and some fringe municipalities (Aspropyrgos, Krioneri). This sub-cluster displays specific characteristics of a suburban real estate market, being particularly sensitive to economic downturns and showing a more heterogeneous composition than the other clusters.

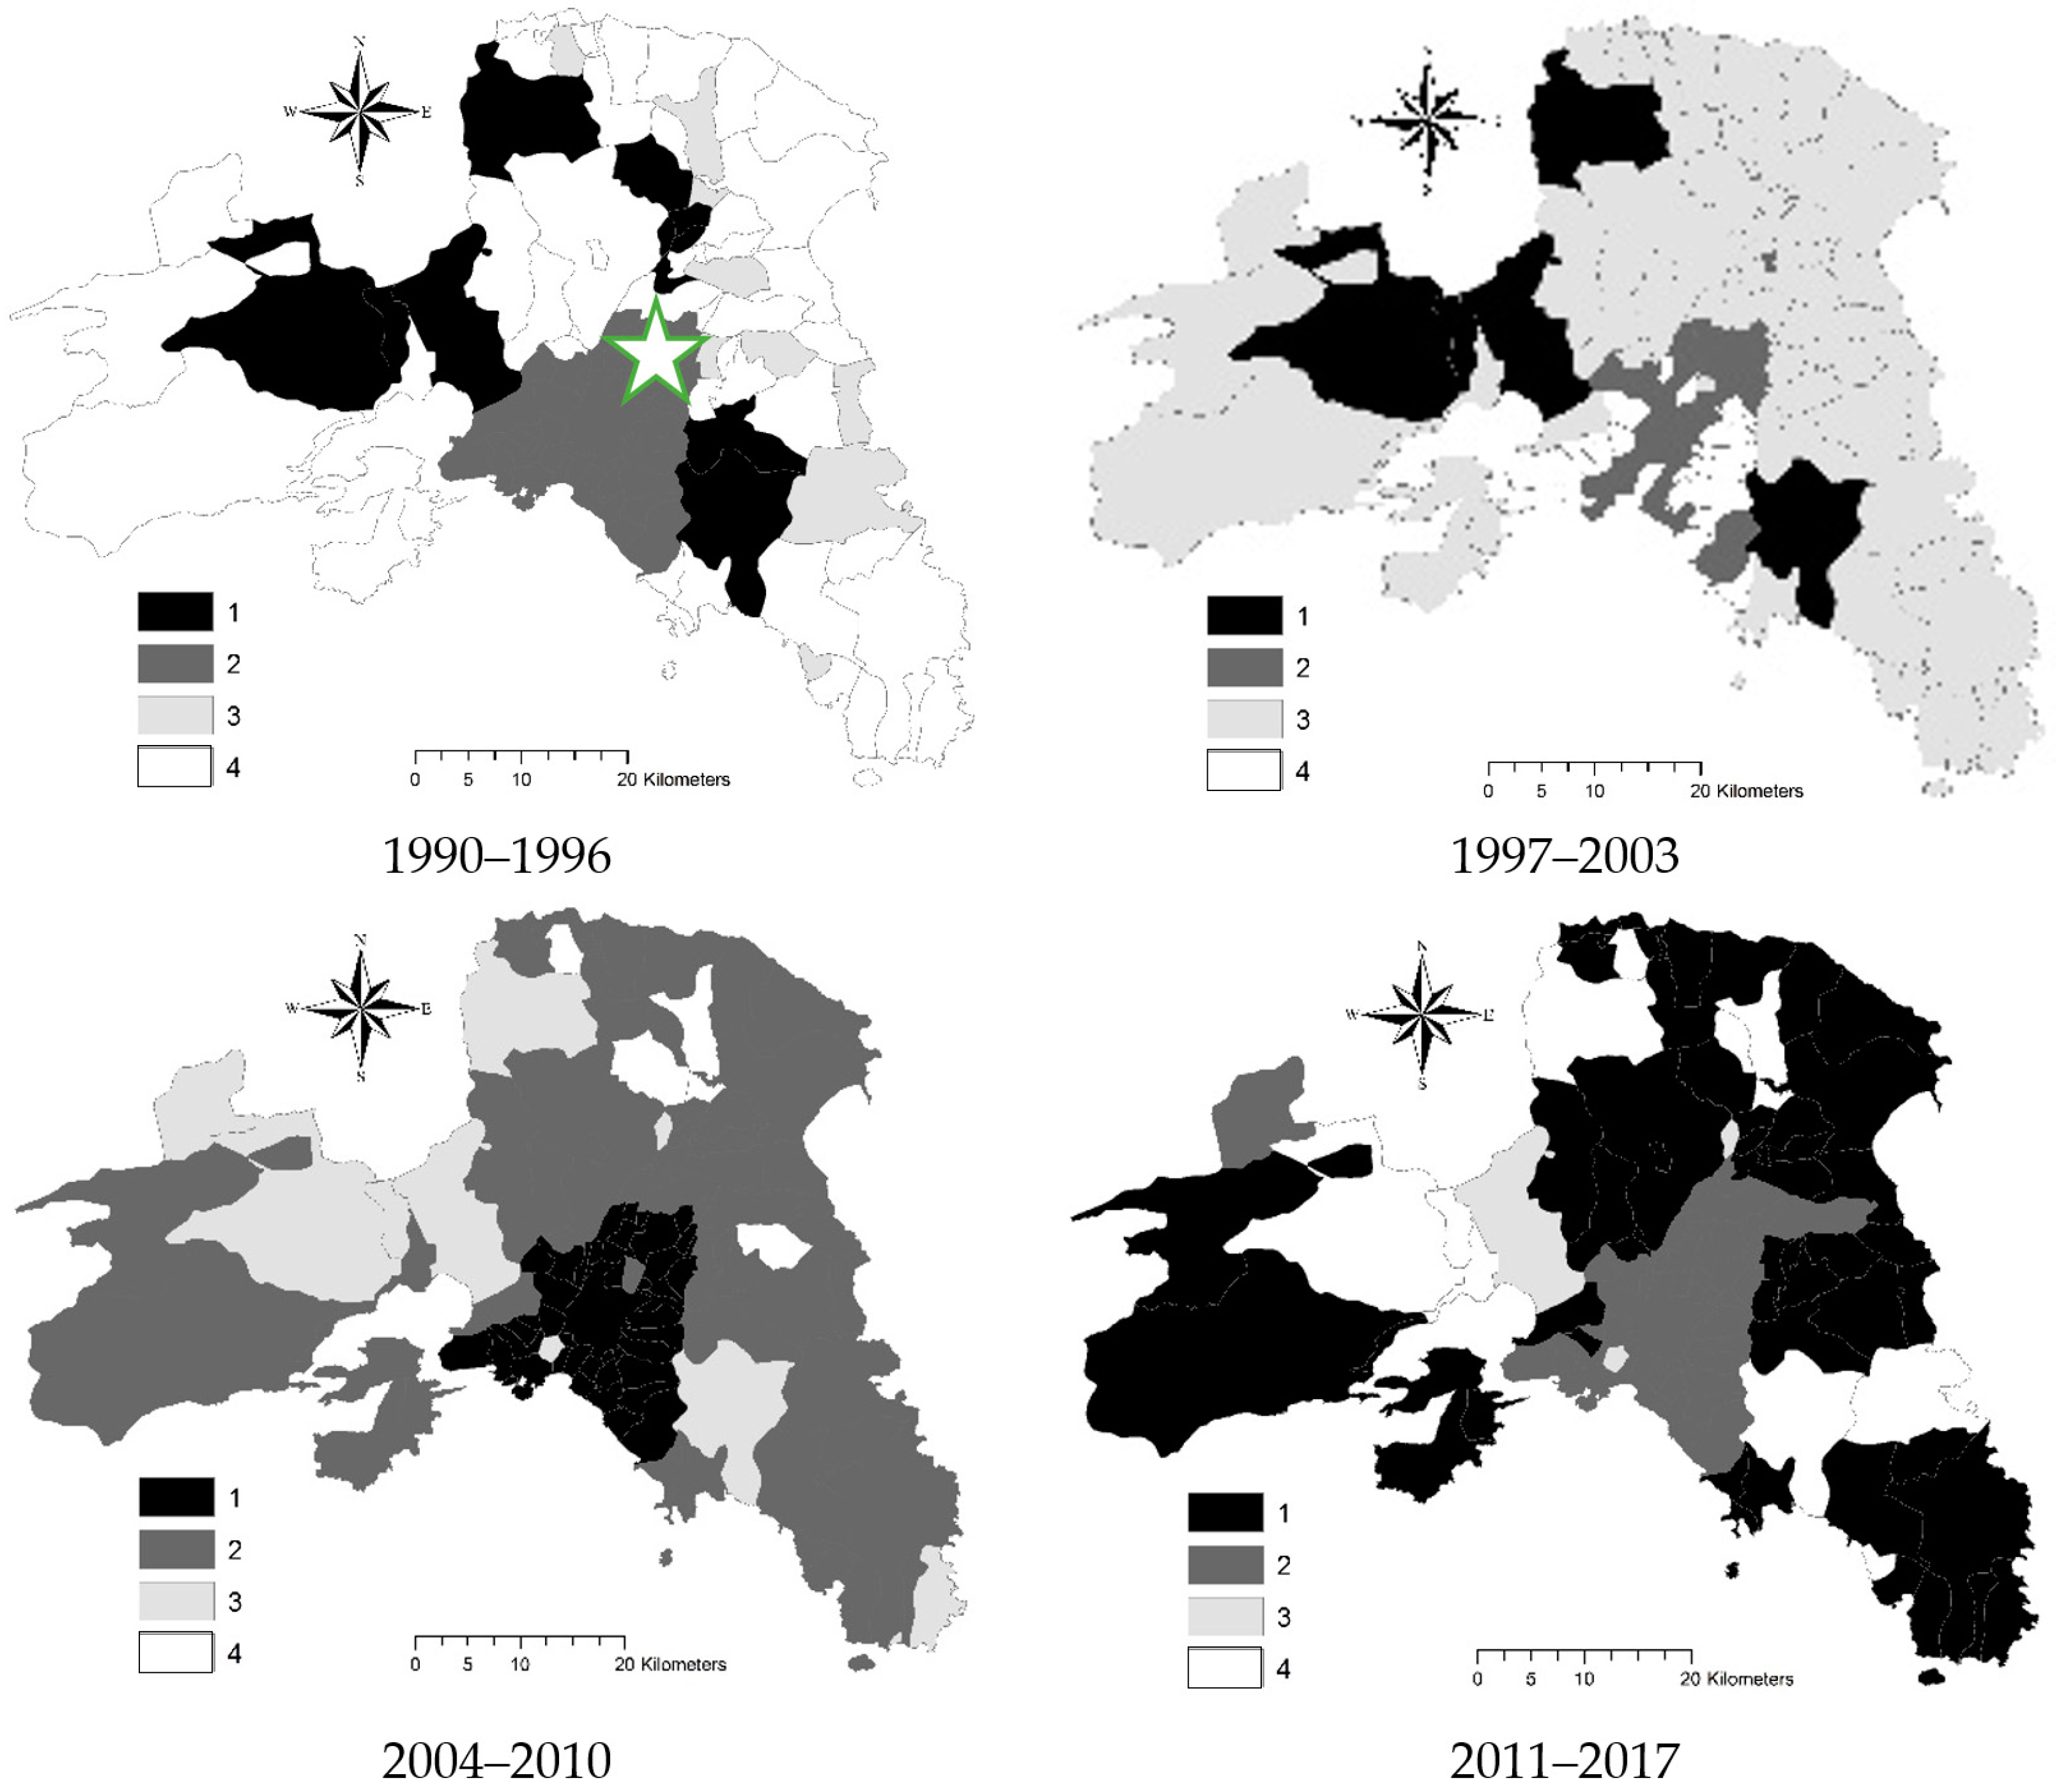
3.3. Market Segmentation Using a K-Means Clustering Strategy

A k-means classification of municipalities in the study area (Figure 6) identified an optimal partition constituted of four clusters changing over time and being characterized by distinctive values of target indicators (Table 2). Municipalities belonging to cluster 2 were characterized by an ‘average’ behavior as far as building activity is concerned. This cluster includes central locations belonging to the prefecture of Athens in 1990–1996, more restricted downtown locations (including Athens, Piraeus and few additional urban municipalities with population density > 10,000 inhabitants) in 1997–2003, strictly peri-urban locations (mainly—but not exclusively—in Eastern Attica) in 2004–2010 and, again, central locations corresponding (almost exactly) with the Greater Athens’ area in 2011–2017. Cluster 1 was characterized by positive values of most indicators for the first two periods, declining rapidly in the subsequent periods, and include fringe locations in both western and eastern Attica with the highest building activity between 1990 and 2003. Cluster 1 included strictly urban locations during 2004–2010, although only two variables resulted as highly characteristic (dwellings per building and average number of floors). The same cluster included strictly rural and some peri-urban municipalities during 2011–2017. Conversely, municipalities belonging to cluster 3 were relatively neutral regarding building activity between 1990 and 2003, evidencing a rapid increase in the last two-time intervals. Up to 2003, cluster 3 included peri-urban and rural locations (more concentrated around the Athens’ fringe during 1997–2003). With economic expansion, cluster 3 identified suburban municipalities in eastern Attica with accelerated building activity. With recession, the number of municipalities belonging to cluster 3 was reduced, including few peri-urban locations with above-average building activity (e.g., Aspropyrgos). Cluster 4 was considered a ‘residual’ group including rural locations with accelerated building activity during expansion and a consequent slowdown during crisis.

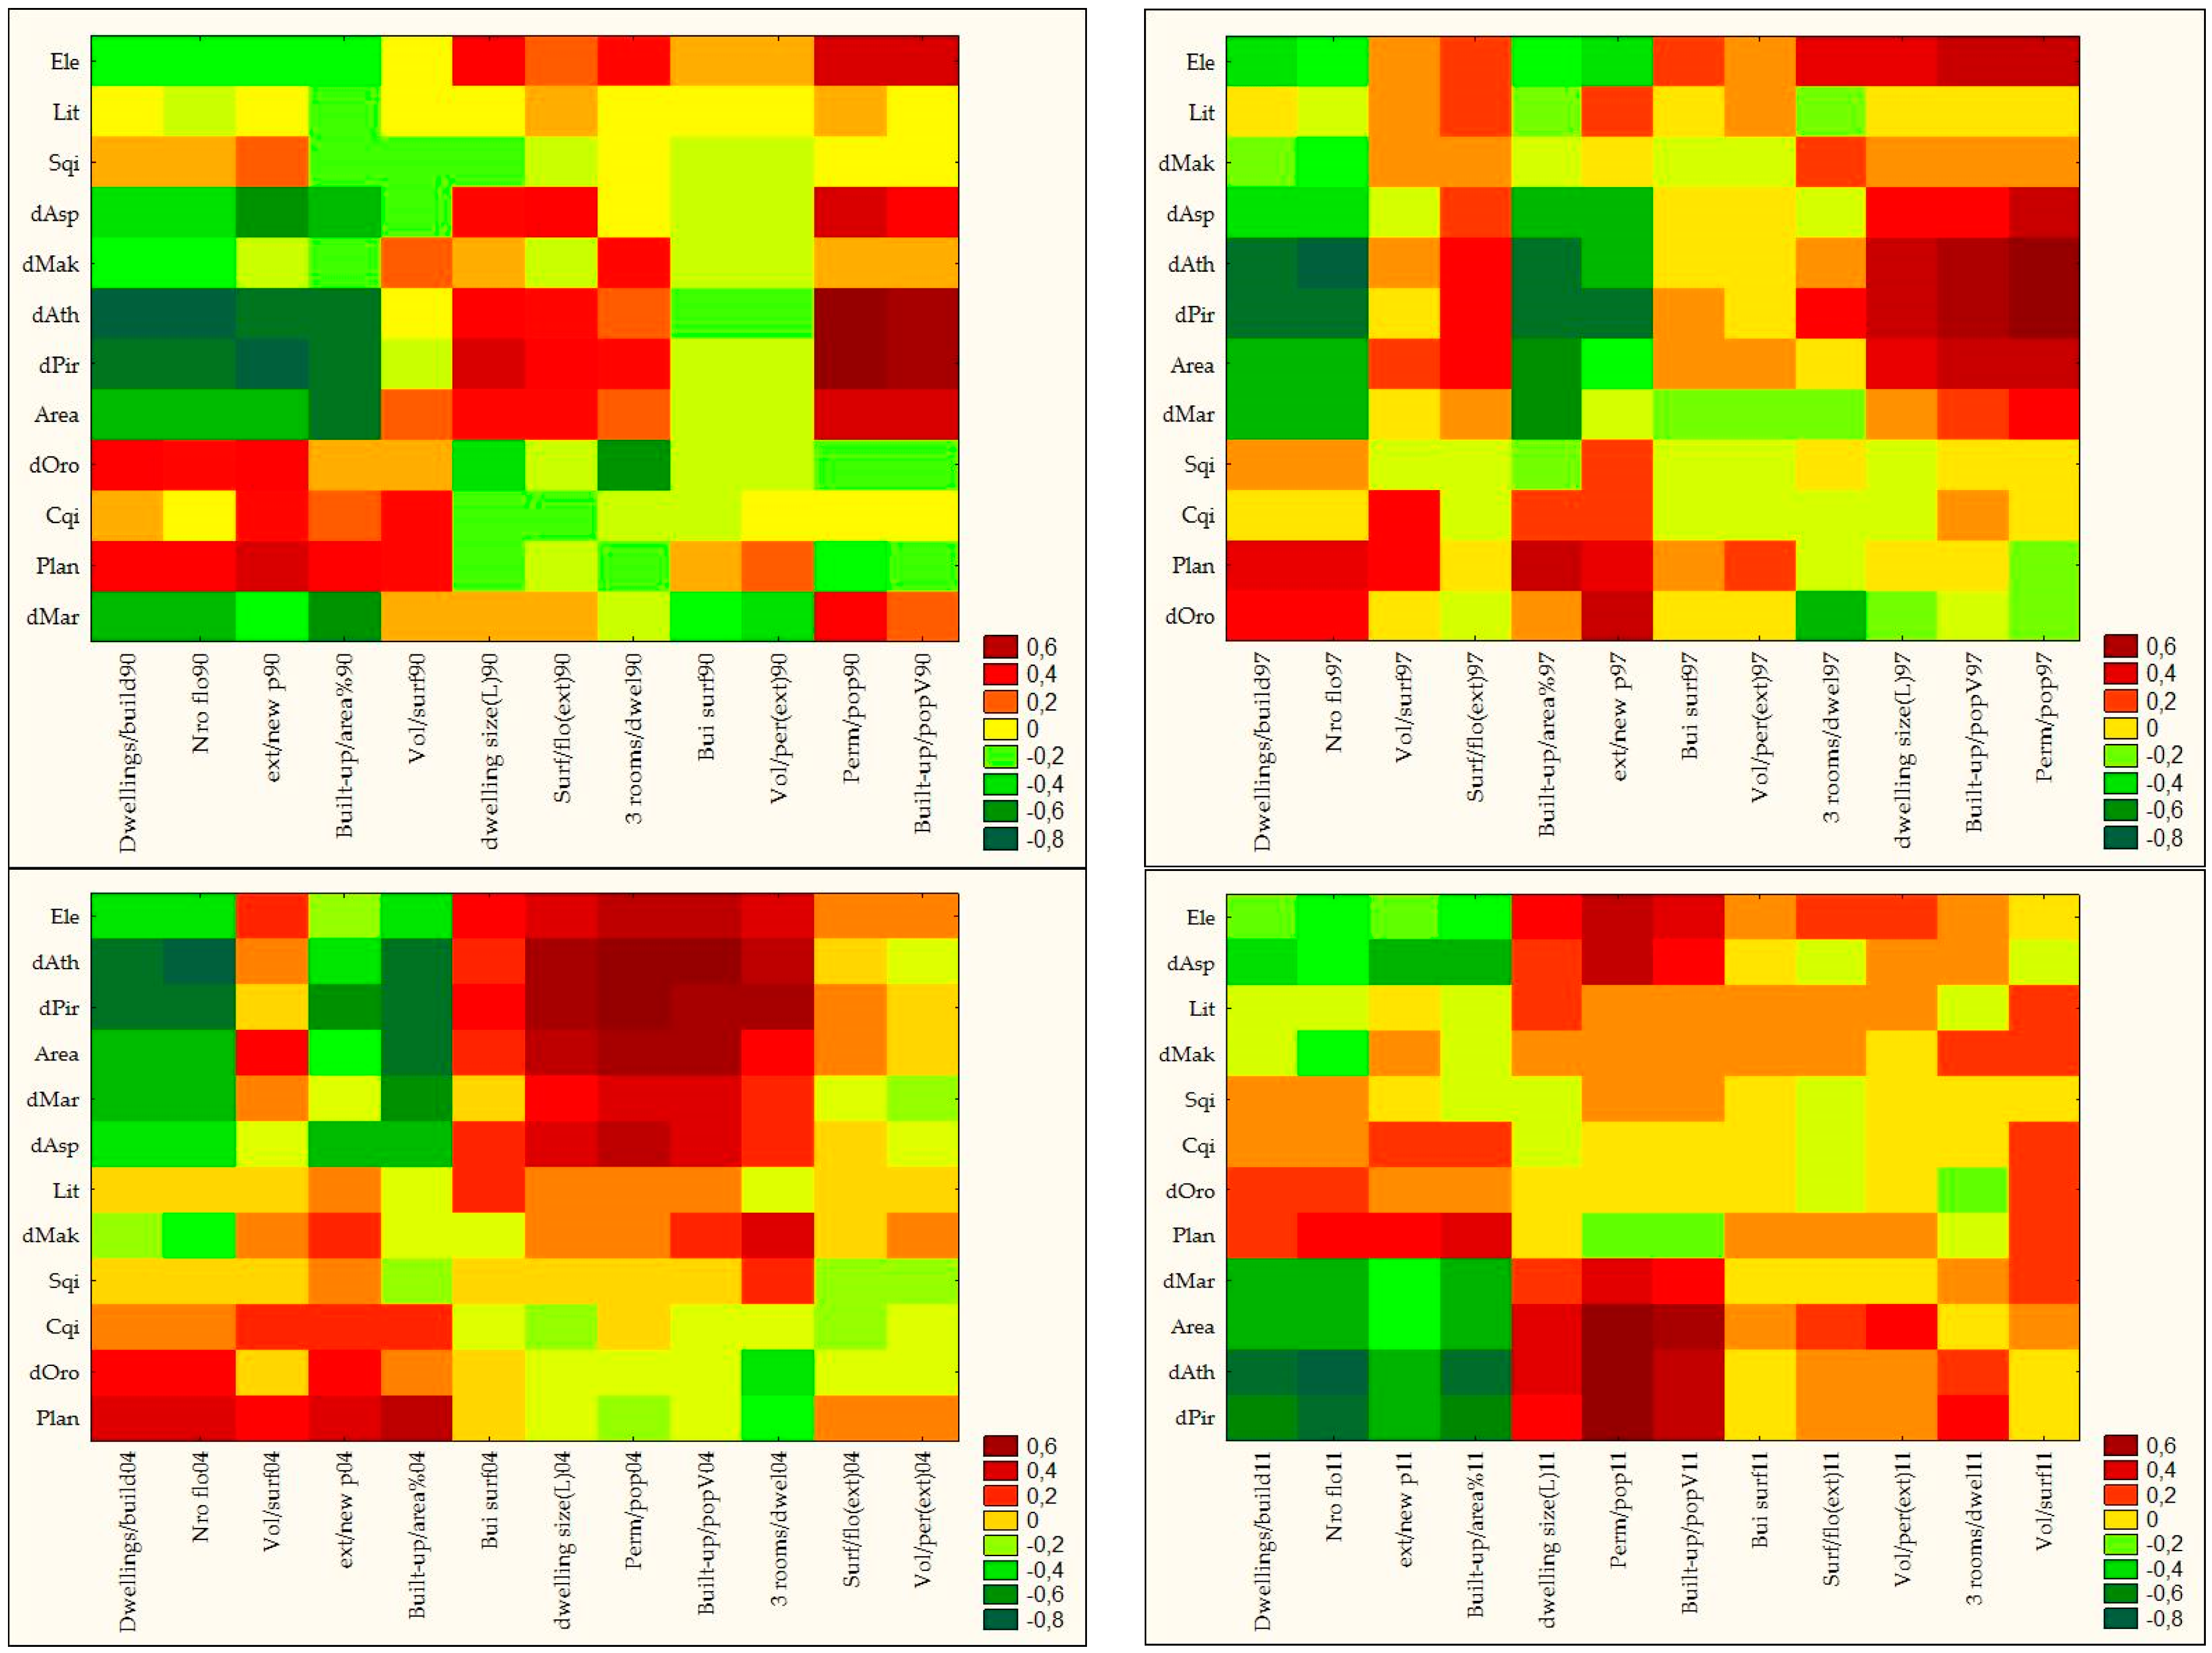
3.4. Non-Parametric Correlation Analysis of Background Local Contexts

Background indicators associated with building activity were illustrated in Figure 7. Considering the total number of pair-wise correlations analyzed in this study, indicators associated with settlement structure and building attributes were more frequently correlated with the underlying socioeconomic context than indicators associated with a dwelling’s characteristics. Average number of floors per building, dwellings per building and the percent share of built-up area in total municipal area were the indicators showing the largest number of significant pair-wise correlations, around 80% of total comparisons. The same pattern can be observed for background indicators: distance from Athens, Piraeus, and Aspropyrgos, as well as municipal area and elevation, were significantly correlated with building activity indicators in more than 50% of cases. Climate quality index, soil quality index and proximity to the sea coast line were not associated with building activity. Finally, significant correlations were more frequently observed during 1990–1996 (49%), declining slightly in the following two periods (economic expansion), and decreasing more evidently during recession (33%).
Background indicators showed a correlation profile with building activity changing quite rapidly over time (Figure 8). The most evident relationships were observed between specific macro-scale characteristics of settlements (e.g., horizontal or vertical growth) and variables quantifying population density and urban concentration. In other words, these results evidence the role of the mono-centric model (typical of Athens’ expansion) in shaping macro-level patterns of building activity in recent times. By contrast, micro-scale attributes of building activity, mainly associated with dwelling characteristics and the interplay between extensions and new buildings at the local level were less correlated with territorial variables and more heterogeneously distributed over space (Table 3). It seems reasonable to assume that such indicators were more likely influenced by socioeconomic patterns and processes not directly associated with urban agglomeration factors, including local disparities in wealth and income, social segregation and filtering, gentrification, migration and population ageing [6,22,35,50,51].

4. Discussion

A combination of statistical information with theoretically informed analysis allows identification and understanding of complex development paths typical of contemporary metropolitan regions. As a result of differential spatial patterns of building activity, the present study defines and discusses the recent building cycles observed in a Mediterranean city, proposing new indicators and operational approaches for a better comprehension of non-linear mechanisms of urban growth.
Building activity indicators are a powerful informative base allowing identification of long-term urbanization patterns [32]. In this perspective, analysis of spatio-temporal variations in building activity driven by economic cycles supports a comprehensive interpretation of non-linear growth waves in contemporary cities [52]. By analyzing together spatial changes in building volume/surface and dwelling characteristics, the empirical results of this study provide an enriched assessment of the intensity and direction of recent urban growth, inferring transformations in vertical/horizontal profile of cities and changes in the socioeconomic characteristics of a resident population [38]. The dimensions evaluated in this study using variables derived from individual building permits released by local municipalities (Section 2.3) allows identification of distinct cycles reflecting (i) changes in housing preferences; (ii) the distinctive role of private and public agents and, finally; (iii) economic recession.
By analyzing spatially-disaggregated data, building activity was considered as a result of distinct urban cycles in Attica. These cycles were characterized by sequential waves of mixed semi-dense and dispersed urbanization coinciding with (i) a slow decline in country’s interest rates and planning deregulation during the 1990s; (ii) discontinuous urban growth that culminated in the ‘building boom’ following the announcement of the 2004 Olympic Games and, finally; (iii) economic recession with highly variable construction patterns and declining housing markets [53]. These phases impacted building activity in different ways, shaping housing characteristics and the spatial distribution of settlements [15,33,35]. In this line of thinking, an exploratory analysis of building activity indicators provides a comprehensive picture of long-term and short-term changes in construction patterns and the resulting outcomes in terms of urban morphology and functional characteristics of metropolitan regions [54]. Based on bibliographic evidence and the results of this study, building activity was influenced in a different way by local paths of economic development, demographic size of municipalities, immigration, and a weak planning system [18,21,22]. The decline of traditional industry and restrictions on the construction of new buildings increased the demographic shrinkage of Athens and other major centers in the area [24].
Diverging responses to economic cycles were observed in urban and rural municipalities, giving rise to heterogeneous spatial patterns of building activity [23]. The most recent processes of urban expansion may finally indicate a trend toward urban containment and economic spatial re-balancing in rapidly-changing peri-urban districts [28]. At the same time, several indicators pointed out a differentiation in building activity between urban municipalities (mitigating recession impact) and rural municipalities (responding faster to expansion waves). Fringe municipalities showed intermediate and highly variable levels of building activity over time, outlining a huge diversification in construction patterns at the local scale, more evident during recession [34].
The results of this study indicate that building activity responded to economic cycles more evidently during transitional urban phases (e.g., at both the beginning and the end of the 2000s building boom) as well as in local contexts characterized by a high proportion of residential settlements, low population density and a large availability of buildable land including cropland. Such results are in partial agreement with earlier works [32,52,55]. In these regards, our analysis provides, for the first time, a multivariate, diachronic assessment of local-scale construction patterns and real estate market characteristics, defining multiple responses of building activity to urban cycles. These results may finally suggest how building activity was more sensitive to recessional impacts in urban centers, showing a moderate dynamism in peri-urban and rural contexts, as already observed in other European contexts [9,33,39,56].
Growing income disparities, diversification of housing supply, and selective population mobility, have resulted in a (more or less latent) evolution of local construction markets, together with increasing socio-spatial diversification [57]. In this line of thinking, metropolitan expansion—although being influenced by town plan’s prescriptions—seems to be even more related to housing preferences during the 2007 recession than in the phase of economic expansion boosted by the 2004 Olympic Games. In line with earlier evidence [23], the modest impact of social housing on local real estate markets in Mediterranean Europe may consolidate the role of housing preferences, promoting social diversification at the spatial scale of urban districts [6,21,58].
The empirical results of this study finally contrast with the widely accepted cyclical urbanization model [59,60,61], considered a pertinent approach to assess future stages of European urban development [38]. This study argues that individual urban entities (municipalities) do not show a single evolutionary stage of urban development, experiencing instead a coexistence of suburbanization and re-urbanization waves, driven by a complex mix of socioeconomic forces [57]. While development strategies and land-use policies may have prominent impacts on land expansion, socioeconomic factors remain relevant forces shaping spatio-temporal variations in building activity [7,58,62,63,64,65,66,67,68]. Furthermore, the work revealed a lack of clearness on building permits, since it is not possible to know the applicants or recipients of building permits available to link them to the debate on urban models or development. Due to this constraint, this work therefore offers an additional cue for future research. In addition, the development of a building typology to be used as a reference point or baseline against which changes can be evaluated against benchmarks is not well specified. Even a reflection on this topic represents a potential opportunity for improvement and further research.
The present work adopted local-scale indicators derived from building permit data providing insight in the multi-temporal analysis of urban growth, with implications for regional planning and design of sustainable development practices. Focusing on land-use legacies and transient dynamics in the response of urban systems to economic expansion and recession, future studies can be devoted to ascertaining the relationship between different spatial patterns of building activity during economic expansion and recession and the sustainable development path in originally compact cities such as Athens. In this regard, our study provides preliminary evidence of a more concentrated, land-saving urban development during recession—likely more oriented toward brownfield development. Further investigation is, therefore, required to assess direction and intensity of urban transformation and their implications for a truly sustainable development path at the metropolitan scale.

5. Conclusions

Under the assumption that contemporary cities are expanding in a spatially complex, non-linear manner, a spatially-explicit diachronic analysis of building activity is key to understanding the effects of urbanization on the distribution of socioeconomic functions in urban landscapes. Building activity indicators are a powerful informative base allowing identification of long-term urbanization patterns [32]. The examination of spatio-temporal variations in building activity driven by economic cycles provides a wide-ranging understanding of non-linear growth waves in contemporary cities since building activity results in defining distinct urban cycles in Attica region. These cycles were characterized by sequential waves of mixed semi-dense and dispersed urbanization coinciding with (i) a slow decline in nation’s interest rates and planning deregulation during the 1990s; (ii) discontinuous urban growth concluded in the ‘building boom’ succeeding the 2004 Olympic Games; and (iii) economic downturn with extremely variable building patterns and declining housing markets. Building activity expressly resulted in responding to economic cycles more clearly during transitional urban phases, besides local contexts characterized by a high proportion of housing settlements, low population density and a large convenience of buildable land. These findings may advise how building activity was more sensitive to negative economic impacts in urban centers, while a reasonable dynamism was detected in peri-urban and rural contexts. In this sense, a multi-dimensional investigation based on exploratory techniques may highlight—likely better than traditional econometric approaches—the importance of land-use legacies and transient dynamics in the response of urban systems to economic expansion and recession. In this way, the present study outlined the essential elements of an emerging framework for urban studies that incorporates the characteristics of recent urbanization under sequential economic cycles and thus empowers economic actors, policy-makers and stakeholders to understand and intervene in the planning and management of metropolitan regions.

Author Contributions

Conceptualization, L.S. and M.C.; methodology, M.C.; software, L.S.; validation, I.Z. and M.C.; formal analysis, L.S.; investigation, L.S.; Data curation, M.C. and I.Z.; writing—original draft preparation, L.S. and I.Z.; writing—review and editing, I.Z.

Funding

This work was supported by a grant of the Ministry of Education of the Czech Republic, NPU I(LO1415).

Conflicts of Interest

The authors declare no conflict of interest.

References

  1. Coiacetto, E. Real estate development industry structure: Consequences for urban planning and development. Plan. Pract. Res. 2006, 21, 423–441. [Google Scholar] [CrossRef]
  2. Barras, R. Building Cycles: Growth and Instability; Wiley: London, UK, 2009. [Google Scholar]
  3. Balta, M.O.; Eke, F. Spatial Reflection of Urban Planning in Metropolitan Areas and Urban Rent: A Case Study of Cayyolu, Ankara. Eur. Plan. Stud. 2011, 19, 1817–1838. [Google Scholar] [CrossRef]
  4. Barr, J.; Cohen, J.P. The floor area ratio gradient: New York City, 1890–2009. Reg. Sci. Urban Econ. 2014, 48, 110–119. [Google Scholar] [CrossRef]
  5. Wu, F. Simulating temporal fluctuations of real estate development in a cellular automata city. Trans. Gis 2003, 7, 193–210. [Google Scholar] [CrossRef]
  6. Arbaci, S. Ethnic segregation, housing systems and welfare regimes. Eur. J. Hous. Policy 2007, 7, 401–433. [Google Scholar] [CrossRef]
  7. Aalbers, M.B. Geographies of housing finance: The mortgage market in Milan, Italy. Growth Chang. 2007, 38, 174–199. [Google Scholar] [CrossRef]
  8. Weber, R. Selling city futures: The financialization of urban redevelopment policy. Econ. Geogr. 2010, 86, 251–274. [Google Scholar] [CrossRef]
  9. Whitehead, C.; Williams, P. Causes and Consequences? Exploring the Shape and Direction of the Housing System in the UK Post the Financial Crisis. Hous. Stud. 2011, 26, 1157–1169. [Google Scholar] [CrossRef]
  10. Diappi, L. Emergent Phenomena in Housing Markets. Gentrification, Housing Search, Polarization; Springer: Berlin, Germany, 2013. [Google Scholar]
  11. Beauregard, R.A. The textures of property markets: Downtown housing and office conversions in New York City. Urban Stud. 2005, 42, 2431–2445. [Google Scholar] [CrossRef]
  12. Malheiros, J. Ethni-cities: Residential Patterns in the Northern European and Mediterranean Metropolises—Implications for Policy Design. Int. J. Popul. Geogr. 2002, 8, 107–134. [Google Scholar] [CrossRef]
  13. Schneider, A.; Woodcock, C.E. Compact, dispersed, fragmented, extensive? A comparison of urban growth in twenty-five global cities using remotely sensed data, pattern metrics and census information. Urban Stud. 2008, 45, 659–692. [Google Scholar] [CrossRef]
  14. European Environment Agency. Mapping Guide for a European Urban Atlas; EEA: Copenhagen, Denmark, 2011. [Google Scholar]
  15. Pili, S.; Grigoriadis, E.; Carlucci, M.; Clemente, M.; Salvati, L. Towards Sustainable Growth? A Multi-criteria Assessment of (Changing) Urban Forms. Ecol. Indic. 2017, 76, 71–80. [Google Scholar] [CrossRef]
  16. Andreotti, A.; Garcia, S.M.; Gomez, A.; Hespanha, P.; Kazepov, Y.; Mingione, E. Does a Southern European model exist? J. Eur. Area Stud. 2001, 9, 43–62. [Google Scholar] [CrossRef]
  17. Arbaci, S. (Re)Viewing Ethnic Residential Segregation in Southern European Cities: Housing and Urban Regimes as Mechanisms of Marginalisation. Hous. Stud. 2008, 23, 589–613. [Google Scholar] [CrossRef]
  18. Couch, C.; Petschel-held, G.; Leontidou, L. Urban Sprawl in Europe: Landscapes, Land-Use Change and Policy; Blackwell: London, UK, 2007. [Google Scholar]
  19. Giannakourou, G. Transforming spatial planning policy in Mediterranean countries: Europeanization and domestic change. Eur. Plan. Stud. 2005, 13, 319–331. [Google Scholar] [CrossRef]
  20. Castles, F.G.; Ferrera, M. Home ownership and welfare: Is southern Europe different? South Eur. Soc. Politics 1996, 1, 163–185. [Google Scholar] [CrossRef]
  21. Maloutas, T. Socio-Economic Classification Models and Contextual Difference: The ‘European Socio-economic Classes’ (ESeC) from a South European Angle. South Eur. Soc. Politics 2007, 12, 443–460. [Google Scholar] [CrossRef]
  22. Arapoglou, V.P.; Sayas, J. New facets of urban segregation in southern Europe. Eur. Urban Reg. Stud. 2009, 16, 345–362. [Google Scholar] [CrossRef]
  23. Allen, J.; Barlow, J.; Leal, J.; Maloutas, T.; Padovani, L. Housing and Welfare in Southern Europe; Wiley: London, UK, 2004. [Google Scholar]
  24. Burgel, G. Athènes, de la balkanisation à la mondialisation. Méditerranée 2004, 103, 59–63. [Google Scholar] [CrossRef]
  25. Costa, F.J.; Noble, A.G.; Pendeleton, G. Evolving planning systems in Madrid, Rome, and Athens. Geojournal 1991, 24, 293–303. [Google Scholar] [CrossRef]
  26. Fekade, W. Deficits of formal urban land management and informal responses under rapid urban growth, an international perspective. Habitat Int. 2000, 24, 127–150. [Google Scholar] [CrossRef]
  27. Leontidou, L. The Mediterranean City in Transition; Cambridge University Press: Cambridge, UK, 1990. [Google Scholar]
  28. Ferrara, A.; Salvati, L.; Sabbi, A.; Colantoni, A. Soil resources, land cover changes and rural areas: Towards a spatial mismatch? Sci. Total Environ. 2014, 478, 116–122. [Google Scholar] [CrossRef] [PubMed]
  29. Mayer, C.J.; Somerville, C.T. Land use regulation and new construction. Reg. Sci. Urban Econ. 2000, 30, 639–662. [Google Scholar] [CrossRef]
  30. Garcia, D.; Riera, P. Expansion versus density in Barcelona: A valuation exercise. Urban Stud. 2003, 40, 1925–1936. [Google Scholar] [CrossRef]
  31. Salvati, L. From Sprawl to Compactness and Back: Long-term Population Dynamics (1848–2011) and the Economic Structure of a Mediterranean city. Geojournal 2016, 81, 319–332. [Google Scholar] [CrossRef]
  32. Taltavull de La Paz, P.; Gabrielli, L. Housing Supply and Price Reactions: A Comparison Approach to Spanish and Italian Markets. Hous. Stud. 2014. [Google Scholar] [CrossRef]
  33. Chorianopoulos, I.; Pagonis, T.; Koukoulas, S.; Drymoniti, S. Planning, competitiveness and sprawl in the Mediterranean city: The case of Athens. Cities 2010, 27, 249–259. [Google Scholar] [CrossRef]
  34. Polyzos, S.; Minetos, D. Informal housing in Greece: A multinomial logistic regression analysis at the regional level. Eur. Spat. Res. Policy 2013, 20, 57–85. [Google Scholar] [CrossRef] [Green Version]
  35. Rontos, K.; Grigoriadis, S.; Sateriano, A.; Syrmali, M.; Vavouras, I.; Salvati, L. Lost in Protest, Found in Segregation: Divided Cities in the Light of the 2015 ‘Oki’ Referendum in Greece. City Cult. Soc. 2016, 7, 139–148. [Google Scholar] [CrossRef]
  36. Li, M.; Ye, X.; Zhang, S.; Tang, X.; Shen, Z. A framework of comparative urban trajectory analysis. Environ. Plan. B Urban Anal. City Sci. 2018, 45, 489–507. [Google Scholar] [CrossRef]
  37. Kloosterman, R.C.; Lambregts, B. Between accumulation and concentration of capital: Toward a framework for comparing long-term trajectories of urban systems. Urban Geogr. 2007, 28, 54–73. [Google Scholar] [CrossRef]
  38. Salvati, L.; Zitti, M.; Sateriano, A. Changes in the City Vertical Profile as an Indicator of Sprawl: Evidence from a Mediterranean Region. Habitat Int. 2013, 38, 119–125. [Google Scholar] [CrossRef]
  39. Salvati, L.; Sateriano, A.; Grigoriadis, S. Crisis and the City: Profiling Urban Growth under Economic Expansion and Stagnation. Lett. Spat. Resour. Sci. 2016, 9, 329–342. [Google Scholar] [CrossRef]
  40. Napoli, G.; Giuffrida, S.; Trovato, M.R.; Valenti, A. Cap rate as the interpretative variable of the urban real estate capital asset: A comparison of different sub-market definitions in Palermo, Italy. Buildings 2017, 7, 80. [Google Scholar] [CrossRef]
  41. Ciuna, M.; Salvo, M.; Simonotti, M. Multilevel methodology approach for the construction of real estate monthly index numbers. J. Real Estate Lit. 2014, 22, 281–302. [Google Scholar]
  42. Barreca, A.; Curto, R.; Rolando, D. Assessing Social and Territorial Vulnerability on Real Estate Submarkets. Buildings 2017, 7, 94. [Google Scholar] [CrossRef]
  43. Del Giudice, V.; De Paola, P. Real Estate Economics, Management and Investments: New Perspectives and Frontiers. Buildings 2018, 8, 40. [Google Scholar] [CrossRef]
  44. Del Giudice, V. Estimo e Valutazione Economica dei Progetti; Loffredo Iniziative Editorial: Milan, Italy, 2010. [Google Scholar]
  45. Gabrielli, L.; Giuffrida, S.; Trovato, M.R. From Surface to Core: A Multi-layer Approach for the Real Estate Market Analysis of a Central Area in Catania. In Computational Science and Its Applications—ICCSA 2015; Gervasi, O., Murgante, B., Misra, S., Gavrilova, M.L., Rocha, A.M.A.C., Torre, C.M., Taniar, D., Apduhan, B.O., Eds.; Springer: Berlin, Germany, 2015; Volume 3, pp. 284–300. [Google Scholar]
  46. Gabrielli, L. Cluster Analysis and Italian Real Estate Market Analysis during the Downturn. In Proceedings of the 20th Annual European Real Estate Society Conference, Vienna, Austria, 3–6 July 2013. [Google Scholar]
  47. Valenti, A.; Giuffrida, S.; Linguanti, F. Decision Trees Analysis in a Low-Tension Real Estate Market: The Case of Troina (Italy). In Computational Science and Its Applications—ICCSA 2015; Gervasi, O., Murgante, B., Misra, S., Gavrilova, M.L., Rocha, A.M.A.C., Torre, C.M., Taniar, D., Apduhan, B.O., Eds.; Springer: Berlin, Germany, 2015; Volume 3, pp. 237–252. [Google Scholar]
  48. Chan, L.; Ng, H.T.; Ramchand, R. A Cluster Analysis Approach to Examining Singapore’s Property Market. In Property Markets and Financial Stability; BIS Papers; Bank for International Settlements: Basel, Switzerland, 2012; Volume 64, pp. 43–53. [Google Scholar]
  49. Hepşen, A.; Vatansever, M. Using Hierarchical Clustering Algorithms for Turkish Residential Market. Int. J. Econ. Financ. 2012, 4, 138–150. [Google Scholar]
  50. Arbaci, S.; Malheiros, J. De-Segregation, Peripheralisation and the Social Exclusion of Immigrants: Southern European Cities in the 1990s. J. Ethn. Migr. Stud. 2010, 36, 227–255. [Google Scholar] [CrossRef]
  51. Le Goix, R. Gated Communities: Sprawl and Social Segregation in Southern California. Hous. Stud. 2005, 20, 323–343. [Google Scholar] [CrossRef] [Green Version]
  52. Jiménez, F. Building Boom and Political Corruption in Spain. South Eur. Soc. Politics 2009, 14, 255–272. [Google Scholar] [CrossRef]
  53. Salvati, L.; Serra, P. Estimating rapidity of change in complex urban systems: A multidimensional, local-scale approach. Geogr. Anal. 2016, 48, 132–156. [Google Scholar] [CrossRef]
  54. Guy, S.; Henneberry, J. Bridging the divide? Complementary perspectives on property. Urban Stud. 2002, 39, 1471–1478. [Google Scholar] [CrossRef]
  55. Zambon, I.; Colantoni, A.; Carlucci, M.; Morrow, N.; Sateriano, A.; Salvati, L. Land quality, sustainable development and environmental degradation in agricultural districts: A computational approach based on entropy indexes. Environ. Impact Assess. Rev. 2017, 64, 37–46. [Google Scholar] [CrossRef]
  56. Temelová, J.; Novák, J.; Ouředníček, M.; Puldová, P. Housing estates in the Czech Republic after socialism: Various trajectories and inner differentiation. Urban Stud. 2011, 48, 1811–1834. [Google Scholar] [CrossRef]
  57. Kabisch, N.; Haase, D. Diversifying European agglomerations: Evidence of urban population trends for the 21st century. Popul. Space Place 2011, 17, 236–253. [Google Scholar] [CrossRef]
  58. Kuang, W.; Liu, J.; Dong, J.; Chi, W.; Zhang, C. The rapid and massive urban and industrial land expansions in China between 1990 and 2010: A CLUD-based analysis of their trajectories, patterns, and drivers. Landsc. Urban Plan. 2016, 145, 21–33. [Google Scholar] [CrossRef] [Green Version]
  59. Morelli, V.G.; Rontos, K.; Salvati, L. Between suburbanisation and re-urbanisation: Revisiting the urban life cycle in a Mediterranean compact city. Urban Res. Pract. 2014, 7, 74–88. [Google Scholar] [CrossRef]
  60. Di Feliciantonio, C.; Salvati, L. ‘Southern’Alternatives of Urban Diffusion: Investigating Settlement Characteristics and Socio-Economic Patterns in Three M editerranean Regions. Tijdschrift Voor Economische En Sociale Geografie 2015, 106, 453–470. [Google Scholar] [CrossRef]
  61. Zambon, I.; Serra, P.; Sauri, D.; Carlucci, M.; Salvati, L. Beyond the ‘Mediterranean city’: Socioeconomic disparities and urban sprawl in three Southern European cities. Geogr. Ann. Ser. B Hum. Geogr. 2017, 99, 319–337. [Google Scholar] [CrossRef]
  62. Ramalho, C.E.; Hobbs, R.J. Time for a change: Dynamic urban ecology. Trends Ecol. Evol. 2011, 27, 179–188. [Google Scholar] [CrossRef] [PubMed]
  63. Monarca, D.; Colantoni, A.; Cecchini, M.; Longo, L.; Vecchione, L.; Carlini, M.; Manzo, A. Energy characterization and gasification of biomass derived by hazelnut cultivation: Analysis of produced syngas by gas chromatography. Math. Probl. Eng. 2012, 2012, 102914. [Google Scholar] [CrossRef]
  64. Di Giacinto, S.; Colantoni, A.; Cecchini, M.; Monarca, D.; Moscetti, R.; Massantini, R. Dairy production in restricted environment and safety for the workers. Ind. Aliment. 2012, 530, 5–12. [Google Scholar]
  65. Colantoni, A.; Cecchini, M.; Monarca, D.; Bedini, R.; Riccioni, S. The risk of musculoskeletal disorders due to repetitive movements of upper limbs for workers employed in hazelnut sorting. J. Agric. Eng. 2013, 44. [Google Scholar] [CrossRef]
  66. Monarca, D.; Cecchini, M.; Guerrieri, M.; Colantoni, A. Conventional and alternative use of biomasses derived by hazelnut cultivation and processing. Acta Hortic. 2008, 845, 627–634. [Google Scholar] [CrossRef]
  67. Delfanti, L.; Colantoni, A.; Recanatesi, F.; Bencardino, M.; Sateriano, A.; Zambon, I.; Salvati, L. Solar plants, environmental degradation and local socioeconomic contexts: A case study in a Mediterranean country. Environ. Impact Assess. Rev. 2016, 61, 88–93. [Google Scholar] [CrossRef]
  68. Marucci, A.; Zambon, I.; Colantoni, A.; Monarca, D. A combination of agricultural and energy purposes: Evaluation of a prototype of photovoltaic greenhouse tunnel. Renew. Sustain. Energy Rev. 2018, 82, 1178–1186. [Google Scholar] [CrossRef]
Figure 1. Spatial distribution of indicators assessing settlement characteristics in Athens, by time interval.
Sustainability 11 00375 g001aSustainability 11 00375 g001b
Figure 2. Spatial distribution of indicators assessing building characteristics in Athens, by time interval.
Sustainability 11 00375 g002aSustainability 11 00375 g002b
Figure 3. Spatial distribution of indicators assessing dwelling characteristics in Athens, by time interval.
Sustainability 11 00375 g003aSustainability 11 00375 g003b
Figure 4. Hierarchical clustering (Euclidean distances, Ward’s agglomeration algorithm) of building activity indicators in Athens, by time interval (upper left: 1990–1996; upper right: 1997–2003; lower left: 2004–2010; lower right: 2011–2017).
Sustainability 11 00375 g004
Figure 5. Hierarchical clustering (Euclidean distances, Ward’s agglomeration algorithm) of municipalities in Athens based on indicators of building activity, by time interval.
Sustainability 11 00375 g005aSustainability 11 00375 g005b
Figure 6. K-means clustering of municipalities in Athens based on indicators of building activity, by time interval (downtown Athens is marked with a star).
Sustainability 11 00375 g006
Figure 7. Two-way joining cluster analysis run on indicators of building activity (columns) and contextual indicators (rows) in Athens, by time interval (upper left: 1990–1996; upper right: 1997–2003; lower left: 2004–2010; lower right: 2011–2017).
Sustainability 11 00375 g007
Figure 8. Percent share of significant correlations (based on Spearman non-parametric analysis, Table 2 and Figure 7) in total comparisons by building activity indicator (upper left), background indicator (lower left) and time interval (right).
Sustainability 11 00375 g008
Table 1. Description of the indicators derived.
DescriptionAcronymUnit
Average number of floors (new buildings)avg_flo_new
Average number of floors (building additions)avg_flo_ext
Average surface area of new buildingsavg_sur_newm2
Average surface area of building additionsavg_sur_extm2
Authorized dwellings >2 rooms in total dwellingsdwel3+%
Number of new dwellings per 1000 inhabitantsdwel_pop
New building permits in the total stock of released permitsnew_pe%
Ratio of additions-to-new buildings volumevol_ext_new
Surface of new building permits in total urban areasur_new_urb%
Surface of building additions in total urban areasur_ext_urb%
Density of permits released for new buildingspe_new_supBuild/km2
Density of permits released for building additionspe_ext_supBuild/km2
Table 2. Descriptive statistics (average and standard deviation) of building activity indicators in Athens by k-means cluster and time interval (indicators’ abbreviations listed in Section 2.3).
VariableCluster 1Cluster 2Cluster 3Cluster 4
MeanSDMeanSDMeanSDMeanSD
1990–1996
Dwellings/build−0.860.210.960.80−0.780.22−0.660.29
Bui surf1.581.470.030.88−0.410.49−0.330.66
Nro flo−0.790.270.940.83−0.690.22−0.670.33
Vol/surf1.551.93−0.180.35−0.460.23−0.100.94
dwelling size(L)2.082.01−0.460.370.170.54−0.040.39
3 rooms/dwel0.870.60−0.250.530.041.150.051.29
ext/new p−0.550.240.751.14−0.760.15−0.520.25
Surf/flo(ext)2.291.62−0.370.44−0.040.53−0.140.49
Vol/per(ext)2.202.06−0.130.40−0.220.36−0.340.24
Perm/pop0.570.91−0.590.152.521.930.060.38
Built-up/area%−0.350.750.810.82−0.550.55−0.670.61
Built-up/popV1.610.92−0.670.301.921.19−0.010.50
1997–2003
Dwellings/build−1.040.060.850.62−0.720.281.170.76
Bui surf3.261.400.260.89−0.170.59−0.560.31
Nro flo−0.950.080.770.73−0.700.261.200.79
Vol/surf3.131.46−0.260.63−0.060.83−0.240.27
dwelling size(L)3.941.45−0.240.380.040.43−0.690.14
3 rooms/dwel0.790.540.250.730.190.99−0.960.76
ext/new p−0.200.370.260.65−0.580.531.281.08
Surf/flo(ext)3.781.61−0.060.54−0.090.52−0.520.27
Vol/per(ext)3.931.140.070.59−0.230.50−0.330.34
Perm/pop0.050.46−0.530.290.481.14−0.700.08
Built-up/area%−0.610.311.091.15−0.500.600.230.67
Built-up/popV2.421.86−0.460.290.280.87−0.740.14
2004–2010
Dwellings/build1.010.74−0.660.42−0.440.61−1.040.04
Bui surf−0.280.30−0.050.481.902.75−0.320.15
Nro flo1.030.81−0.650.32−0.640.45−0.820.12
Vol/surf−0.260.41−0.140.762.251.75−0.200.24
dwelling size(L)−0.370.170.030.361.663.050.030.19
3 rooms/dwel−0.820.820.540.690.320.830.890.69
ext/new p0.710.95−0.540.630.390.77−1.210.35
Surf/flo(ext)−0.200.48−0.270.352.661.850.060.17
Vol/per(ext)−0.190.29−0.270.232.662.17−0.030.13
Perm/pop−0.510.060.120.55−0.090.464.211.99
Built-up/area%0.800.83−0.510.75−0.460.76−0.700.21
Built-up/popV−0.560.110.000.501.311.503.381.44
2011–2017
Dwellings/build−0.670.360.890.86−1.090.19−0.640.19
Bui surf−0.230.56−0.120.594.232.930.510.68
Nro flo−0.600.470.800.95−0.610.30−0.690.30
Vol/surf−0.230.42−0.150.393.634.180.881.13
dwelling size(L)−0.070.39−0.310.385.192.290.360.44
3 rooms/dwel0.241.08−0.360.900.600.450.360.52
ext/new p−0.610.430.701.06−0.430.66−0.190.61
Surf/flo(ext)−0.240.43−0.190.344.762.570.760.91
Vol/per(ext)−0.220.39−0.190.303.684.340.991.01
Perm/pop0.030.37−0.340.12−0.100.301.572.89
Built-up/area%−0.610.400.621.090.820.94−0.180.79
Built-up/popV−0.170.28−0.300.210.830.672.112.46
Table 3. Spearman non-parametric coefficients identifying significant relationships (p < 0.05 after Bonferroni’s correction) between building activity indicators and contextual indicators (municipal scale) in Athens, by time period.
VariableYearsEledAthdPirdMardMakdAspdOroAreaPlan
Dwellings/build1990–1996−0.36−0.81−0.78−0.53−0.34−0.430.31−0.580.35
1997–2003−0.40−0.78−0.77−0.51 −0.41 −0.580.33
2004–2010−0.43−0.79−0.80−0.51 −0.47 −0.560.36
2011–2017 −0.73−0.66−0.52 −0.41 −0.53
Bui surf1990–1996 −0.39
1997–2003
2004–2010
2011–2017
Nro flo1990–1996−0.35−0.85−0.78−0.59−0.37−0.41 −0.580.33
1997–2003−0.38−0.83−0.80−0.57−0.36−0.41 −0.600.34
2004–2010−0.45−0.83−0.80−0.55−0.34−0.43 −0.600.34
2011–2017−0.31−0.81−0.71−0.60−0.36−0.37 −0.56
Vol/surf1990–1996
1997–2003
2004–2010
2011–2017
dwelling size(L)1990–19960.310.390.50 −0.44
1997–20030.370.410.50 0.35
2004–20100.340.560.59 0.37 0.43
2011–2017 0.33 0.33
3 rooms/dwel1990–1996 −0.61
1997–20030.32 −0.51
2004–20100.390.490.55 0.30 −0.43 −0.35
2011–2017
ext/new p1990–1996−0.38−0.78−0.85−0.39 −0.620.31−0.500.41
1997–2003−0.43−0.57−0.73 −0.500.40−0.370.32
2004–2010 −0.47−0.62 −0.51 −0.33
2011–2017 −0.55−0.57−0.37 −0.51 −0.38
Surf/flo(ext)1990–1996 0.39 0.34
1997–2003
2004–2010
2011–2017
Vol/per(ext)1990–1996 −0.41
1997–2003
2004–2010
2011–2017
Perm/pop1990–19960.420.730.740.33 0.49 0.46−0.37
1997–20030.440.640.67 0.42 0.47
2004–20100.470.640.640.30 0.42 0.53
2011–20170.410.630.650.38 0.46 0.61
Built-up/area%1990–1996−0.39−0.78−0.72−0.68 −0.57 −0.720.35
1997–2003−0.38−0.78−0.72−0.66 −0.59 −0.680.42
2004–2010−0.42−0.79−0.75−0.62 −0.57 −0.710.42
2011–2017−0.36−0.71−0.65−0.59 −0.51 −0.540.30
Built-up/popV1990–19960.450.610.64 0.37 0.42
1997–20030.410.510.52 0.46
2004–20100.440.630.590.35 0.34 0.55
2011–20170.360.460.46 0.54

