Shear Performance of Optimized-Section Precast Slab with Tapered Cross Section


Abstract
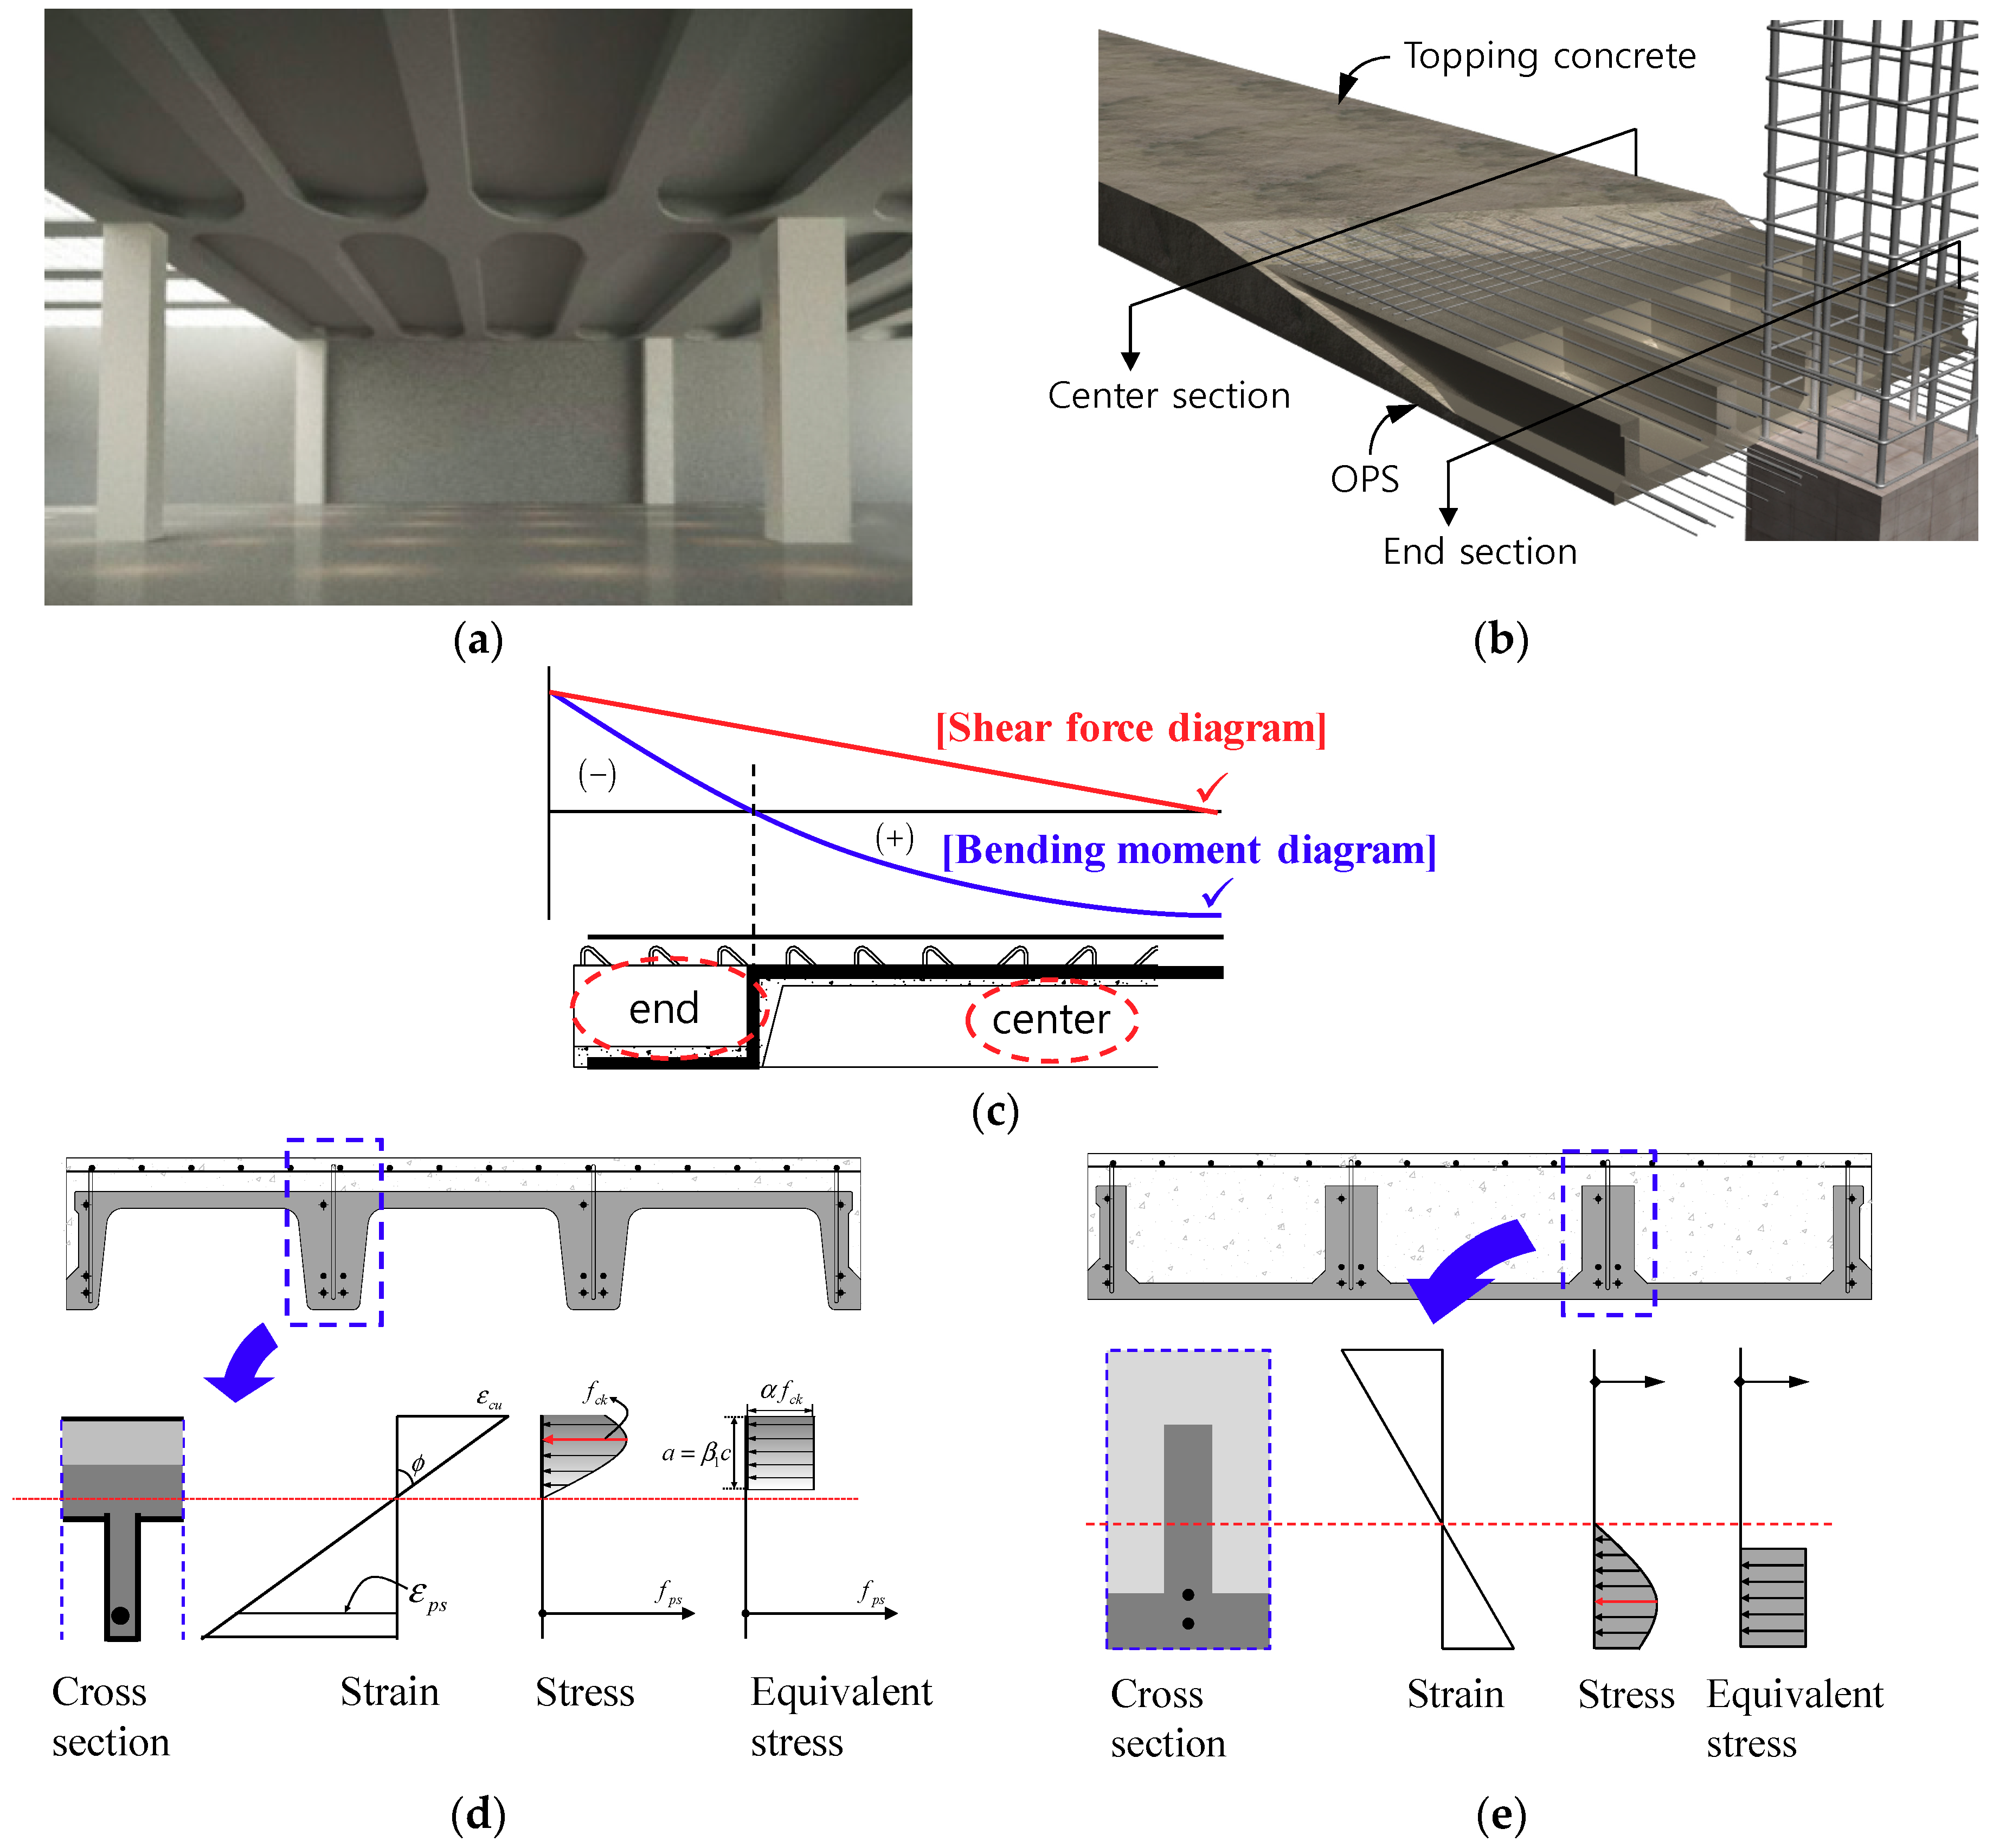
:1. Introduction
2. Test Program
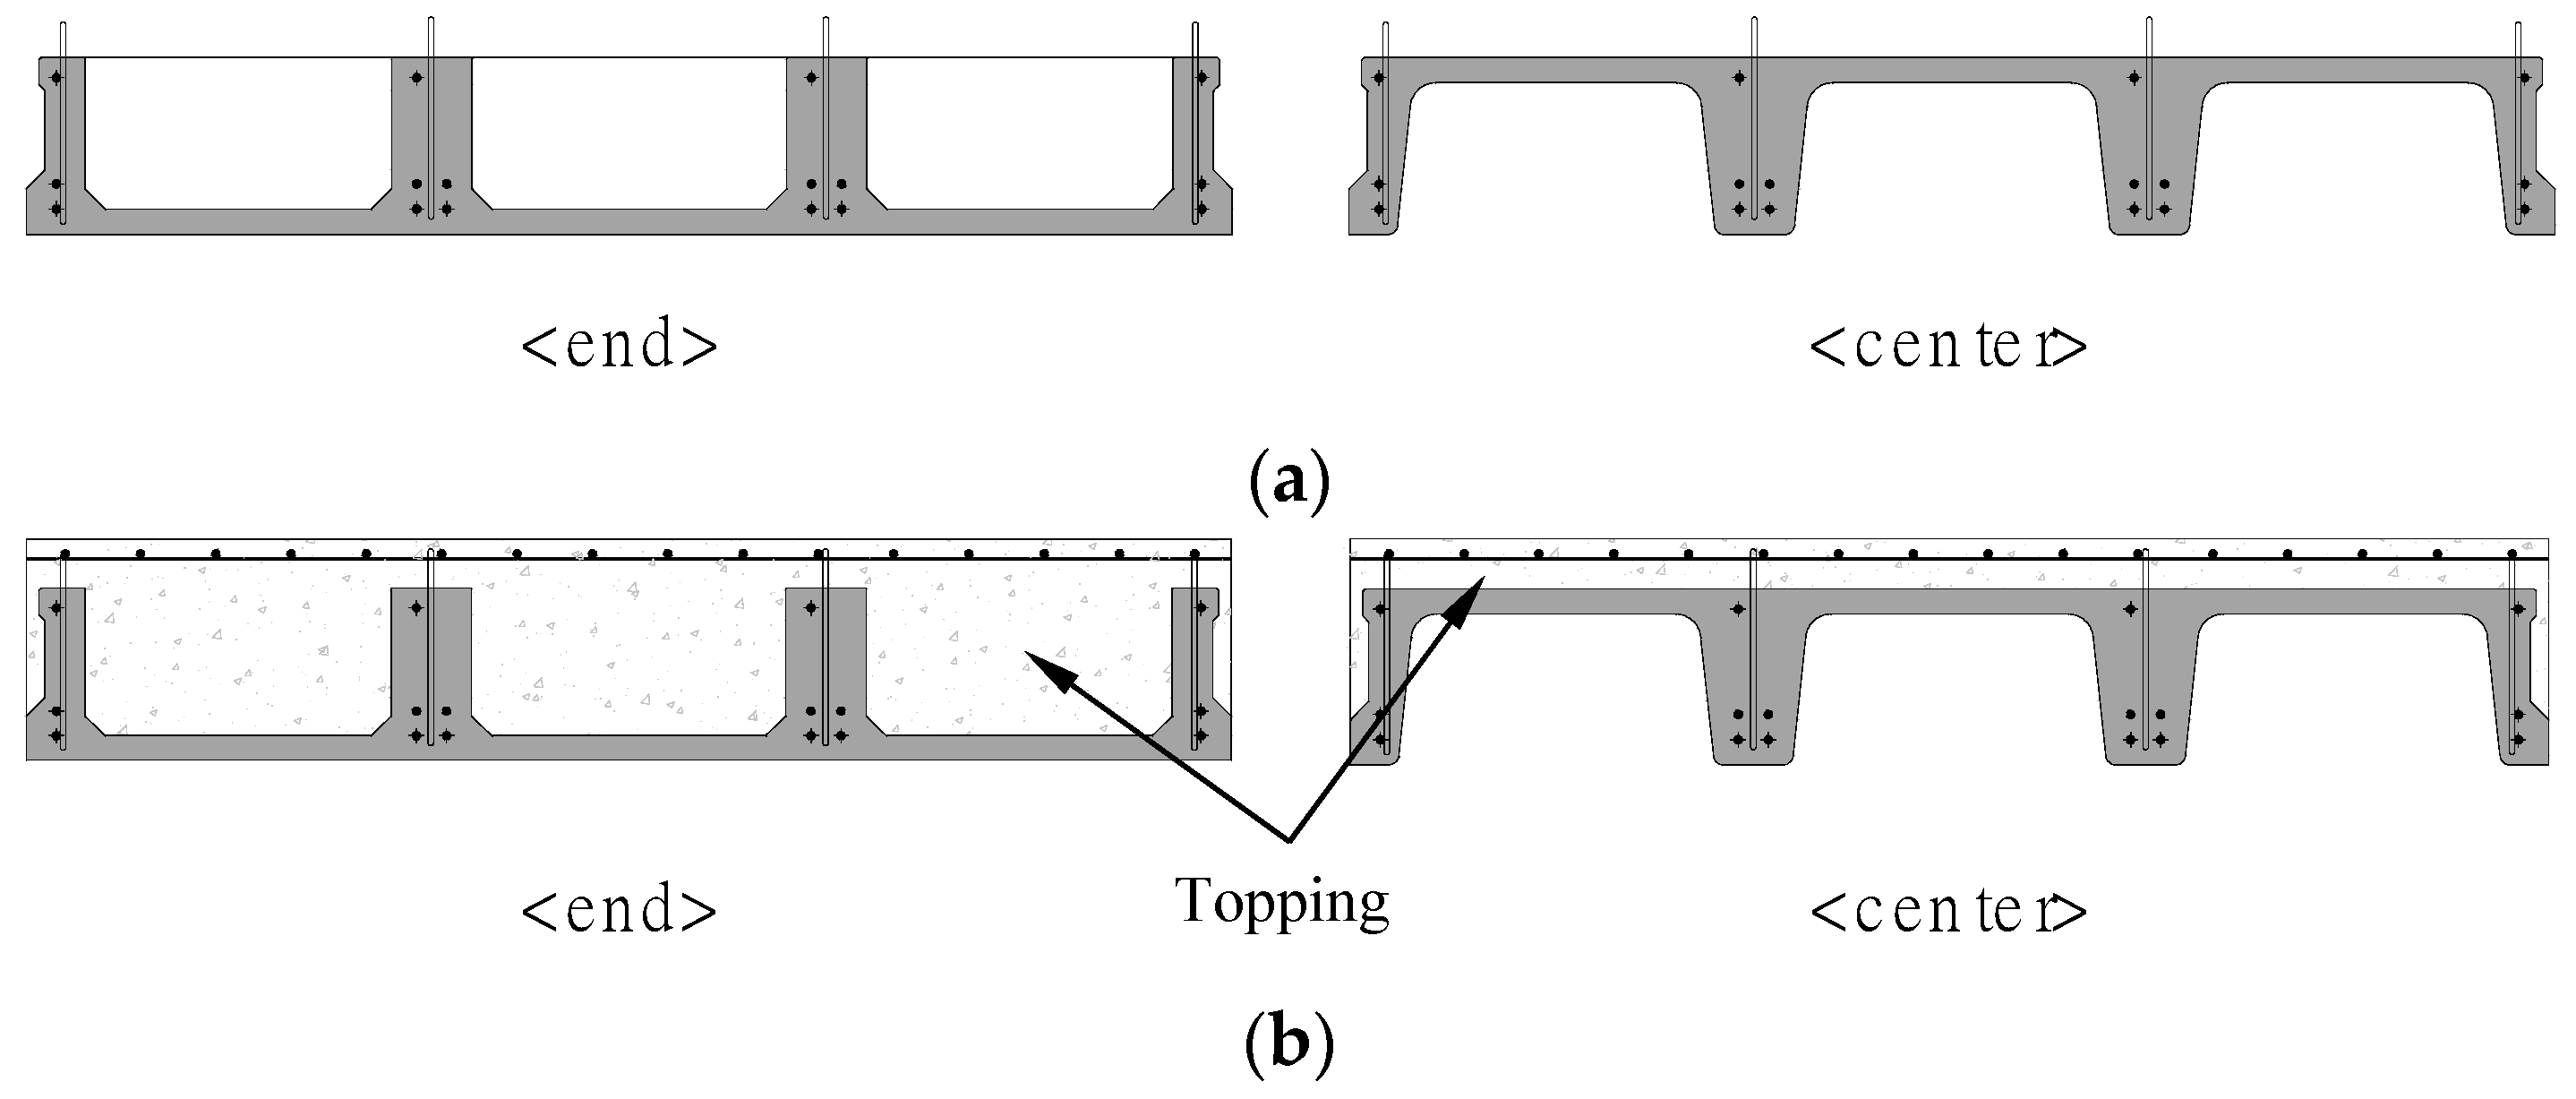
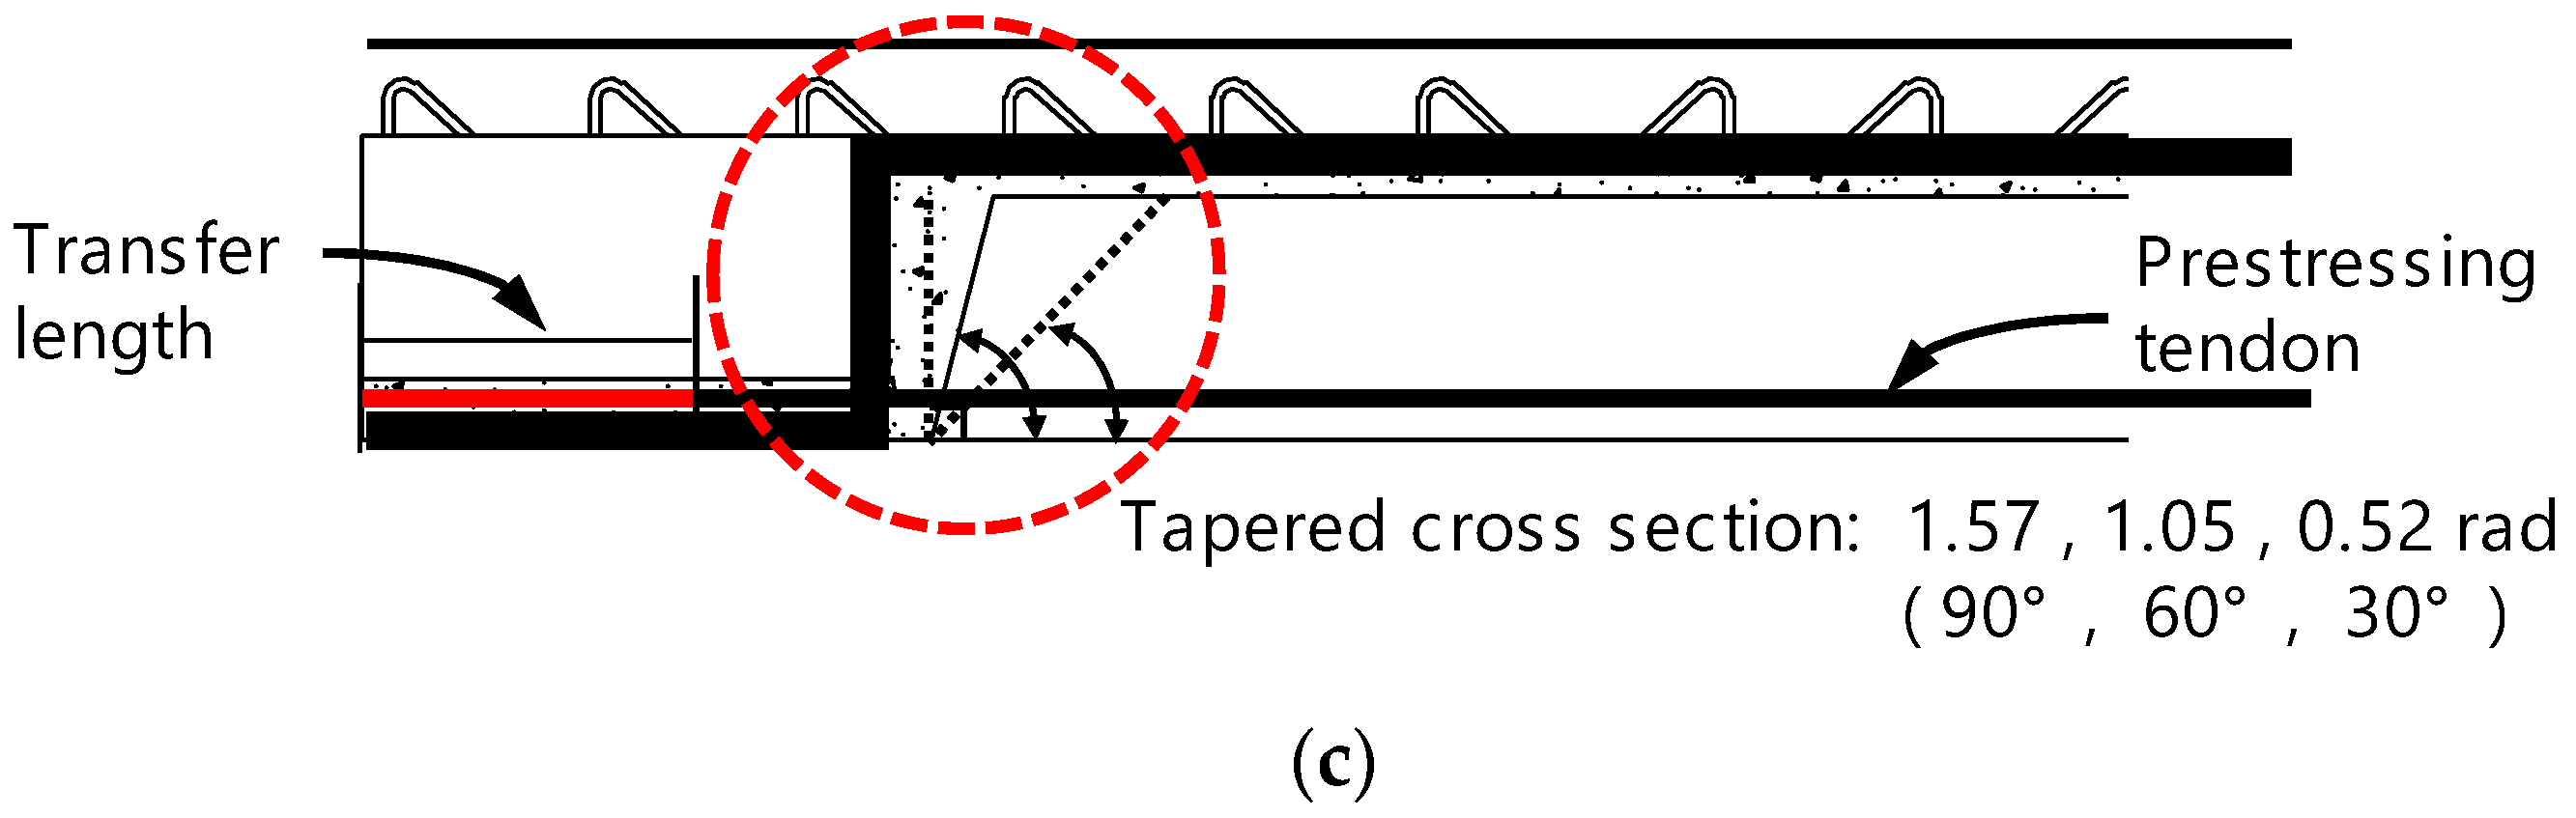
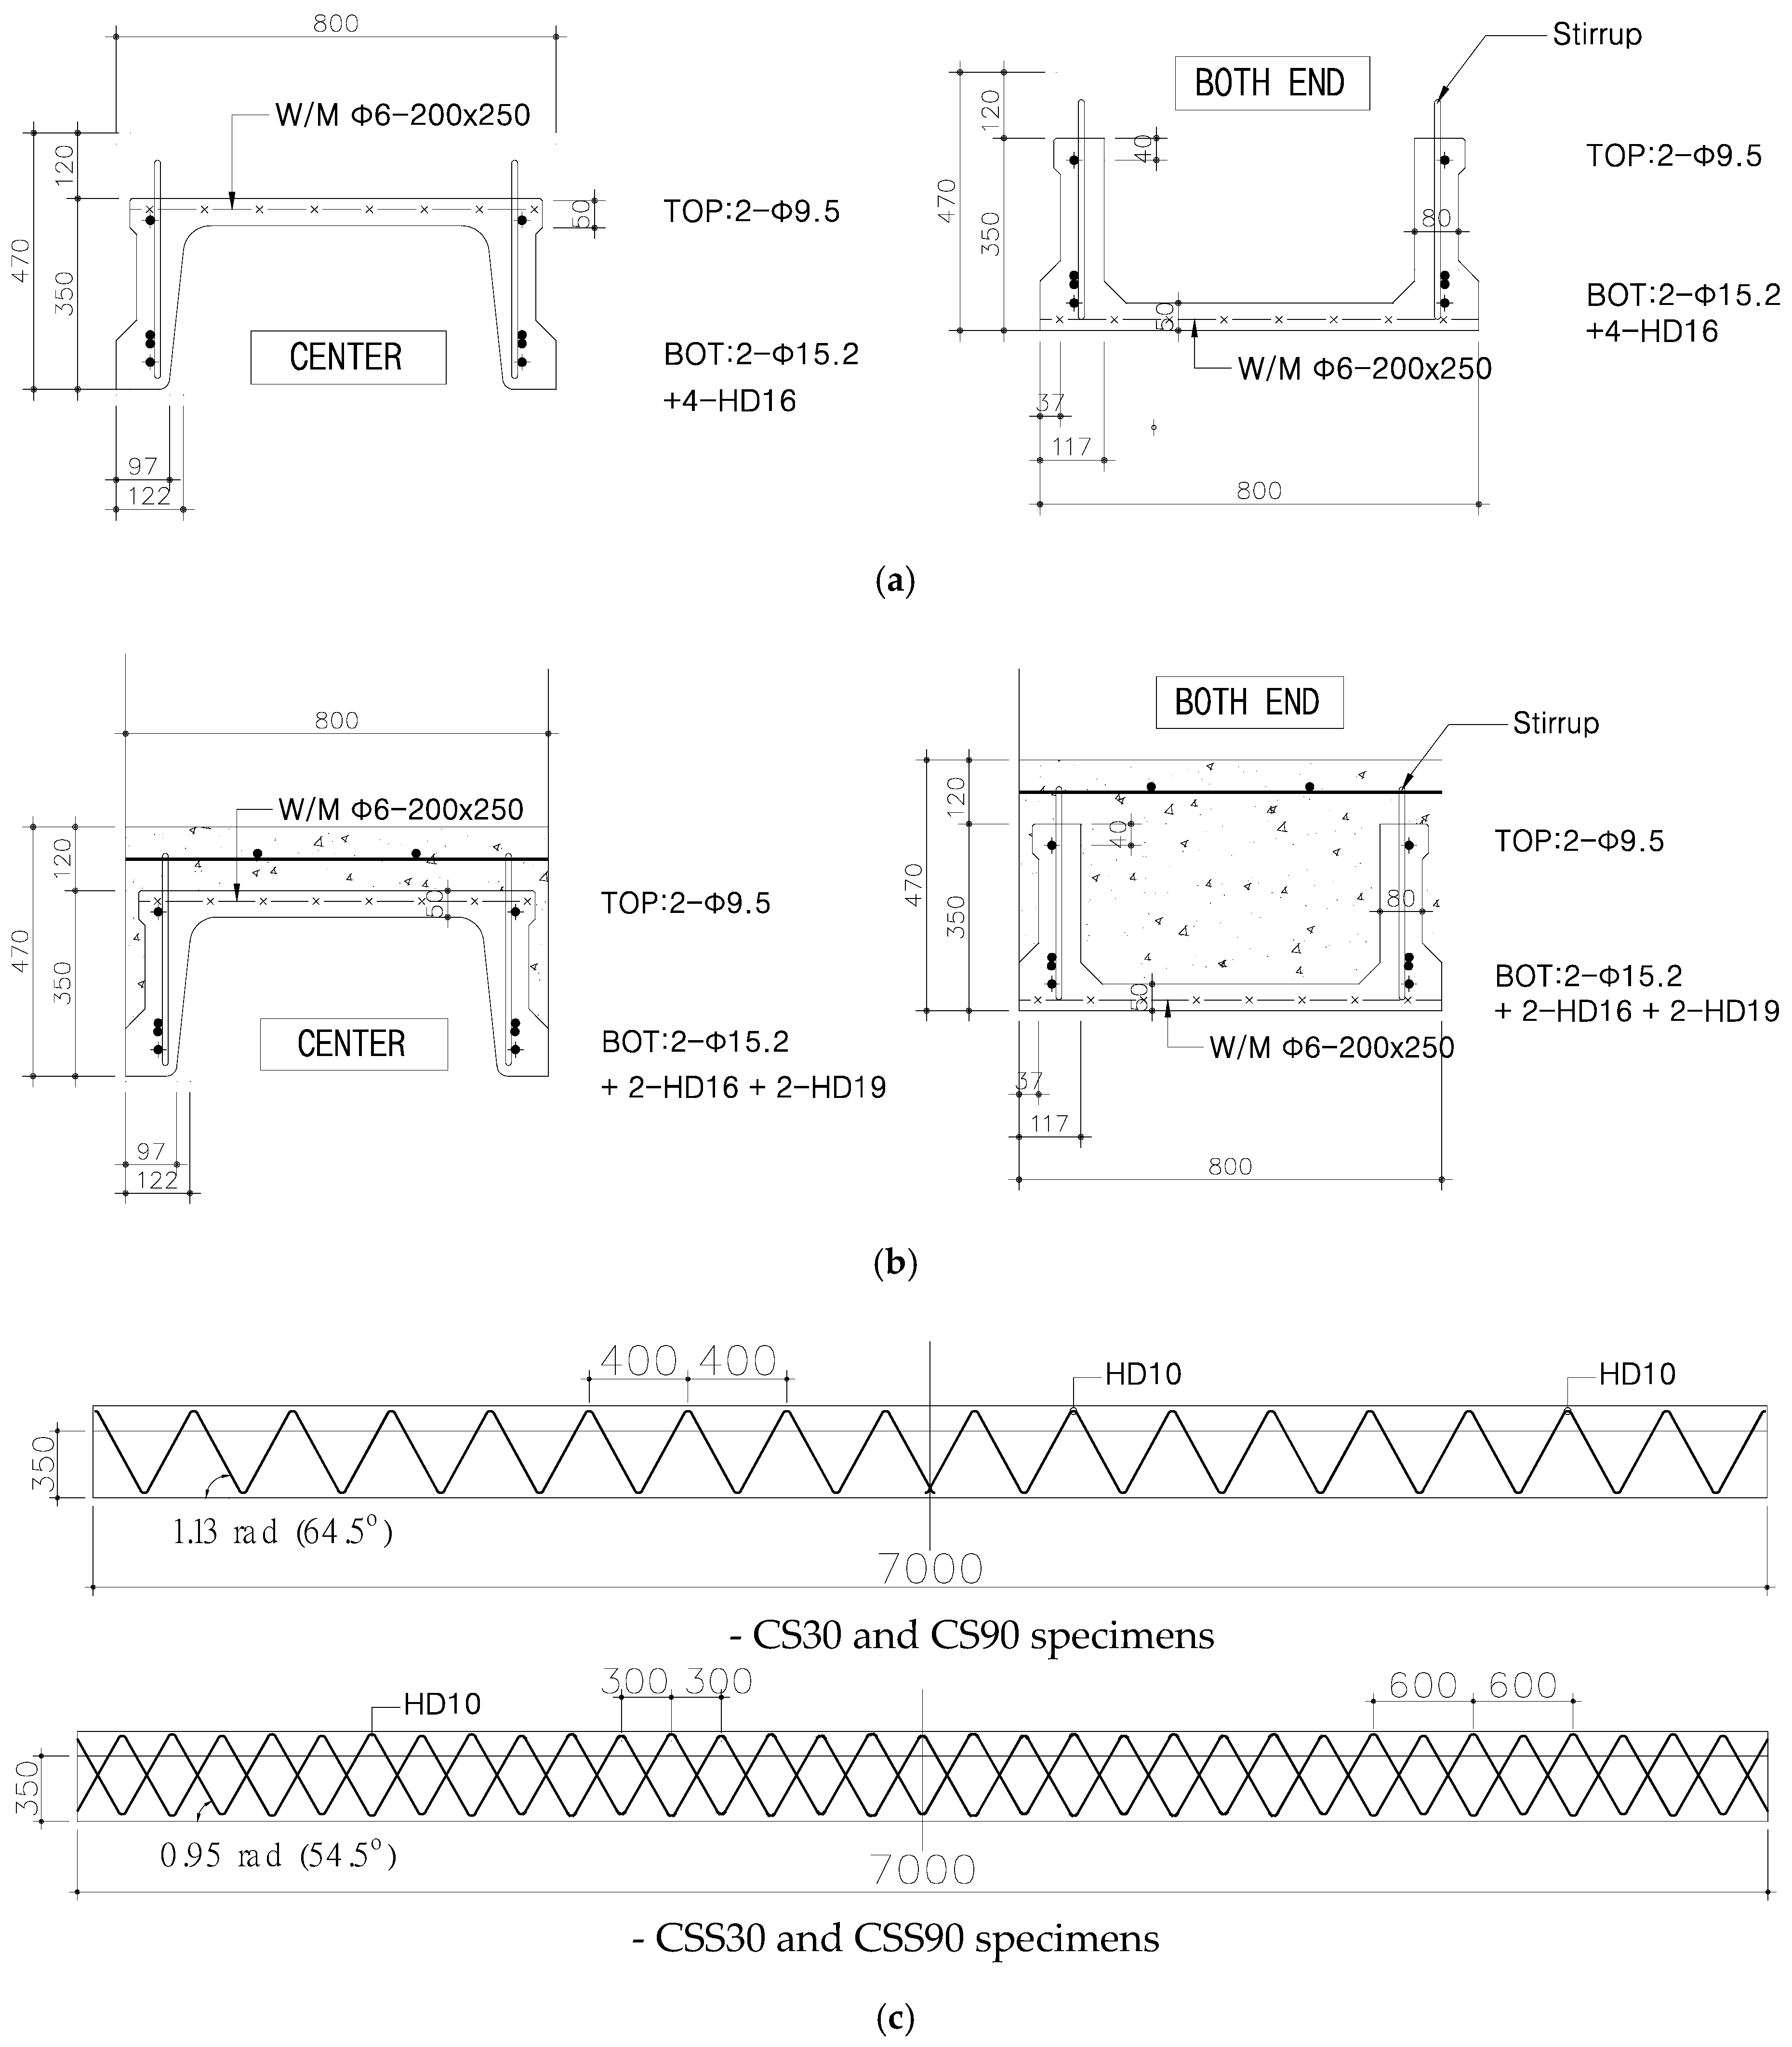
2.1. Details of Test Specimens
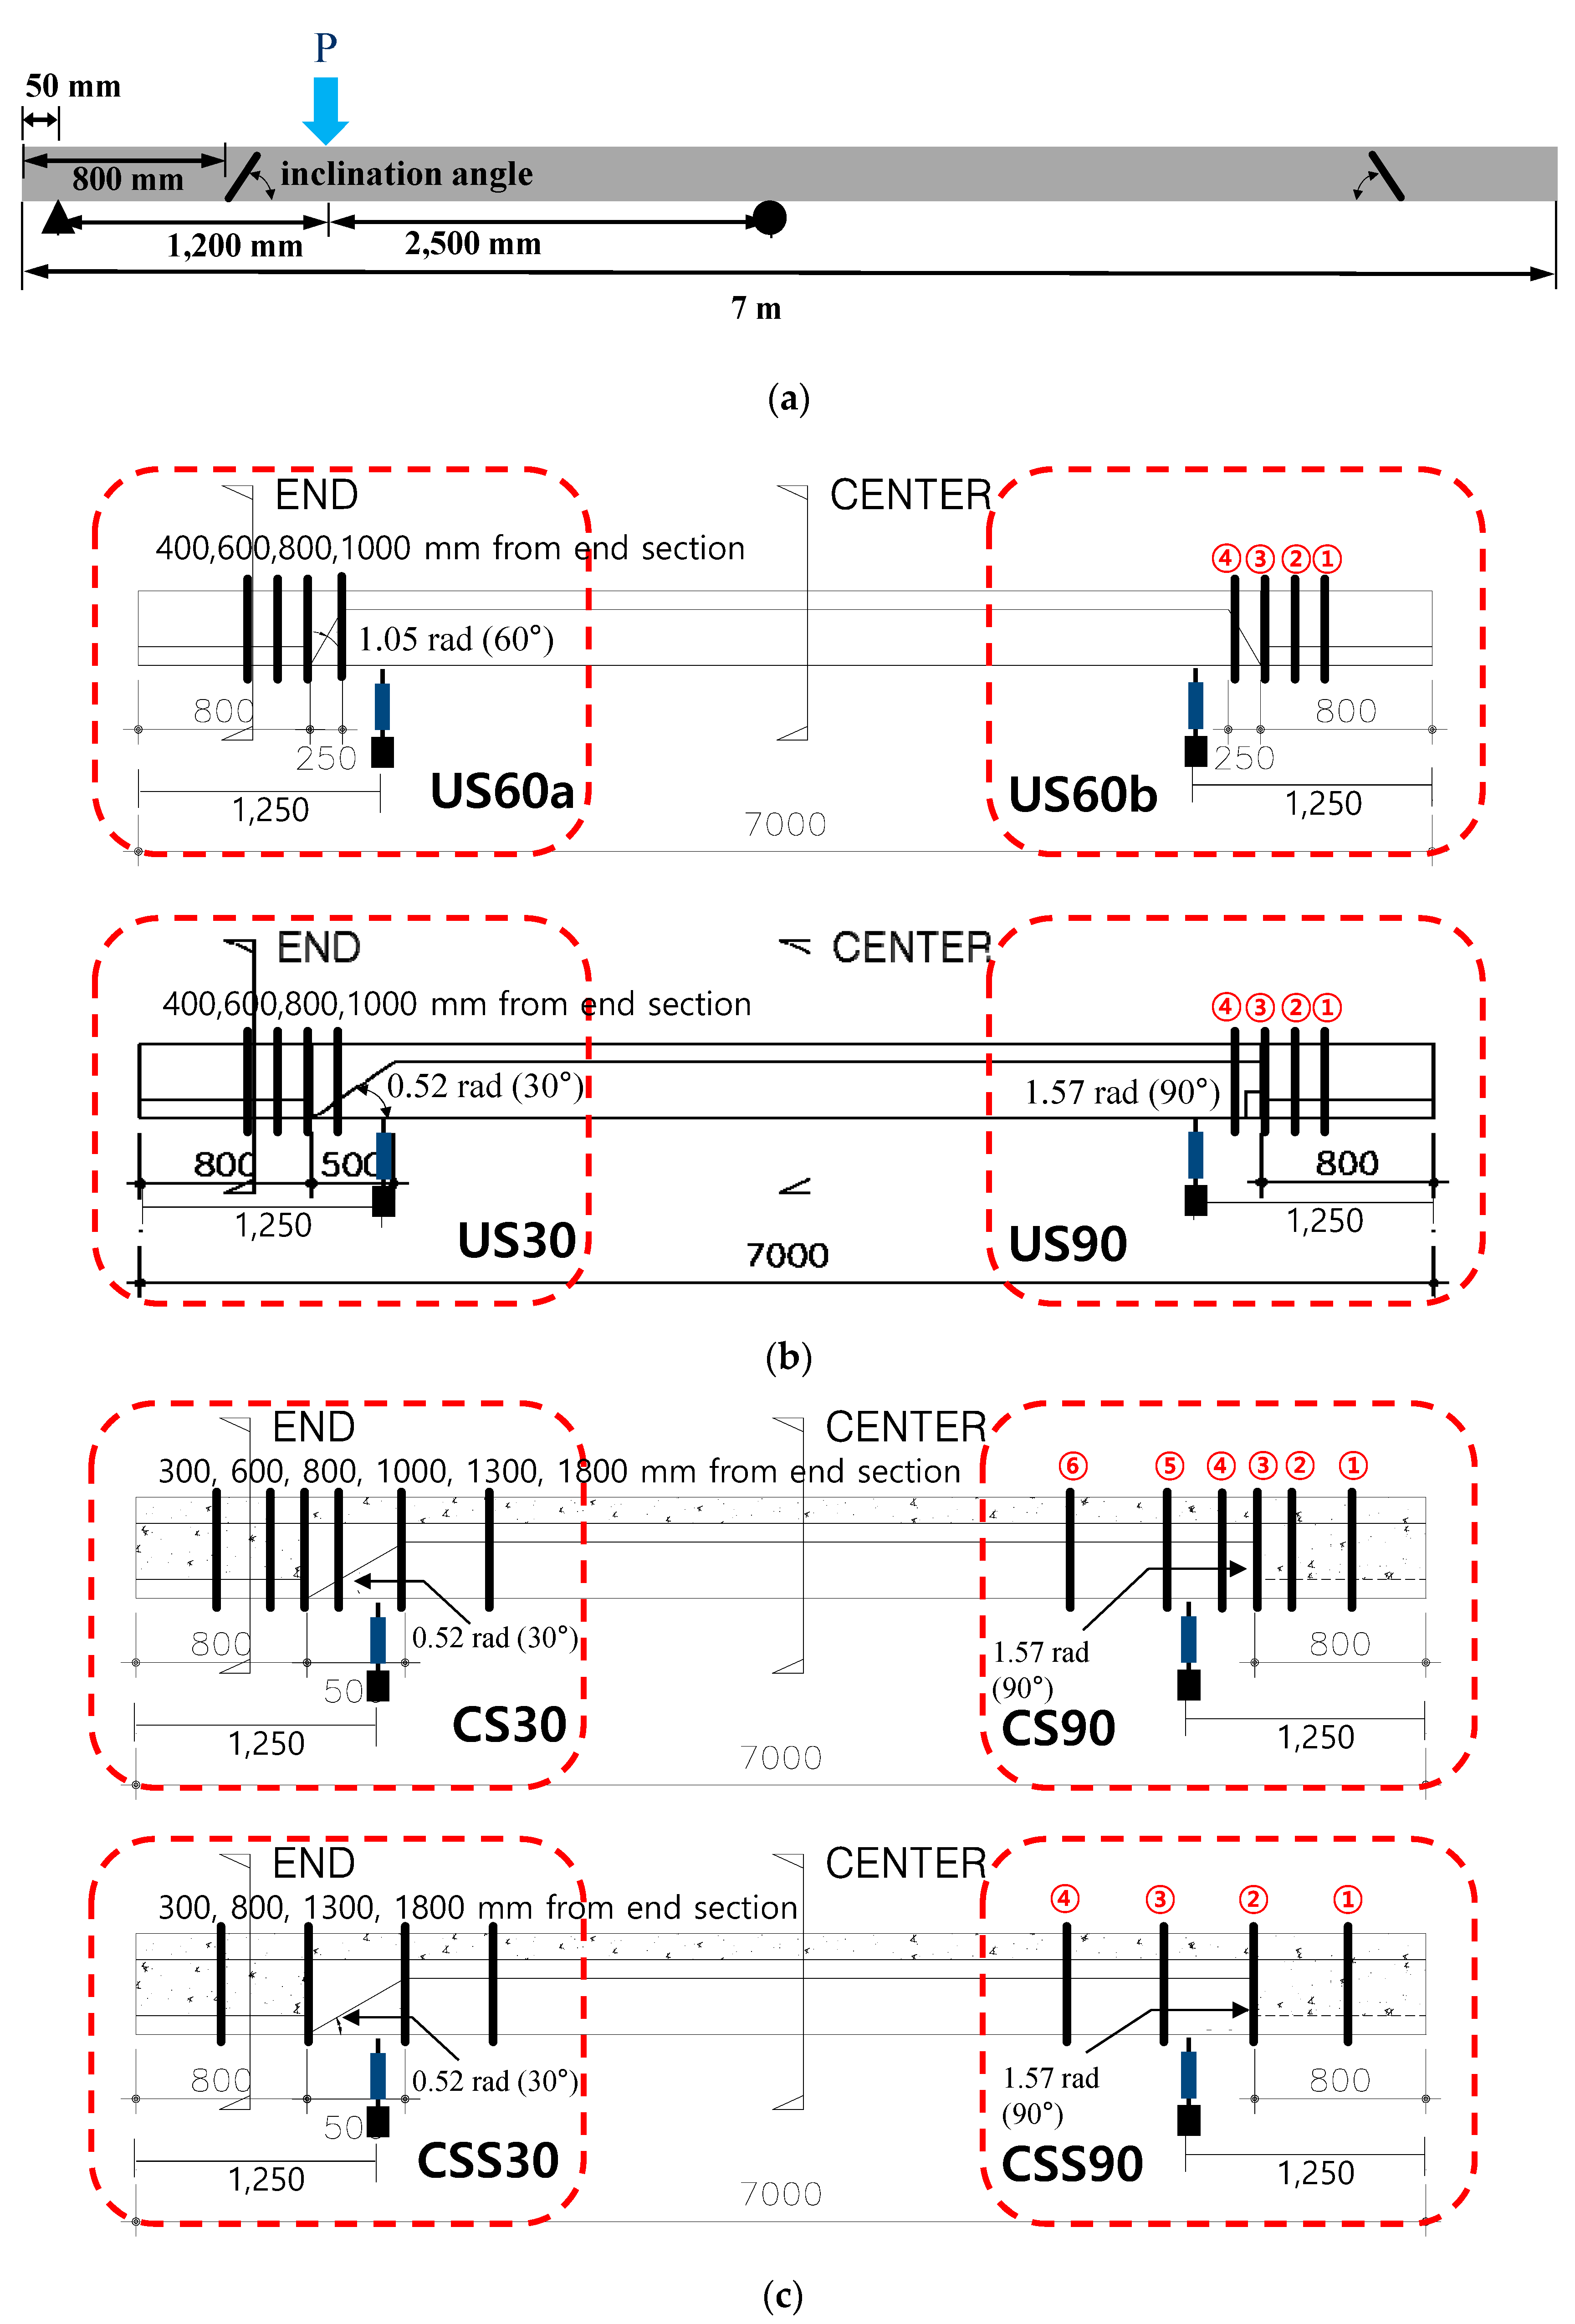
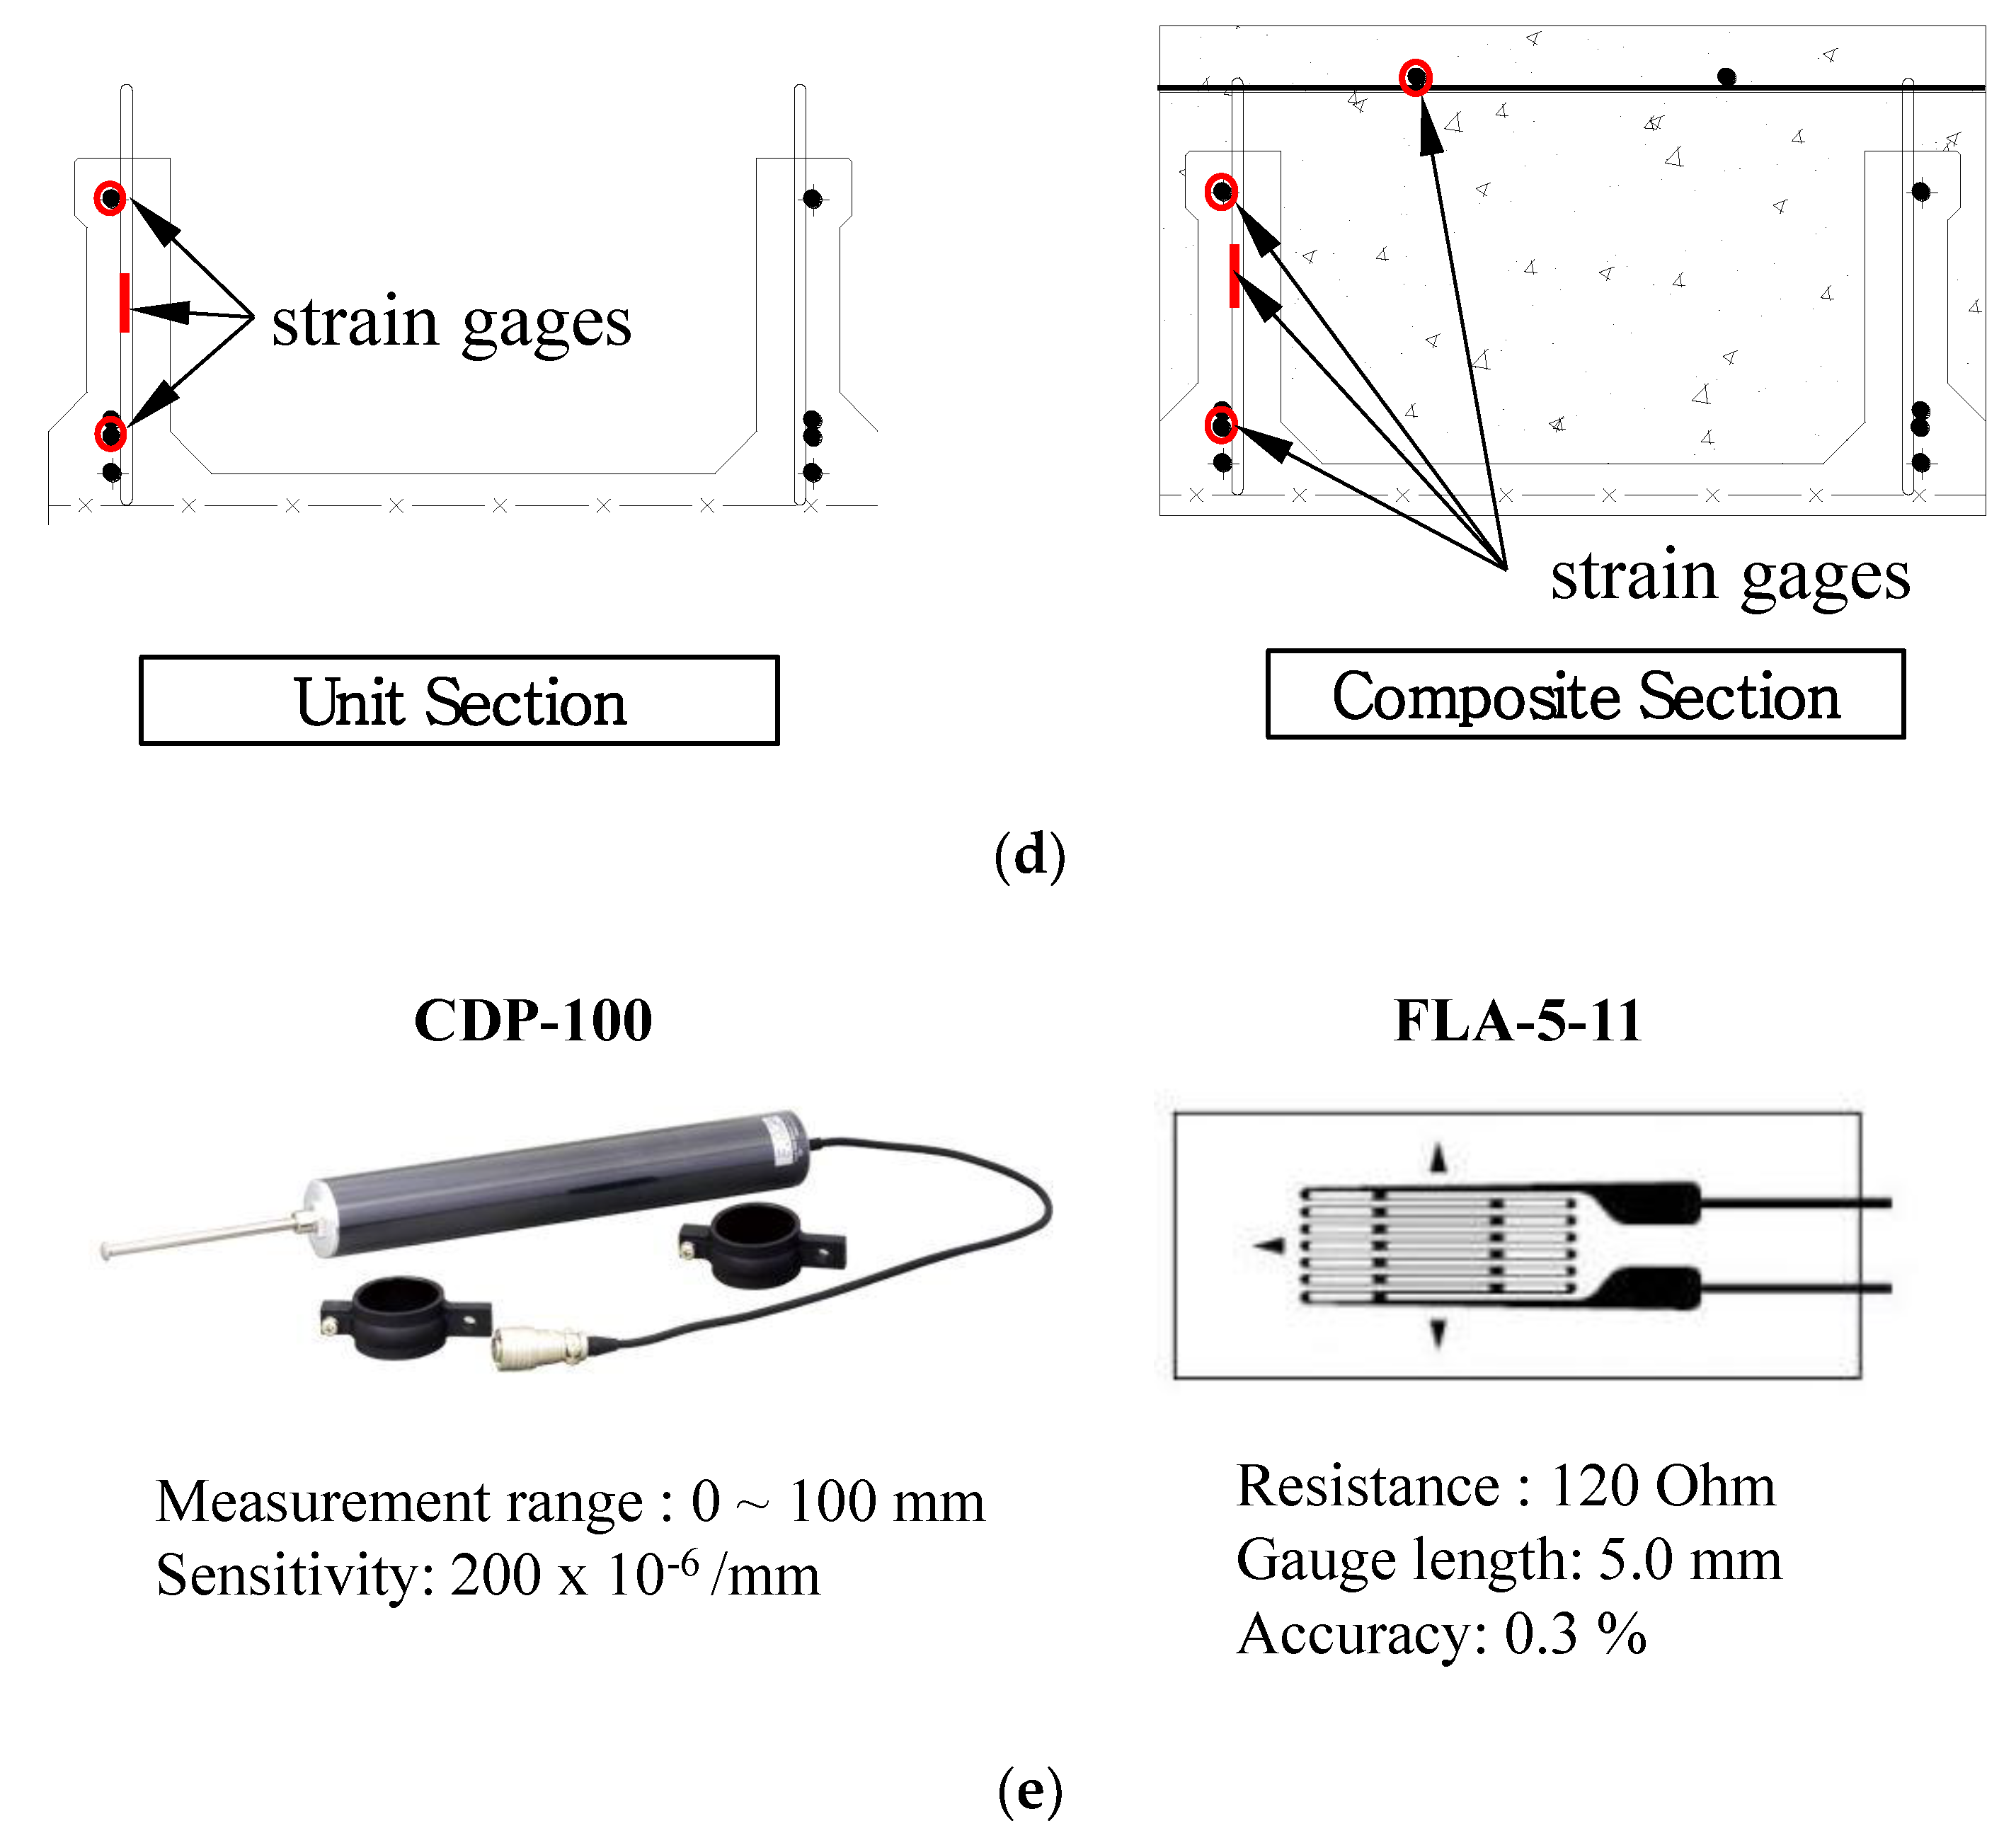
2.2. Test and Measurement Setup
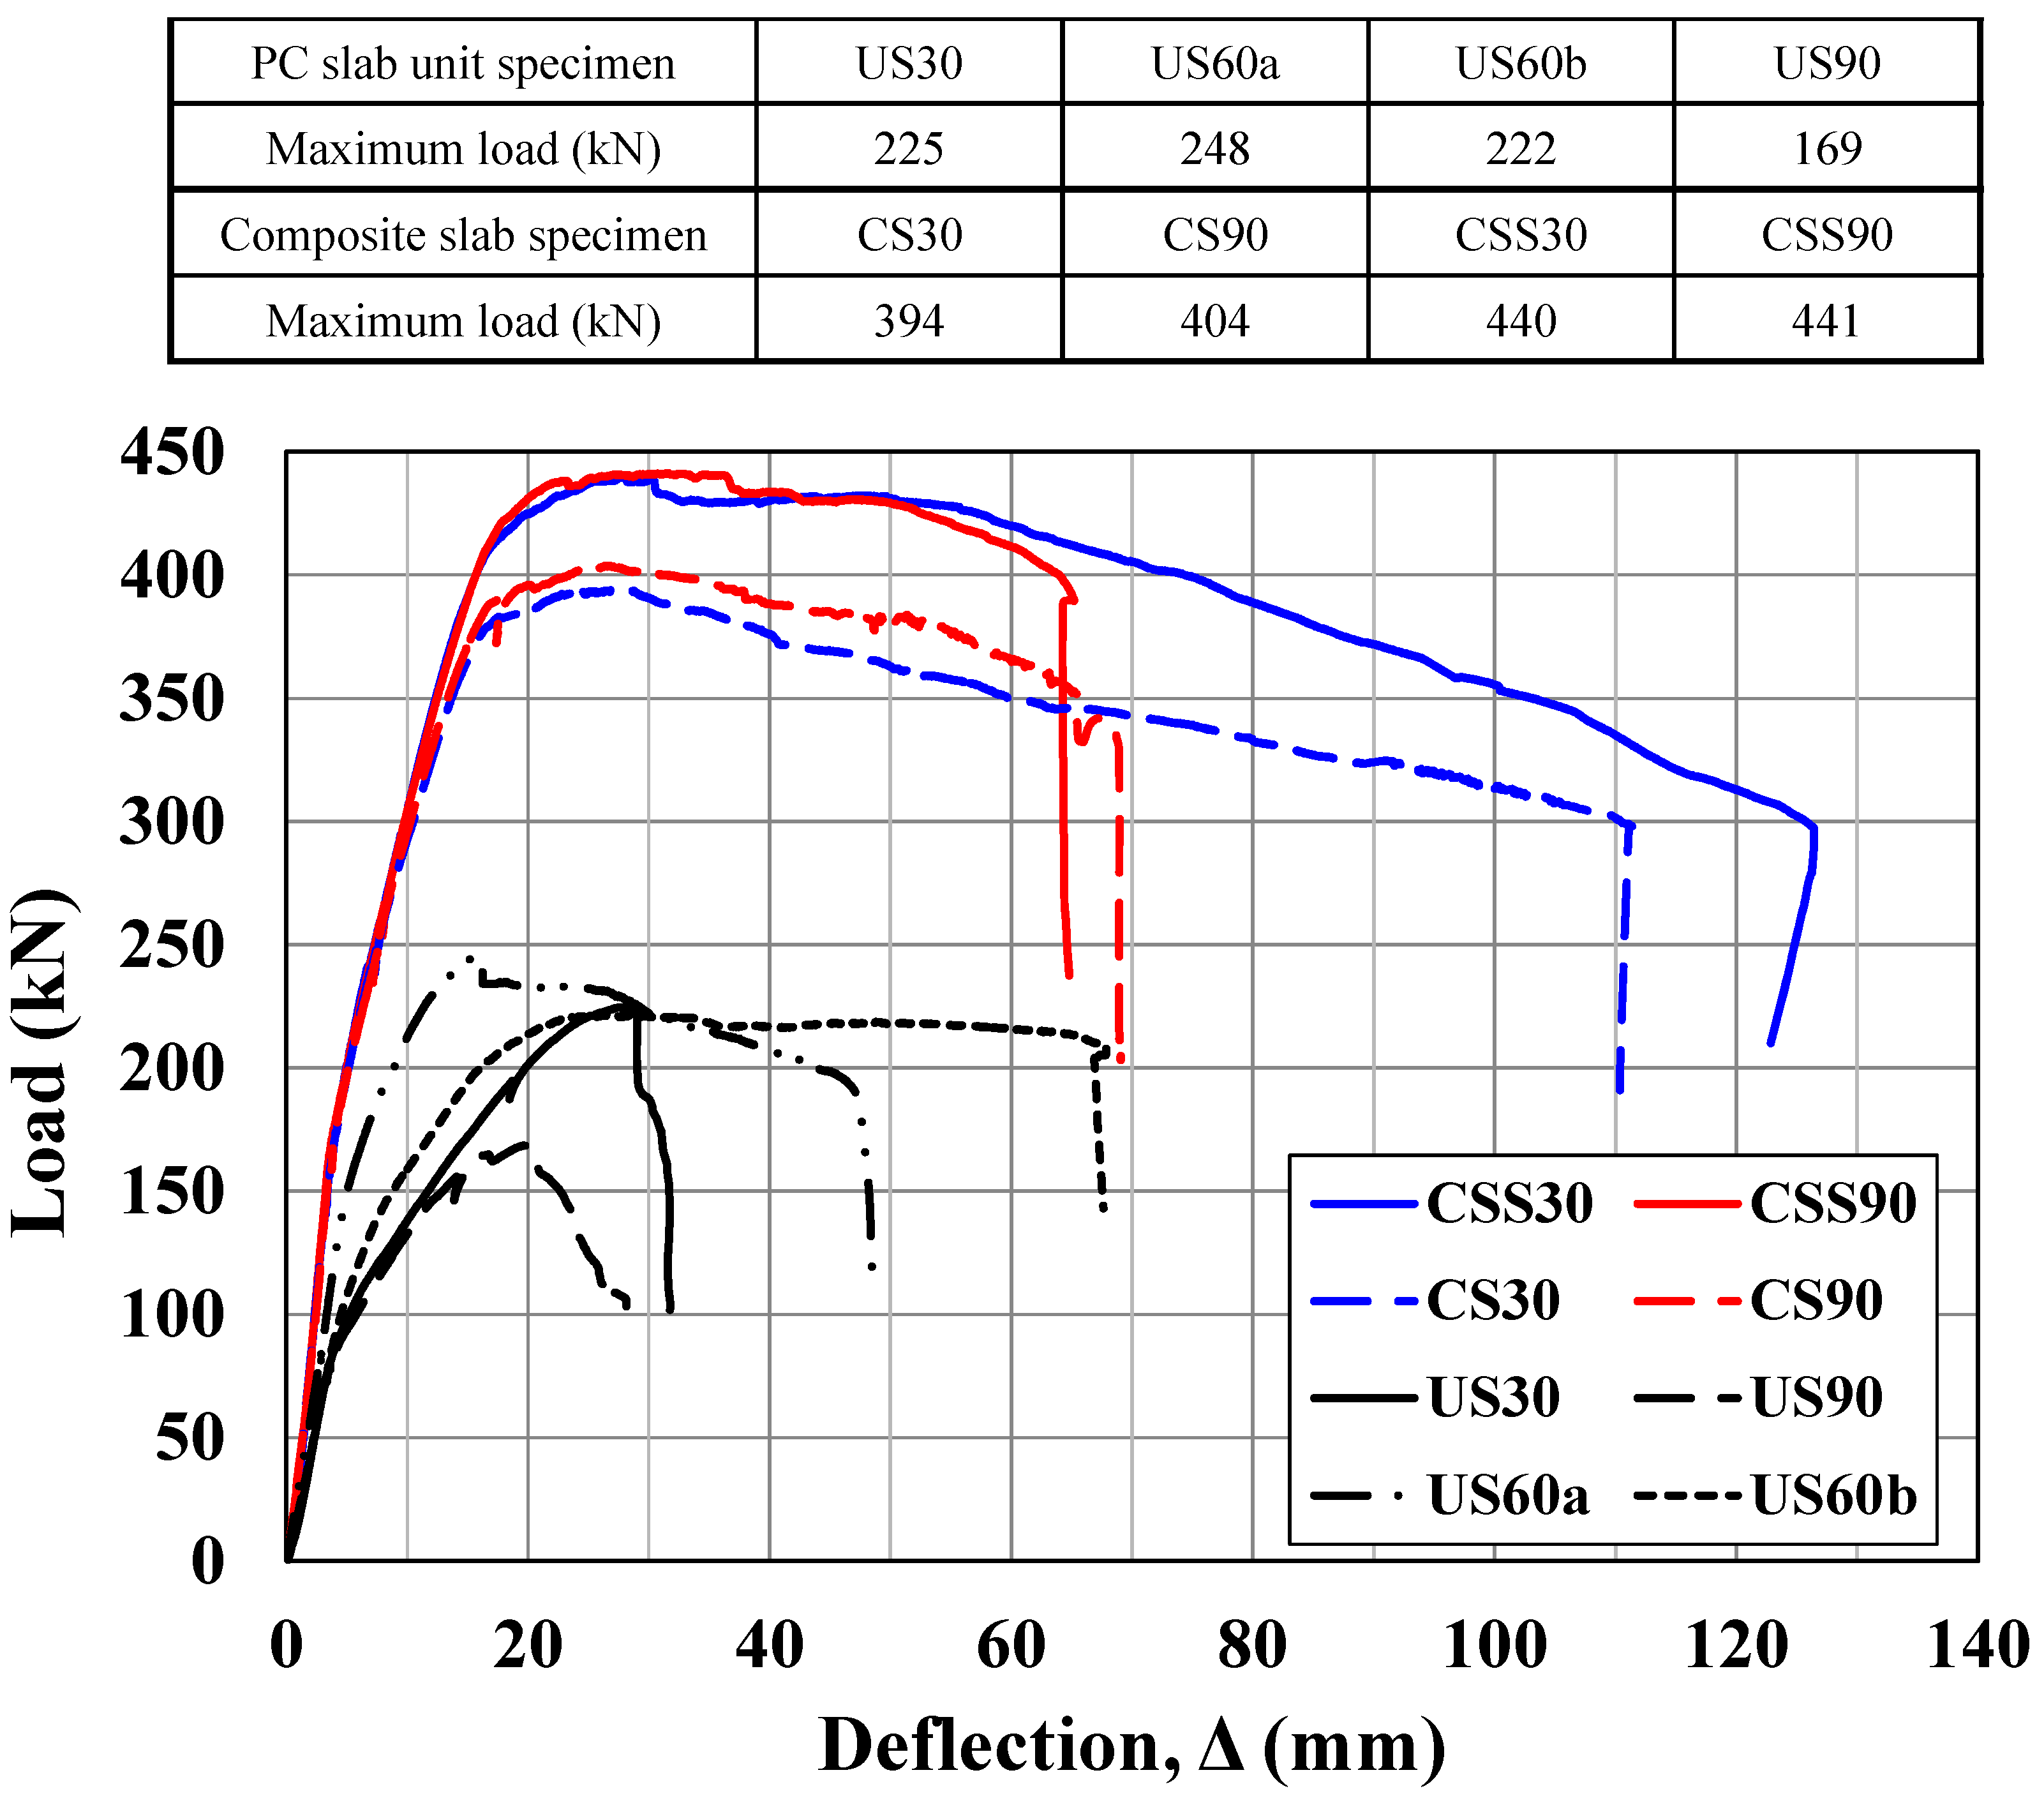
3. Test Results
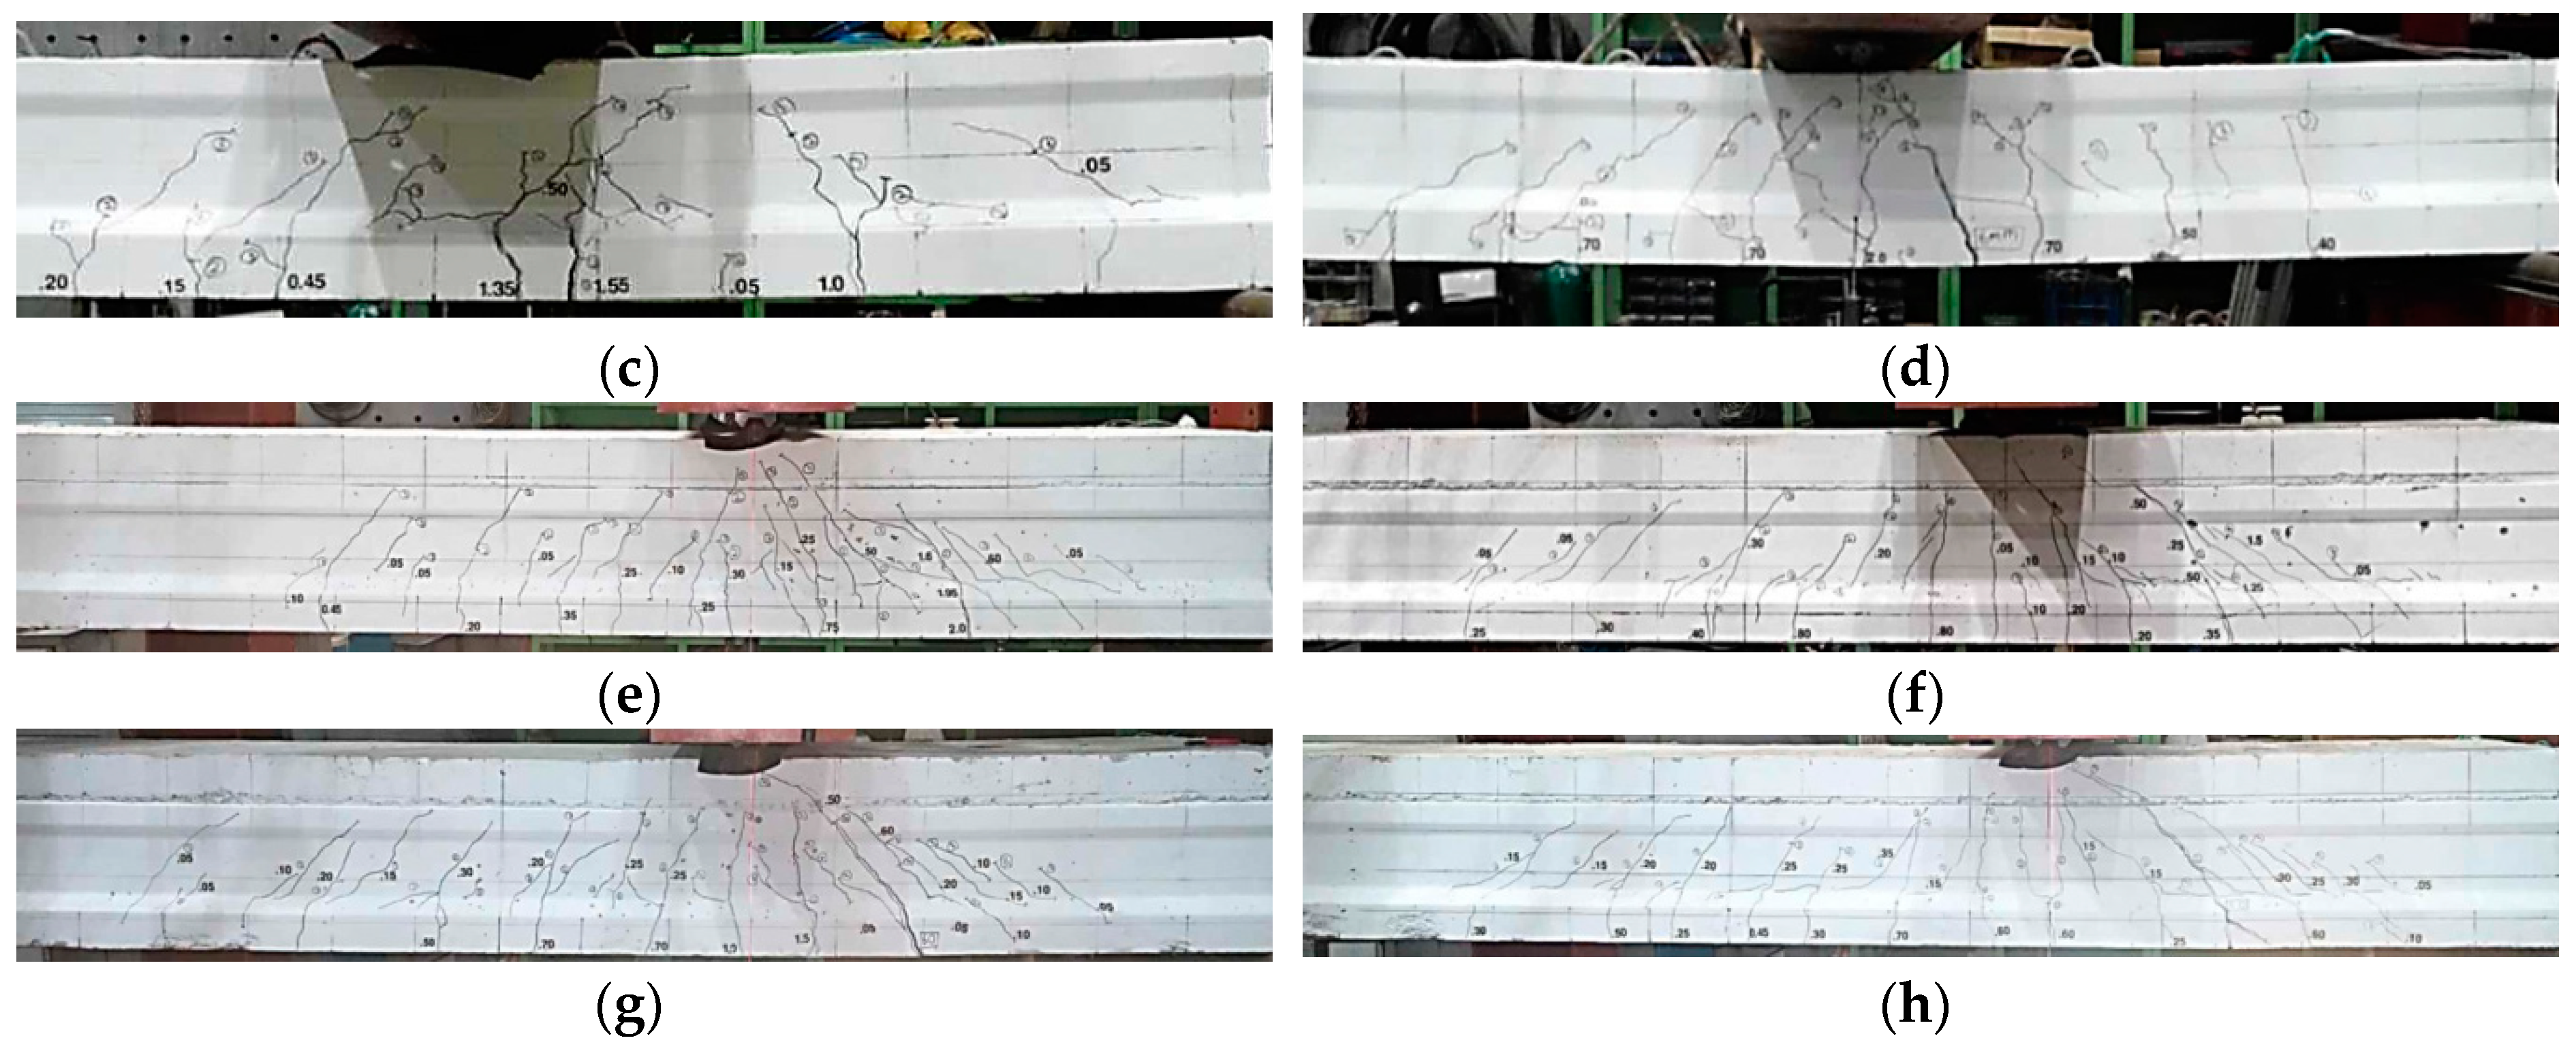
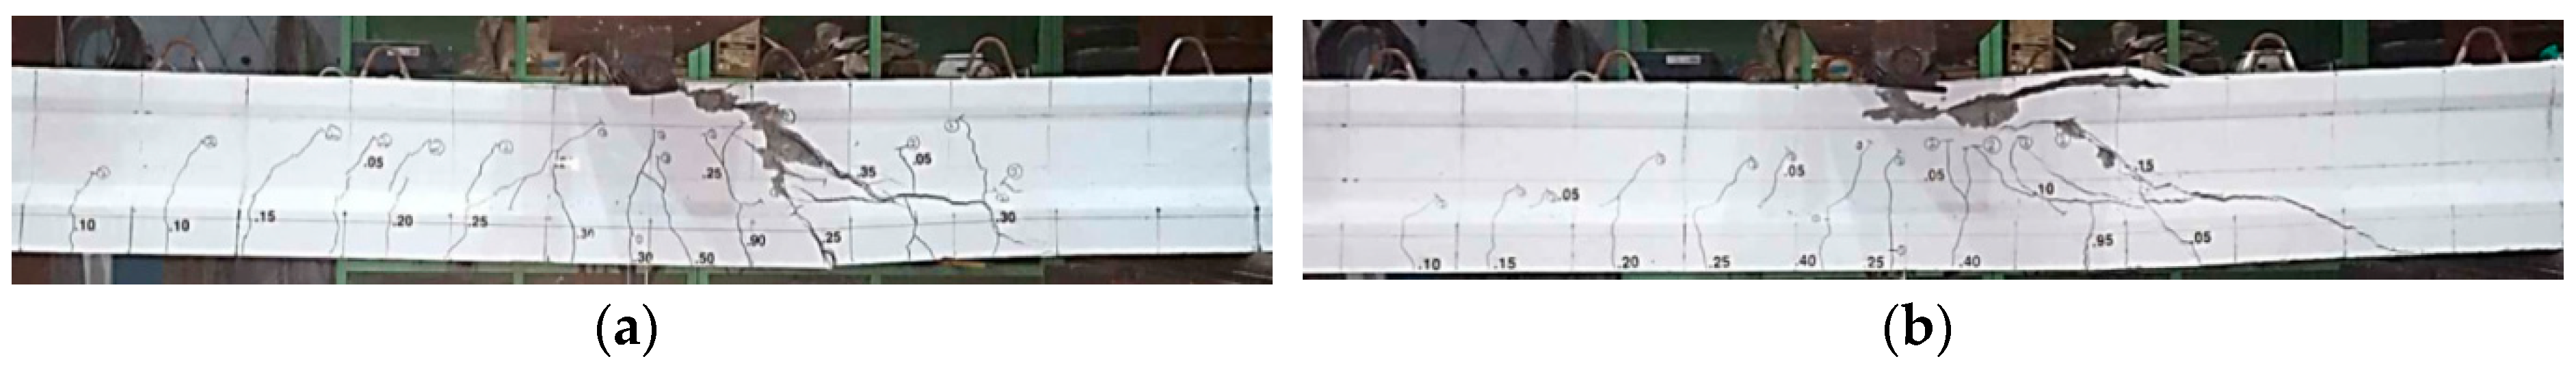
3.1. Shear Behaviour and Crack Pattern of Test Specimens
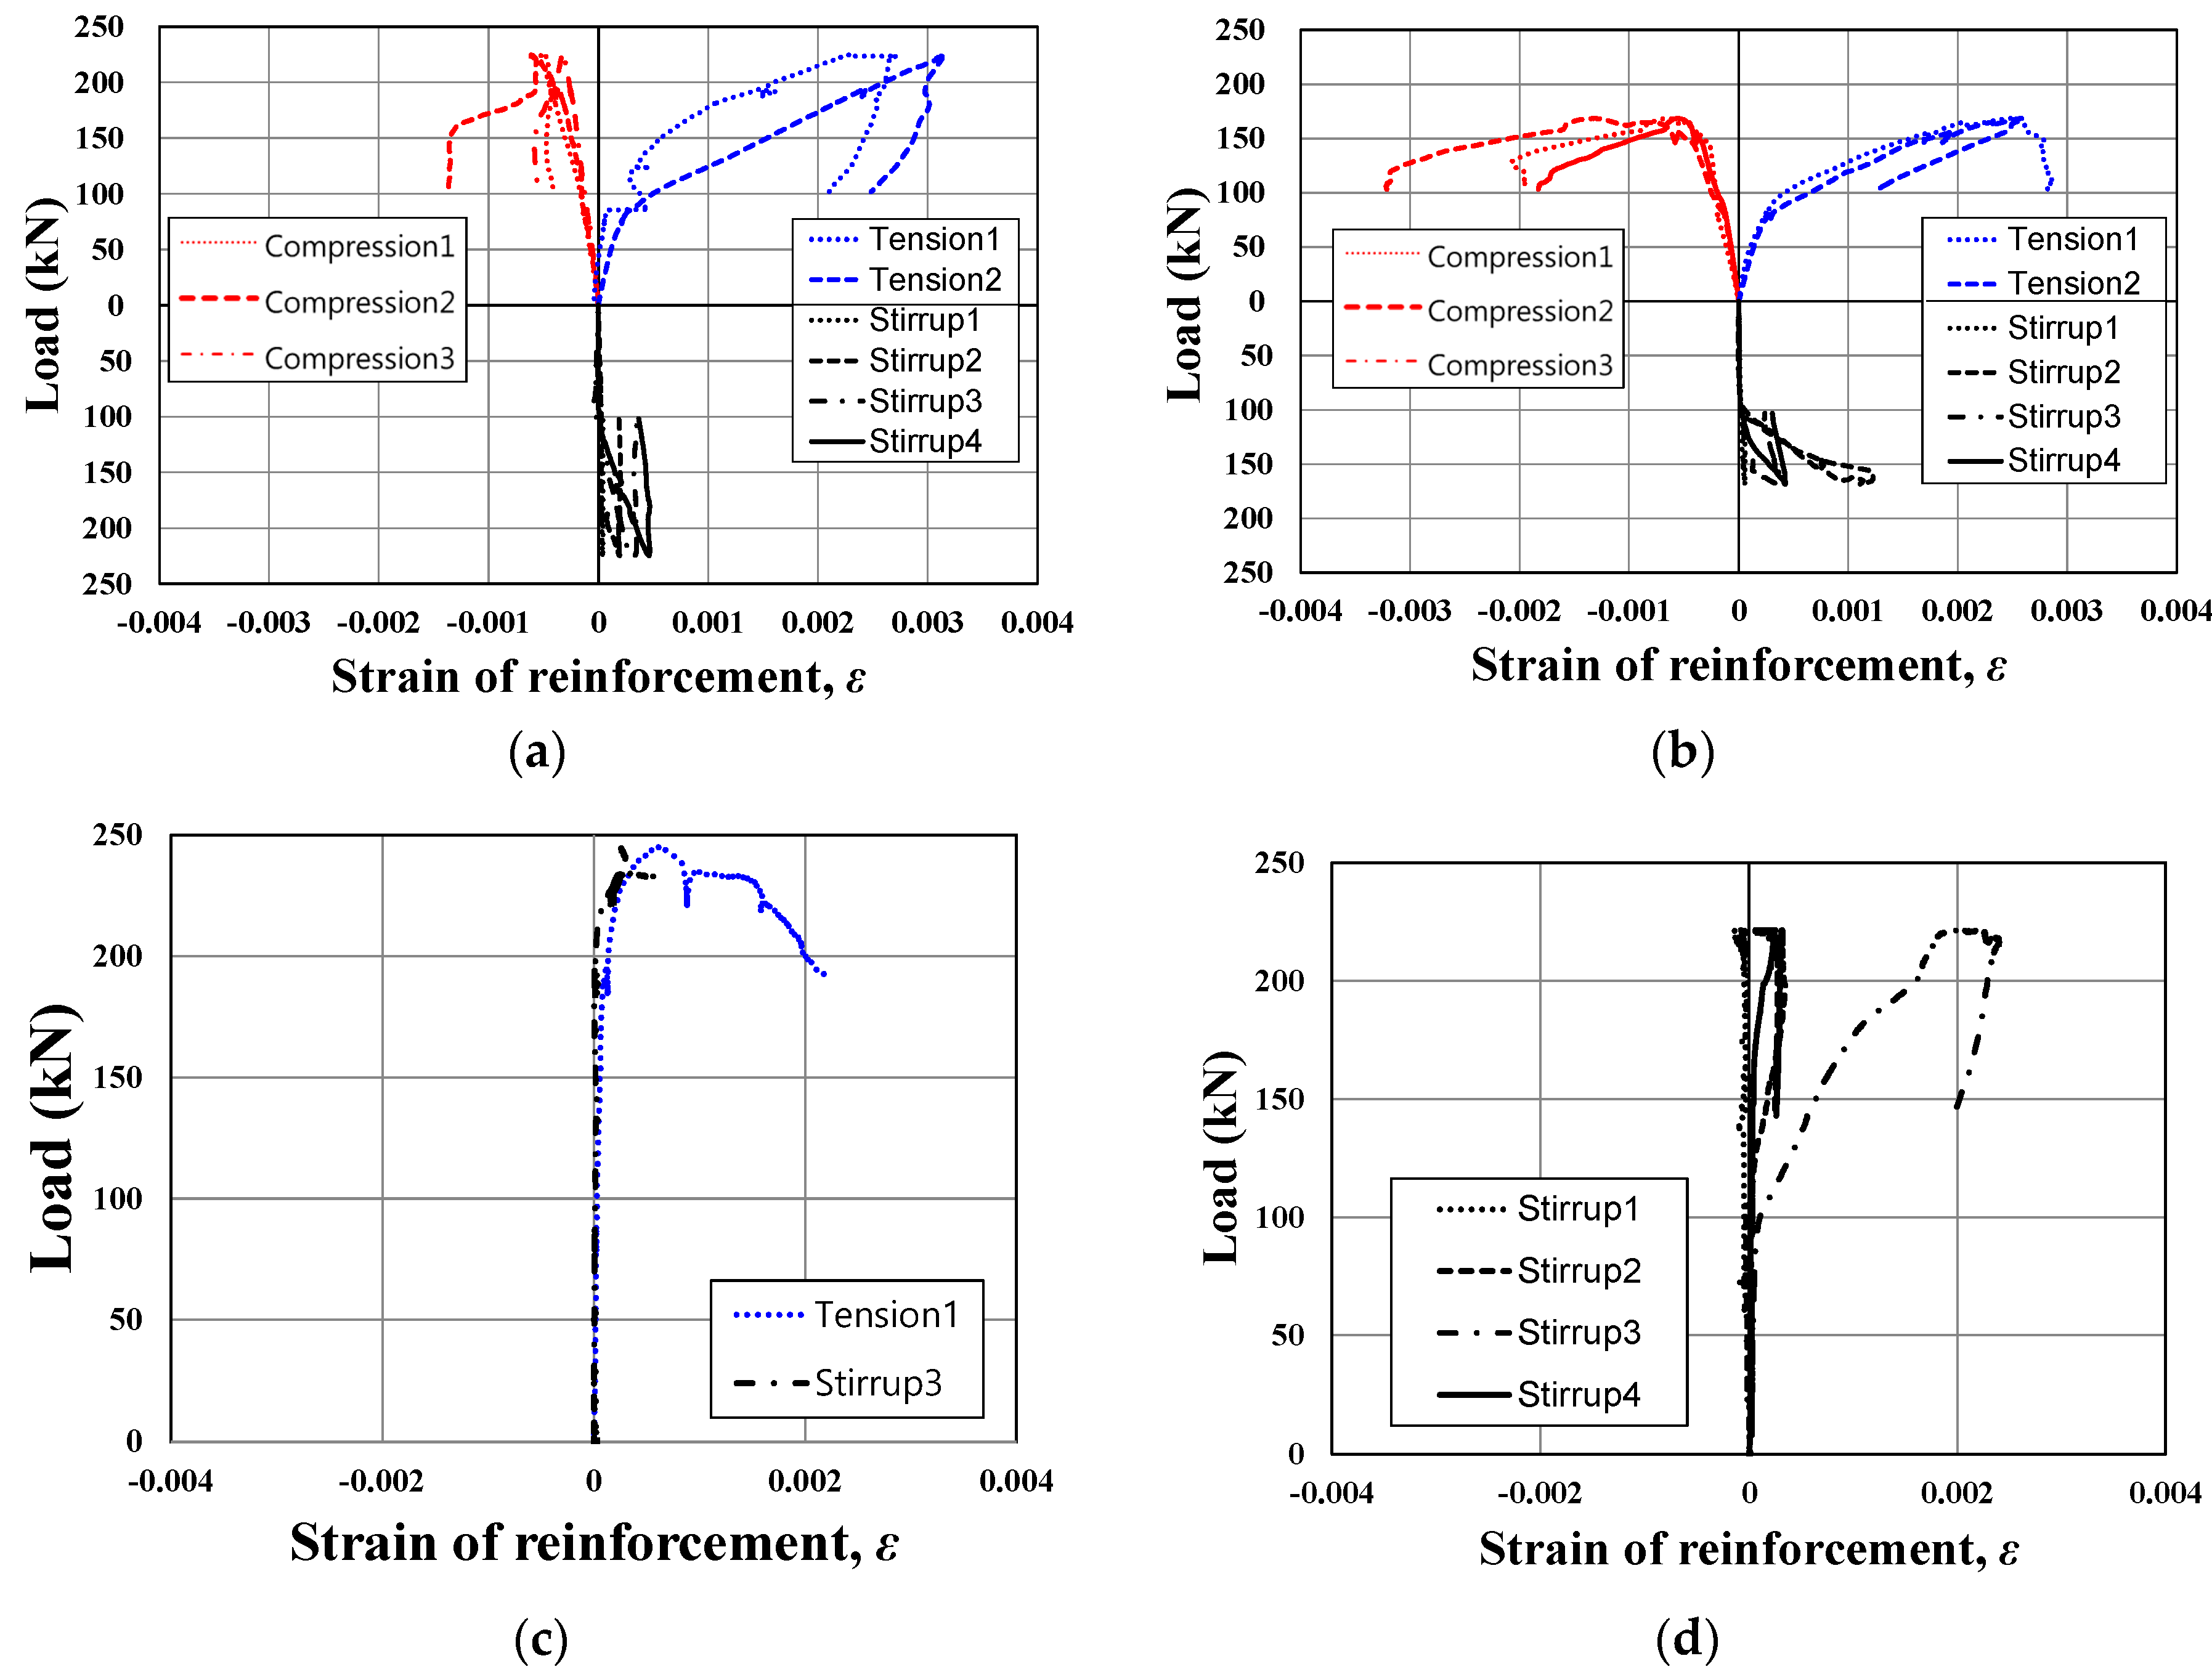
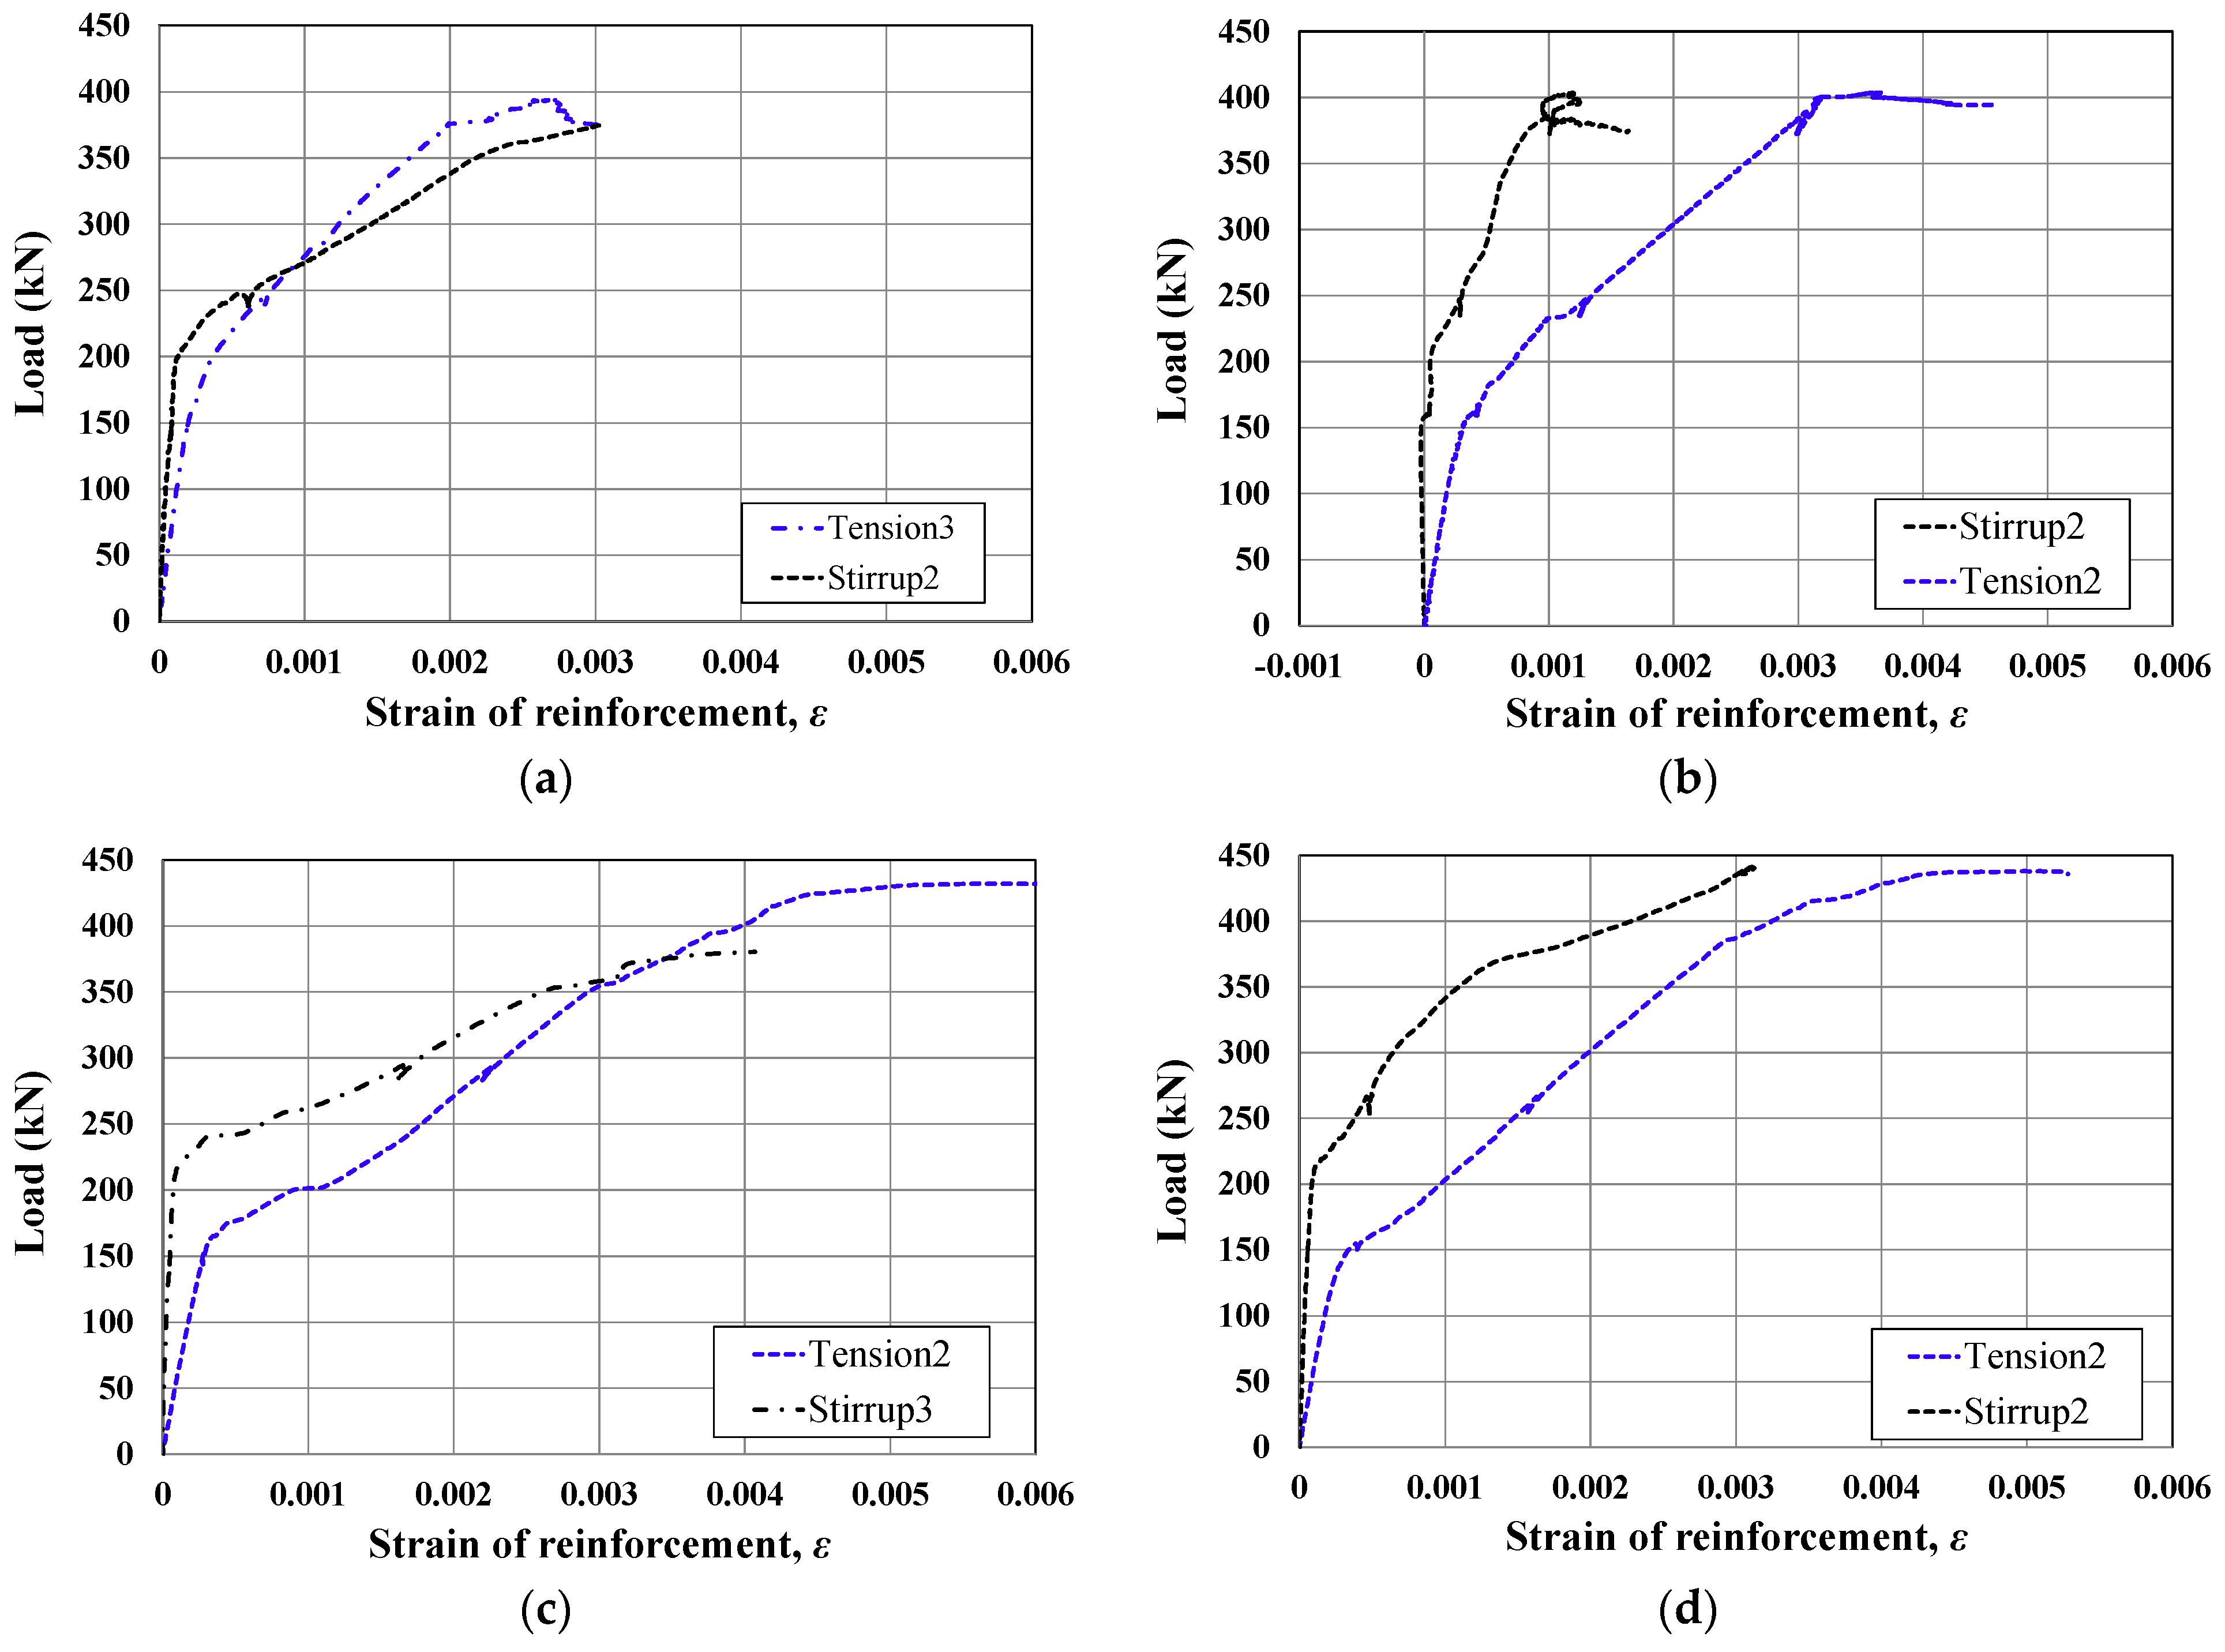
3.2. Measured Strains from Reinforcement
4. Analysis for Design
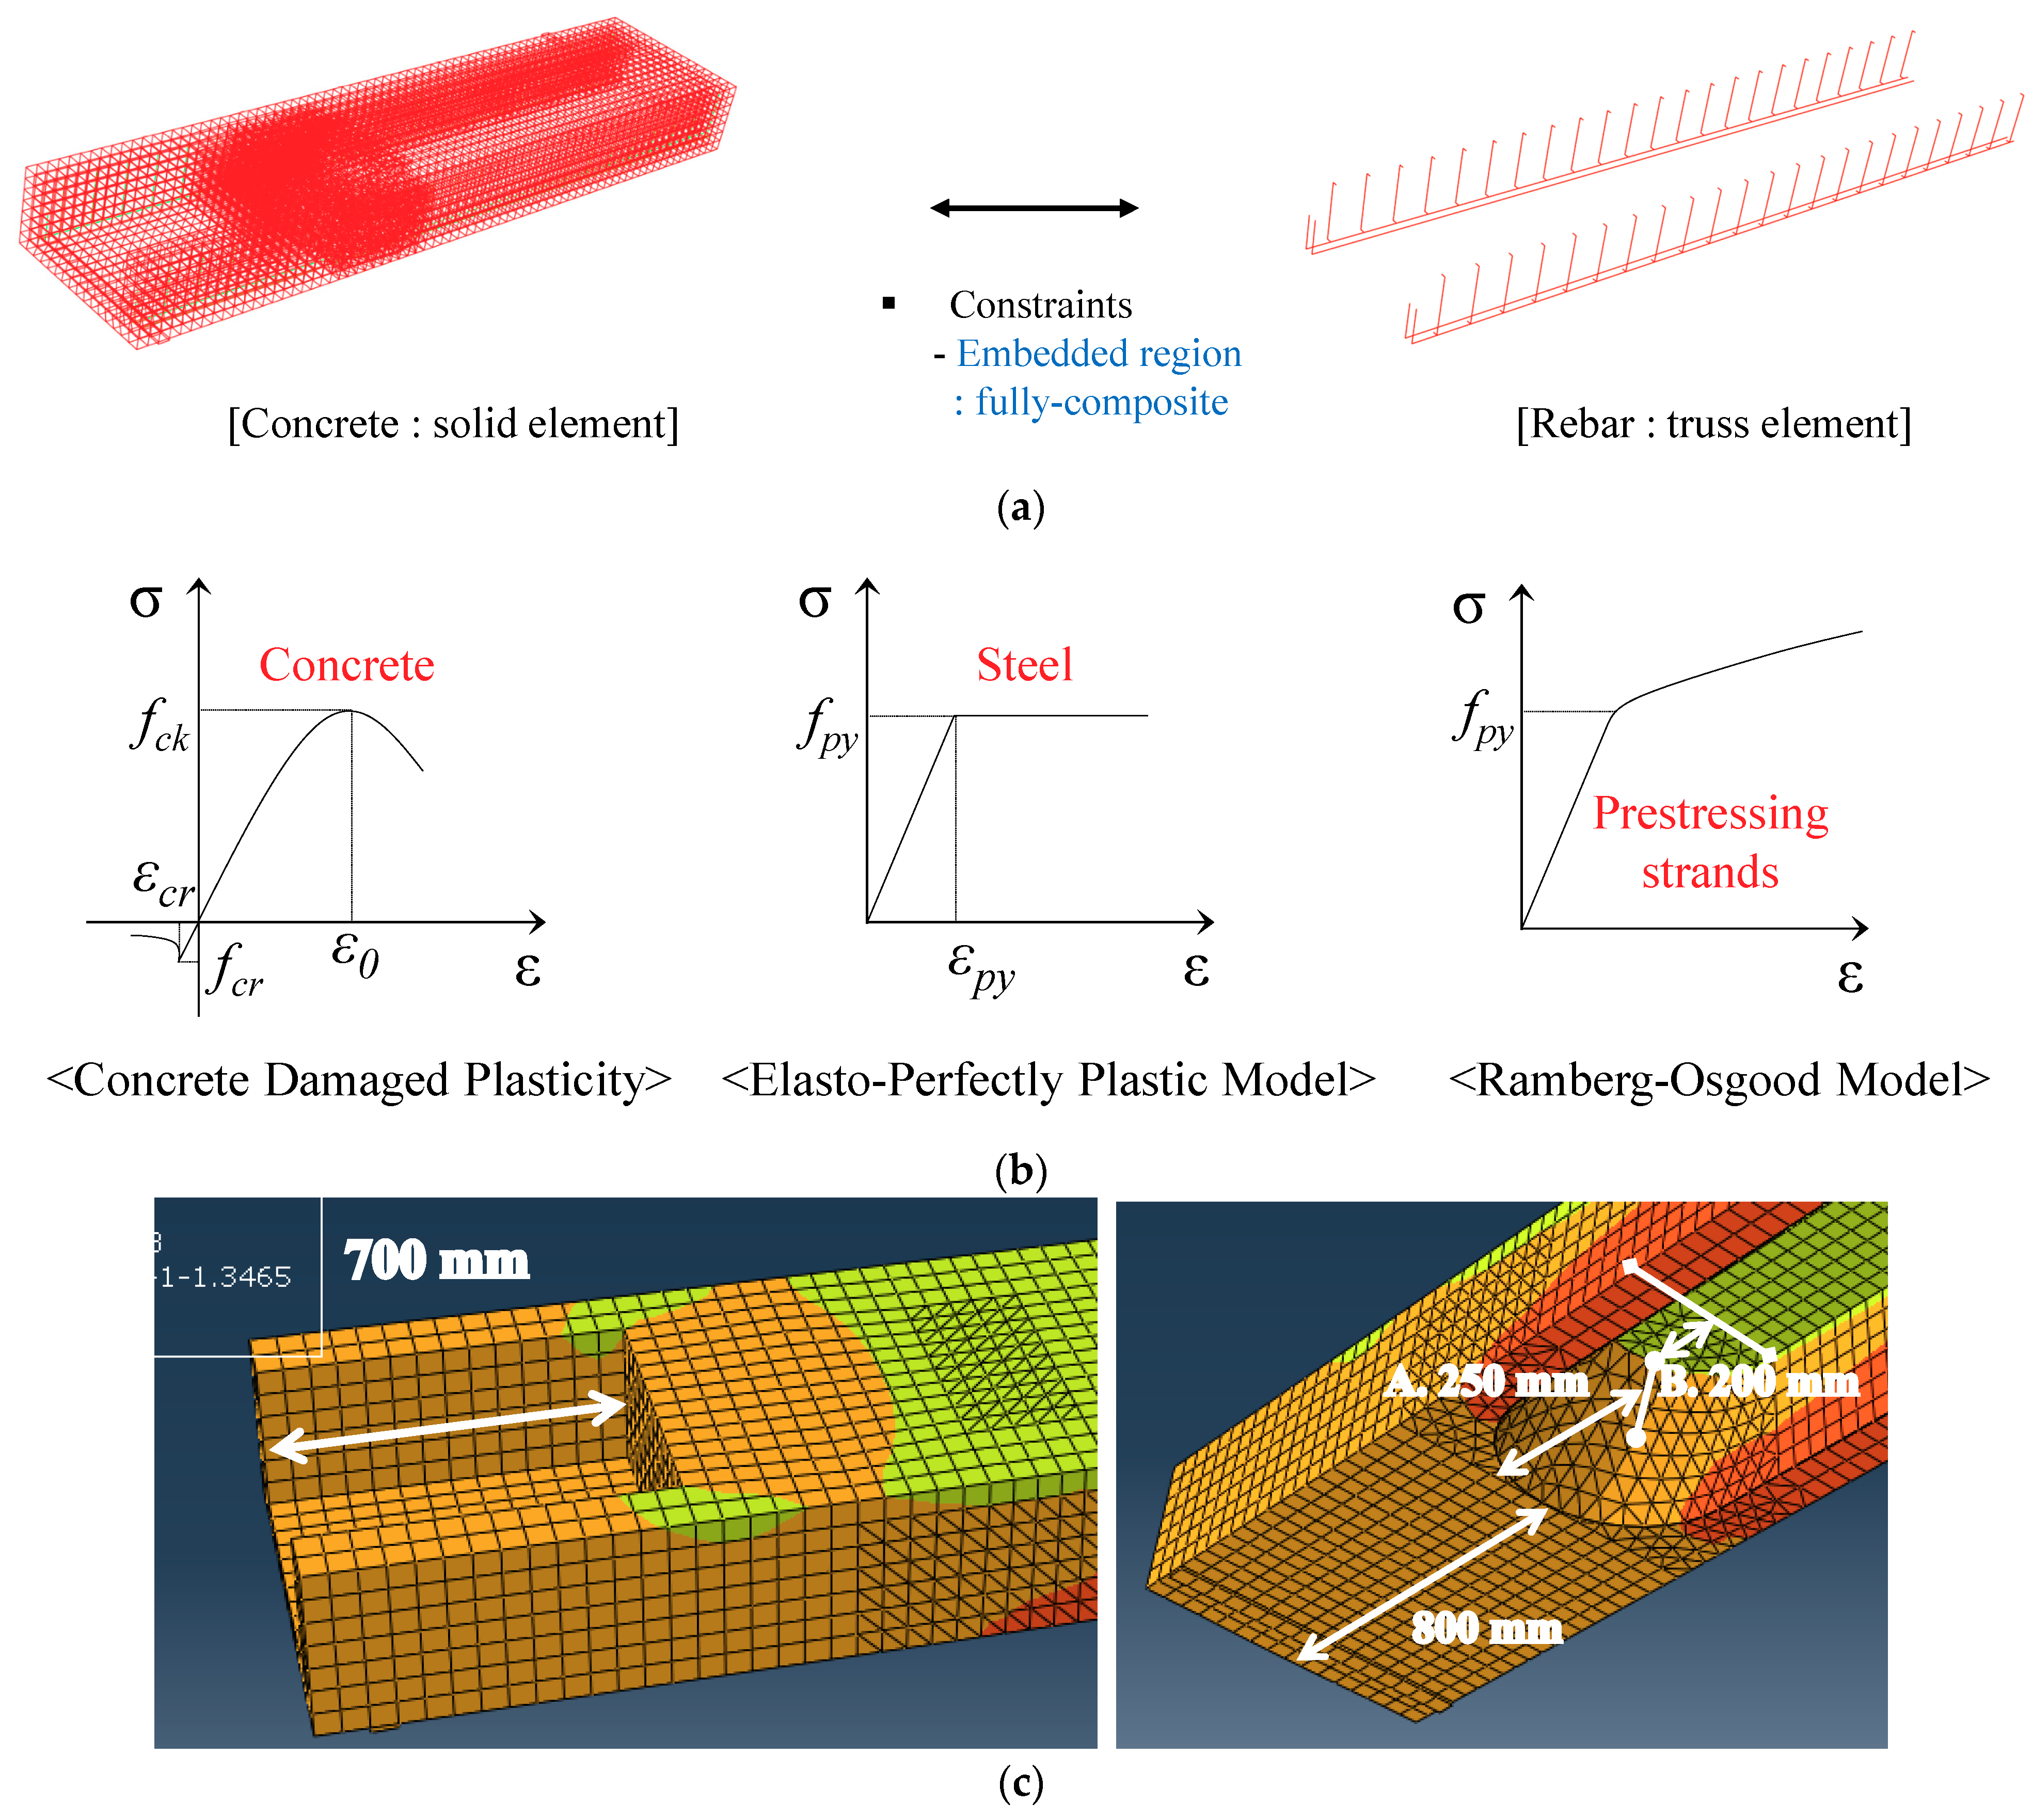
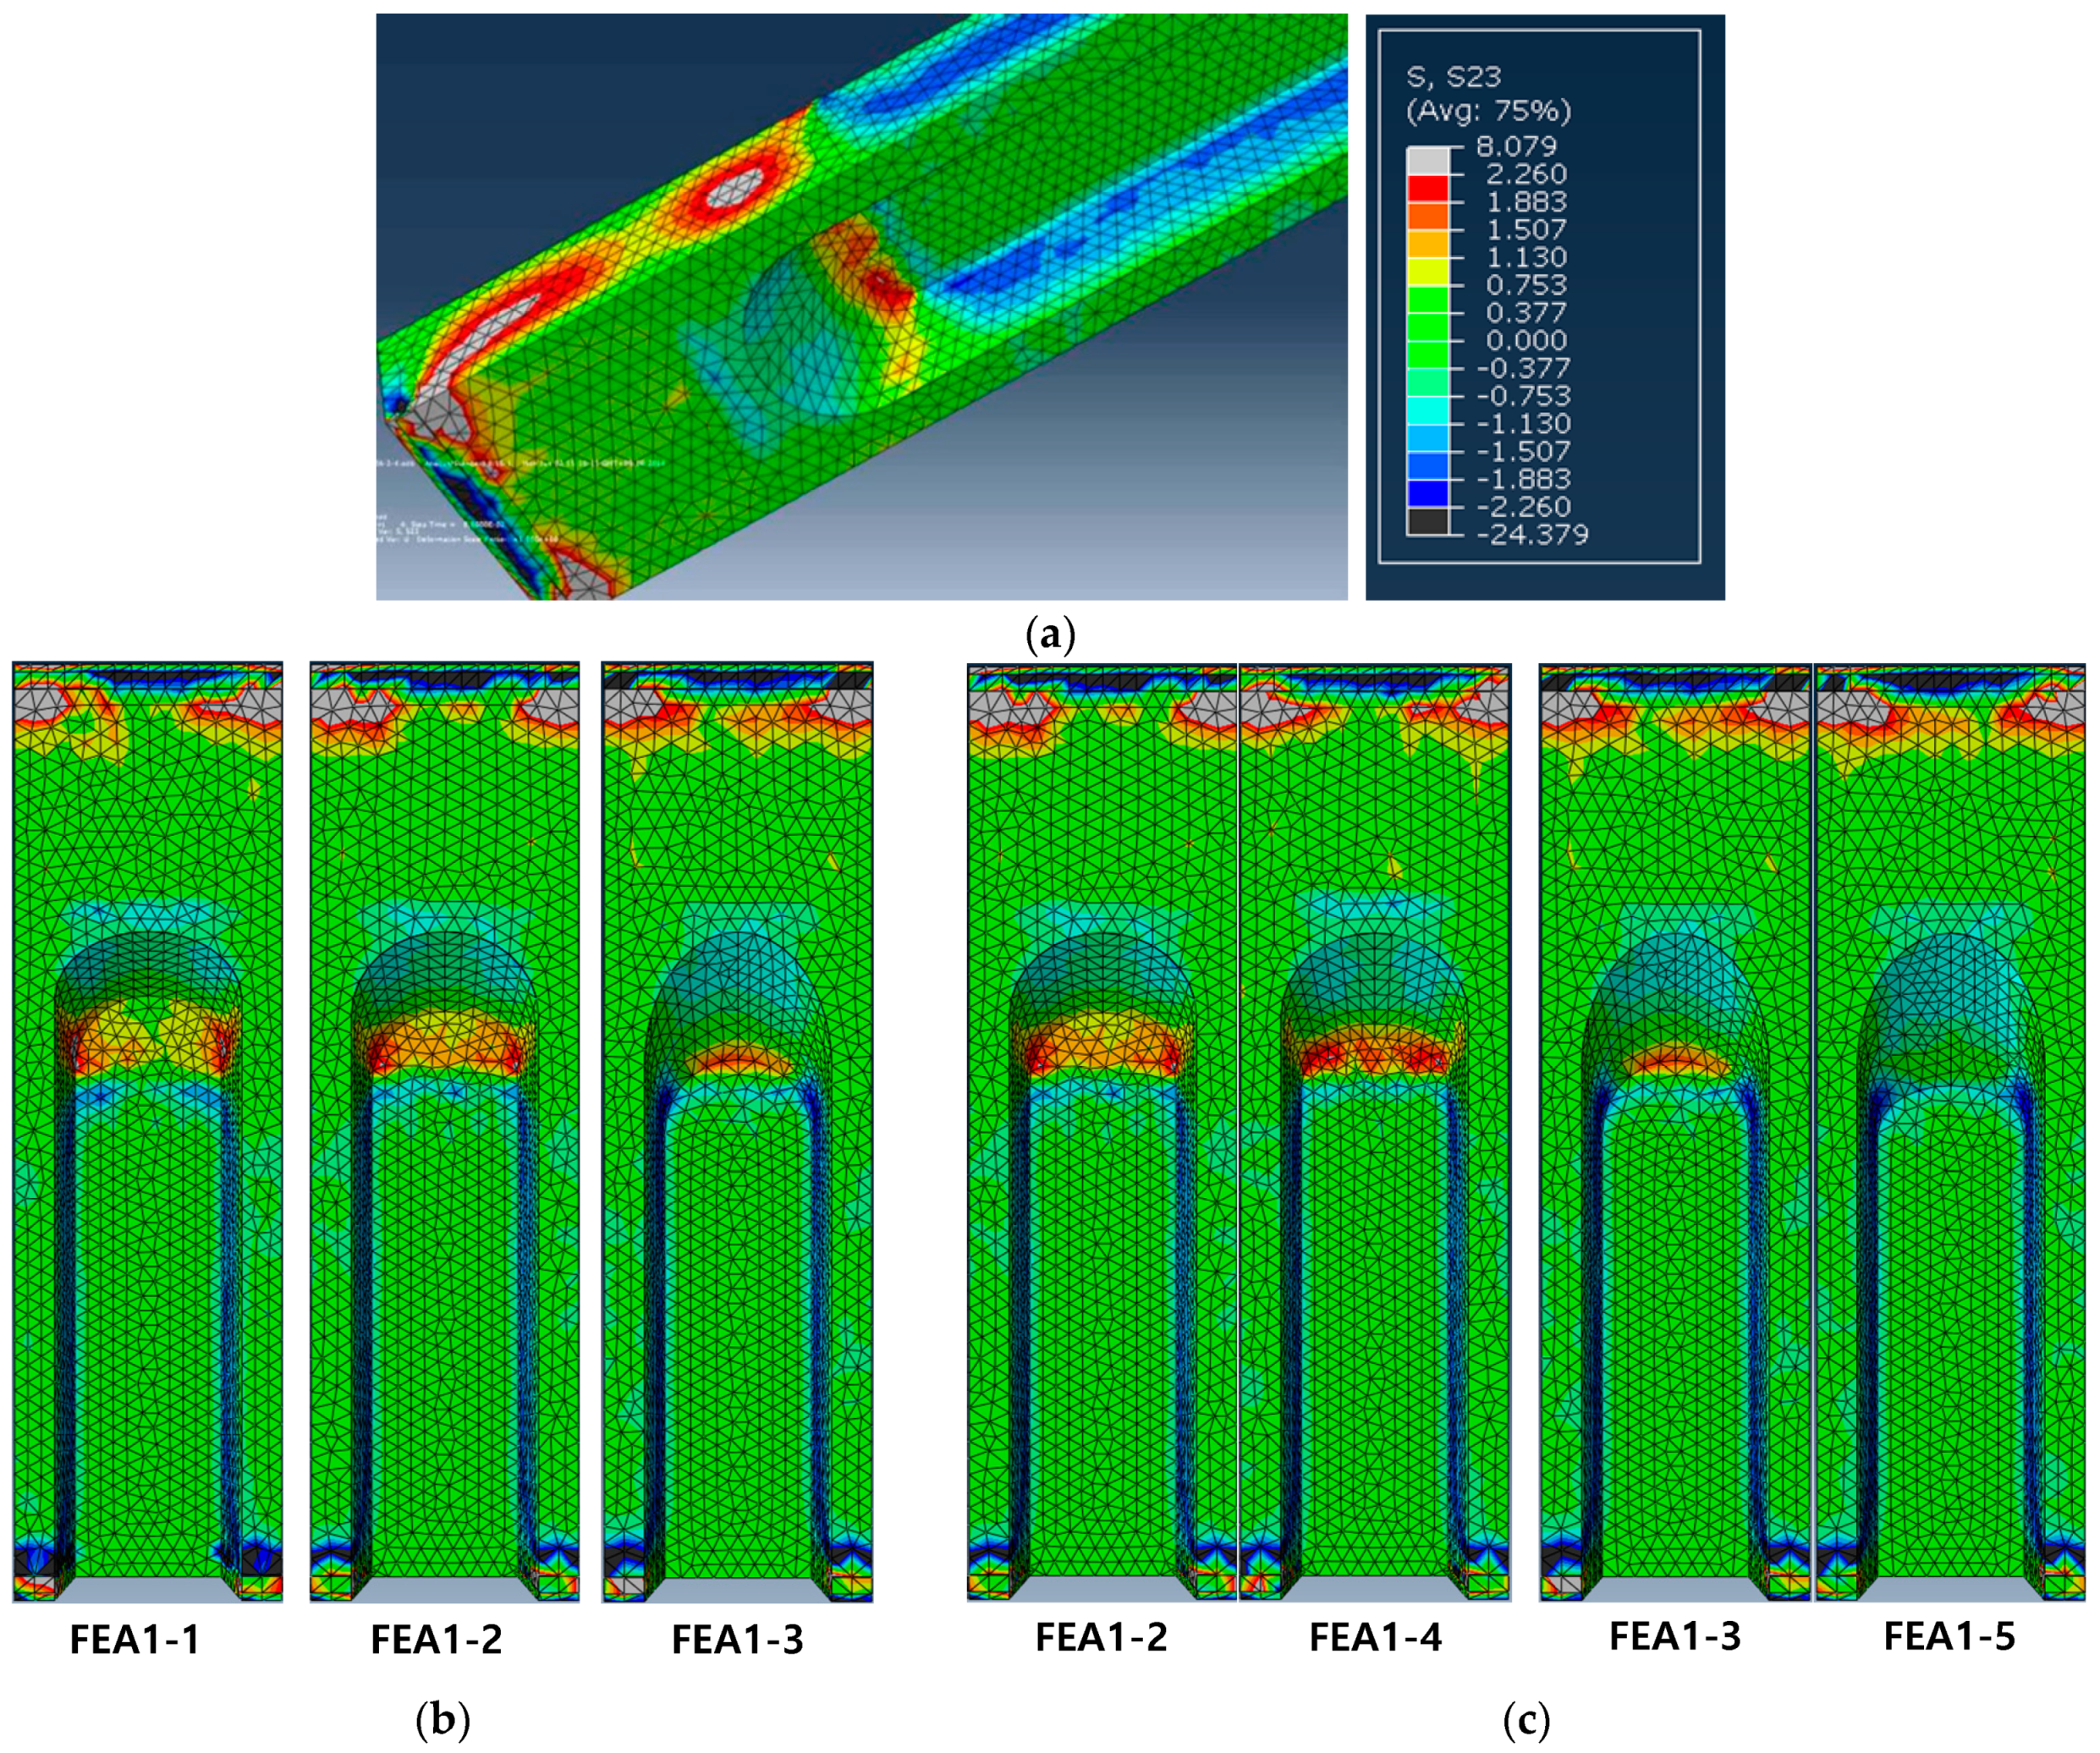
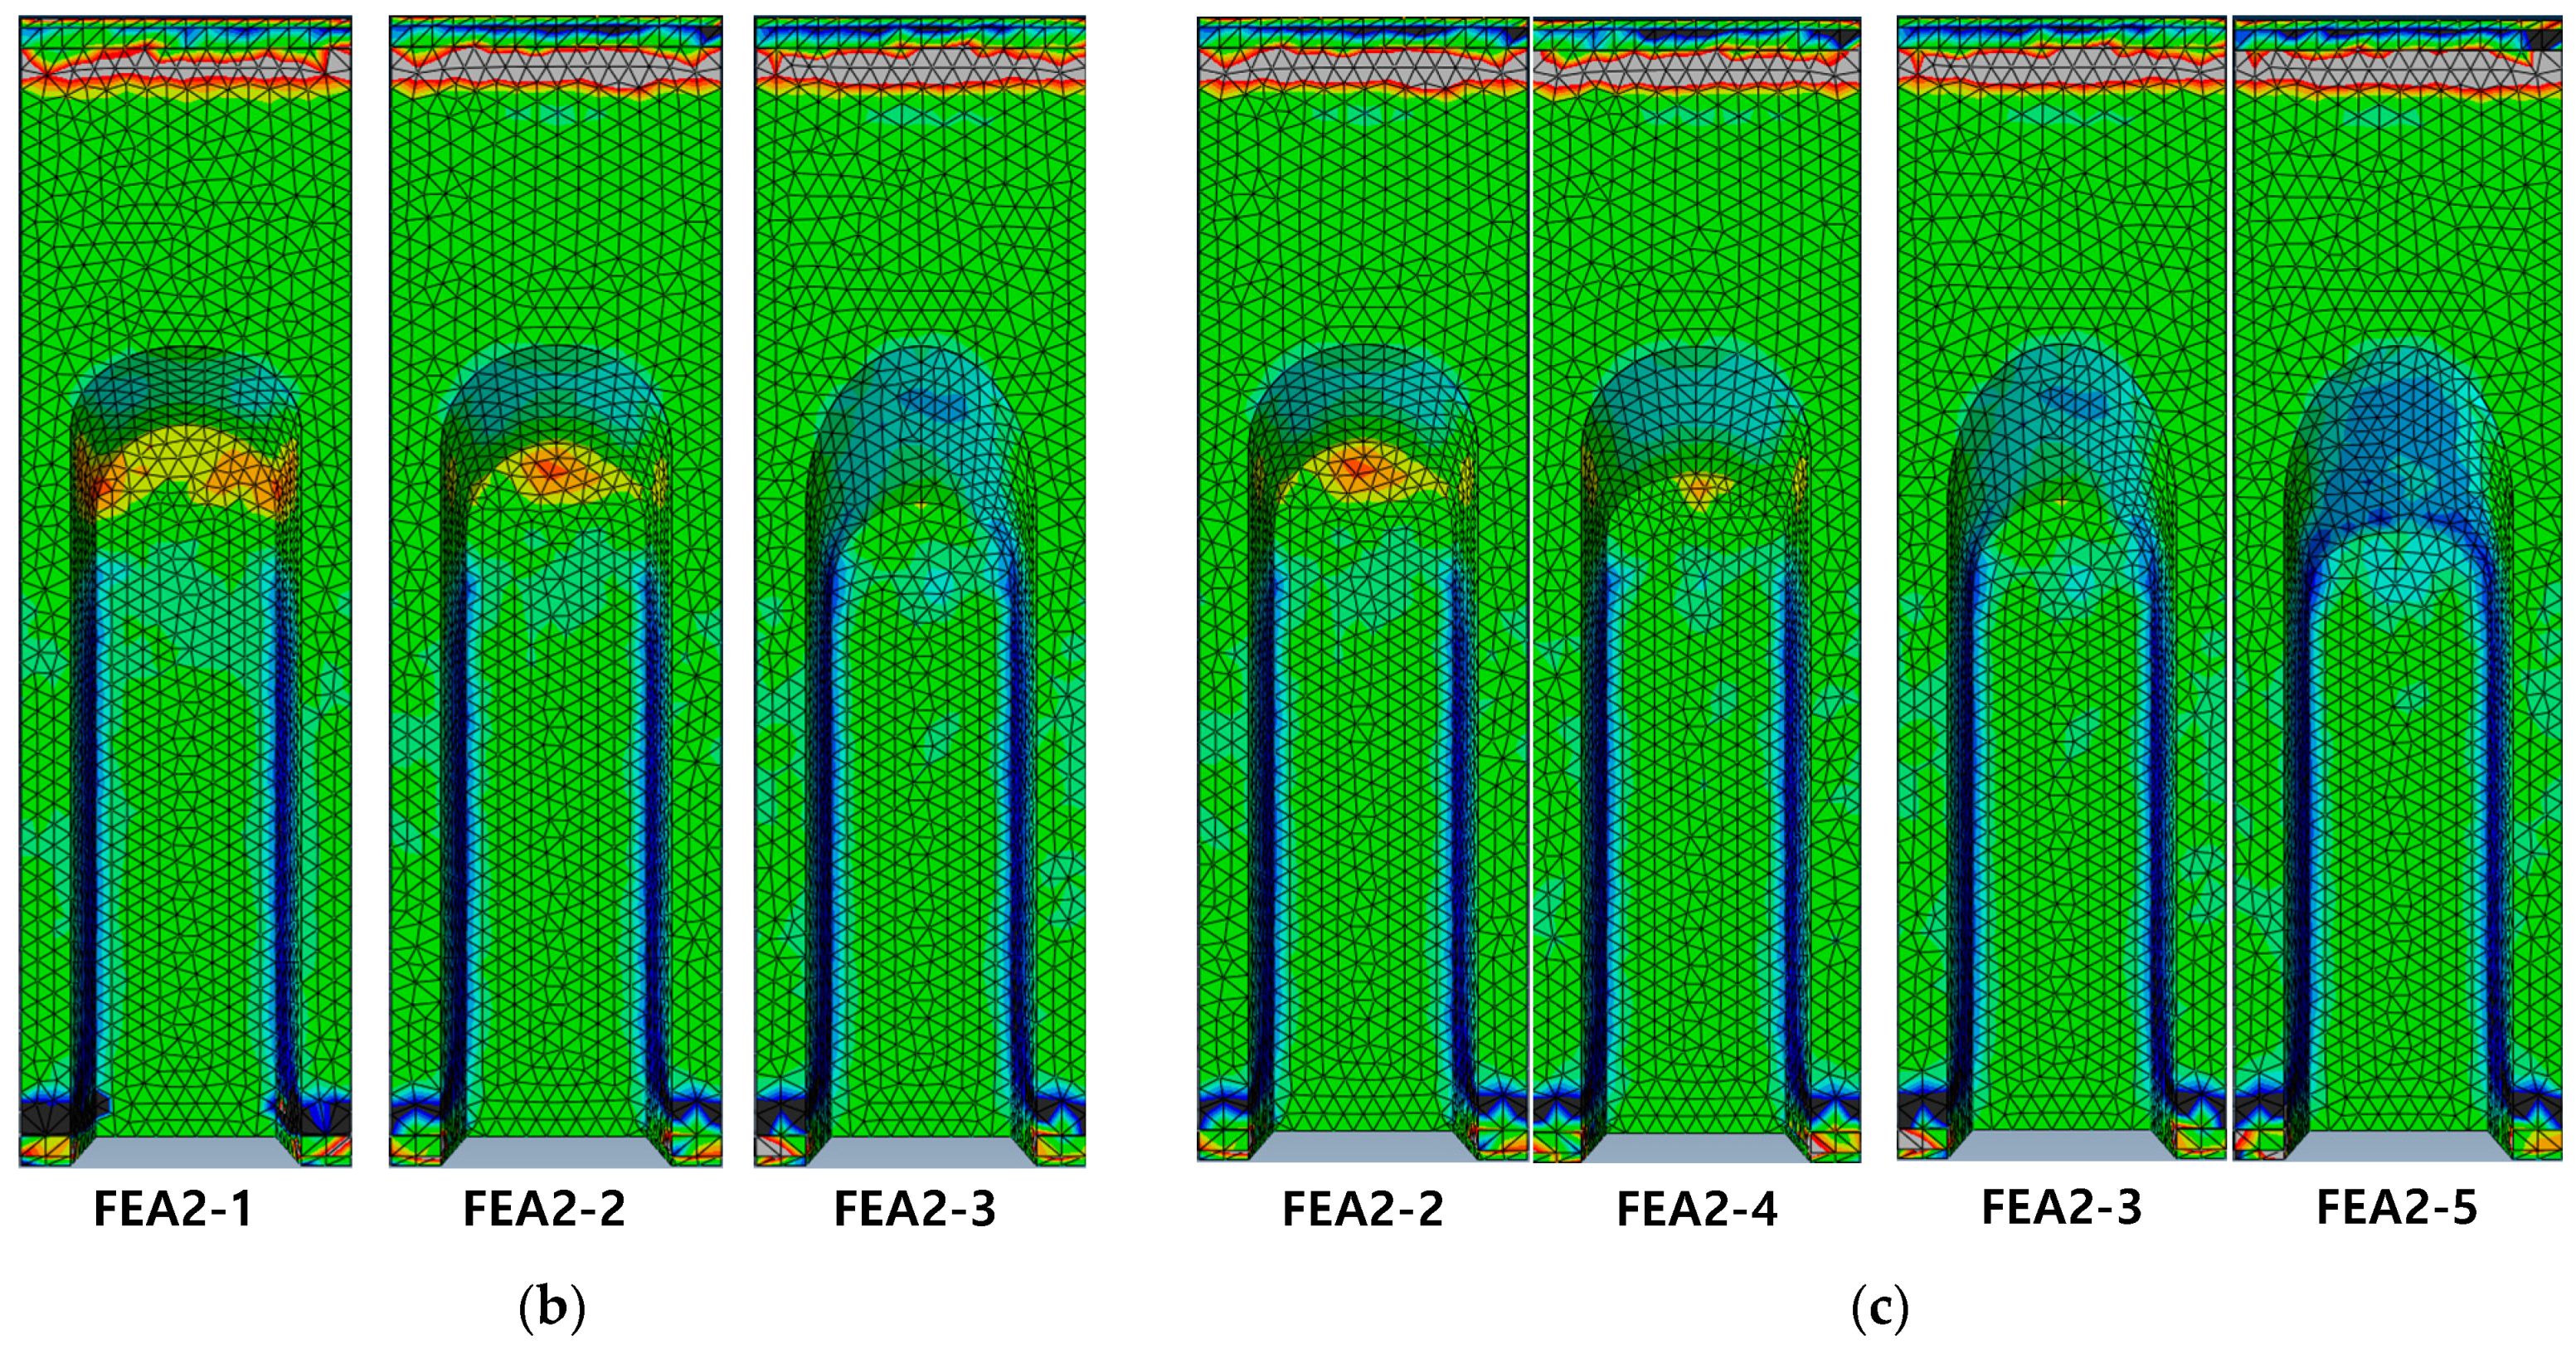
4.1. Finite-Element Analysis Considering the Inclination Angle of the Tapered Cross Section
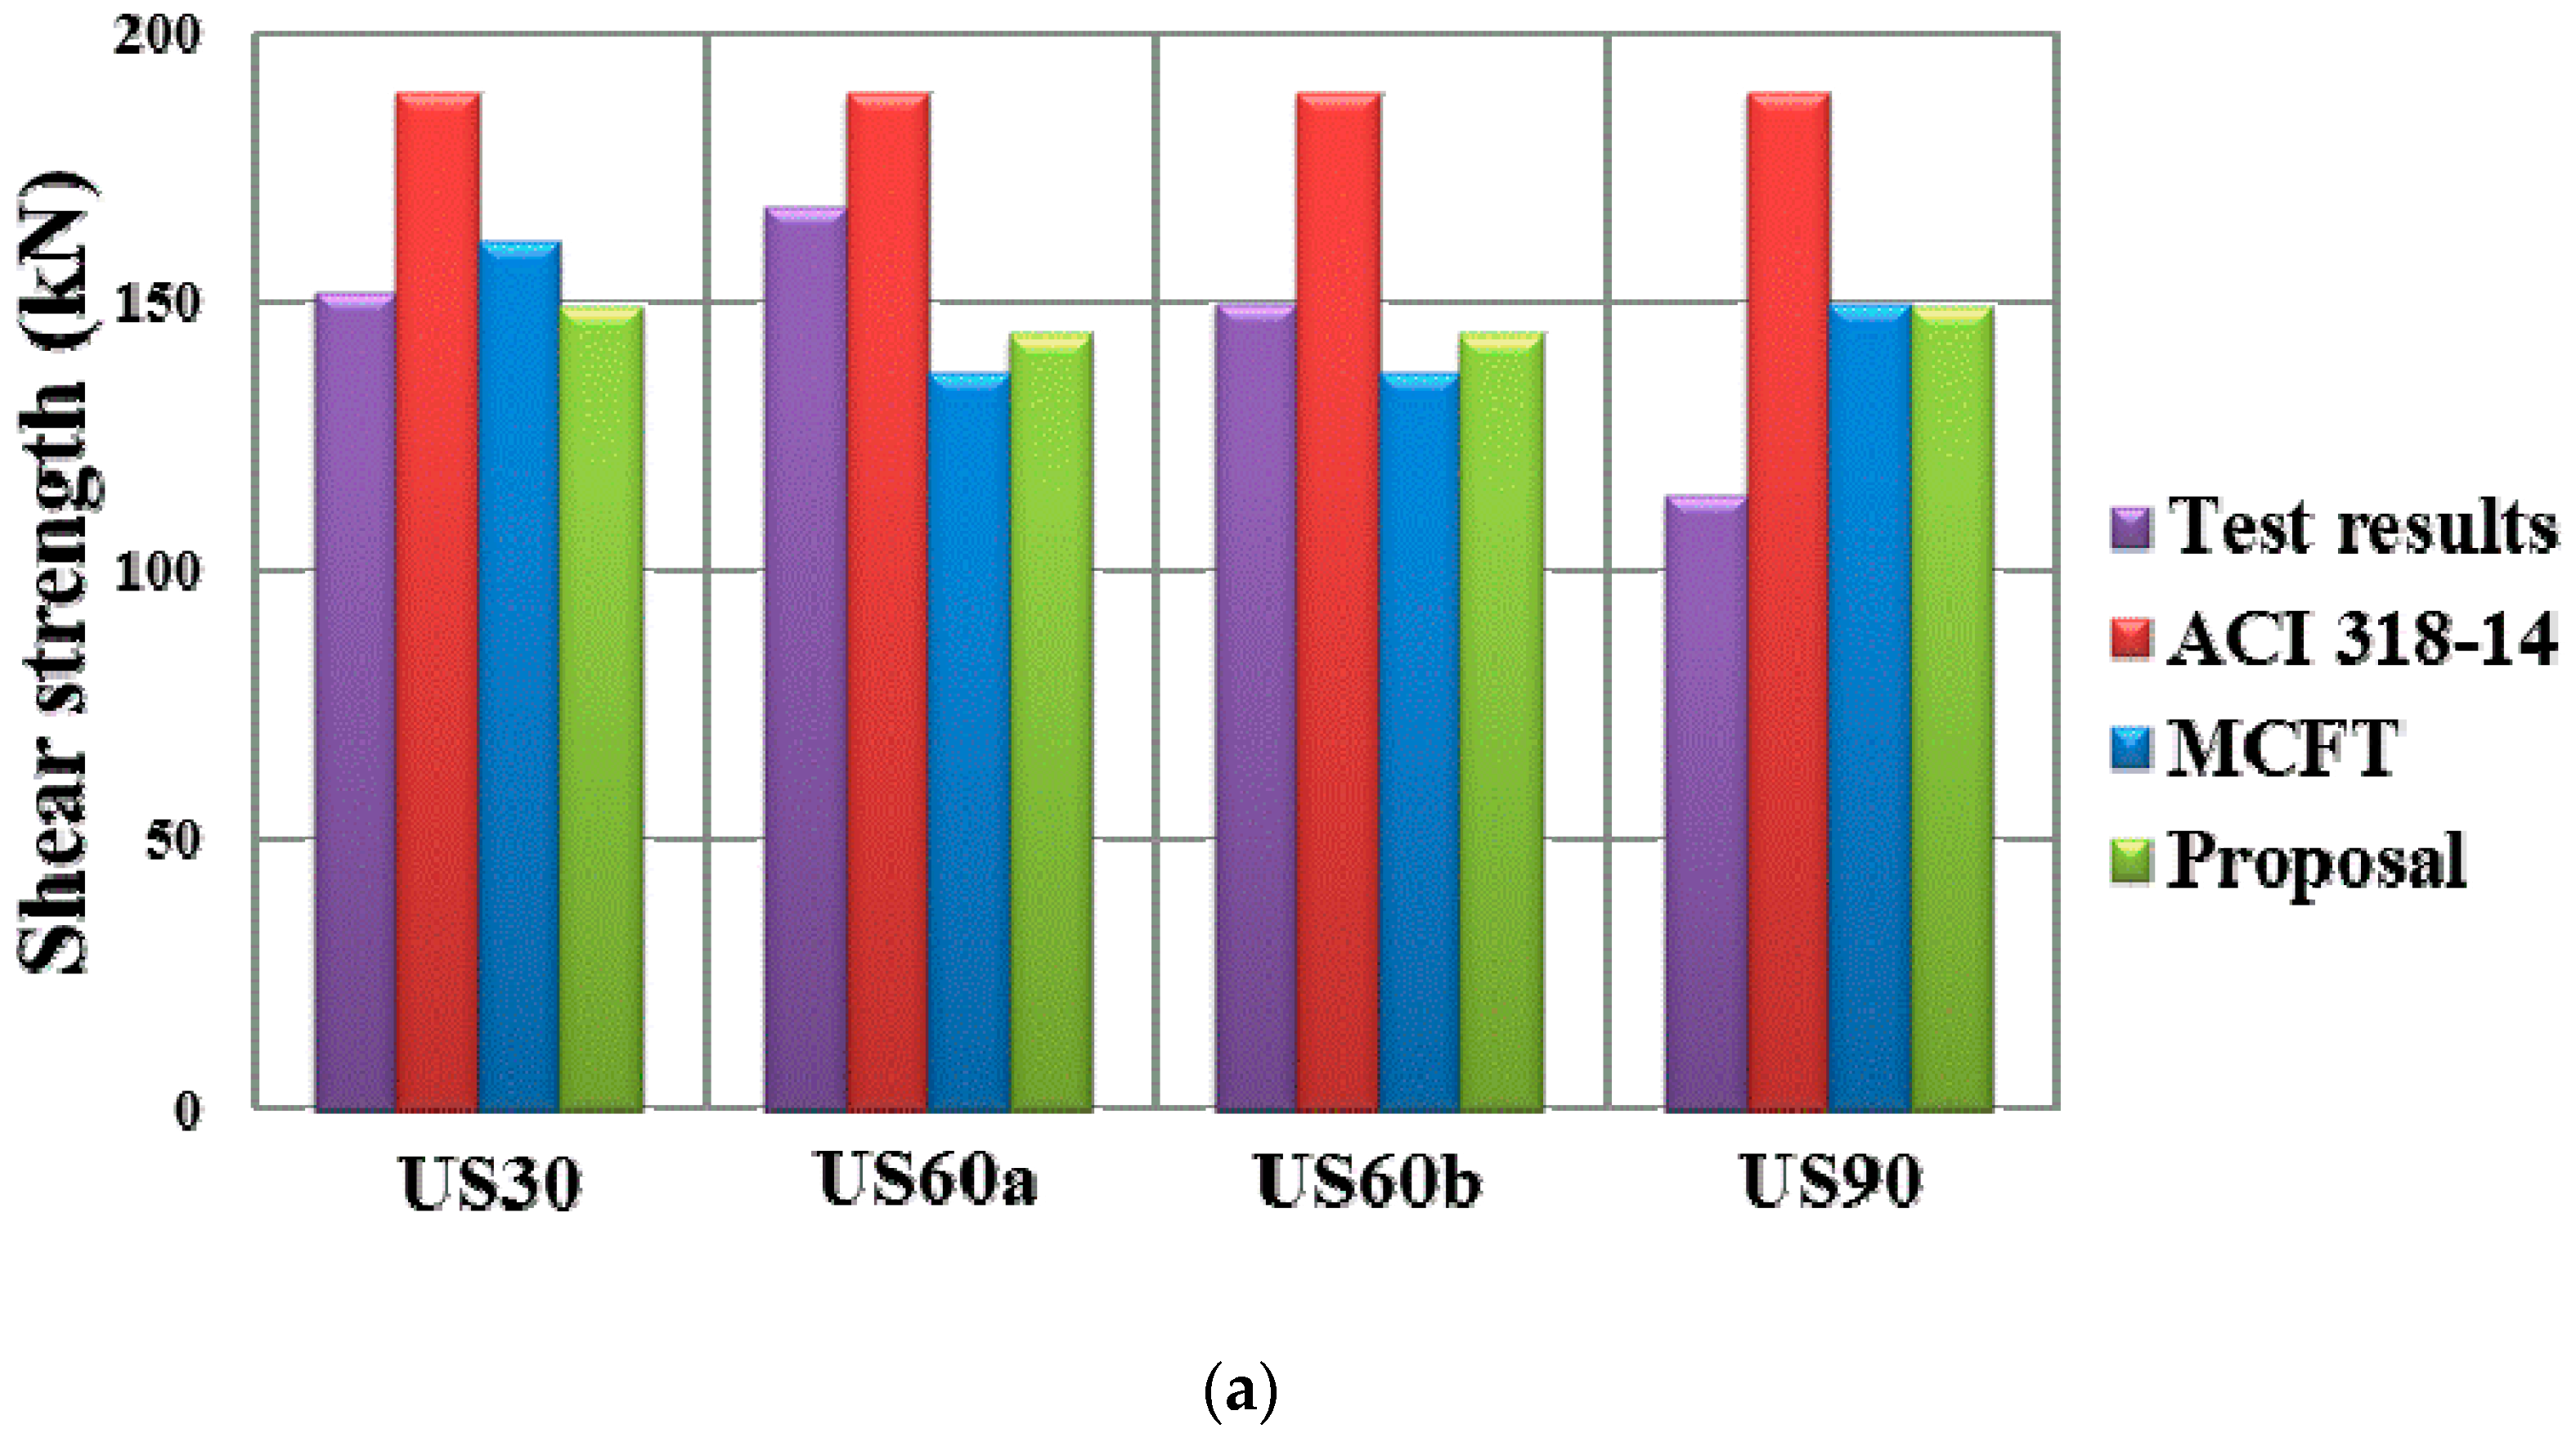
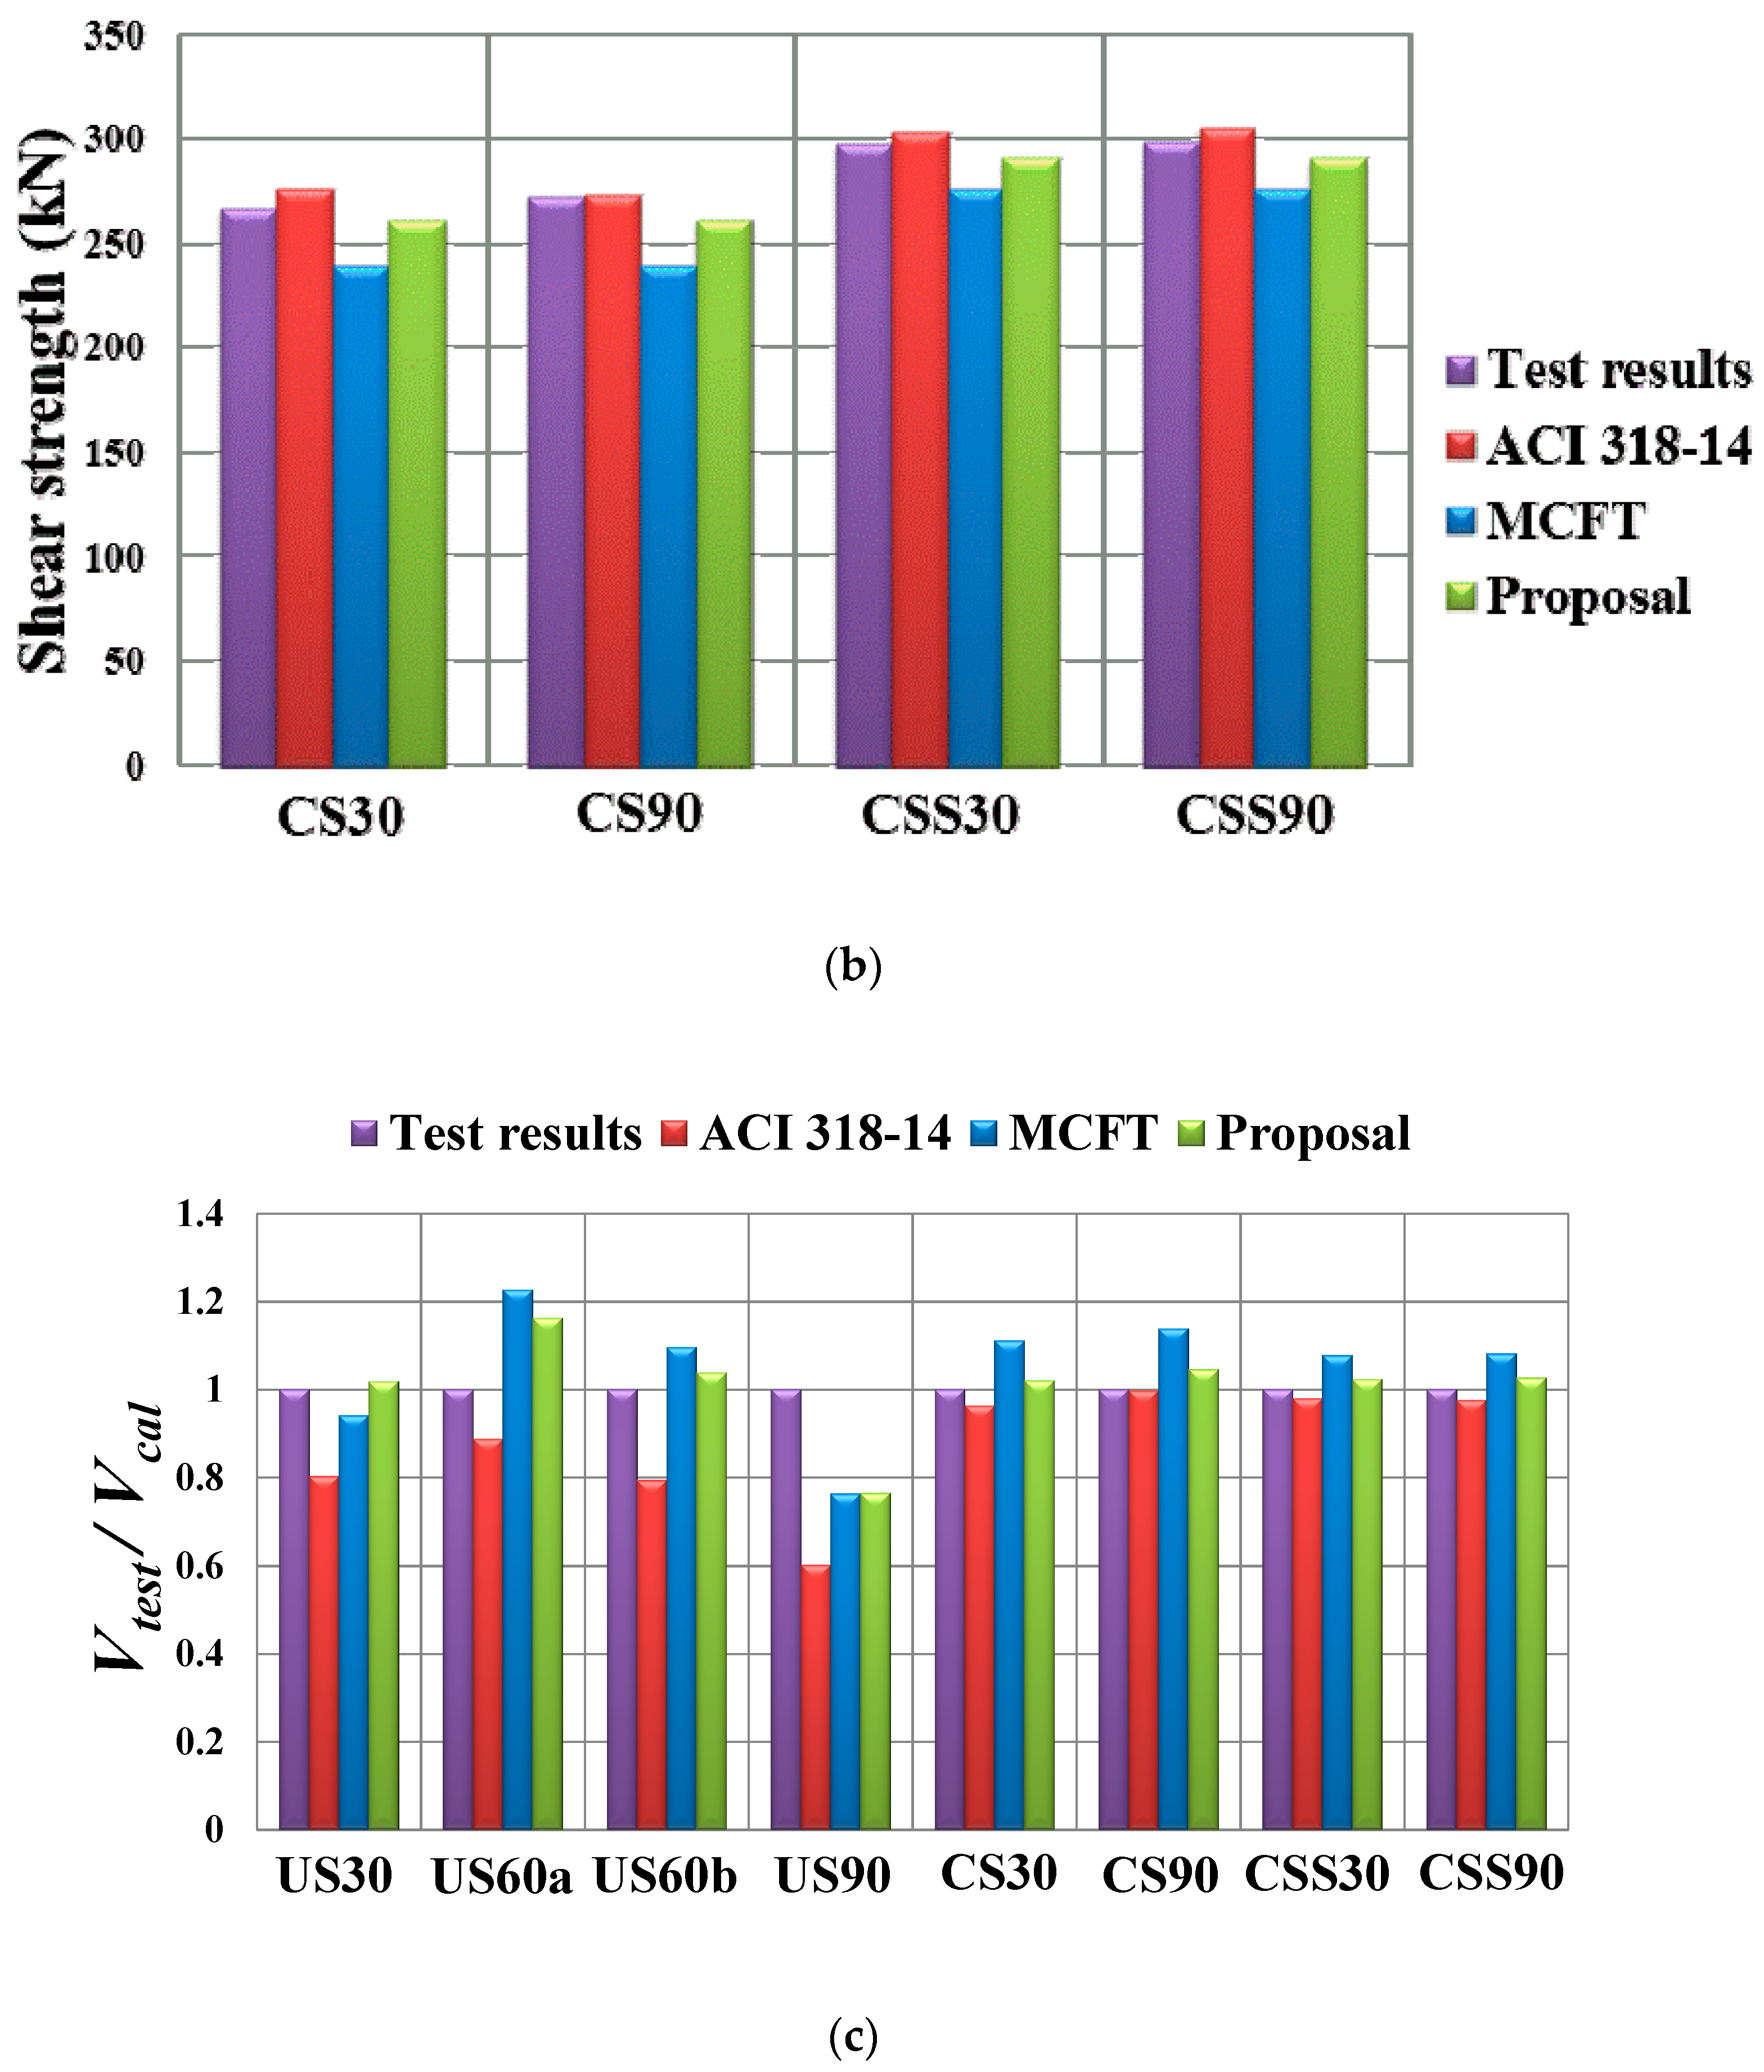
4.2. Suggestion for Estimating Shear Strength of OPS
5. Conclusions
- In the PC slab unit specimen where the inclination angle of the tapered cross section was 1.57 rad (90°), premature failure occurred because excessive stress was concentrated at the region of the tapered cross section. On the other hand, the inclination angle of the tapered cross section did not much influence the shear strength of the member in the composite slab specimen with topping concrete. This is because the composite slab specimens have a smaller change in sectional area near the tapered cross section due to the placement of topping concrete, as compared to the US specimens.
- The finite-element analysis results showed that as the inclination angle of the tapered cross section and the curvature of the curve at the tapered cross section in the lower surface of the top flange became smaller, the stress concentration decreased. The shear tests also found that the PC slab unit specimens with an inclination angle of less than 1.05 rad (60°) had very similar shear strengths. Therefore, it is desirable that the tapered cross section be configured to have an inclination angle of less than 1.05 rad (60°) in the design of the OPS.
- The shear reinforcement placed in the PC slab unit specimens did not yield even at the ultimate strength and thus the specimens showed lower strengths than those from the current code equations. Therefore, the shear contribution of shear reinforcement () should be excluded and only the contribution of concrete () should be considered in the shear design of the PC slab unit members. This estimation method not only revealed that the shear strengths of the specimens are on the safe side but also provided a very accurate evaluation of them.
- The shear crack angle observed in the composite slab specimens with topping concrete was about 0.96 rad (55°), which is steeper than those in typical reinforced concrete and prestressed concrete members. Therefore, it is expected that a proper safety can be ensured in the shear design of the composite OPS members when the crack angle () of 1.05 rad (60°) is used to calculate the contribution of shear reinforcement ().
Author Contributions
Acknowledgments
Conflicts of Interest
References
- Ju, H.; Han, S.J.; Choi, I.S.; Choi, S.; Park, M.K.; Kim, K.S. Experimental Study on an Optimized-Section Precast Slab with Structural Aesthetics. Appl. Sci. 2018, 8, 1234. [Google Scholar] [CrossRef]
- Korea Environmental Industry and Technology Institute. Korea LCI Database Information Network; Korea Environmental Industry and Technology Institute: Seoul, Korea, 2013. [Google Scholar]
- Choi, I.S. Structural Performance of Precast Slab with Esthetics and Optimized Section for Positive and Negative Moment. Ph.D. Thesis, Inha University, Incheon, Korea, 2016. [Google Scholar]
- Elliot, K.S.; Colin, K.J. Multi-Storey Precast Concrete Framed Structures, 2nd ed.; Wiley Blackwell: Hoboken, NJ, USA, 2013. [Google Scholar]
- Mejia-McMaster, J.C.; Park, R. Test on special reinforcement for the end support of hollow-core slabs. PCI J. 1994, 39, 90–105. [Google Scholar] [CrossRef]
- Gere, J.M.; Goodno, B.J. Mechanics of Materials, 8th ed.; Cenage Learning: Boston, MA, USA, 2012. [Google Scholar]
- Rosenthal, I. Full scale test of continuous prestressed hollow-core slab. PCI J. 1978, 23, 74–81. [Google Scholar] [CrossRef]
- Tan, K.H.; Zheng, L.X.; Paramasivam, P. Designing hollow-core slabs for continuity. PCI J. 1996, 41, 82–91. [Google Scholar] [CrossRef]
- Yang, L. Design of Prestressed Hollow-Core Slabs with Reference to Web-Shear Failure. J. Struct. Eng. 1994, 120, 2675–2696. [Google Scholar] [CrossRef]
- Lee, D.H.; Park, M.K.; Oh, J.Y.; Kim, K.S.; Im, J.H.; Seo, S.Y. Web-shear Capacity of Prestressed Hollow-Core Slab Unit with Consideration on the Minimum Shear Reinforcement Requirement. Comput. Concr. 2014, 14, 211–231. [Google Scholar] [CrossRef]
- ACI Committee 318. Building Code Requirements for Reinforced Concrete and Commentary (ACI 318-14); American Concrete Institute: Farmington Hills, MI, USA, 2014. [Google Scholar]
- Hibbitt, H.; Karlsson, B.; Sorensen, P. ABAQUS Analysis Users Manual; Version 6.10; Dassault Systemes Simulia: Providence, RI, USA, 2011. [Google Scholar]
- Smith, I.M.; Griffiths, D.V. Programming the Finite Element Analysis, 4th ed.; John Wiley and Sons, Ltd.: Hoboken, NJ, USA, 2004. [Google Scholar]
- Collins, M.P.; Mitchell, D. Prestressed Concrete Structures; Prentice-Hall: Upper Saddle River, NJ, USA, 1991. [Google Scholar]
- MacGregor, J.G.; Wight, J.K. Reinforced Concrete Mechanics and Design, 4th ed.; Prentice-Hall: Upper Saddle River, NJ, USA, 2006. [Google Scholar]
- Mattock, A.H. Flexural strength of prestressed concrete sections by programmable calculator. PCI J. 1979, 24, 32–54. [Google Scholar] [CrossRef]
- Lee, D.H.; Oh, J.Y.; Kang, H.; Kim, K.S.; Kim, H.J.; Kim, H.Y. Structural Performance of Prestressed Composite Girders with Corrugated Steel Plate Webs. J. Constr. Steel Res. 2015, 104, 9–21. [Google Scholar] [CrossRef]
- Oh, J.Y.; Lee, D.H.; Cho, S.H.; Kang, H.; Cho, H.C.; Kim, K.S. Flexural Behavior of Prestressed Steel-Concrete Composite Members with Discontinuous Webs. Adv. Mater. Sci. Eng. 2015, 2015, 278293. [Google Scholar] [CrossRef]
- Vecchio, F.J.; Collins, M.P. Modified Compression-Field Theory for Reinforced Concrete Elements Subjected to Shear. ACI J. Proc. 1986, 83, 219–231. [Google Scholar] [CrossRef]
- Vecchio, F.J.; Collins, M.P. Predicting the Response of Reinforced Concrete Beams Subjected to Shear Using Modified Compression Field Theory. ACI Struct. J. 1988, 85, 258–268. [Google Scholar] [CrossRef]
- Bentz, E.C.; Vecchio, F.J.; Collins, M.P. Simplified Modified Compression Field Theory for Calculating Shear Strength of Reinforced Concrete Elements. ACI Struct. J. 2006, 103, 614–624. [Google Scholar] [CrossRef]
- Bentz, E.C. Sectional Analysis of Reinforced Concrete Members. Ph.D. Thesis, University of Toronto, Toronto, ON, Canada, 2000. [Google Scholar]


| Specimen | Compressive Strength of Concrete, | Compressive Reinforcement Sectional Area, | Tensile Reinforcement (Sectional Area, | Shear Reinforcement | Angle of Inclined Section (rad) | |||
|---|---|---|---|---|---|---|---|---|
| PC | Topping | Rebar | Tendon | Rebar | Tendon | |||
| US30 | 55.0 | - | - | (110) | (794) | (280) | 0.524 () | |
| US60a | 46.9 | - | (110) | (794) | (280) | 1.047 () | ||
| US60b | 46.9 | - | (110) | (794) | (280) | 1.047 () | ||
| US90 | 55.0 | - | - | (110) | (794) | (280) | 1.571 () | |
| CS30 | 55.0 | 49.0 | (143) | (110) | (970) | (280) | 0.524 () | |
| CS90 | 55.0 | 49.0 | (143) | (110) | (970) | (280) | 1.571 () | |
| CSS30 | 55.0 | 49.0 | (143) | (110) | (970) | (280) | 0.524 () | |
| CSS90 | 55.0 | 49.0 | (143) | (110) | (970) | (280) | 1.571 () | |
| PC Slab Unit Case | A * (mm) | B * (mm) | Angle of Inclined Section (rad) | Composite Slab Case | A * (mm) | B * (mm) | Angle of Inclined Section (degree, °) |
|---|---|---|---|---|---|---|---|
| FEA1-1 | 200 | 200 | 0.983 (56.3°) | FEA2-1 | 200 | 200 | 0.983 (56.3°) |
| FEA1-2 | 250 | 200 | 0.876 (50.2°) | FEA2-2 | 250 | 200 | 0.876 (50.2°) |
| FEA1-3 | 400 | 200 | 0.644 (36.9°) | FEA2-3 | 400 | 200 | 0.644 (36.9°) |
| FEA1-4 | 250 | 150 | 0.876 (50.2°) | FEA2-4 | 250 | 150 | 0.876 (50.2°) |
| FEA1-5 | 400 | 150 | 0.644 (36.9°) | FEA2-5 | 400 | 150 | 0.644 (36.9°) |
| Type | Code Equation * |
|---|---|
| Web shear strength of concrete | |
| Shear contribution of transverse reinforcement |
| Specimen | Critical Crack Angle (degree) | Compressive Strength of Concrete (MPa) | Spacing of Shear Reinforcement (mm) | ||||
|---|---|---|---|---|---|---|---|
| ACI 318 | MCFT | Proposal | |||||
| US30 | 32.0 | 55.0 | 400 | 151.8 | 189.1 | 161.3 | 149.0 |
| US60a | 90.0 | 46.9 | 400 | 167.5 | 188.7 | 136.5 | 144.1 |
| US60b | 60.3 | 46.9 | 400 | 149.7 | 188.7 | 136.5 | 144.1 |
| US90 | 36.9 | 55.0 | 400 | 113.9 | 189.1 | 149.3 | 149.0 |
| CS30 | 54.5 | 49.0 | 400 | 266.2 | 276.2 | 239.5 | 260.8 |
| CS90 | 56.3 | 49.0 | 400 | 272.7 | 273.2 | 239.5 | 260.8 |
| CSS30 | 57.5 | 49.0 | 300 | 297.1 | 303.2 | 275.7 | 290.4 |
| CSS90 | 56.3 | 49.0 | 300 | 298.1 | 305.4 | 275.7 | 290.4 |
© 2018 by the authors. Licensee MDPI, Basel, Switzerland. This article is an open access article distributed under the terms and conditions of the Creative Commons Attribution (CC BY) license (http://creativecommons.org/licenses/by/4.0/).
Share and Cite
Ju, H.; Han, S.-J.; Joo, H.-E.; Cho, H.-C.; Kim, K.S.; Oh, Y.-H. Shear Performance of Optimized-Section Precast Slab with Tapered Cross Section. Sustainability 2019, 11, 163. https://doi.org/10.3390/su11010163
Ju H, Han S-J, Joo H-E, Cho H-C, Kim KS, Oh Y-H. Shear Performance of Optimized-Section Precast Slab with Tapered Cross Section. Sustainability. 2019; 11(1):163. https://doi.org/10.3390/su11010163
Chicago/Turabian StyleJu, Hyunjin, Sun-Jin Han, Hyo-Eun Joo, Hae-Chang Cho, Kang Su Kim, and Young-Hun Oh. 2019. "Shear Performance of Optimized-Section Precast Slab with Tapered Cross Section" Sustainability 11, no. 1: 163. https://doi.org/10.3390/su11010163
APA StyleJu, H., Han, S.-J., Joo, H.-E., Cho, H.-C., Kim, K. S., & Oh, Y.-H. (2019). Shear Performance of Optimized-Section Precast Slab with Tapered Cross Section. Sustainability, 11(1), 163. https://doi.org/10.3390/su11010163