Pastures and Cash Crops: Biomass Flows in the Socio-Metabolic Transition of Twentieth-Century Colombian Agriculture


Abstract
1. Introduction
2. Materials and Methods
2.1. Methodological Approach
- The MFA approach focuses on extraction, not in production, so it is no possible to assess the actual impact of extraction.
- MFA does not provide a homogenized system to measure the biomass flows. Only in the case of pastures, the methodology suggests quantifying the flows in dry matter while the rest of biomass flows are accounted in fresh matter [59].
- Lastly, the MFA approach does not consider the biomass flows that recirculate nor the final uses of all the extracted biomass.
2.2. Sources
2.3. Data Processing
3. Results
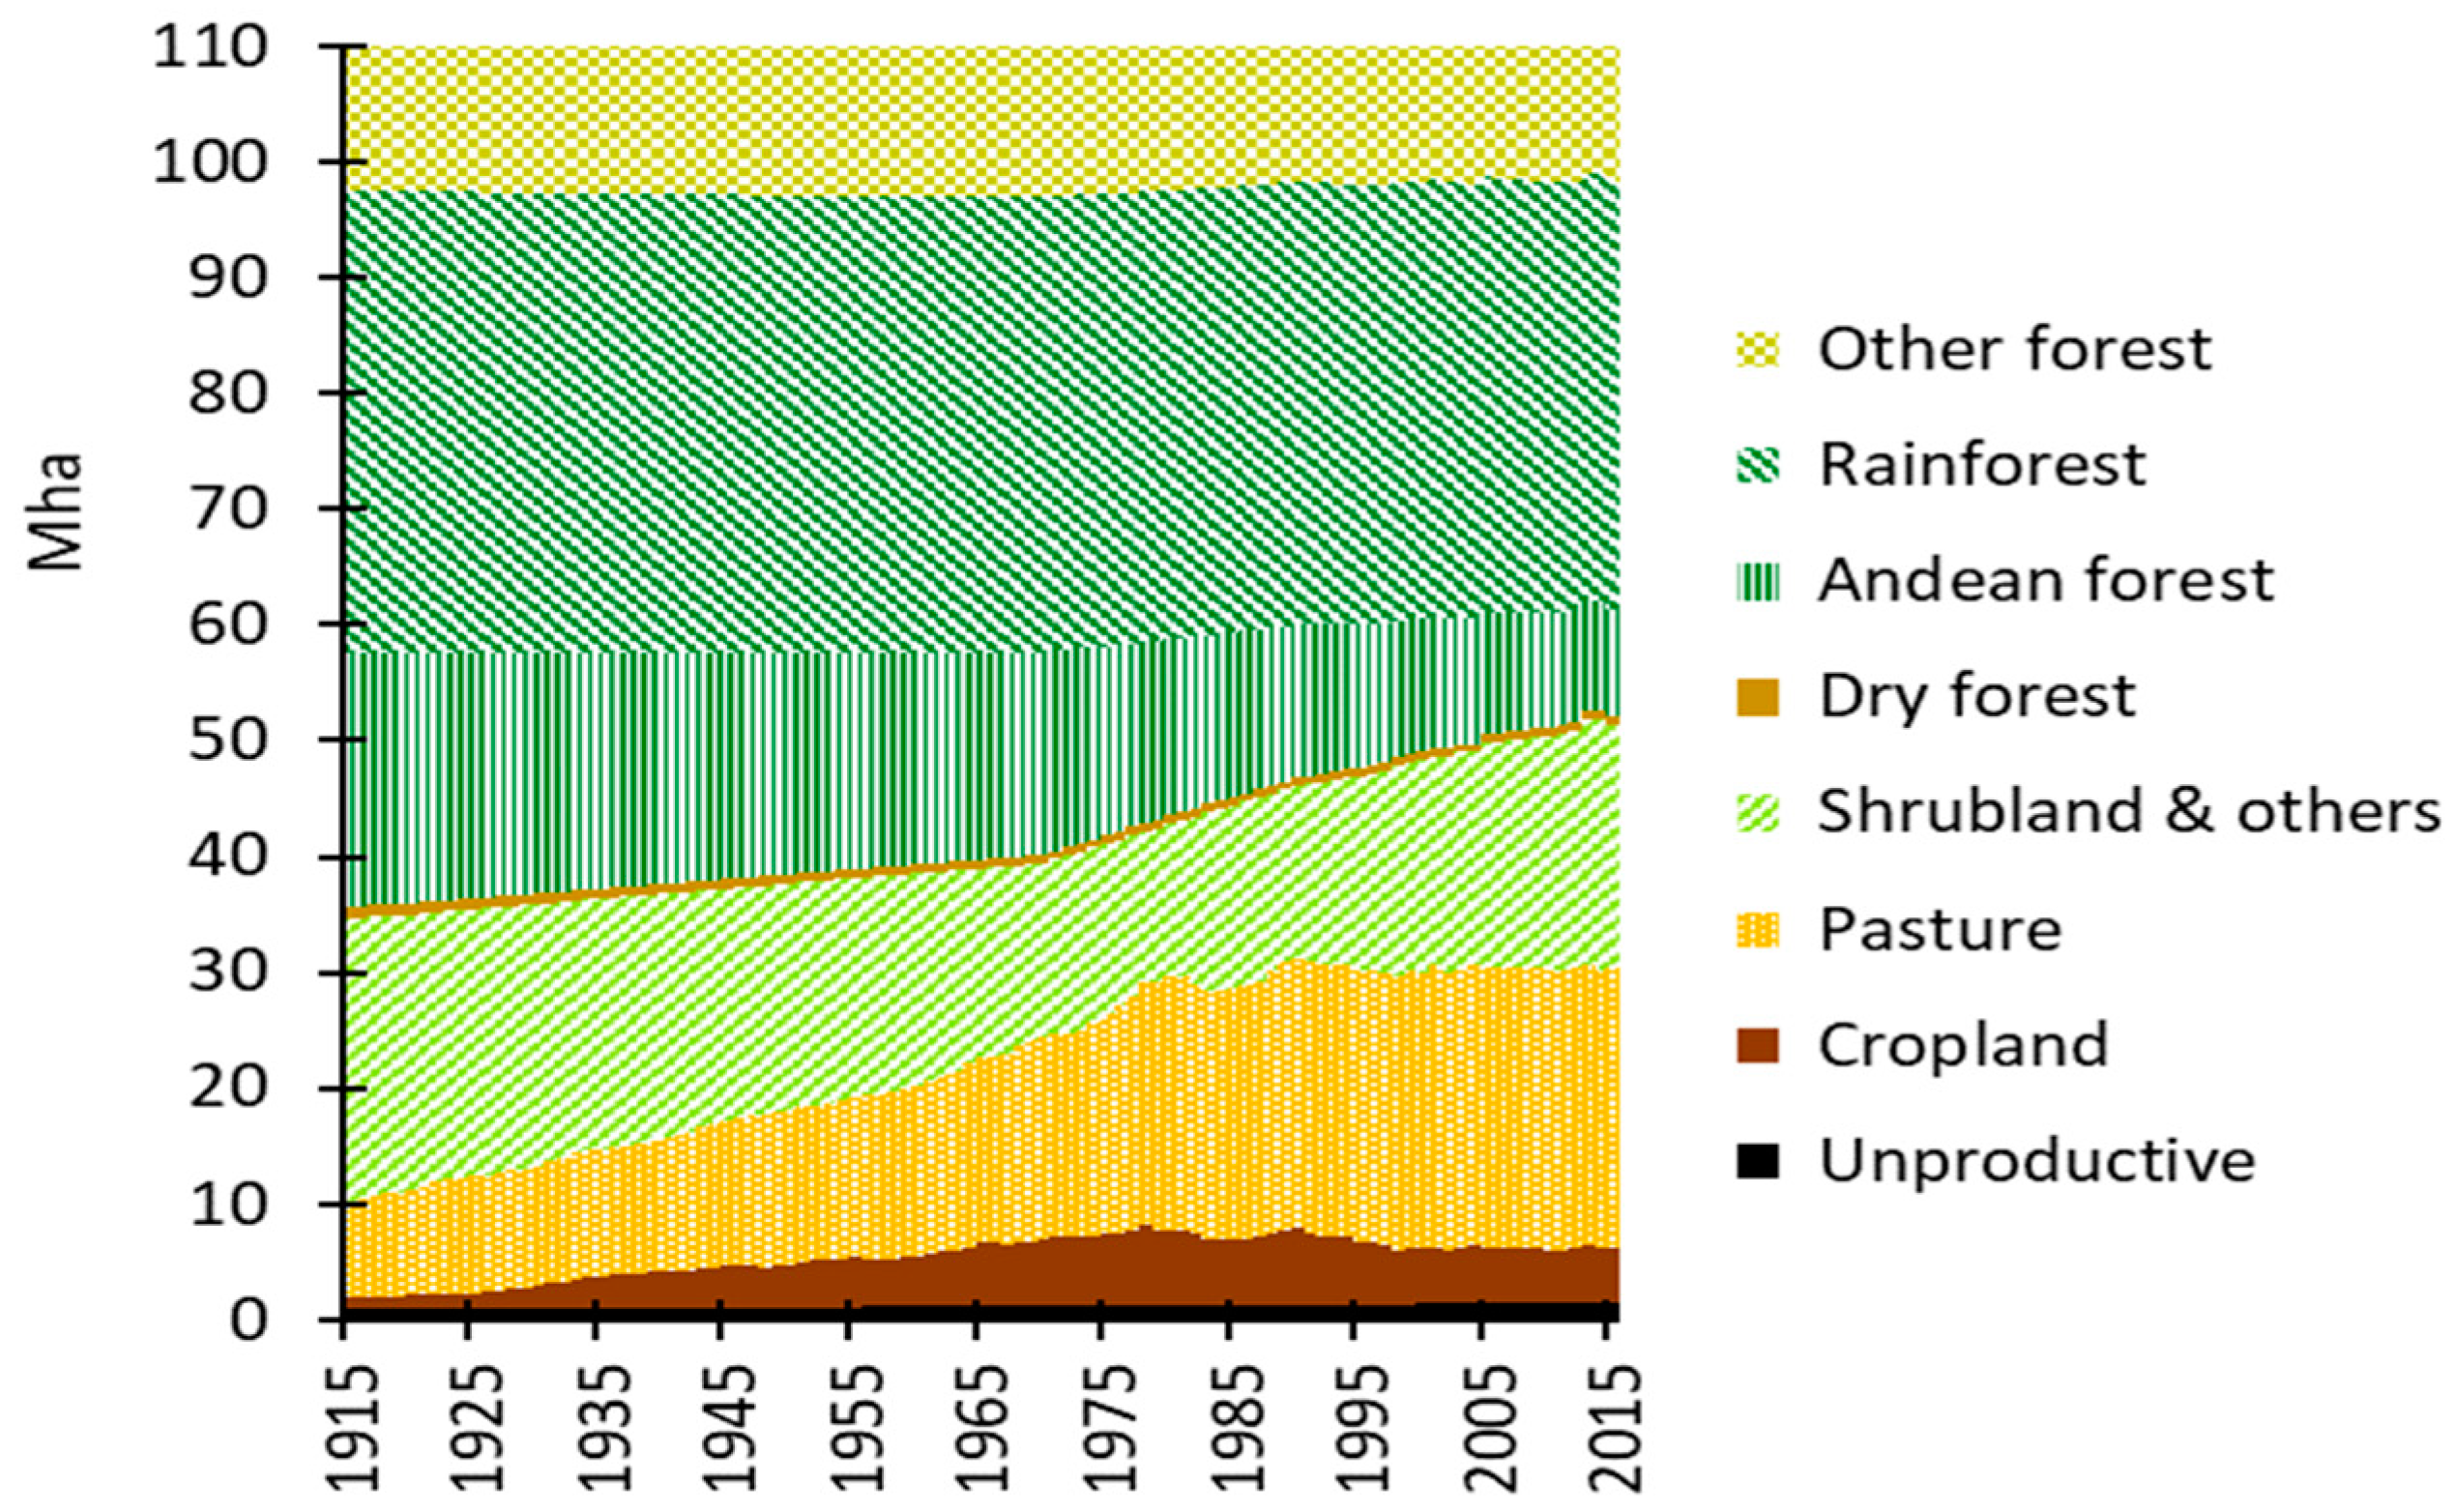
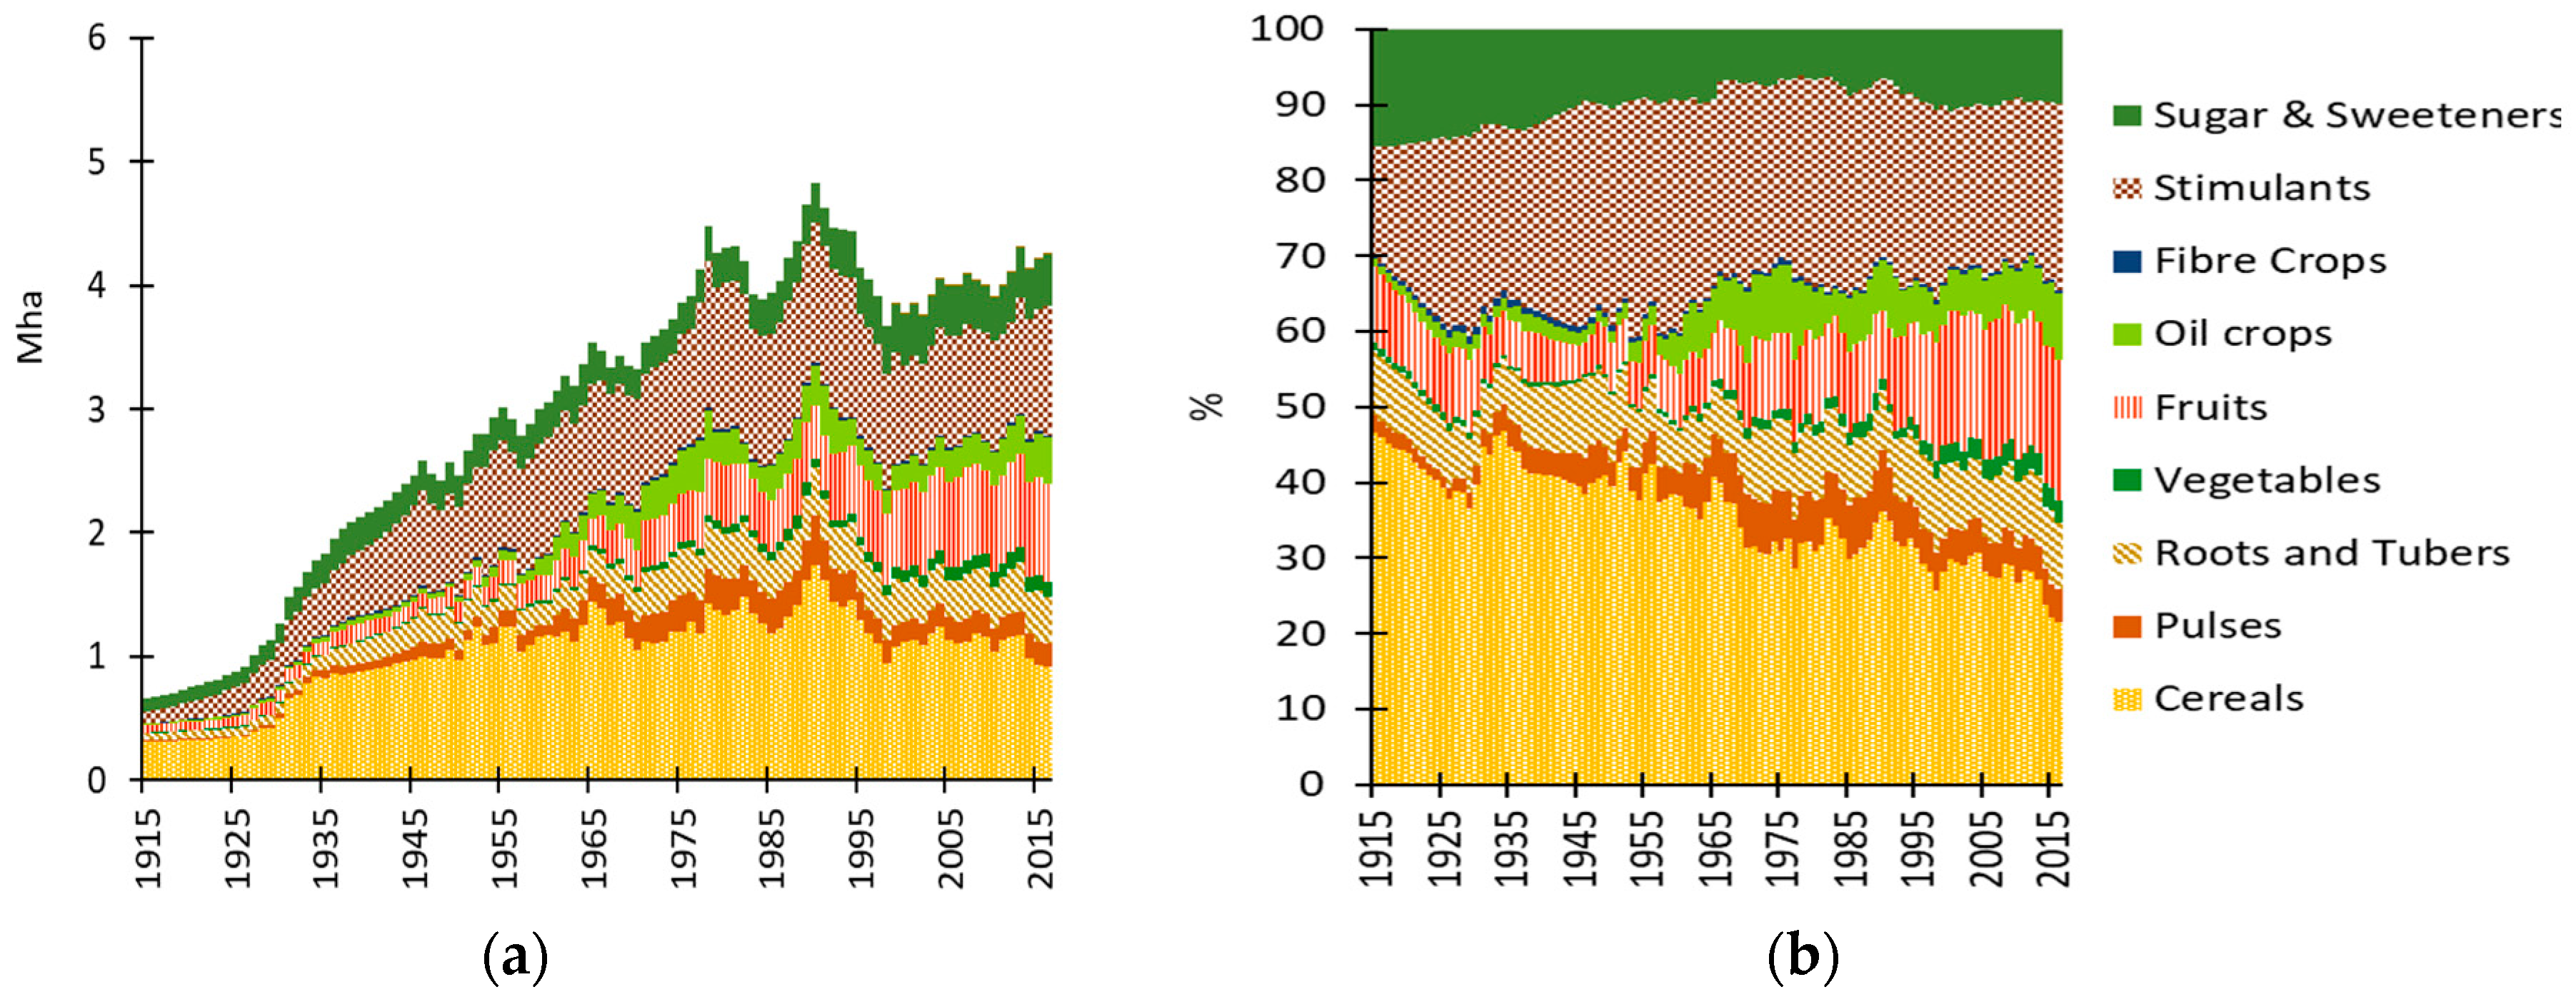
3.1. Land Use Changes
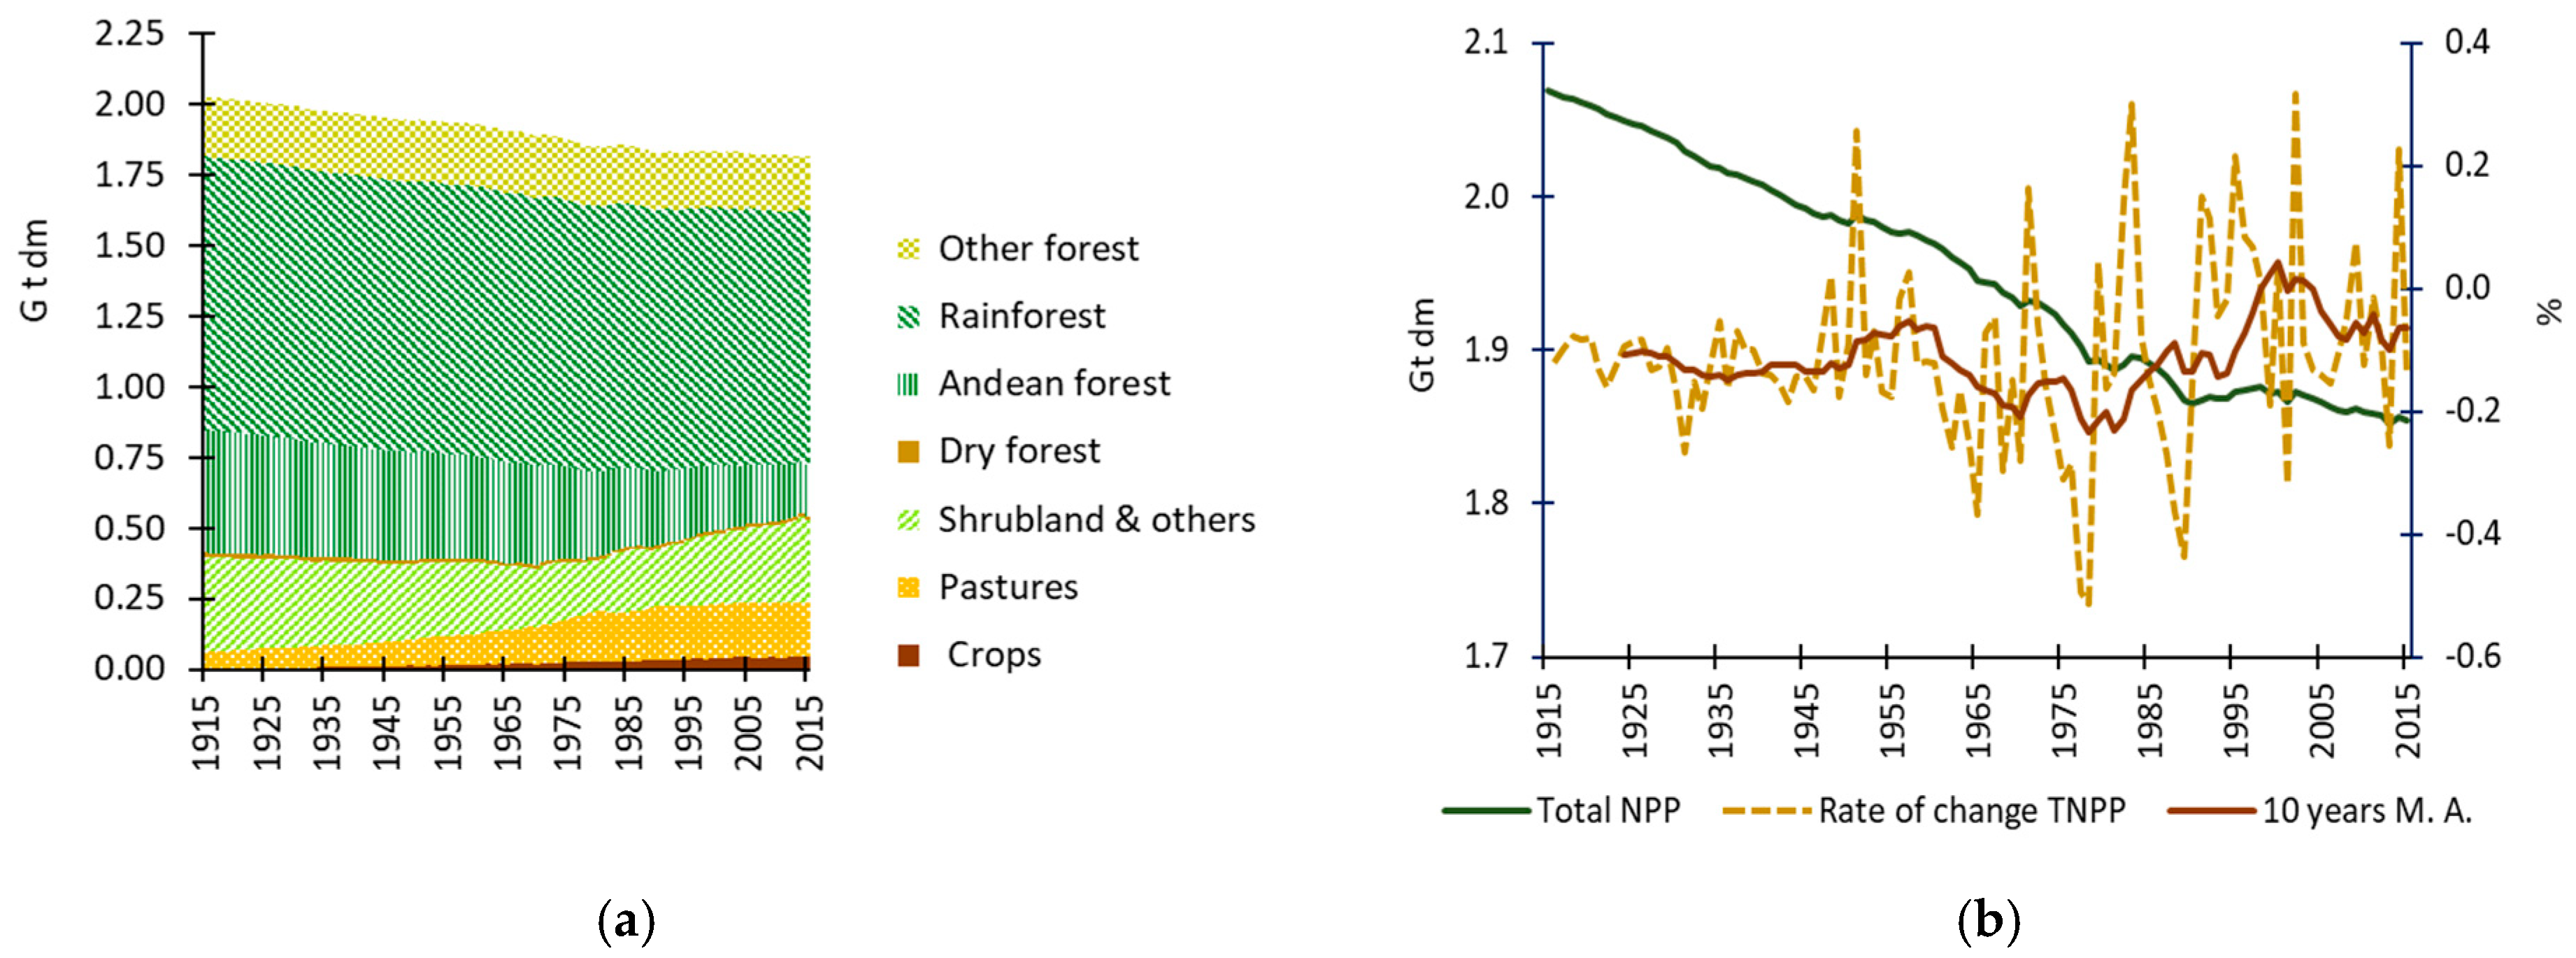
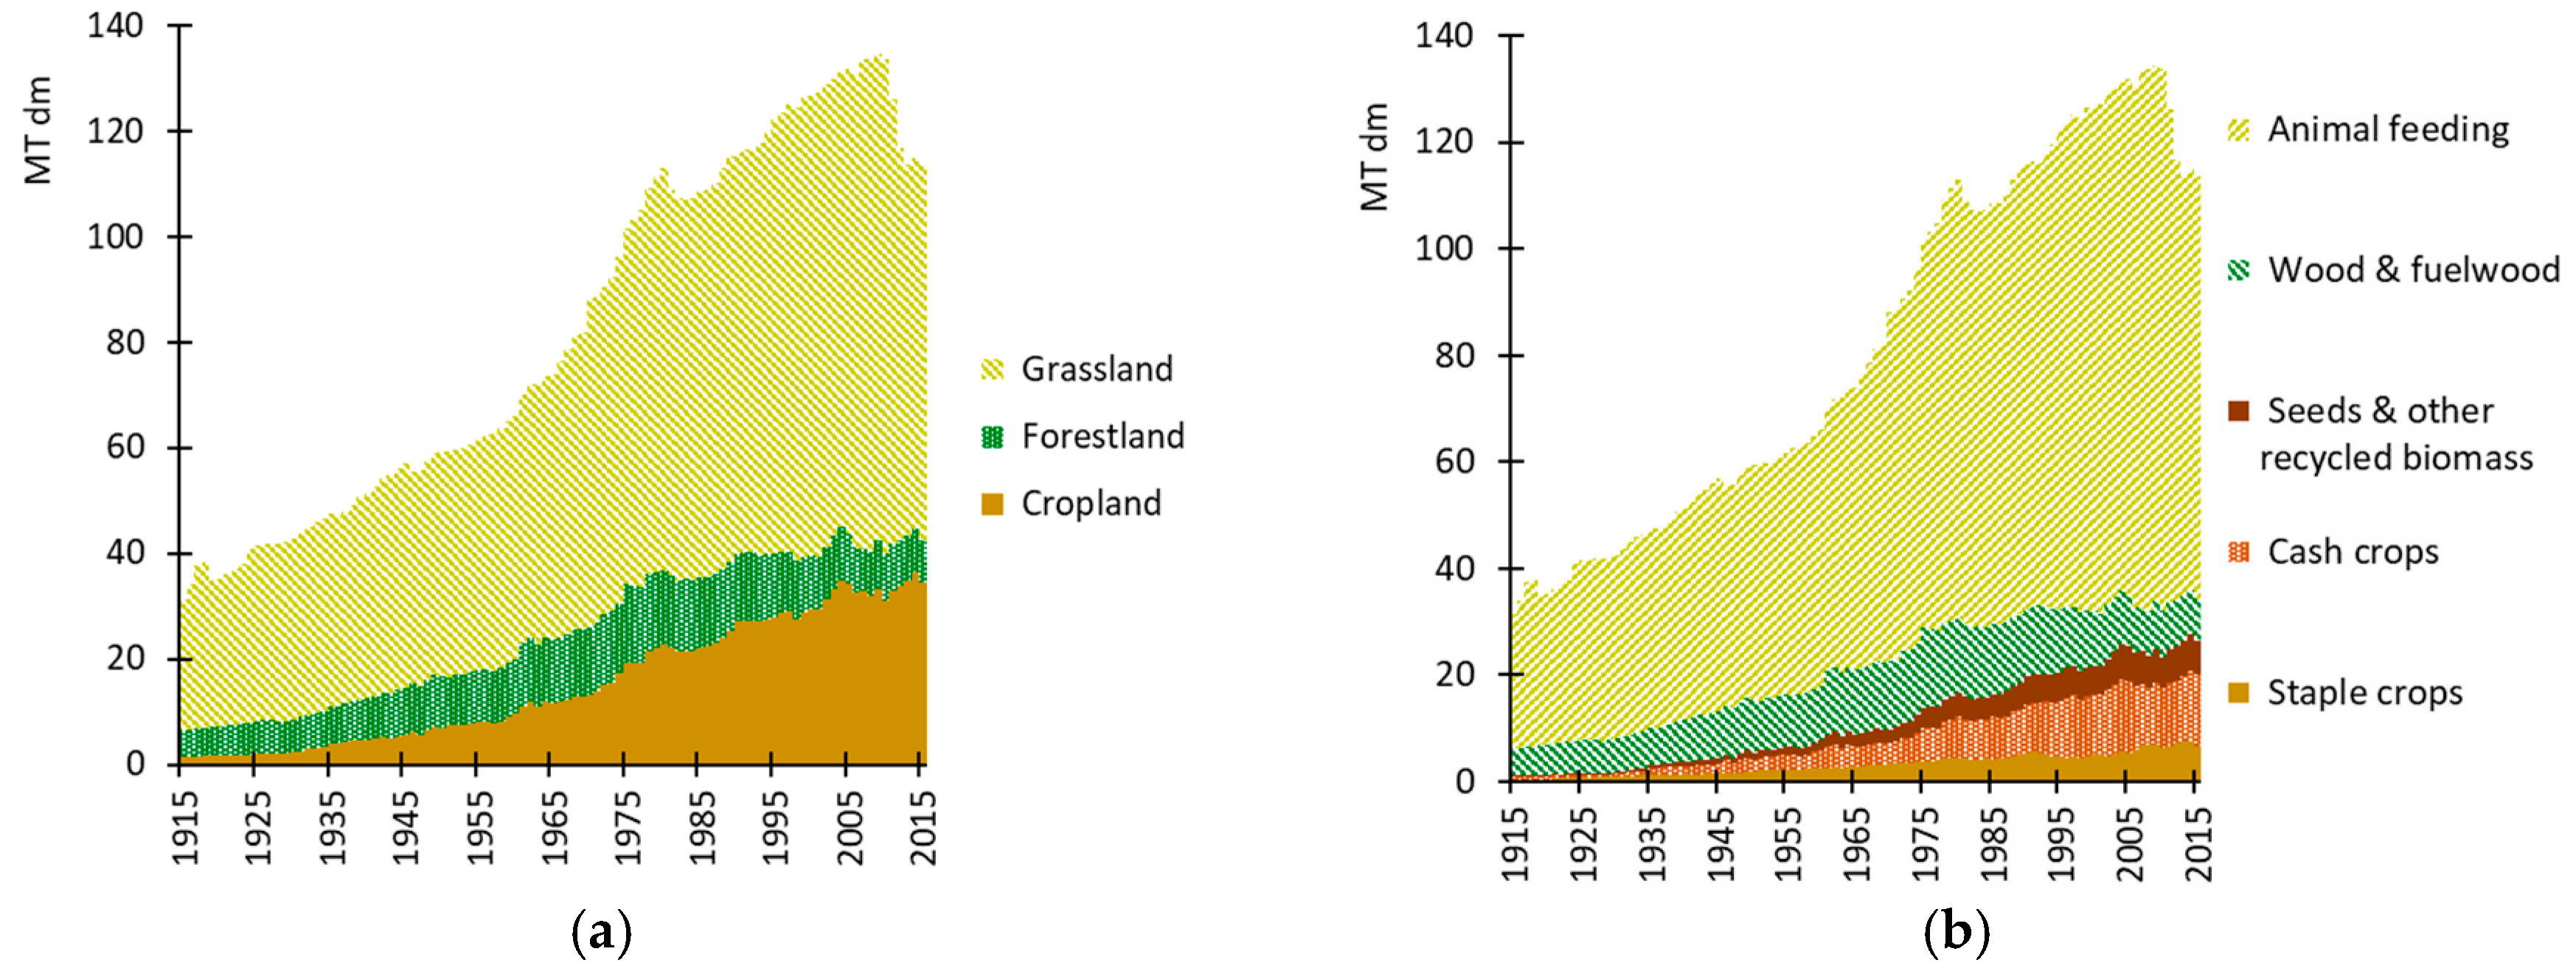
3.2. The Long-Term Trend in NPP
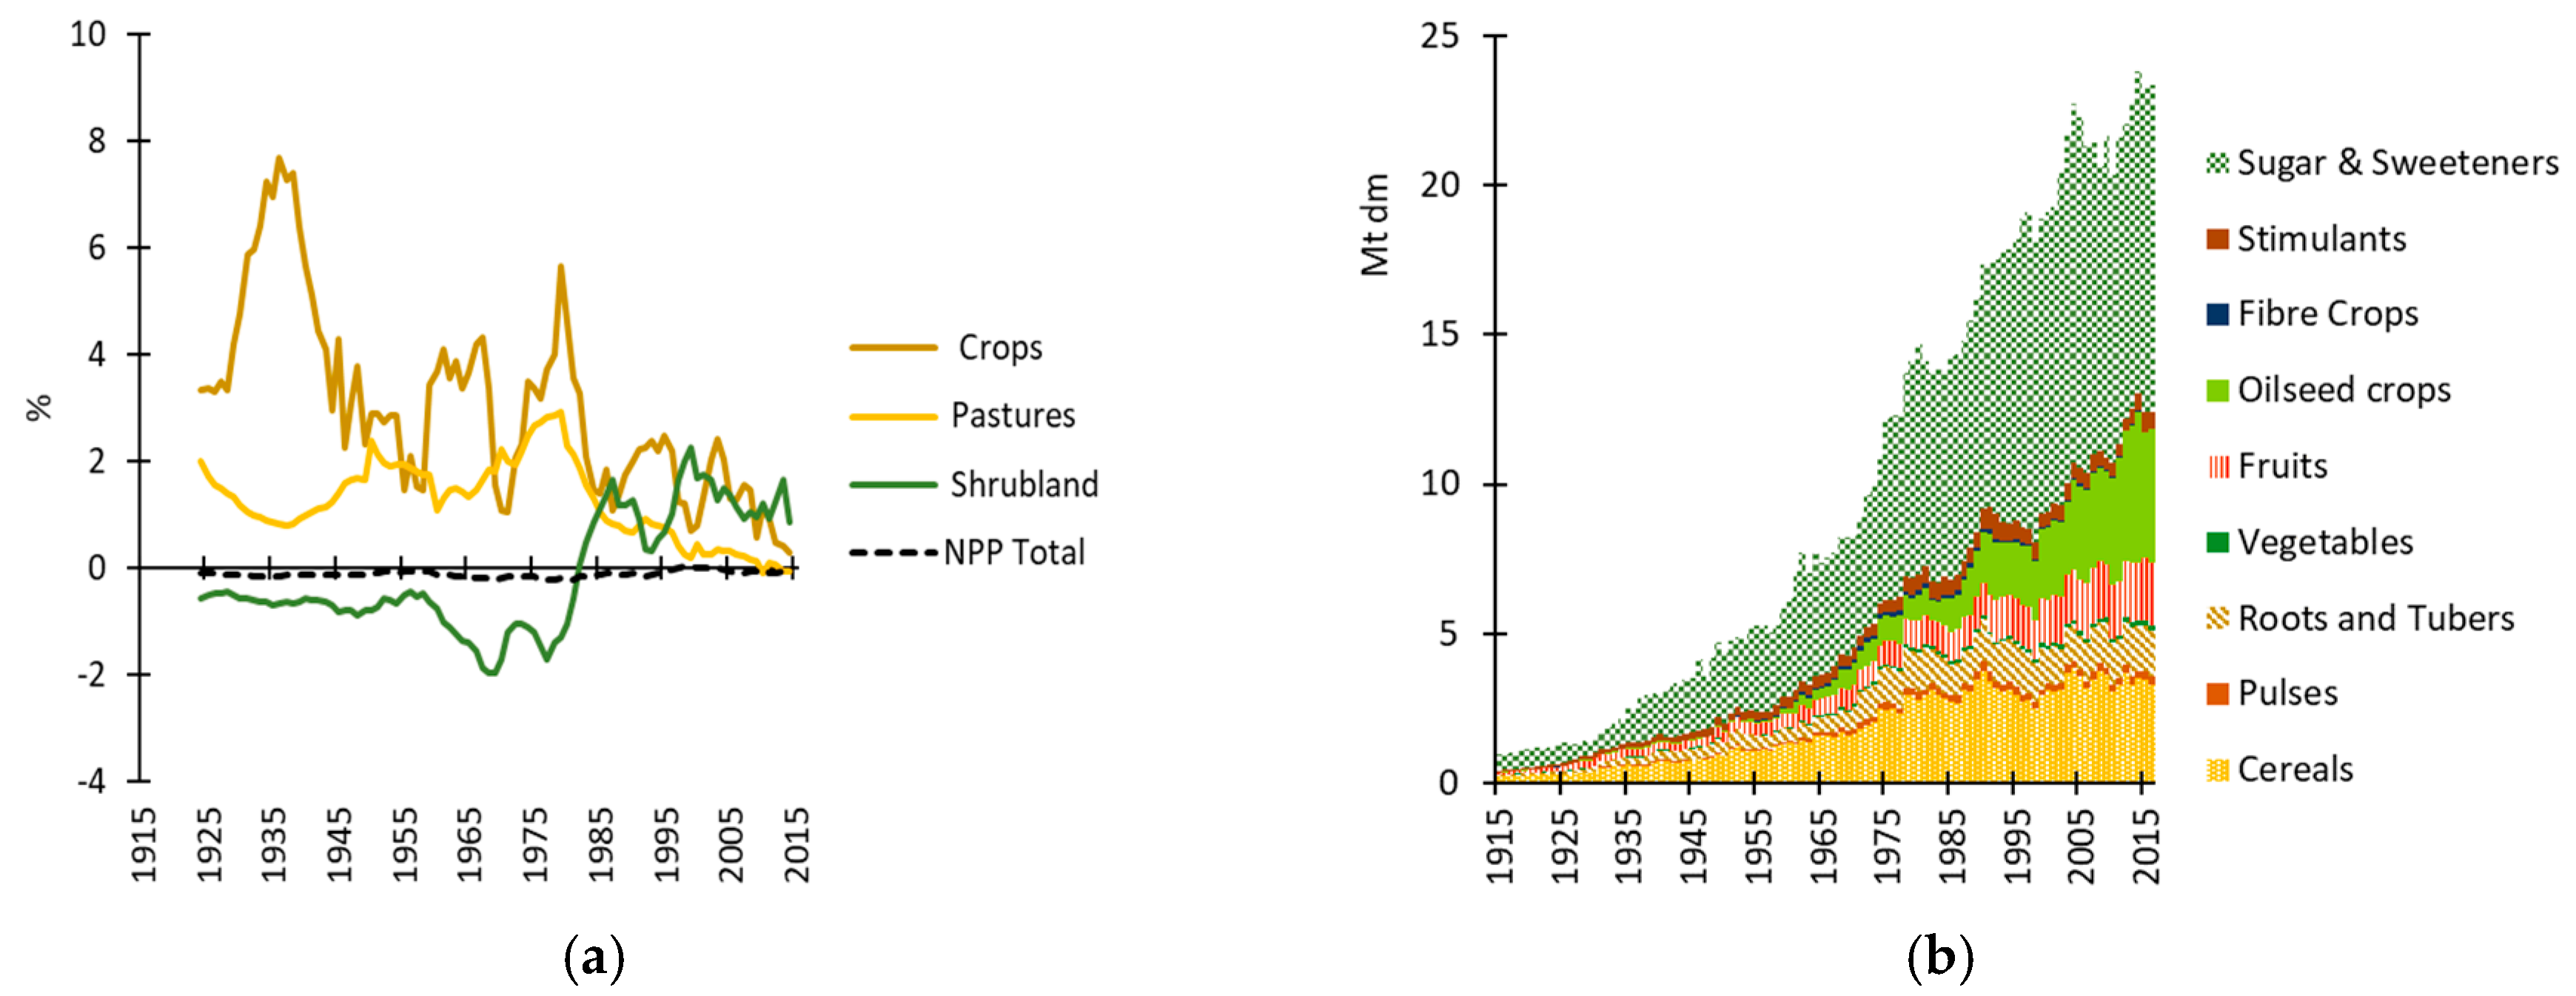
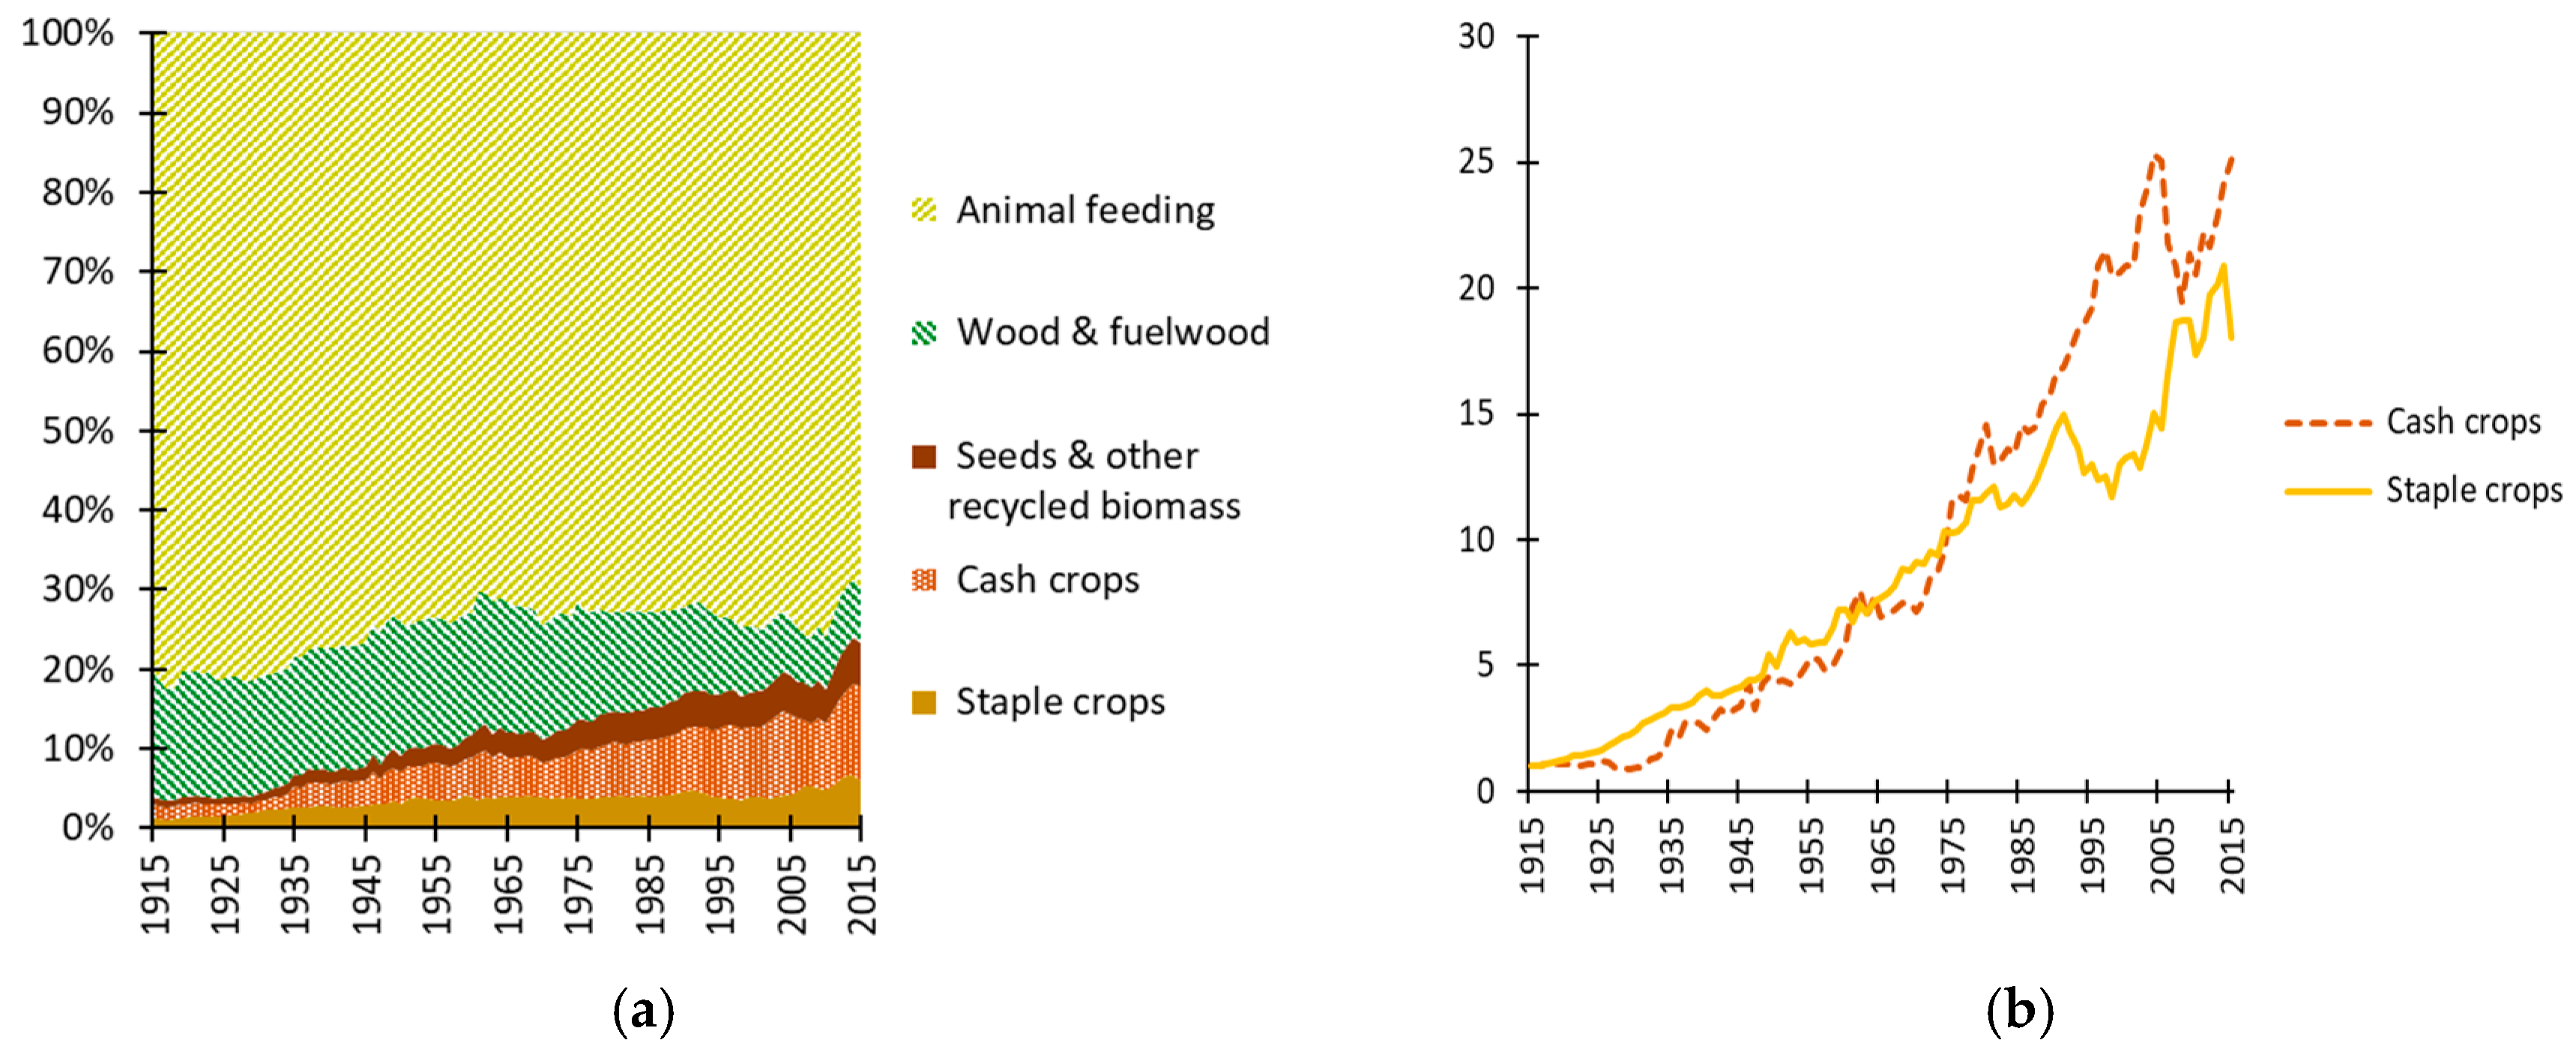
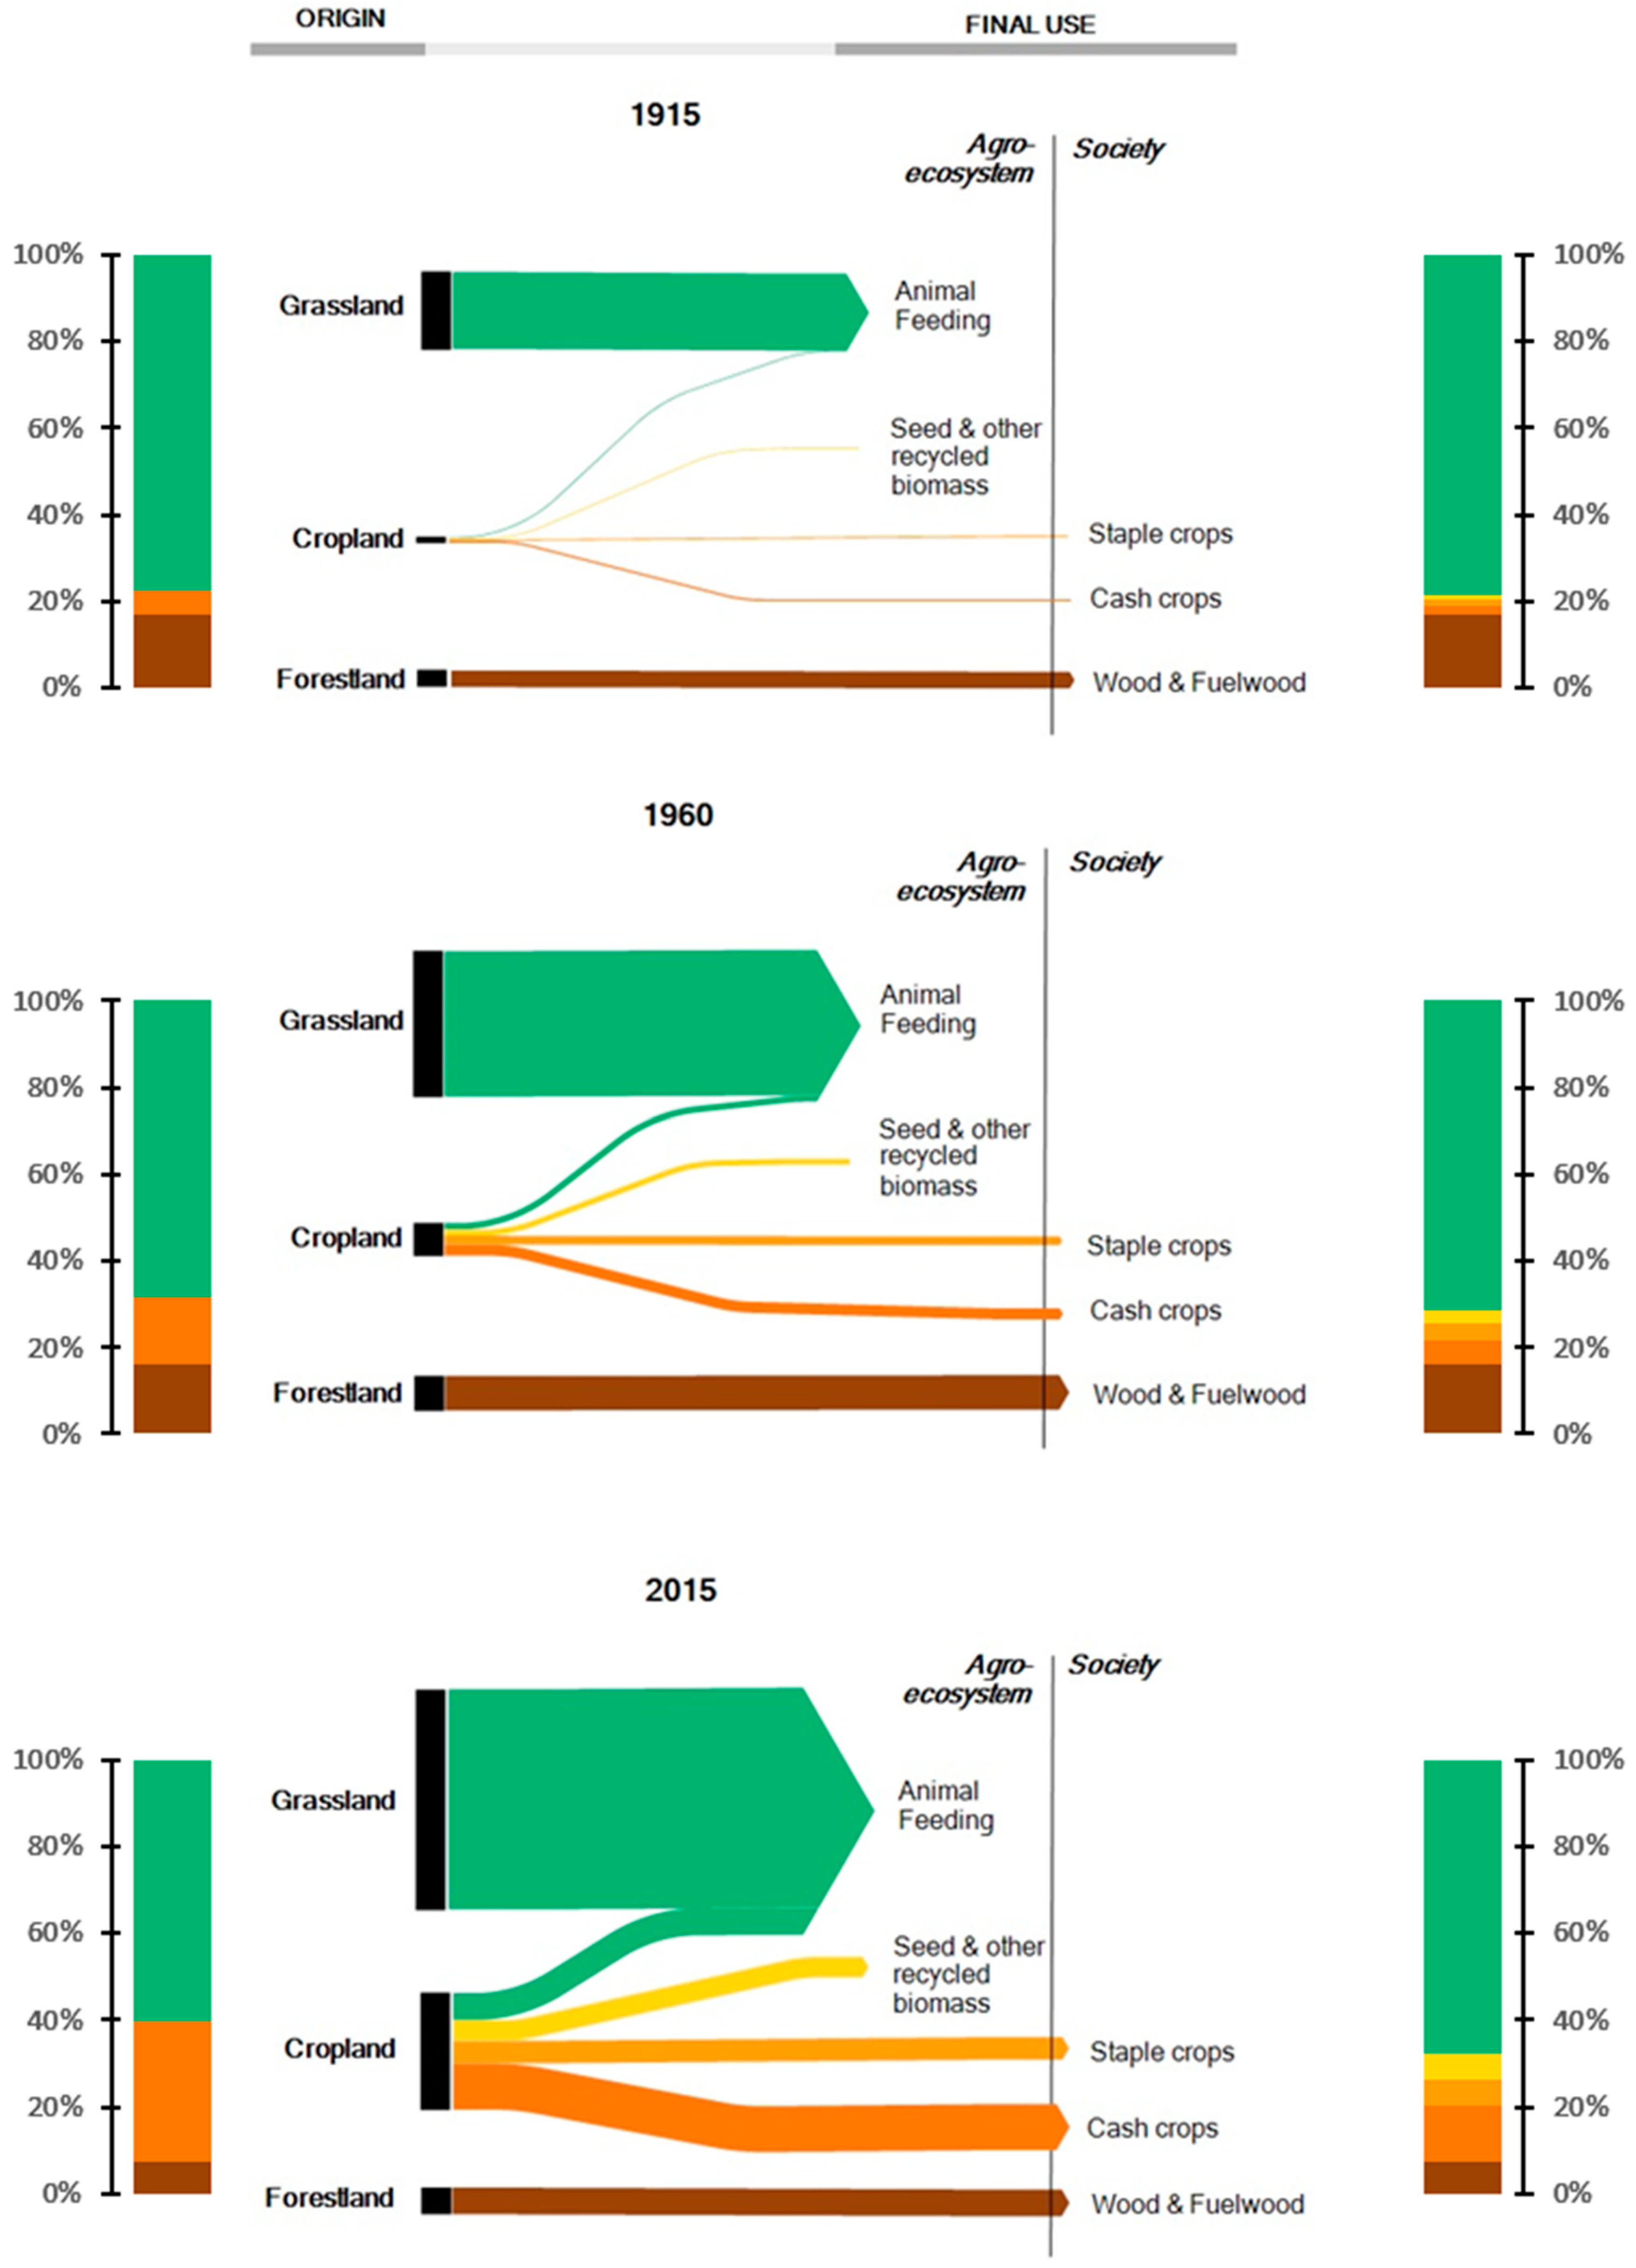
3.3. Final Uses of NPP Extraction
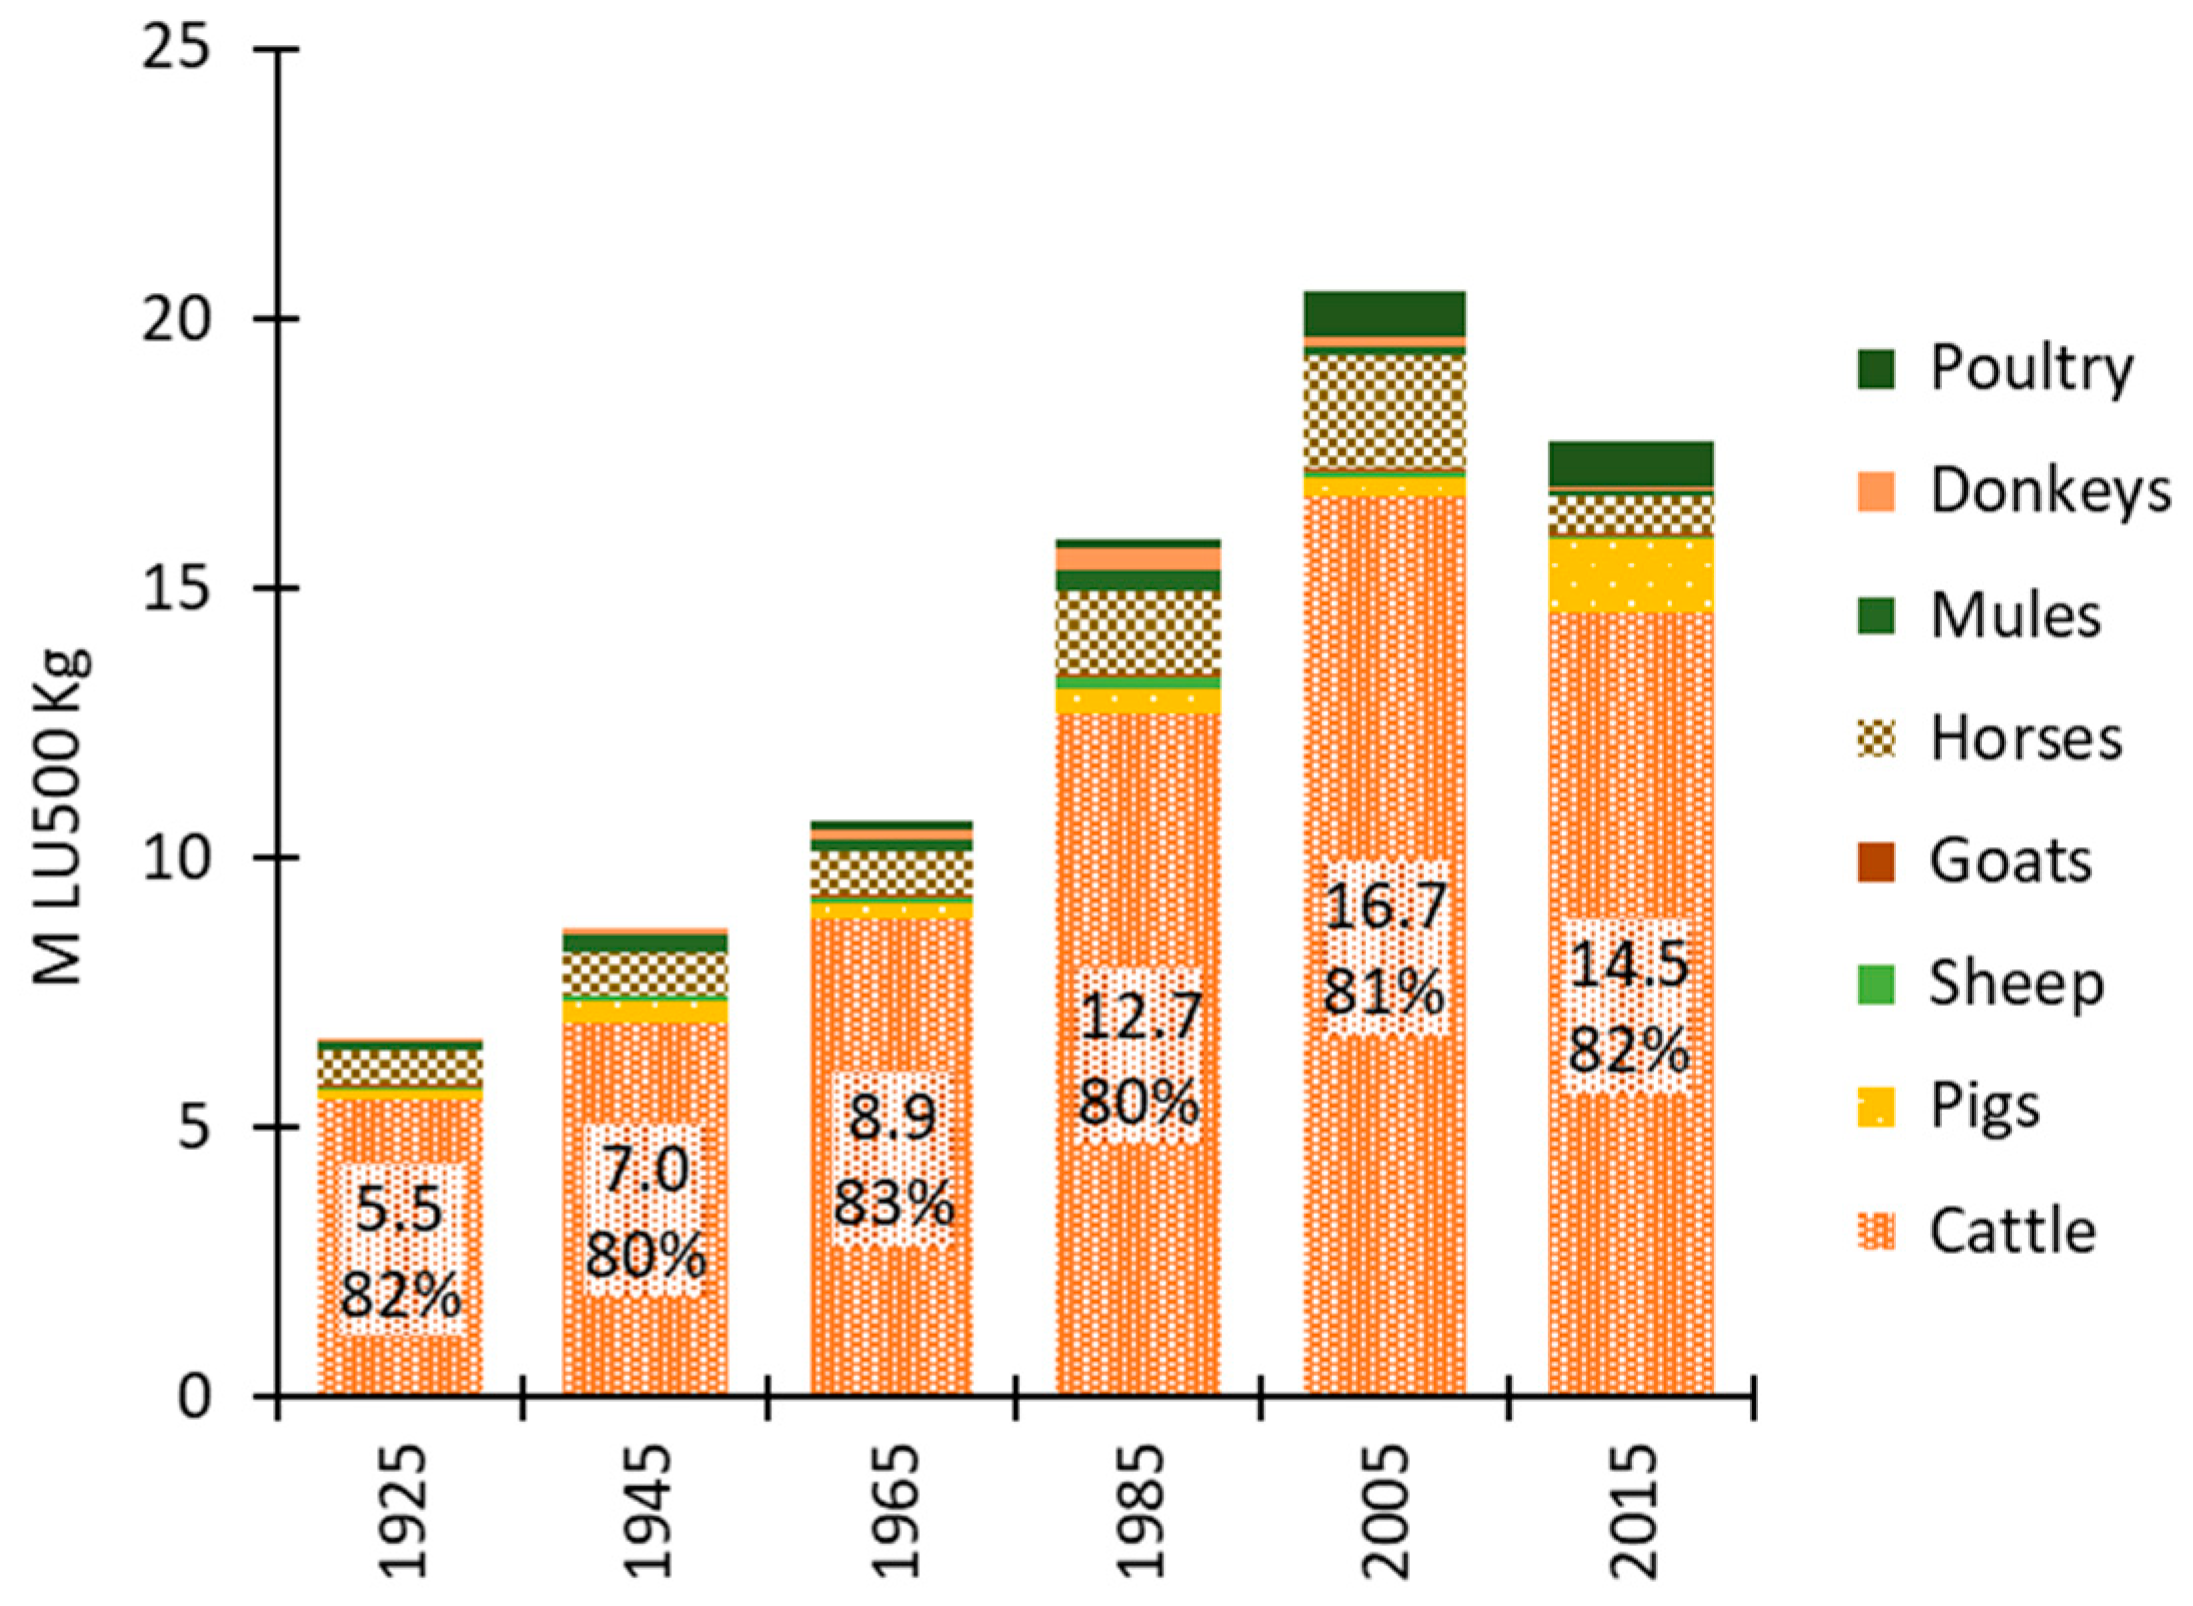
3.4. Livestock and Cropland Intensification
4. Discussion
4.1. Phases of the Socio-Metabolic Transition of Biomass
4.2. Socioeconomic and Political Drivers of the Changing Metabolic Profile of Colombian Agriculture
4.2.1. Trade and Agrarian Policies
4.2.2. Cattle Ranching as a Tool of Land Dispossession
4.2.3. Agrarian Modernization toward Industrial Farming
4.2.4. Economic Growth and Structural Changes
4.3. Socioecological Impacts: Deforestation and Industrial Agribusiness
- The impact of monocultures of industrial cash crops (i.e., the degradation of soils, water bodies and landscapes, with the consequent loss of farm-associated biodiversity and ecosystem services).
- The impact of deforestation and the resulting biodiversity loss [161].
5. Conclusions
Supplementary Materials
Author Contributions
Funding
Conflicts of Interest
References and Notes
- Smil, V. Harvesting the Biosphere: How Much We Have Taken from Nature; The MIT Press: Cambridge, MA, USA, 2013; ISBN 978-0-262-01856-2. [Google Scholar]
- Smil, V. Worldwide transformation of diets, burdens of meat production and opportunities for novel food proteins. Enzym. Microb. Technol. 2002, 30, 305–311. [Google Scholar] [CrossRef]
- Tilman, D.; Clark, M. Global diets link environmental sustainability and human health. Nature 2014, 515, 518–522. [Google Scholar] [CrossRef] [PubMed]
- Arizpe, N.; Giampietro, M.; Ramos-Martin, J. Food Security and Fossil Energy Dependence: An International Comparison of the Use of Fossil Energy in Agriculture (1991–2003). Crit. Rev. Plant Sci. 2011, 30, 45–63. [Google Scholar] [CrossRef]
- Conforti, P.; Giampietro, M. Fossil energy use in agriculture: An international comparison. Agric. Ecosyst. Environ. 1997, 65, 231–243. [Google Scholar] [CrossRef]
- Giampietro, M.; Cerretelli, G.; Pimentel, D. Energy analysis of agricultural ecosystem management: Human return and sustainability. Agric. Ecosyst. Environ. 1992, 38, 219–244. [Google Scholar] [CrossRef]
- FAOSTAT Food and Agriculture Data. Available online: http://www.fao.org/faostat/en/ (accessed on 7 November 2018).
- WU Global Material Flow Data Base. Available online: http://www.materialflows.net/ (accessed on 7 November 2018).
- Gibbs, H.K.; Ruesch, A.S.; Achard, F.; Clayton, M.K.; Holmgren, P.; Ramankutty, N.; Foley, J.A. Tropical forests were the primary sources of new agricultural land in the 1980s and 1990s. Proc. Natl. Acad. Sci. USA 2010, 107, 16732–16737. [Google Scholar] [CrossRef]
- Rodrigues, J.L.M.; Pellizari, V.H.; Mueller, R.; Baek, K.; da C. Jesus, E.; Paula, F.S.; Mirza, B.; Hamaoui, G.S.; Tsai, S.M.; Feigl, B.; et al. Conversion of the Amazon rainforest to agriculture results in biotic homogenization of soil bacterial communities. Proc. Natl. Acad. Sci. USA 2013, 110, 988–993. [Google Scholar] [CrossRef]
- Foley, J.A.; DeFries, R.; Asner, G.P.; Barford, C.; Bonan, G.; Carpenter, S.R.; Chapin, F.S.; Coe, M.T.; Daily, G.C.; Gibbs, H.K.; et al. Global consequences of land use. Science 2005, 309, 570–574. [Google Scholar] [CrossRef]
- Tilman, D.; Socolow, R.; Foley, J.A.; Hill, J.; Larson, E.; Lynd, L.; Pacala, S.; Reilly, J.; Searchinger, T.; Somerville, C.; et al. Beneficial biofuels—The food, energy, and environment trilemma. Science 2009, 325, 270–271. [Google Scholar] [CrossRef]
- Smil, V. Feeding the World: A Challenge for the Twenty-First Century; MIT Press: Cambridge, MA, USA, 2001. [Google Scholar]
- Foley, J.A.; Ramankutty, N.; Brauman, K.A.; Cassidy, E.S.; Gerber, J.S.; Johnston, M.; Mueller, N.D.; O’Connell, C.; Ray, D.K.; West, P.C.; et al. Solutions for a cultivated planet. Nature 2011, 478, 337–342. [Google Scholar] [CrossRef]
- Tilman, D.; Cassman, K.G.; Matson, P.A.; Naylor, R.; Polasky, S. Agricultural sustainability and intensive production practices. Nature 2002, 418, 671. [Google Scholar] [CrossRef] [PubMed]
- Ayres, R.U. On the practical limits to substitution. Ecol. Econ. 2007, 61, 115–128. [Google Scholar] [CrossRef]
- Bardgett, R. The Biology of Soil: A Community and Ecosystem Approach; Oxford University Press: Oxford, UK, 2005. [Google Scholar]
- Smil, V. Crop Residues: Agriculture’s Largest Harvest: Crop residues incorporate more than half of the world’s agricultural phytomass. Bioscience 1999, 49, 299–308. [Google Scholar] [CrossRef]
- Haberl, H.; Erb, K.H.; Krausmann, F.; Gaube, V.; Bondeau, A.; Plutzar, C.; Gingrich, S.; Lucht, W.; Fischer-Kowalski, M. Quantifying and mapping the human appropriation of net primary production in earth’s terrestrial ecosystems. Proc. Natl. Acad. Sci. USA 2007, 104, 12942–12947. [Google Scholar] [CrossRef] [PubMed]
- Vitousek, P.M.; Ehrlich, P.R.; Ehrlich, A.H.; Matson, P.A. Human appropriation of the products of photosynthesis. BioScience 1986, 36, 368–373. [Google Scholar] [CrossRef]
- Haberl, H. Human appropriation of net primary production as an environmental indicator: Implications for sustainable development. Ambio 1997, 26, 143–146. [Google Scholar]
- Schandl, H.; Grünbühel, C.; Weisz, H. Handbook of Physical Accounting: Measuring Bio-Physical Dimensions of Socio-Economic Activities; MFA-EFA-HANPP; Federal Ministry of Agriculture and Forestry, Environment and Water Management: Vienna, Austria, 2002; Division V/10.
- Krausmann, F.; Erb, K.-H.; Gingrich, S.; Haberl, H.; Bondeau, A.; Gaube, V.; Lauk, C.; Plutzar, C.; Searchinger, T.D. Global human appropriation of net primary production doubled in the 20th century. Proc. Natl. Acad. Sci. USA 2013, 110, 10324–10329. [Google Scholar] [CrossRef] [PubMed]
- Gingrich, S.; Niedertscheider, M.; Kastner, T.; Haberl, H.; Cosor, G.; Krausmann, F.; Kuemmerle, T.; Müller, D.; Reith-Musel, A.; Jepsen, M.R.; et al. Exploring long-term trends in land use change and aboveground human appropriation of net primary production in nine European countries. Land Use Policy 2015, 47, 426–438. [Google Scholar] [CrossRef]
- Bringezu, S.; Schütz, H. Material Use Indicators for the European Union, 1980–1997; Eurostat: Luxembourg, 2001.
- Eurostat. Economy Wide Material Flow Accounts: Compilation Guidelines for Reporting to the 2009 Eurostat Questionnaire. Available online: https://unstats.un.org/unsd/envaccounting/ceea/archive/Framework/Eurostat%20MFA%20compilation%20guide_2009.pdf (accessed on 7 November 2018).
- Fischer-Kowalski, M.; Krausmann, F.; Giljum, S.; Lutter, S.; Mayer, A.; Bringezu, S.; Moriguchi, Y.; Schütz, H.; Schandl, H.; Weisz, H. Methodology and indicators of economy-wide material flow accounting: State of the art and reliability across sources. J. Ind. Ecol. 2011, 15, 855–876. [Google Scholar] [CrossRef]
- Soto, D.; Infante-Amate, J.; Guzmán, G.I.; Cid, A.; Aguilera, E.; García, R.; González de Molina, M. The social metabolism of biomass in Spain, 1900–2008: From food to feed-oriented changes in the agro-ecosystems. Ecol. Econ. 2016, 128, 130–138. [Google Scholar] [CrossRef]
- Risku-Norja, H.; Mäenpää, I. MFA model to assess economic and environmental consequences of food production and consumption. Ecol. Econ. 2007, 60, 700–711. [Google Scholar] [CrossRef]
- Risku-Norja, H. The Total Material Requirement-Concept Applied to Agriculture: A Case Study from Finland. Agric. Food Sci. 1999, 8, 393–410. [Google Scholar] [CrossRef]
- Kovanda, J.; Hak, T. Historical perspectives of material use in Czechoslovakia in 1855–2007. Ecol. Indic. 2011, 11, 1375–1384. [Google Scholar] [CrossRef]
- Kuskova, P.; Gingrich, S.; Krausmann, F. Long term changes in social metabolism and land use in Czechoslovakia, 1830–2000: An energy transition under changing political regimes. Ecol. Econ. 2008, 68, 394–407. [Google Scholar] [CrossRef]
- Krausmann, F.; Erb, K.-H.; Gingrich, S.; Lauk, C.; Haberl, H. Global patterns of socioeconomic biomass flows in the year 2000: A comprehensive assessment of supply, consumption and constraints. Ecol. Econ. 2008, 65, 471–487. [Google Scholar] [CrossRef]
- Wirsenius, S. The Biomass Metabolism of the Food System: A Model-Based Survey of the Global and Regional Turnover of Food Biomass. J. Ind. Ecol. 2003, 7, 47–80. [Google Scholar] [CrossRef]
- The World Bank Data. Available online: https://data.worldbank.org/indicator/NY.GDP.PCAP.CD?locations=CO-CL-BR-AR-EC-PE-BO-PY-UY-VE (accessed on 7 November 2018).
- Sistema Nacional Ambiental Sistema de Información Sobre la Biodiversidad de Colombia. Available online: https://sibcolombia.net/actualidad/biodiversidad-en-cifras/ (accessed on 7 November 2018).
- Steinmann, Z.J.N.; Schipper, A.M.; Hauck, M.; Giljum, S.; Wernet, G.; Huijbregts, M.A.J. Resource footprints are good proxies of environmental damage. Environ. Sci. Technol. 2017, 51, 6360–6366. [Google Scholar] [CrossRef]
- Heijungs, R. Comment on “Resource Footprints are Good Proxies of Environmental Damage”. Environ. Sci. Technol. 2017, 51, 13054–13055. [Google Scholar] [CrossRef]
- Steinmann, Z.J.N.; Schipper, A.M.; Hauck, M.; Giljum, S.; Wernet, G.; Huijbregts, M.A.J. Response to Comment on “Resource Footprints are Good Proxies of Environmental Damage”. Environ. Sci. Technol. 2017, 51, 13056–13057. [Google Scholar] [CrossRef]
- Giljum, S.; Eisenmenger, N. North-South trade and the distribution of environmental goods and burdens: A biophysical perspective. J. Environ. Dev. 2004, 13, 73–100. [Google Scholar] [CrossRef]
- Muradian, R.; Martinez-Alier, J. Trade and the environment: From a ‘Southern’ perspective. Ecol. Econ. 2001, 36, 281–297. [Google Scholar] [CrossRef]
- Muradian, R.; Martinez-Alier, J. South-North materials flow: History and environmental repercussions. Innovation 2001, 14, 171–187. [Google Scholar] [CrossRef]
- Muradian, R.; Martinez-Alier, J. Globalization and Poverty: An Ecological Perspective; Heinrich Böll Foundation: Cologne, Germany, 2001. [Google Scholar]
- Schandl, H.; Schulz, N. Changes in the United Kingdom’s natural relations in terms of society’s metabolism and land-use from 1850 to the present day. Ecol. Econ. 2002, 41, 203–221. [Google Scholar] [CrossRef]
- Krausmann, F.; Schandl, H.; Sieferle, R.P. Socio-ecological regime transitions in Austria and the United Kingdom. Ecol. Econ. 2008, 65, 187–201. [Google Scholar] [CrossRef]
- Infante-Amate, J.; Soto, D.; Aguilera, E.; García-Ruiz, R.; Guzmán, G.; Cid, A.; González de Molina, M. The Spanish Transition to Industrial Metabolism: Long-Term Material Flow Analysis (1860–2010). J. Ind. Ecol. 2015, 19, 866–876. [Google Scholar] [CrossRef]
- Singh, S.J.; Krausmann, F.; Gingrich, S.; Haberl, H.; Erb, K.-H.; Lanz, P.; Martinez-Alier, J.; Temper, L. India’s biophysical economy, 1961–2008. Sustainability in a national and global context. Ecol. Econ. 2012, 76, 60–69. [Google Scholar] [CrossRef] [PubMed]
- Vilaysouk, X.; Schandl, H.; Murakami, S. Improving the knowledge base on material flow analysis for Asian developing countries: A case study of Lao PDR. Resour. Conserv. Recycl. 2017, 127, 179–189. [Google Scholar] [CrossRef]
- Russi, D.; González Martínez, A.C.; Silva-Macher, J.C.; Giljum, S.; Martínez Alier, J.; Vallejo, M.C. Material Flow Accounting in Chile, Ecuador, Mexico and Peru (1980–2000). J. Ind. Ecol. 2008, 12, 704–720. [Google Scholar] [CrossRef]
- Amann, C.; Bruckner, W.; Fischer-Kowalski, M.; Grünbühel, C. Material Flow Accounting in Amazonia: A Tool for Sustainable Development; Inst. for Interdisciplinary Studies at Austrian Universities, Department of Social Ecology: Viena, Austria, 2002. [Google Scholar]
- Vallejo, M.C.; Pérez Rincón, M.A.; Martinez-Alier, J. Metabolic profile of the Colombian Economy from 1970 to 2007. J. Ind. Ecol. 2011, 15, 245–267. [Google Scholar] [CrossRef]
- Pérez-Rincón, M.; Vargas-Morales, J.; Crespo-Marín, Z. Trends in social metabolism and environmental conflicts in four Andean countries from 1970 to 2013. Sustain. Sci. 2018, 13, 635–648. [Google Scholar] [CrossRef]
- Behrens, A.; Giljum, S.; Kovanda, J.; Niza, S. The material basis of the global economy: Worldwide patterns of natural resource extraction and their implications for sustainable resource use policies. Ecol. Econ. 2007, 64, 444–453. [Google Scholar] [CrossRef]
- Schandl, H.; Fischer-Kowalski, M.; West, J.; Giljum, S.; Dittrich, M.; Eisenmenger, N.; Geschke, A.; Lieber, M.; Wieland, H.P.; Schaffartzik, A.; et al. Global Material Flows and Resource Productivity. Assessment Report for the UNEP International Resource Panel. Pre-Publication Final Draft; United Nations Environment Programme: Paris, France, 2017. [Google Scholar]
- Schandl, H.; Fischer-Kowalski, M.; West, J.; Giljum, S.; Dittrich, M.; Eisenmenger, N.; Geschke, A.; Lieber, M.; Wieland, H.P.; Schaffartzik, A.; et al. Global Material Flows and Resource Productivity; United Nations Environment Programme: Nairobi, Kenya, 2016. [Google Scholar]
- Steinberger, J.K.; Krausmann, F.; Eisenmenger, N. Global patterns of materials use: A socioeconomic and geophysical analysis. Ecol. Econ. 2010, 69, 1148–1158. [Google Scholar] [CrossRef]
- Giljum, S. Trade, materials flows, and economic development in the South: The example of Chile. J. Ind. Ecol. 2004, 8, 241–261. [Google Scholar] [CrossRef]
- Guzmán Casado, G.; Aguilera, E.; Soto Fernández, D.; Cid, A.; Infante Amate, J.; García Ruiz, R.; Herrera, A.; Villa, I.; González de Molina, M. Methodology and Conversion Factors to Estimate the Net Primary Productivity of Historical and Contemporary Agroecosystems. Available online: https://ideas.repec.org/p/seh/wpaper/1407.html (accessed on 7 November 2018).
- Eurostat. Economic-wide Material Flow Accounts (EW-MFA). 2013. Available online: https://ec.europa.eu/eurostat/documents/1798247/6191533/2013-EW-MFA-Guide-10Sep2013.pdf/54087dfb-1fb0-40f2-b1e4-64ed22ae3f4c (accessed on 7 November 2018).
- Galán, E.; Padró, R.; Marco, I.; Tello, E.; Cunfer, G.; Guzmán, G.I.; Golzález de Molina, M.; Krausmann, F.; Gingrich, S.; Sacristán, V.; et al. Widening the analysis of Energy Return on Investment (EROI) in agro-ecosystems: Socio-ecological transitions to industrialized farm systems (the Vallès County, Catalonia, c. 1860 and 1999). Ecol. Model. 2016, 336, 13–25. [Google Scholar] [CrossRef]
- Guzmán, G.I.; González de Molina, M. Energy in Agroecosystems. A Tool for Assessing Sustainability; CRC Press: Boca Raton, FL, USA, 2017. [Google Scholar]
- Tello, E.; Galán, E.; Sacristán, V.; Cunfer, G.; Guzmán, G.I.; de Molina, M.G.; Krausmann, F.; Gingrich, S.; Padró, R.; Marco, I.; et al. Opening the black box of energy throughputs in farm systems: A decomposition analysis between the energy returns to external inputs, internal biomass reuses and total inputs consumed (the Vallès County, Catalonia, c. 1860 and 1999). Ecol. Econ. 2016, 121, 160–174. [Google Scholar] [CrossRef]
- Flórez Nieto, C.E.; Méndez, R. Las Trasformaciones Socio Demográficas en Colombia Durante el Siglo XX; Mundo, T., Ed.; Banco de la República: Bogotá, Colombia, 2000.
- Anuario estadístico. Colombia, D. G. de estadística, Ed.; Bogotá, Colombia, 1915.
- Anuario estadístico. Colombia, D. G. de estadística, Ed.; Bogotá, Colombia, 1933.
- Anuario estadístico. Colombia, D. G. de estadística, Ed.; Bogotá, Colombia, 1934.
- Anuario estadístico. Colombia, D. G. de estadística, Ed.; Bogotá, Colombia, 1937.
- Wylie, K.H. The Agriculture of Colombia; U. S. Department of Agriculture: Washington, DC, USA, 1942.
- Atkinson, L.J. Changes in Agricultural Production and Technology in Colombia; Dept. of Agriculture, Economic Research Service in cooperation with the Ministry of Agriculture and the Central Planning Agency of Colombia: Washington, DC, USA, 1969.
- Sanchez Santamaria, I. Geografía Comercial y Económica de Colombia y de los Países con los Cuales Negocia; Edit. Specta: Bogotá, Colombia, 1928. [Google Scholar]
- Diot, J. Colombia económica 1923–1929. Bol. Mens. Estad. 1976, 300, 120–245. [Google Scholar]
- SAC. Revista Nacional de Agricultura; SAC: Bogotá, Colombia, 1925. [Google Scholar]
- Bejarano, J.A. Antología Jesús Antonio Bejarano; Universidad Nacional de Colombia, Vicerrectoría Académica: Bogotá, Colombia, 2011. [Google Scholar]
- Varela Martínez, R. Boletín de la Economía Agrícola de Colombia; Ministerio de Agricultura y Ganadería, Division de Economía Rural: Bogotá, Colombia, 1949.
- Kalmanovitz, S.; López, E.; Romero, C.A. La Producción Agropecuaria Colombiana 1915–1950; Banco de la República: Bogotá, Colombia, 1999.
- Etter, A.; McAlpine, C.; Possingham, H. Historical Patterns and Drivers of Landscape Change in Colombia Since 1500: A Regionalized Spatial Approach. Ann. Assoc. Am. Geogr. 2008, 98, 2–23. [Google Scholar] [CrossRef]
- Sistema de Monitoreo de Bosques y Carbono. Available online: http://smbyc.ideam.gov.co/MonitoreoBC-WEB/reg/indexLogOn.jsp (accessed on 7 November 2018).
- Pizano, C.; García, H. El Bosque Seco Tropical en Colombia; Instituto de Investigación de Recursos Biológicos: Bogotá, Colombia, 2014. [Google Scholar]
- Leyva, P. El Medio Ambiente en Colombia; IDEAM: Bogotá, Colombia, 2001.
- DANE. Censo Agropecuario 1960; DANE: Bogotá, Colombia, 1964.
- DANE. Censo Nacional Agropecuario 1970-71; DANE: Bogotá, Colombia, 1974.
- Unidad de Planeación Minero Energética, Balance energético Colombiano (BECO) 1975–2016. Available online: http://www1.upme.gov.co/InformacionCifras/Paginas/BalanceEnergetico.aspx (accessed on 7 November 2018).
- Anuario estadístico: Comercio exterior. Colombia, D. G. de E., Ed.; Bogotá, Colombia, 1923.
- Anuario estadístico: Comercio exterior. Colombia, D. G. de E., Ed.; Bogotá, Colombia, 1938.
- Anuario estadístico: Comercio exterior. Colombia, D. G. de E., Ed.; Bogotá, Colombia, 1945.
- Anuario estadístico: Comercio exterior. Colombia, D. A. N. de E., Ed.; Bogotá, Colombia, 1955.
- Anuario estadístico: Comercio exterior. Colombia, D. G. de E., Ed.; Bogotá, Colombia, 1916.
- Argentina., M. De Agricultura; Estadística Agrícola; [s.n.], 1910.
- Argentina., M. De Agricultura; Estadística Agrícola; [s.n.], 1926.
- Anuario Estadístico 1925. 1926.
- Memoria del Censo Agrícola Nacional 1946, Ministerio de Agricultura de Cuba; P. Fernández: Habana, 195.
- de E Ecuador, D.N. Ecuador en Cifras: 1938–1942; Dirección Nacional de Estadística: Quito, Ecuador, 1944.
- United Nations. El Desarrollo Económico del Ecuador; Banco Central del Ecuador: Quito, Ecuador, 1953. [Google Scholar]
- Montero, A. Café, Revolución Verde, Regulación y Liberación del Mercado: Costa Rica (1950–2017); Universitat de Barcelona: Barcelona, España, 2018. [Google Scholar]
- Scurlock, J.M.O.; Olson, R.J. NPP Multi-Biome: Grassland, Boreal Forest, and Tropical Forest Sites, 1939–1996, R1. Available online: https://daac.ornl.gov/NPP/guides/NPP_MULTIBIOME.html (accessed on 7 November 2018).
- Cobertura de la Tierra Metodología CORINE Land Cover adaptada para Colombia durante el periodo 2010–2012. Escala 1: 100000. Available online: http://siatac.co/c/document_library/get_file?uuid=a64629ad-2dbe-4e1e-a561-fc16b8037522&groupId=762 (accessed on 7 November 2018).
- DANE. Tercer Censo Nacional Agropecuario—2014; DANE: Bogotá, Colombia, 2016.
- Borda, V.H.; Ram Nader, L.M. Disponibilidad forrajera en pasturas renovadas de Kikuyo, Pennisetum clandestinum Hoechst, con un equipo renovador para tracción animal. Región alto andina de Barragán, Tuluá, Valle del Cauca, Colombia. Acta Agron. 2003, 52, 77–83. [Google Scholar]
- Gómez, I.A.; Gallopin, G.C. Estimación de la productividad primaria neta de ecosistemas terrestres del mundo en relación a factores ambientales. Ecol. Austral 1991, 1, 24–40. [Google Scholar]
- Raich, J.W.; Rastetter, E.B.; Melillo, J.M.; Kicklighter, D.W.; Steudler, P.A.; Peterson, B.J.; Grace, A.L.; Moore III, B.; Vorosmarty, C.J. Potential net primary productivity in South America: Application of a global model. Ecol. Appl. 1991, 1, 399–429. [Google Scholar] [CrossRef] [PubMed]
- Moreno Durango, O.; Padilla Valle, H. Evaluación de Cuatro Gramíneas Tropicales Para la Producción de Leche. Acta Agronómica 1972, 22, 163–183. [Google Scholar]
- Padilla Quintero, A. Estimación de la Productividad Primaria Neta Aérea (PPNA) del Forraje de Pastos para los Sistemas de Producción Ganadera Mediante Sensores Remotos; Universidad del Valle: Cali, Colombia, 2017. [Google Scholar]
- Nutrient Requirements of Horses. Available online: https://nrc88.nas.edu/nrh/ (accessed on 7 November 2018).
- National Research Council. Nutrient Requirements of Swine; National Academies Press: Washington, DC, USA, 1998. [Google Scholar]
- National Research Council. Nutrient Requirements of Sheep; National Academies: Washington, DC, USA, 1985; Volume 5. [Google Scholar]
- Mamoon, R. Goats and Their Nutrition; Manitoba GOAT Association: MacGregor, MB, Canada, 2008. [Google Scholar]
- Varela Martínez, R.; Palacio del Valle, G.; Cañón, J.; Ramírez, E. Economía Agropecuaria de Colombia en 1950; Ministerio de Agricultura: Bogotá, Colombia, 1952.
- Banrepcultural. Boletín de Estadística de Colombia. Available online: http://babel.banrepcultural.org/cdm/ref/collection/p17054coll26/id/94 (accessed on 7 November 2018).
- Hertford, R.; Nores, G.A.; Ardila, J.; Londoño, H.; Rivas Rios, L.; Trujillo, C. Caracterización del Sector Ganadero de Colombia 1953 a 1975; Centro Internacional de Agricultura Tropical (CIAT): Cali, Colombia, 1982. [Google Scholar]
- Encuestas de Sacrificio de Ganado (2010–2018). Available online: https://www.dane.gov.co/index.php/estadisticas-por-tema/agropecuario/encuesta-de-sacrificio-de-ganado/encuesta-de-sacrificio-de-ganado-esag-historicos (accessed on 7 November 2018).
- Etter, A.; van Wyngaarden, W. Patterns of landscape transformation in Colombia, with emphasis in the Andean region. Ambio 2000, 29, 432–439. [Google Scholar] [CrossRef]
- Kalmanovitz, S.; López, E. La Agricultura Colombiana en el Siglo XX; Fondo de Cultura Económica: Bogotá, Colombia, 2006. [Google Scholar]
- Centro de Memoria Histórica Base de datos ¡Basta ya!: Secuestros 1970–2010. Available online: http://www.centrodememoriahistorica.gov.co/micrositios/informeGeneral/basesDatos.html (accessed on 7 November 2018).
- Fischer-Kowalski, M.; Haberl, H. Socioecological Transitions and Global Change: Trajectories of Social Metabolism and Land Use; Edward Elgar Publishing: Cheltenham, UK, 2007. [Google Scholar]
- Steffen, W.; Broadgate, W.; Deutsch, L.; Gaffney, O.; Ludwig, C. The trajectory of the Anthropocene: The great acceleration. Anthr. Rev. 2015, 2, 81–98. [Google Scholar] [CrossRef]
- Kander, A.; Malanima, P.; Warde, P. Power to the People: Energy in Europe over the Last Five Centuries; Princeton University Press: Princeton, NJ, USA, 2014. [Google Scholar]
- González de Molina, M.; Toledo, V.M. The Social Metabolism. A Socio-Ecological Theory of Historical Change; Springer International Publishing: Cham, Switzerland, 2014. [Google Scholar]
- Sieferle, R.P. The Subterranean Forest: Energy Systems and the Industrial Revolution; White Horse Press: Winwick, UK, 2001. [Google Scholar]
- Erb, K.-H.; Krausmann, F.; Gaube, V.; Gingrich, S.; Bondeau, A.; Fischer-Kowalski, M.; Haberl, H. Analyzing the global human appropriation of net primary production—Processes, trajectories, implications. An introduction. Ecol. Econ. 2009, 69, 250–259. [Google Scholar] [CrossRef]
- Etter, A.; McAlpine, C.; Wilson, K.; Phinn, S.; Possingham, H. Regional patterns of agricultural land use and deforestation in Colombia. Agric. Ecosyst. Environ. 2006, 114, 369–386. [Google Scholar] [CrossRef]
- Carbó, E.P. El Caribe Colombiano: Una Historia Regional (1870–1950); Banco de la República: Bogotá, Colombia, 1998.
- Pellegrini, P.; Fernández, R.J. Crop intensification, land use, and on-farm energy-use efficiency during the worldwide spread of the green revolution. Proc. Natl. Acad. Sci. USA 2018, 115, 2335–2340. [Google Scholar] [CrossRef] [PubMed]
- Rudel, T.K.; Coomes, O.T.; Moran, E.; Achard, F.; Angelsen, A.; Xu, J.; Lambin, E. Forest transitions: Towards a global understanding of land use change. Glob. Environ. Chang. 2005, 15, 23–31. [Google Scholar] [CrossRef]
- Etter, A.; McAlpine, C.; Pullar, D.; Possingham, H. Modelling the conversion of Colombian lowland ecosystems since 1940: Drivers, patterns and rates. J. Environ. Manag. 2006, 79, 74–87. [Google Scholar] [CrossRef]
- Cárdenas, E.; Ocampo, J.; Thorp, R. An Economic History of Twentieth-Century Latin America: Volume I: The Export Age; Springer: Berlin, Germany, 2000. [Google Scholar]
- Ocampo, J.A. Café, Industria Y Macroeconomía: Ensayos de Historia Económica Colombia; Fondo de Cultura Económica: Bogotá, Colombia 2015. [Google Scholar]
- Palacios, M. El Café en Colombia, 1850–1970: Una Historia Económica, Social y Política; Áncora: Bogotá, Colombia, 1983. [Google Scholar]
- Palacio, G.; González, J.M.; Yepes, F.; Carrizosa, J.; Palacio, L.C.; Montoya, C.; Márquez, G. Naturaleza en Disputa. Ensayos de Historia Ambiental en Colombia 1850–1995; Universidad Nacional de Colombia: Bogotá, Colombia, 2001. [Google Scholar]
- An Economic History of Twentieth-Century Latin America. Volume 2: Latin America in the 1930s. The Role of the Periphery in World Crisis; Palgrave Macmillan: Basingstoke, UK, 2000.
- Cárdenas, E.; Ocampo, J.; Thorp, R. An Economic History of Twentieth-Century Latin America: Volume 3: Industrialization and the State in Latin America: The Postwar Years; Springer: Berlin, Germany, 2000. [Google Scholar]
- Bértola, L.; Ocampo, J.A. The Economic Development of Latin America Since Independence; OUP: Oxford, UK, 2012. [Google Scholar]
- Villaveces, N.J.; Sánchez, F. Tendencias Históricas y Regionales de la Adjudicación de Baldíos en Colombia 1900–2012; de los Andes, U., Ed.; Serie Documentos Cede; Universidad Del Rosario: Bogotá, Colombia, 2014. [Google Scholar]
- LeGrand, C. Frontier Expansion and Peasant Protest in Colombia, 1850–1936; University of New Mexico Press: Albuquerque, NM, USA, 1986. [Google Scholar]
- Ocampo, J.A. Historia Economica de Colombia; Tercer Mundo Editores: Bogotá, Colombia, 1994. [Google Scholar]
- Arango Restrepo, M. Esquema de Políticas de Reforma Agraria en Colombia. Available online: http://tesis.udea.edu.co/handle/10495/4281 (accessed on 7 November 2018).
- Callejas, A.D. Colombia: La Reforma Agraria y Sus Documentos Fundamentales; Universidad de Cartagena: Cartagena, Colombia, 2002. [Google Scholar]
- Kalmanovitz, S. Economía y Nación: Una Breve Historia de Colombia; Editorial Norma: Bogotá, Colombia, 2003. [Google Scholar]
- Castellanos Sierra, M. La Colonización Estatal en el Caquetá y su Incidencia en la Generación de Conflictos Socio-Ambientales; 2018.
- Urueña, B.M.T. Colonización Campesina en Putumayo–Colombia; 2018.
- Van Ausdal, S. Ni Calamidad ni Panacea: Una Reflexión en Torno a la Historiografía de la Ganadería Colombiana. In El poder de la carne. Historias de ganaderías en la primera mitad del siglo XX en Colombia; Universidad Javeriana-Colciencias: Bogotá, Colombia, 2008; pp. 29–46. [Google Scholar]
- Richani, N. The agrarian rentier political economy: Land concentration and food insecurity in Colombia. Lat. Am. Res. Rev. 2012, 47, 51–78. [Google Scholar] [CrossRef]
- Van Ausdal, S. Pasture, profit, and power: An environmental history of cattle ranching in Colombia, 1850–1950. Geoforum 2009, 40, 707–719. [Google Scholar] [CrossRef]
- Benitez, R.M. La Problemática de la Agricultura Tradicional Campesina; Contraloría General de la República: Bogotá, Colombia, 2001.
- Machado, A. El Mercado de Tierras en Colombia: Una Alternativa Viable? Tercer Mundo: Bogotá, Colombia, 1999. [Google Scholar]
- Salgado, C. Propuestas Frente a las Restricciones Estructurales y Políticas Para la Reparación Efectiva de las Tierras Perdidas por la Población Desplazada; CODHES: Bogotá, Colombia, 2008. [Google Scholar]
- Ballvé, T. Territories of life and death on a Colombian frontier. Antipode 2013, 45, 238–241. [Google Scholar] [CrossRef]
- Borras, S.M., Jr.; Franco, J.C.; Gómez, S.; Kay, C.; Spoor, M. Land grabbing in Latin America and the Caribbean. J. Peasant Stud. 2012, 39, 845–872. [Google Scholar] [CrossRef]
- Grajales, J. The rifle and the title: Paramilitary violence, land grab and land control in Colombia. J. Peasant Stud. 2011, 38, 771–792. [Google Scholar] [CrossRef]
- Giugale, M.; Lafourcade, O.; Luff, C. Colombia: The Economic Foundation of Peace; World Bank Publications: Washington, DC, USA, 2003. [Google Scholar]
- Maher, D. Rooted in violence: Civil war, international trade and the expansion of palm oil in Colombia. New Political Econ. 2015, 20, 299–330. [Google Scholar] [CrossRef]
- Rincón-Ruiz, A.; Pascual, U.; Romero, M. An exploratory spatial analysis of illegal coca cultivation in Colombia using local indicators of spatial association and socioecological variables. Ecol. Indic. 2013, 34, 103–112. [Google Scholar] [CrossRef]
- Borón, V.; Payán, E.; MacMillan, D.; Tzanopoulos, J. Achieving sustainable development in rural areas in Colombia: Future scenarios for biodiversity conservation under land use change. Land Use Policy 2016, 59, 27–37. [Google Scholar] [CrossRef]
- Fajardo, D. La tierra y el poder político; la reforma agraria y la reforma rural en Colombia. Rev. Reforma Agrar. Colon. Coop. 2002, 1, 4–20. [Google Scholar]
- Bucheli, M. Bananas and Business: The United Fruit Company in Colombia, 1899–2000; NYU Press: New York, NY, USA, 2005. [Google Scholar]
- Bucheli, M. Enforcing Business Contracts in South America: The United Fruit Company and Colombian Banana Planters in the Twentieth Century. Bus. Hist. Rev. 2004, 78, 181–212. [Google Scholar] [CrossRef]
- Ellis, F. Las Transnacionales del Banano en Centroamérica; Universidad de Costa Rica: San José, Costa Rica, 1983. [Google Scholar]
- Delgadillo-Vargas, O. La Caña de Azúcar en la Historia Ambiental del valle Geográfico del río Cauca (1864–2010); Universida del Javeriana de Colombia: Cali, Colombia, 2014. [Google Scholar]
- GRECO. El Crecimiento Económico Colombiano en el Siglo XX: Aspectos Globales; Banco de la República: Bogotá, Colombia, 1999.
- Ramírez Bacca, R. Clase obrera urbana en la industria del café. Escogedoras, trilladoras y régimen laboral en Antioquia, 1910–1942. Rev. Desarro. Soc. 2010, 66, 115–144. [Google Scholar]
- Meisel-Roca, A.; Ramírez-Giraldo, M.T.; Santos-Cárdenas, D. Socioeconomic Determinants and Spatial Convergence of Biological Well-Being: The Case of Physical Stature in Colombia, 1920–1990; Banco de la República: Bogotá, Colombia, 2018.
- Jarvis, A.; Touval, J.L.; Schmitz, M.C.; Sotomayor, L.; Hyman, G.G. Assessment of threats to ecosystems in South America. J. Nat. Conserv. 2010, 18, 180–188. [Google Scholar] [CrossRef]
- Vélez Torres, I. Water Grabbing in the Cauca Basin: The Capitalist Exploitation of Water and Dispossession of Afro-Descendant Communities. Water Altern. 2012, 5, 431–449. [Google Scholar]
- Marull, J.; Delgadillo, O.; Cattaneo, C.; La Rota, M.J.; Krausmann, F. Socioecological transition in the Cauca river valley, Colombia (1943–2010): Towards an energy-landscape integrated analysis. Reg. Environ. Chang. 2018, 18, 1073–1087. [Google Scholar] [CrossRef]
- Castiblanco, C.; Etter, A.; Aide, T.M. Oil palm plantations in Colombia: A model of future expansion. Environ. Sci. Policy 2013, 27, 172–183. [Google Scholar] [CrossRef]
- de Fraiture, C.; Giordano, M.; Liao, Y. Biofuels and implications for agricultural water use: Blue impacts of green energy. Water Policy 2008, 10, 67–81. [Google Scholar] [CrossRef]
- Pardo, L.E.; de Oliveira Roque, F.; Campbell, M.J.; Younes, N.; Edwards, W.; Laurance, W.F. Identifying critical limits in oil palm cover for the conservation of terrestrial mammals in Colombia. Biol. Conserv. 2018, 227, 65–73. [Google Scholar] [CrossRef]
- Castiblanco, C.; Etter, A.; Ramirez, A. Impacts of oil palm expansion in Colombia: What do socioeconomic indicators show? Land Use Policy 2015, 44, 31–43. [Google Scholar] [CrossRef]
- Colombia Rural, Razones Para la Esperanza. Informe Nacional de Desarrollo Humano 2011. Available online: http://www.undp.org/content/dam/colombia/docs/DesarrolloHumano/undp-co-ic_indh2011-parte1-2011.pdf (accessed on 7 November 2018).
- Centro Nacional de Memoria Histórica. Basta ya! Colombia: Memorias de Guerra y Dignidad; Centro Nacional de Memoria Histórica: Bogotá, Colombia, 2013.
- Armenteras, D.; Rodríguez, N.; Retana, J.; Morales, M. Understanding deforestation in montane and lowland forests of the Colombian Andes. Reg. Environ. Chang. 2011, 11, 693–705. [Google Scholar] [CrossRef]
- Castellanos-Castro, C.; Newton, A.C. Environmental heterogeneity influences successional trajectories in Colombian seasonally dry tropical forests. Biotropica 2015, 47, 660–671. [Google Scholar] [CrossRef]
- Dávalos, L.M.; Bejarano, A.C.; Hall, M.A.; Correa, H.L.; Corthals, A.; Espejo, O.J. Forests and drugs: Coca-driven deforestation in tropical biodiversity hotspots. Environ. Sci. Technol. 2011, 45, 1219–1227. [Google Scholar] [CrossRef]
- Chadid, M.A.; Dávalos, L.M.; Molina, J.; Armenteras, D. A Bayesian spatial model highlights distinct dynamics in deforestation from coca and pastures in an Andean biodiversity hotspot. Forests 2015, 6, 3828–3846. [Google Scholar] [CrossRef]
- Armenteras, D.; Rudas, G.; Rodriguez, N.; Sua, S.; Romero, M. Patterns and causes of deforestation in the Colombian Amazon. Ecol. Indic. 2006, 6, 353–368. [Google Scholar] [CrossRef]
- Dymond, C.C.; Spittlehouse, D.L. Forests in a Carbon-Constrained World. Available online: https://www.for.gov.bc.ca/hfd/pubs/Docs/En/En92.pdf (accessed on 7 November 2018).
- Clerici, N.; Richardson, J.E.; Escobedo, F.J.; Posada, J.M.; Linares, M.; Sanchez, A.; Vargas, J.F. Colombia: Dealing in conservation. Science 2016, 354, 190. [Google Scholar] [CrossRef] [PubMed]
- Baptiste, B.; Pinedo-Vasquez, M.; Gutierrez-Velez, V.H.; Andrade, G.I.; Vieira, P.; Estupiñán-Suárez, L.M.; Londoño, M.C.; Laurance, W.; Lee, T.M. Greening peace in Colombia. Nat. Ecol. Evol. 2017, 1, 102. [Google Scholar] [CrossRef] [PubMed]


© 2018 by the authors. Licensee MDPI, Basel, Switzerland. This article is an open access article distributed under the terms and conditions of the Creative Commons Attribution (CC BY) license (http://creativecommons.org/licenses/by/4.0/).
Share and Cite
Urrego-Mesa, A.; Infante-Amate, J.; Tello, E. Pastures and Cash Crops: Biomass Flows in the Socio-Metabolic Transition of Twentieth-Century Colombian Agriculture. Sustainability 2019, 11, 117. https://doi.org/10.3390/su11010117
Urrego-Mesa A, Infante-Amate J, Tello E. Pastures and Cash Crops: Biomass Flows in the Socio-Metabolic Transition of Twentieth-Century Colombian Agriculture. Sustainability. 2019; 11(1):117. https://doi.org/10.3390/su11010117
Chicago/Turabian StyleUrrego-Mesa, Alexander, Juan Infante-Amate, and Enric Tello. 2019. "Pastures and Cash Crops: Biomass Flows in the Socio-Metabolic Transition of Twentieth-Century Colombian Agriculture" Sustainability 11, no. 1: 117. https://doi.org/10.3390/su11010117
APA StyleUrrego-Mesa, A., Infante-Amate, J., & Tello, E. (2019). Pastures and Cash Crops: Biomass Flows in the Socio-Metabolic Transition of Twentieth-Century Colombian Agriculture. Sustainability, 11(1), 117. https://doi.org/10.3390/su11010117