Article

Influence of Livelihood Capitals on Livelihood Strategies of Herdsmen in Inner Mongolia, China

1
State Key Laboratory of Grassland Agro-Ecosystems, Key Laboratory of Grassland Livestock Industry Innovation, Ministry of Agriculture and Rural Affairs, College of Pastoral Agriculture Science and Technology, Lanzhou University, Lanzhou 730020, China
2
Institute of Grassland Research, Chinese Academy of Agricultural Sciences/Key Laboratory of Grassland Ecology and Restoration, Ministry of Agriculture, 120 East Wulanchabu Street, Hohhot, Inner Mongolia 010010, China
3
Institute of Agricultural Information, Chinese Academy of Agricultural Sciences, Beijing 100081, China
*
Authors to whom correspondence should be addressed.
Sustainability 2018, 10(9), 3325; https://doi.org/10.3390/su10093325
Submission received: 12 August 2018 / Revised: 8 September 2018 / Accepted: 12 September 2018 / Published: 18 September 2018

Abstract

:
Herders’ living strategy is a function of the capitals at their disposal which also serve as a buffering mechanism when shocks arise. An insight into the connection between livelihood strategies and capitals owned by herders provides guidance to recognize their living situation. This study evaluated the different livelihood capitals of herders across the five ecological types (meadow, typical, desert, sandy, and desert steppe) in Inner Mongolia region of China, using the sustainable livelihood framework approach. An evaluation index was developed and used to investigate how the livelihood capitals of herders affects preferential selection of livelihood strategies using multinomial logit model. Results indicate that: (1) The stocks of human and social capitals were higher while those for natural, physical, and financial capitals were lower. (2) There were significant regional differences in the livelihood capital stock of herders’ families with zonal horizontal decrease from east to west. (3) Natural capitals affects the preferential selection of livelihood strategies by herders positively implying that possession of more natural capitals by herders leads to selection of livelihood strategies that are devoid of pastoral production; the preferred livelihood strategy of herders was significantly negatively affected by physical and financial capitals, an indication that, when herders possess more physical and financial capitals, they tend to choose livelihood strategies that involve pastoral production. The living strategy of herders was not affected by human and social capitals. (4) Production of rented pasture capital index affected the preferential selection of livelihood strategies by herders positively while cash income capital index had negative influence on how pastoralists select their livelihood strategies. In conclusion, the total livelihood capital of herders in Inner Mongolia is low, and there is perceived benefit in the differentiation of herders families into petty-herders and non-grazing families from the perception of natural resource management and sustainability. This requires income diversification programs such as capacity building and business education that will aid the smooth transition of households to these less resource exploiting livelihood strategies.

1. Introduction

Livelihood can be defined as a measure of the set of actions taken by people within their capacity and capitals to make a living by maintaining highly diverse portfolio of activities, while livelihood capitals cover natural, physical, human, social and financial resources that are critical to the survival of people in response to stresses and shocks while not compromising the natural resource base (Ansoms and McKay, 2010; Mutenje et al., 2010; Ellis, 2000; Scoones, 1998) [1,2,3,4]. Livelihood entails not only the activities that make up how people live, but also the resources that guarantees their satisfactory living, the risk involved in managing those resources, and the policies that supports or oppose their pursuit of good living (Mutenje et al., 2010) [2]. Livelihood capitals are capable of being stored, exchanged and transferred in the process of generating income for the household (Ansoms and Mckay, 2014; van den Berg, 2010; Waleleign et al., 2016; Waleleign, 2017); [5,6,7,8,9], and livelihood strategies are the sequence of activities and choices made by individuals with the objective of attaining livelihood goals, including but not limited to production and financing of investment strategies [10,11]. However, these strategies change constantly depending on the asset portfolios and economic shocks experienced by households (Mutenje et al., 2010) [2].
Generally, the nature of livelihood capitals held by a family is considered in making decision about available livelihood strategies, and the risk associated with such decision. Meanwhile, herders in Inner Mongolia region of China majorly depends on grassland resources for their survival (Conte, 2015) [12] and they employ the use of family labor and other capitals to achieve their objectives on these natural resources. To attain a positive livelihood result, individuals need to possess different livelihood capitals at hand. However, a diversified livelihood which signifies rational response to limited opportunity for specialization (Iiyama et al., 2008) [13] cannot be attained where only a single type of livelihood capital is the choice available. The livelihood capitals possessed by households is a strong determinant of how to strategize towards achieving its livelihood objectives such as income, shelter, security, and general welfare [14]. Moreover, choices become numerous with increased livelihood capitals, in addition to capability to substitute among livelihood strategies which are the product of the interaction between constraint and choice [2]. Thus, studies on the relationship between farm household livelihood strategies and livelihood capitals have received much attention in recent years (Walelign et al., 2016; Peng et al., 2017) [8,15].
Su et al. (2009) found that the choice of livelihood strategy is largely dependent on the allocation of livelihood capitals by households when the relationship between livelihood assets and livelihood strategies of farm households were investigated [16]. The authors therefore suggested that government needs to strengthen technological support and provide fund to improve farmers’ competency to cope with natural disasters. Zhao et al. (2011) examined the correlation between livelihood assets on the choice of livelihood strategies [17], while Zhang et al. (2013) reported on how herders livelihood assets shape their strategy to take part in tourism activities at the Kanas scenic ecological tourism spot in Xinjiang [18]. Similarly, Shi et al. (2014) used multivariate logistic regression to analyze the relationship between the livelihood assets of farm households and their living strategies [19]. Using sustainable livelihood framework approach, Zhao et al. (2015) set up livelihood evaluation indices to assess the status quo of livelihood capital for basin and mid-level farmers of Yuanjiang dry-hot valley from field surveyed data, and logistic regression model was adopted to explore the impact of livelihood capital on livelihood strategies [20]. Wu (2015) reported that the position of different livelihood capitals determines the choice of farmers’ livelihood strategies, and the ability to achieve diversified strategies of living depends on the livelihood of farmer-owned capitals [21].
Furthermore, many other empirical studies have been reported on the dynamics of livelihood strategies in relation to livelihood capitals, assets, income, and rural poverty (Walelign et al., 2016; Ansoms and Mckay 2010) [1,8]. Through a conceptual debate, these studies have shown that human capital, financial capital, natural capital, social capital, physical capital, household structure, labor quality, and ecological policies are the major drivers of farmers’ choice of livelihood strategy (Iiyama et al., 2008; Ansoms and McKay, 2010; Mutenje et al., 2010; Angelson et al., 2014; Peng et al., 2017) [1,2,6,13,15]. Berhanu et al. (2007) [22] noted that farmers are also motivated to diversify when labor surplus arise. Given that rural livelihood basically depends on the exploitation of environmental resources (Walelign, 2016) [23], rural poverty cannot be trickled-down through a uniform package of policy measures (Ansoms and McKay, 2010) [1]. Therefore, decision makers need to pay more attention to sub-groups of the rural population while formulating policies targeted at poverty reduction and promotion of sustainable livelihood in rural areas (Nielsen et al., 2013) [24].
Despite the abundance of research on the relationship between farmers’ livelihood capital and livelihood strategies (Iiyama et al., 2008; Ansoms and McKay, 2010; Mutenje et al., 2010; Peng et al., 2017) [1,2,13,15,23,25,26,27,28,29], the connection between livelihood diversification strategies of herding households and their livelihood capitals in similar grassland environment and its implication for policy, sustainable environment and livelihood have rarely been investigated empirically. This knowledge gap was addressed in this research. However, relative to other relevant research areas, e.g., farming areas, China’s pastoral areas (especially in Inner Mongolia) have their own characteristic features (such as severe grassland degradation, multiple grassland types and land tenure). Therefore, the pertinent research conclusions are not necessarily rational and apt for the prevailing conditions in these pastoral areas, and this implies that the specific relationship between herders livelihood capital and selection of livelihood strategies in China’s pastoral areas is due much attention. Thus, the need for a detailed community-level case studies of herders’ livelihood strategies in relation to livelihood capitals to address policy concerns and environmental sustainability cannot be overemphasized (Iiyama et al., 2008) [13].
The types of strategies adopted by rural households to achieve their livelihood objectives and the factors that shape these strategies to attain environmental protection and improvement in rural livelihood have been reported (Peng et al., 2017) [15]. There exists a difference in policy, culture, and other relevant areas related to conducting research across the countries on the globe, and this will pave the way for disparity when various types of herders livelihood capitals are specifically quantified. This suggests that there is need to establish an indicator system for herders livelihood capitals that conforms to the actual situation in Inner Mongolia pastoral areas to clarify the relationship between these capitals and the selection of livelihood strategies by the pastoralists to advance our understanding and enhance future research in these areas. Therefore, the objectives of this study were: (1) to evaluate the stock of herders livelihood capitals across livelihood strategies and grassland types; (2) to investigate how livelihood capitals shape the selection of livelihood strategies by herders; and (3) to determine the influence of livelihood capital indices on the choice of herders livelihood strategies in Inner Mongolia. We used stratified random sampling to select surveyed households and structured questionnaires were used for interviews. We developed an approach for categorizing households into livelihood strategies pursued by herders in Inner Mongolia region of China with the aim of understanding their livelihood features, and how different livelihood capitals drives the adoption of categorized livelihood strategies and their ensuing income structure. Finally, in this paper, we provide policy suggestions to enhance both livelihood and environmental sustainability.

2. Material and Methods

2.1. Data Collection

Households were selected using stratified random sampling and surveys were carried out to examine herders’ livelihood capitals such as financial, social, natural, human, and physical capitals; livelihood assets; and livelihood strategies using structured questionnaires [30]. Five grassland types, meadow, typical, sandy, desert, and desert steppe, were selected and three counties were selected from each grassland type (Figure 1). Subsequently, 10 households were randomly sampled from five selected villages from each county. From April to October 2015, 895 households were surveyed across the five grassland types by way of interviews using structured questionnaires, leading to 848 valid questionnaires.

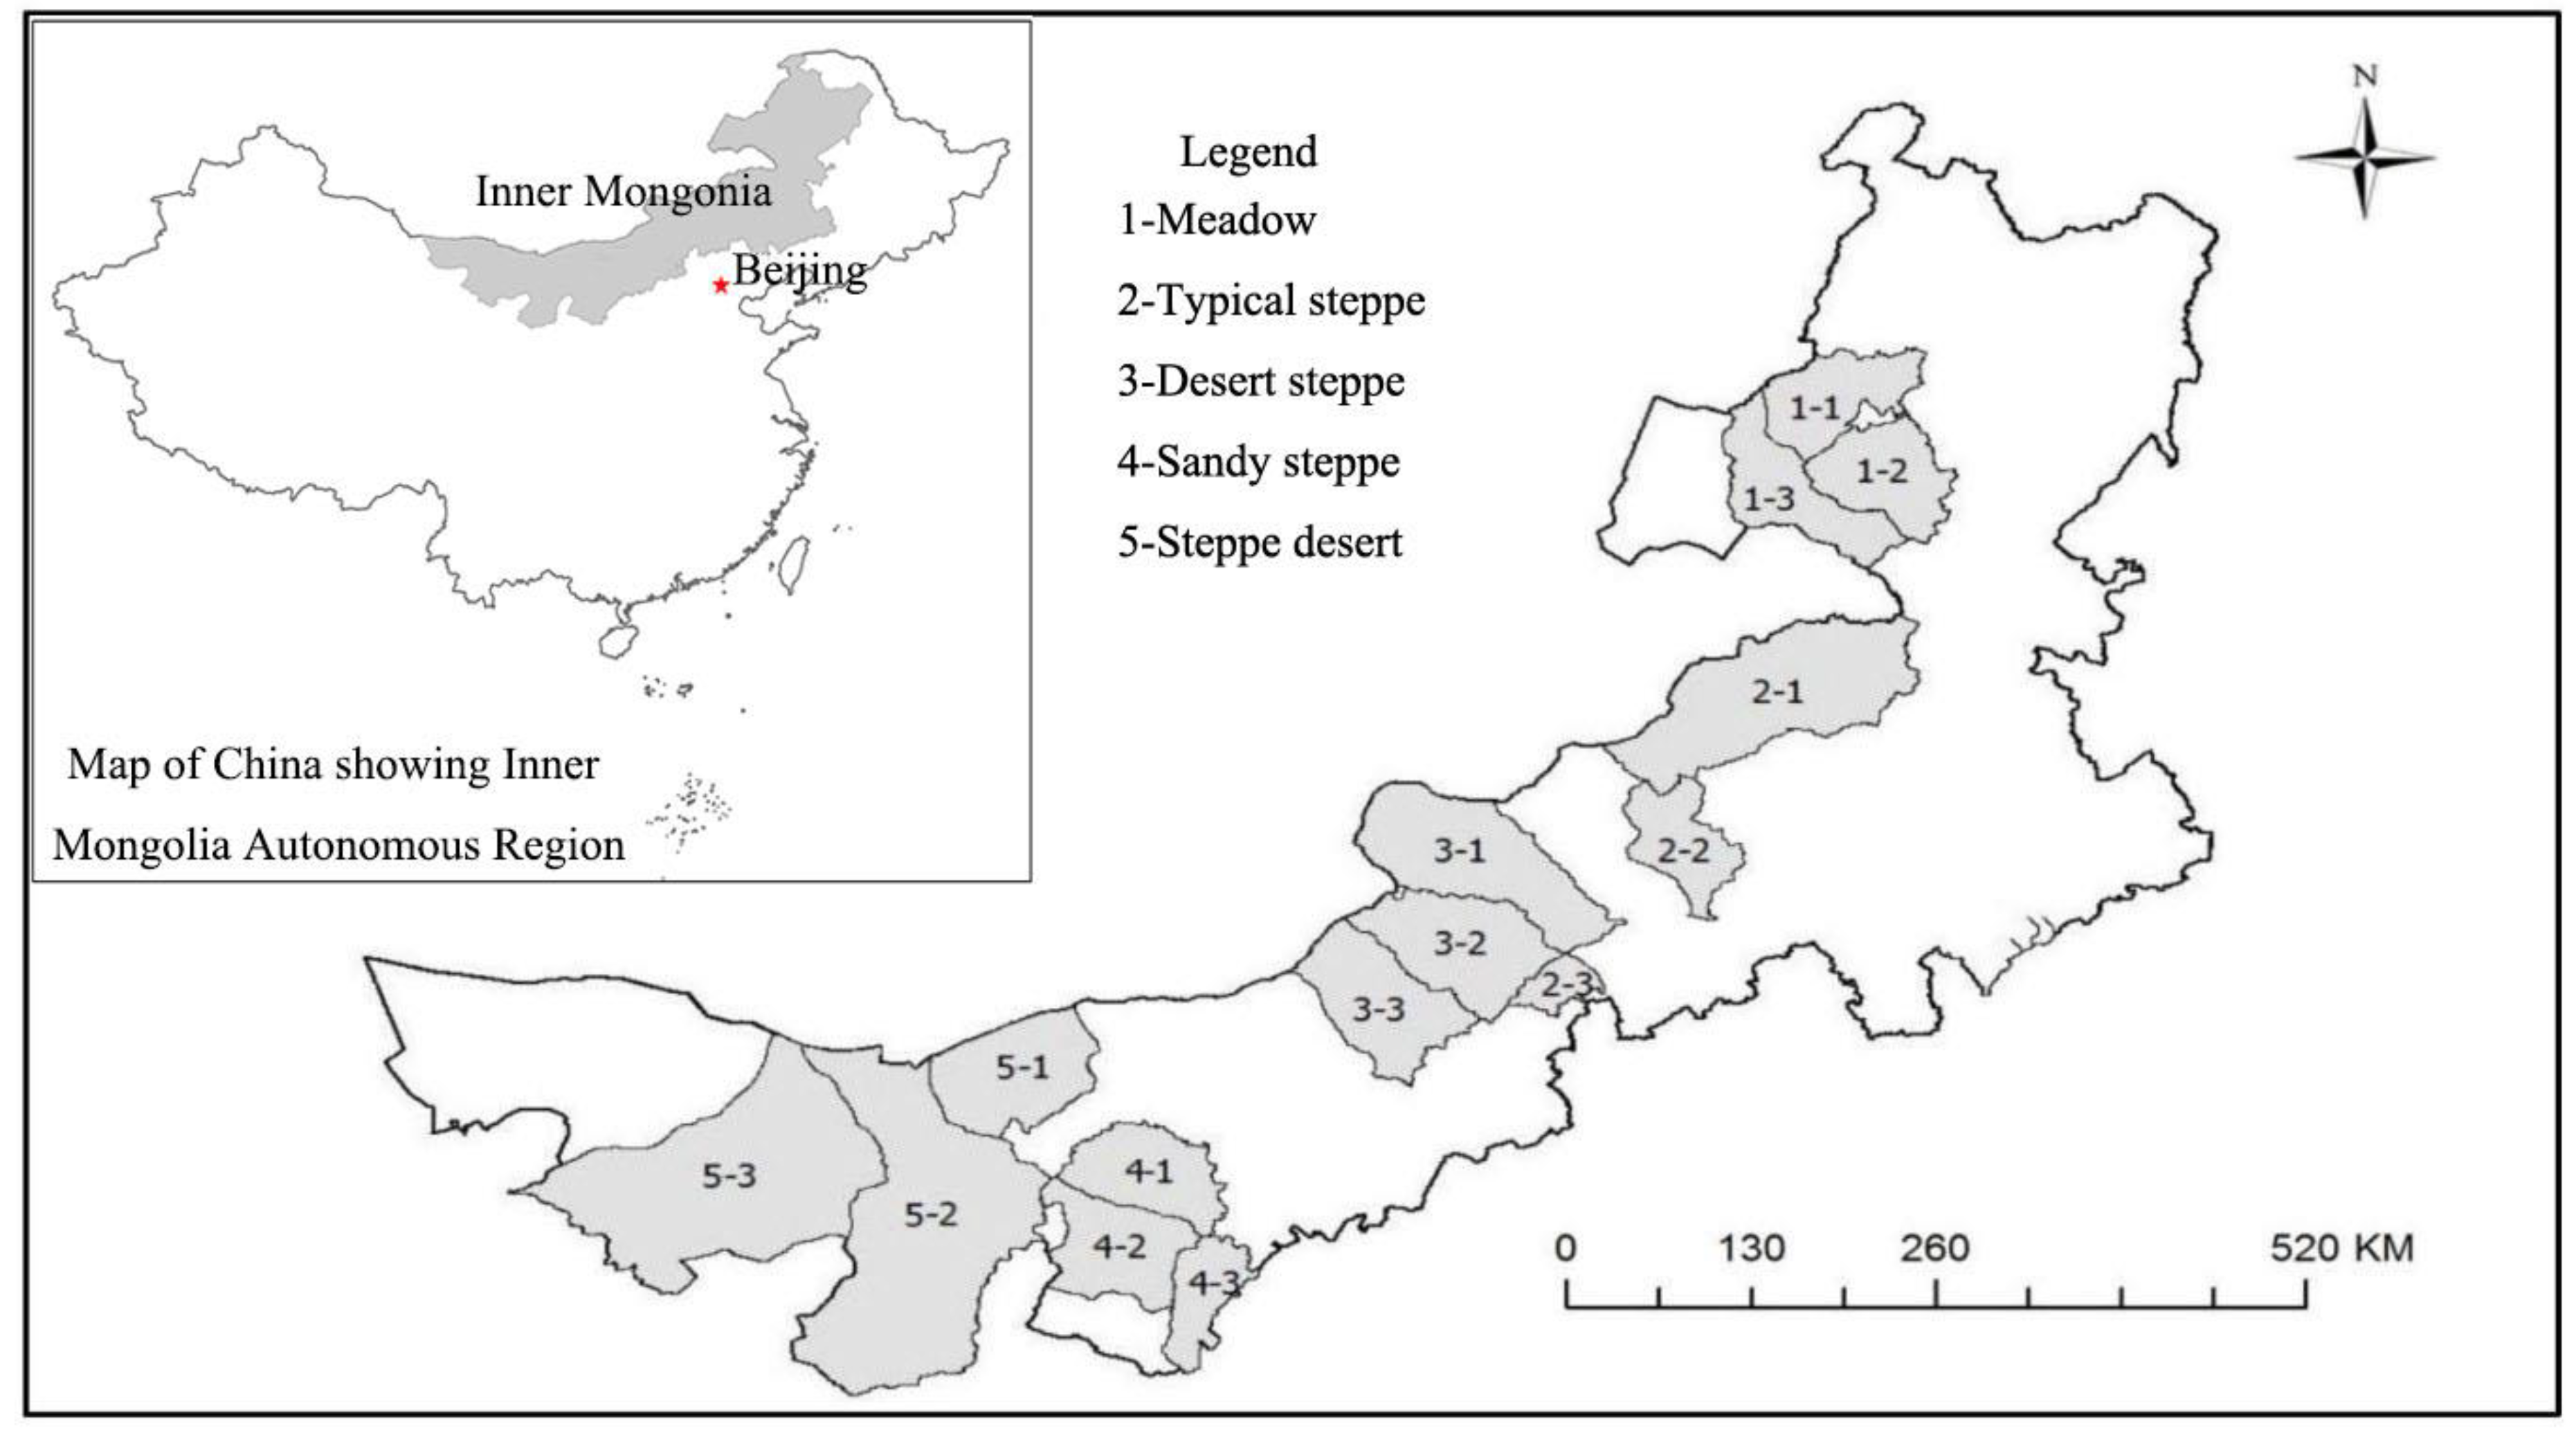
2.2. Overview of the Study Areas

Inner Mongolia lies in the north of the People’s Republic of China. It covers an area of 1,183,000 square kilometers, accounting for 12.3% of China’s land area. The average altitude is about 1000 m in the southeast of the Mongolian plateau and its peripheral zone in central Asia. Climate type is diverse, precipitation is less and not uniform. By the end of 2017, the total population was 25.28 million with total grassland area of 86.667 million hectares, accounting for about 60% of the land area of Inner Mongolia. From east to west, the ecotypes are: meadow steppe, typical steppe, desert steppe, sandy steppe, and steppe desert.
Chen Barag Banner, Xin Barag Left Banner, and Ewenke Banner were selected as the survey research areas for meadow steppe. The region belongs to the continental steppe climate in the middle temperate zone. Annual average temperature is 1.1 °C, average annual frost free period is 100–120 days, and the average annual precipitation is 350 mm.
Xianghuang Banner, Xilinhot, and East Ujimqin Banner were selected as the typical steppe study area. The region belongs to the semi-arid continental climate type in the middle temperate zone. Annual average temperature is 0–3 °C, average annual frost free period is 110–130 days and average annual precipitation is 295 mm.
Siziwang Banner, Sunite Right Banner, and Sunite Left Banner were selected as the research areas for desert steppe. The region belongs to the arid continental climate type in middle temperate zone. Annual average temperature is 3.8 °C, average annual frost-free period is 135 days and average annual precipitation is 170–190 mm.
Hangjin Banner, Otog Banner, Uxin Banner of Ordos city were the research areas for sandy grassland. The region belongs to the semi-arid plateau continental climate type in the middle temperate zone. Annual average temperature is 6.8 °C, average annual frost free period is 155 days, and the average annual precipitation is 245 mm.
Alxa Right Banner, Alxa Left Banner, and Urad Back Banner were selected as the study research areas for steppe desert. The region belongs to the typical continental climate type in the middle temperate zone. Annual average temperature is 6–8.5 °C, annual average frost free period is 130–165 days, and, due to the influence of the southeast monsoon, the rainfall decreases from more than 200 mm in the southeast to less than 40 mm in the northwest.

2.3. Development of Livelihood Capital Index

Relative to the characteristic features of the study area, such as natural resources, culture, ecological environment [11], and expert opinion and literature search, an evaluation index system was designed (see Table 1) for herders livelihood capitals [31,32,33,34,35,36]. The table is divided into three hierarchies. The first is the criterion section where the different types of capitals (human capital, natural capital, physical capital, financial capital, and social capital) considered in the system of evaluation index are listed. The second section highlights the evaluation indices adopted. The third section defines the units of the evaluation indices, and explains the equation for calculating each index. The indices selected are those reported as the core indices for evaluating livelihood assets with scientific value [11,37]. The main contents of the criterion section are as follows: (1) human capital includes health status of household members, educational level of the household members and household labor capacity; (2) natural capital includes productivity of contracted pasture and productivity of rented pasture; (3) physical capital includes livestock ownership, housing condition, shed condition and fixed assets; (4) financial capital includes cash incomes and loan; and (5) social capital includes cooperation and gift expenditure.

2.4. Weighted Index Values of Livelihood Capitals

Following the use of evaluation index system as explained above, livelihood capitals were also measured using entropy method. In thermodynamics, entropy is the measure of disorderliness in a physical system, and it is widely applied to many fields, e.g., economics and biological sciences [39,40,41]. The concept of entropy was introduced into information theory by Shannon in 1948 with the aim of measuring how information could be distorted, i.e., the uncertainty associated with information from the source. Thus, entropy related to information is termed Shannon entropy and is inversely proportional to the probability of random events [42]. To some extent, an element of subjectivity exists in the indicators of livelihood assets and this could lead to incomplete or wrong information. To overcome this challenge, the weights of livelihood capital indicators were pinned down using the entropy method. The results are shown in Table 2.
Step 1: Due to differences in the weight, dimension, and range of values obtained from the survey data, the extremum method was used to normalize the values of the measurement indicators and calculated as follows:
x i j = ( x m a x x m i n ) / ( x i j x m i n )
where x i j is the variable data of the ith measurement index of the jth sample after standardization; x i j is the ith measurement index of the jth sample; x m a x is the maximum value of the sample variable; and x m i n is the minimum value of the sample variable.
Step 2: The specific gravity p i j of the ith index to be evaluated under item jth was calculated as follows:
p i j = x i j / i = 1 m x i j
Step 3: The entropy value e j of the jth evaluation index was calculated as follows:
e j = 1 / l n m i = 1 m p i j l n p i j
Step 4: The weight of jth item evaluation index was calculated as follows:
w j = ( 1 e j ) / i = 1 n ( 1 e j )
Step 5: The weight of each indicator was calculated using the formula:
W = i = 1 n w j x i j

2.5. Classification of Livelihood Strategies

To our knowledge, two main classifications exist for herders livelihood strategies. Following a rural farm household survey that was carried out in 2004, the State Statistics Bureau of China came up with a method that classifies households who derive 90% of their income from farming as farm households, those who earn more than 90% of their income from non-farming activities as non-farm households, and those whose non-agricultural income is between 10% and 90% of their income as part-time households [43]. The second method was developed by the Institute of Rural Development, Chinese Academy of Social Sciences in 2002 and described by Liu et al. [11], and entails regulation of farm household income to 95% of total household income. In this study, we used the percentage of grazing income (sales of livestock and their by-products, e.g., wool and milk) in herders total income to classify their livelihood strategy into: herders whose grazing income accounts for more than 90% of total family income are classified as herders families; herders whose grazing income accounts for 10–90% of total family income are classified as petty-herders families; and those whose grazing income accounts for less than 10% of total family income are identified as non-grazing families.

2.6. Model Construction

The livelihood strategies of herders are classified into three: continuous grazing (herders families), engaging in business (petty-herders families) and engaging in non-grazing occupations (non-grazing families). Thus, multinomial logit model was adopted [11,44]. The probability that one of the livelihood strategies will be chosen by herders is as follows:
p = e b j m x m j = 1 3 e b j m x m ,         j = 1 ,   2 ,   3
Assume that herders have the following options as the available choices of livelihood strategies: (1) continuing to graze; (2) engage in business; and (3) settling for non-grazing occupations. The latent variable function expression that herders select the livelihood strategy of (j = 1, 2, 3) is as follows:
L n ( p y j p y 1 ) = α j + m = 1 i b j m x m ,         j = 2 ,   3
When evaluating the model, j = 1 (herders families livelihood strategy) was taken as the reference term, so that the following two logit formulas can be obtained.
ln ( p y 2 / p y 1 ) = b 210 + b 211 x 1 + , , + b 21 m x i
ln ( p y 3 / p y 1 ) = b 310 + b 311 x 1 + , , + b 31 m x i
where p y 1 is herders families, p y 2 is petty-herders families, p y 3 is non-grazing families, and x 1 ,     x 2 ,   , x i are explanatory variables. j = 2, α j = b 20 ; j = 3, α j = b 30 , b 210 and b 310 are constants, and b 211 , b 21 m and b 311 , b 31 m are estimated coefficients. The estimated coefficients were used to explain the observed changes in dependent variable caused by a unit change in corresponding independent variables. If the estimated coefficient is greater than 0, the incidence rate increases with an increase in the corresponding independent variables while other variables remain unchanged.

3. Results

3.1. Livelihood Capital Appraisal

3.1.1. Evaluation of Herders Livelihood Capitals across Livelihood Strategies

In total, the values recorded for human, natural, physical, financial, and social capitals are 0.468, 0.169, 0.158, 0.150, and 0.483, respectively (Table 3). The result showed that the stocks of human and social capitals were higher while those for natural, physical, and financial capitals were lower. Values recorded for the total livelihood capitals of herders were generally low, possibly due to downward economic trend and constrained livelihood capital resources in the study area. The abundance of households’ human (0.453) and social capital (0.483) signifies that herders could have better participation in agriculture in the future. In contrast, natural (0.169), physical (0.158), and financial capitals (0.150) were observed to be deficient and these point in the negative direction for modern agricultural production practice. Similarly, herders who lack natural, physical, and financial capitals are incapacitated to return to the rural areas to engage in agricultural production.
There was a difference in the total amount and structure of the livelihood capitals of herders possessing multiple livelihood strategies. The total value of herders livelihood capital is in the order: herders families (1.490) > petty-herders families (1.435) > non-grazing families (1.234). Herders families possess relatively abundant human (0.490), physical (0.176), financial (0.184), and social capitals (0.488); petty-herders families had more abundant natural capital (0.151); and non-grazing families recorded lower values for all types of livelihood capitals. The higher is the proportion of grazing income in total family income, the more abundant is the stock of livelihood capitals, which indicates that having different livelihood strategies leads to acquisition of multiple livelihood capitals.

3.1.2. Evaluation of Herders Livelihood Capitals across Grassland Types

The total, natural, physical, financial, and social capitals significantly (p < 0.01) differ across the grassland types. The decreasing order for the total livelihood capital of herders is: meadow steppe (1.546) > typical steppe (1.515) > desert steppe (1.388) > sandy steppe (1.363) > steppe desert (1.313) (Table 4). Our result revealed significant differences in the livelihood capital stock of herders families on zonal basis with decreasing trend from east to west in Inner Mongolia, which is consistent with an earlier report [37].

3.1.3. Evaluation of Herders Livelihood Strategies across Grassland Types

Across the grassland types, the proportion of petty-herders families was the highest 57.86%, with a total of 457; herders families were second, with 284 households accounting for 33.49%; and non-grazing families were the fewest, with 107 households making up 12.62% of the total household (Table 5). In desert steppe, herders and petty-herders families dominate among the livelihood strategies while petty-herders and non-grazing families prevailed in steppe desert. The probable explanation for this is that grassland productivity fluctuates with the occurrence of natural disaster, with consequent less stability in livestock production and market situation. In addition, each herding household has a large grassland area which guarantees higher grassland protection income from the eco-compensation subsidy policy.

3.1.4. Evaluation of Herders Income Structure across Livelihood Strategies

The total income of herders families was 230,520 RMB; for petty-herders’ families was 123,820 RMB; and for non-grazing families was 48,670 RMB (Table 6). The total income of herders families was higher than that for petty-herders families and non-grazing families indicating that the living strategy of herders family ranks first in relation to income.
According to the statistical results, the proportion of grazing income was the highest 81.24%, with a total of 145,170 RMB; government transfers income was the second with 22,510 RMB accounting for 15.51%; property income was the third, with 3230 RMB accounting for 2.23%; and non-grazing income was the lowest, with a total of 1470 RMB, accounting for 1.02%, which is mainly from shopping and commercial services (Table 6). Herder families derive their income mainly from grazing and government transfers which signifies lack of multiple income sources for pastoralists in Inner Mongolia.

3.2. Model Result

Modeling was carried out using SPSS 19.0. The result shows that the likelihood ratio chi-square values of the models are 129.127 and 511.797 and the degrees of freedom are 10 and 24, with p value > 0.01. The test result shows that the overall goodness of fit of the models are good, which indicates that the partial regression coefficient of independent variables have a remarkable ability to explain the dependent variables. This shows the appropriateness of the model adopted in this study. The results of the models are shown in Table 7 and Table 8 with continuous grazing designated as the reference. There were variations in the effect of herders’ livelihood capital on selection of livelihood strategies.

3.2.1. Effect of Herders Livelihood Capitals on Livelihood Strategies

(1)    Human capital appraisal
Human capital encompasses variables such as health and labor. All other capitals are dependent on the quantity and quality of human capital possessed by households [45], and it is the core determinant of how herders pursue different means and goals of livelihood. Theoretically, owning different human capital has a marked effect on how herding households allocate livelihood capitals. However, our empirical analysis shows that herders’ choice of livelihood strategy is not affected by human capital. It is probable that most young people choose to go out to work, while those engaged in animal husbandry production are mainly the elderly, who live in pastoral areas for a long time, with strong Mongolian communication skills and weak communication skills in mandarin. Therefore, they prefer relatively stable lifestyles and livelihood strategies.
(2)    Natural capital appraisal
For both petty-herders and non-grazing families, natural capital brings forth a positive effect on their livelihood strategies. Our finding indicates that, where continuous grazing (herder families) is taken as the reference, possession of more natural capital by herder families leads to higher probability of engaging in business or diverting into non-grazing occupations than engaging in continuous grazing.
(3)    Physical capital appraisal
Physical capital had significant negative effect on herders preferred strategy of living for petty-herders and non-grazing families relative to continuous grazing designated as the reference. Our findings show that possession of more physical capital by herders is an indication of their preference to settle for continuous grazing over and above engaging in business and non-grazing occupations. This result affirms that the physical capital of herders serves as a requisite need that guarantees household engagement in pastoral production and living. Generally, the acquisition of state-of-the-art tools by herders is instrumental to pastoral production, thereby motivating herders to choose pastoral lifestyle.
(4)    Financial capital appraisal
Herders’ choice of livelihood strategy was significantly negatively affected by financial capital for petty-herders and non-grazing families. This implies that herders with more financial capital prefer to choose continuous grazing rather than engaging in business or non-grazing occupation. From this point of view, financial capital plays a vital role in herders’ decision to engage in business or settle for non-grazing living strategy. Specifically, financial capital refers to the disposable funds and different borrowing portfolios of herder families. Our result shows that the total income of herders families was 230,525 RMB, for petty-herders families was 120,478 RMB, and for non-grazing families was 48,673 RMB, indicating that herders who engage in continuous grazing recorded higher income compared to others.
(5)    Social capital appraisal
Social capital includes common resources required by herders to attain satisfactory living strategies, such as family support, relationship among villagers, and other social norms within the society. In theory, where herders possess varied social capital, this exerts a positive influence on how other livelihood capitals are allocated. However, in this study, the effect of social capital was not observed on the living strategies of herders.

3.2.2. Effect of Livelihood Capital Indices on Livelihood Strategies

(1)    Appraisal of human capital evaluation indices
Household labor capacity had significant positive effect on herders preferred strategy of living for non-grazing families and non-significant positive effect on herders preferred strategy of living for petty-herders families. It is probable that majority of people with strong labor ability are between 18 and 60 years old, and mainly choose to go out to work to increase their income.
Educational level had non-significant negative effect on preferred strategy of living for petty-herders families and non-significant positive effect on preferred strategy of living for non-grazing families relative to continuous grazing families designated as the reference. This might be due to the intergenerational influence of family livelihood strategy selection where petty-herders families tend towards continuous grazing, while non-grazing families are inclined towards non-grazing livelihood strategy.
(2)    Appraisal of natural capital evaluation indices
For both petty-herders and non-grazing families, production of rented pasture capital recorded a positive effect on their livelihood strategies while production of contracted pasture had significant negative effect on herders preferred strategy of living for petty-herders families. Grassland is the basis of all productive activities in pastoral areas and this is dependent on the area of pastures owned by herders. Therefore, herders having more pasture areas are more likely to engage in continuous grazing livelihood strategy.
(3)    Appraisal of physical capital evaluation indices
For non-grazing families, livestock ownership capitals indicated significant negative effect on their livelihood strategies, but had no effect on preferred strategy of living for petty-herders families relative to continuous grazing designated as the reference. Livestock ownership are the basis for herders to expand production and respond to disasters such as drought and snow [46] and herders with more livestock resources could gain more benefits in years of heavy rainfall and stable market. In contrast, when natural disaster occurs, possession of more livestock resources plays a key role in smoothing the risk of this menace.
For both petty-herders and non-grazing families, housing and shed condition did not influence their livelihood strategies. This might be due to non-inclusion of house location and shed type in our study. However, our survey revealed that people with large shelters not only have houses in pastoral areas but also possess the same in the county. Rather than choosing continuous grazing strategy of living in the pastoral areas, they prefer to live in the county as petty-herders and non-grazing families. Livestock production facilities in pastoral areas have been improved through policy implementation in recent years, with significant government investment in building of high quality greenhouses and simple shed.
(4)    Appraisal of financial capital evaluation indices
Cash income but not loan had significant negative influence on the livelihood strategies of non-grazing herders, and our household survey showed that herders majorly invest their loan in grazing.
(5)    Appraisal of social capital evaluation indices
Cooperation had significant negative effect on herders preferred strategy of living for non-grazing families but not for petty-herders families relative to continuous grazing taken as the reference. To concentrate sell time in autumn, herders regulate the lambing time in spring, which requires a large labor force. However, the average number of laborers is 2.9 per household which necessitates cooperation among herders when lambs are received.
Gift expenditure recorded significant negative effect on herders preferred strategy of living for petty-herders families and non-significant effect on those for non-grazing families. It is probable that the petty-herders need more cooperation in production, and this justifies their extension of more gift items to maintain human relations between neighbors and friends.

4. Discussion

In this study, the proportion of grazing income in households’ total income was used to group the surveyed households into herder families, petty-herders families, and non-grazing families. Herders who rent-in grasslands stand the chance of amplifying their access to pasture resources with accompanying merits such as increased production capacity, larger income, and reduced susceptibility to natural disasters. However, scientific debate is ongoing with regard to grassland use right transfer proceedings, primarily apropos of the lessor [37,47] and the possible ways of securing the grassland itself when transferred [48]. On the other hand, lessors could take up other off-farm available opportunities including but not limited to becoming a migrant worker, an entrepreneur or even emigrate to peri-urban or urban centers to seek a better life [49]. As earlier remarked, there is a paradigm shift in the basic capitals that attest to herders’ livelihood through reversal in their dependence on grassland resources. When implementing the grassland ecological protection subsidy award, the government should therefore not subsidize the income too high but should come up with programs that will focus more on guaranteeing the basic living needs of herders.
Herders possessing sufficient natural capitals are less likely to choose diversified livelihood strategies, but would rather settle for living strategies that involve pastoral production [11,50]. However, this study differs from the above conclusions. Natural capital is measured by the productivity of grassland resources owned by herders. In Inner Mongolia, the reward income of ecological protection subsidy for herder families is distributed according to the size of grassland owned by herders. That is, herder families with more grassland resources can get more cash income. Due to instability in the market structure of livestock products in pastoral areas in recent years, the income of herders fluctuates greatly. Therefore, those who have abundant natural capital tend to choose stable ecological protection subsidy and reward income to offset the fluctuation in their income.
Ding et al. reported that income generated from grass–livestock interaction is a strong determinant of herders’ living strategy and their capability to withstand livelihood shocks. Meanwhile, the amount of financial and physical capitals possessed by herders is fundamental in decision making about pastoral production, and invariably affects the choice of livelihood strategy to be chosen by herders [35]. Our result indicates that herders’ choice of livelihood strategy is influenced by physical and financial capitals, and this corroborates an earlier report by Walelign (2016) [23], who found these capitals are instrumental to herders’ livelihood transition. In addition, possession of higher physical and financial capitals propels herders to settle for livelihood strategies that absorb pastoral production practices. However, non-grazing families had lower physical, financial, and social capitals, and a similar result was reported by Peng et al. (2017) [15]. From policy perspectives, appropriate policy programs should be put in place relative to the different livelihood strategies (e.g., eco-compensation, encouragement of business, and off-farm work).
Zhang et al. noted that the main reason behind the construction of regional sustainable livelihood is livelihood diversification which principally entails non-grassland use or management actions [47]. Relative to the migration of petty-herders and non-grazing household members, it has become imperative to advance pastoral production in a manner that would further motivate grazing households to engage in sustainable utilization of grassland resources through policy instruments. On the other hand, petty-herders and non-grazing families that engage in business and off-farm work have the potential of living well within the rural household (Ansoms and McKay, 2010) [1]. The authors further noted that such households require educational capital and engagement in their own off-farm enterprises. However, the question seeking an urgent answer is whether to further encourage differentiation of herder families into petty-herders and non-grazing families. First, if the differentiation is encouraged, policies that provide incentives for livelihood transition to aid environmental sustainability should be strengthened, and skill acquisition and entrepreneurial education that would help to sustain the income of herders after transition should be prioritized. In contrast, if the differentiation is discouraged, the number of grazing households would increase leading to an increased pressure on environmental resources. The lesson here for policy makers is directly connected to making provision for young adults in the grazing households. This will result in land fragmentation following division of land among newly formed families, which will require redirecting the orientation of these young adults to other sectors of the economy to promote and aid the survival of larger farm full of potentials (Ansoms and McKay, 2010) [1].
Analogous to grassland degradation and shifts in living styles, Du et al. reported that farming households exceeding 80% decline migration to urban areas and this is premised on the following reasons: (1) lack of requisite skills; (2) educational backwardness; and (3) cultural preservation [50]. The authors further strengthened that, where farmers and herders are literate with moderate skills, existing bonds with their social network and culture prevent them from migrating. Even though the educational level of household members did not influence the choice of herders strategies, our result is in agreement with Du et al. [51] as the proportion of herders families and petty-herders families were larger than that of non-grazing families, an indication that a larger percentage of the surveyed households derive benefits from grassland resources, although at varying levels. In addition, these households (herders’ families and petty-herders families) possess high social capital which guarantees access to credit and insurance, and is consequently reflected in their total household income (Ansoms and Mckay, 2010) [1]. It is noteworthy, however, that livelihood diversification is a risk management approach that that takes time to come by and become sustainable (Waleleign et al., 2016) [14].
The income of herders families was much higher than those of other families, and this affirms that continuous grazing livelihood strategy rank first among the livelihood strategies of herders in Inner Mongolia. This contradict the report by Waleleign (2016) [23] that agricultural environment-based livelihood strategy was less remunerative compared to support-based and business-based livelihood strategies. A plausible explanation for this is that crop cultivation contributes more than livestock production to the total income structure of agricultural environment-based livelihood strategy in the former study, while livestock production mainly constitutes the total income for continuous grazing livelihood strategy in our study. More importantly, the incidence of crop failure leads to reduction in farmers’ household income (Milgroom and Giller 2013; Kandulu et al., 2012) [52,53]. It is more likely that, if herders’ families own more financial capital, they will invest more capital and labor in pastoral production to maximize their total income. Therefore, by increasing the diversity of income structure, improving the employment skills of herders and perfecting the incentive policy of ecological protection subsidies, the livelihood strategies of herders family could be transformed from herders to petty-herders and non-grazing families.
Theoretically, endowment with varieties of human and social capitals positively impact the rational distribution of livelihood capitals by herders, and bias in the access to social capitals have been reported to be detrimental to effective management of common resources (Iiyama et al., 2008) [9]. In this study, the livelihood strategy of herders is not affected by human and social capitals, and this could be ascribed to high degree of homogenization of human and social capitals in the pastoral region of Inner Mongolia, China. This is justified in our empirical analysis with higher scores recorded for social and human capitals (0.468 and 0.483), respectively. The observed regional difference in the livelihood capital stock of herders suggests that more attention should be paid to national and regional policy implementation to promote sustainable development of the pastoral areas. Herders tend to choose livelihood strategy that entails pastoral production owing to possession of sufficient physical and financial capitals, and this points at the need to enlighten herders on how to diversify their income portfolios through capacity building and entrepreneurship education which will consequently lead to reduction of grazing pressure on the ecological environment without compromising their total household income.

5. Conclusions

Our research focused on the influence of livelihood capitals on herders’ livelihood strategies using quantitative approach and a developed index system. Multinomial logit model was used to analyze the empirical data and results show that herders’ choice of livelihood strategy is dictated by different livelihood capitals. The conclusions drawn from this study are:
(1)
The stocks of human and social capitals were higher while those for natural, physical, and financial capitals were lower.
(2)
There were significant regional differences in the livelihood capital stock of herders families with zonal horizontal decrease from east to west in Inner Mongolia.
(3)
Natural capital affects the preferential selection of livelihood strategies by herders positively, implying that possession of more natural capital by herders leads to selection of livelihood strategies that are devoid of pastoral production. The preferred livelihood strategy of herders was significantly negatively affected by physical and financial capitals, an indication that, when herders possess more physical and financial capitals, they tend to choose livelihood strategies that involve pastoral production; the living strategy of herders was not affected by human and social capitals.
(4)
Production of rented pasture capital index affects the preferential selection of livelihood strategies by herders positively, while cash income capital index had negative influence on how pastoralists select their livelihood strategies.
(5)
Finally, this study revealed that the total livelihood capital of herders in Inner Mongolia is low. There is a need to strengthen the incentives of the eco-compensation policy with regard to the categorized herders’ livelihood strategies and stabilize the grassland property rights system. In addition, there is perceived benefit in the differentiation of herders families into petty-herders and non-grazing families from the perception of natural resource management and sustainability. However, this requires income diversification programs such as capacity building and business education that will aid the smooth transition of households to these less-resource-exploiting livelihood strategies.

Author Contributions

Conceptualization, W.D.; Methodology, W.D.; Software, W.D.; Validation, W.D. and S.O.J.; Formal Analysis, W.D. and S.O.J.; Investigation, W.D. and Y.H.; Resources, X.H.; Data Curation, W.D. and Y.H.; Writing—Original Draft Preparation, W.D.; Writing—Review and Editing, W.D. and S.O.J.; Visualization, X.H. and W.Z.; Supervision, X.H. and W.Z.; Project Administration, X.H. and W.Z.; and Funding Acquisition, X.H.

Funding

This research was funded by [National Natural Science Foundation of China (NSFC)] grant number [71774162]. The APC were funded by [National Key Basic Research Program of China] grant number [2014CB138806] and [Science and Technology Innovation Project of Chinese Academy of Agricultural Sciences] grant number [CAAS-ASTIP-IGR2015-05].

Acknowledgments

This research work was funded by the National Key Basic Research Program of China (No. 2014CB138806).

Conflicts of Interest

The authors declare no conflict of interest.

References

  1. Ansoms, A.; McKay, A. A quantitative analysis of poverty and livelihood profiles: The case of rural Rwanda. Food Policy 2010, 35, 584–598. [Google Scholar] [CrossRef] [Green Version]
  2. Mutenje, M.J.; Ortmann, G.F.; Ferrer, S.R.D.; Darroch, M.A.G. Rural livelihood diversity to manage economic shocks: Evidence from south-east Zimbabwe. Agrekon 2010, 49, 338–357. [Google Scholar] [CrossRef]
  3. Ellis, F. The Determinants of Rural Livelihood Diversification in Developing Countries. J. Agric. Econ. 2000, 51, 289–302. [Google Scholar] [CrossRef]
  4. Scoones, I. Sustainable Rural Livelihoods: A Framework for Analysis; IDS: Brighton, UK, 1998. [Google Scholar]
  5. Kibria, A.M.G.; Jashimuddin, M.; Makoto, I. Effects of participatory forest management on livelihood capitals of the community in Cox’s Bazar, Bangladesh. J. For. Res. 2014, 19, 42–51. [Google Scholar] [CrossRef]
  6. Angelsen, A.; Jagger, P.; Babigumira, R.; Belcher, B.; Hogarth, N.J.; Bauch, S.; Rner, J.B.; Smith, C.H.; Wunder, S. Environmental Income and Rural Livelihoods: A Global-Comparative Analysis. World Dev. 2014. [Google Scholar] [CrossRef] [Green Version]
  7. Berg, M.V.D. Household income strategies and natural disasters: Dynamic livelihoods in rural Nicaragua. Ecol. Econ. 2010, 69, 592–602. [Google Scholar] [CrossRef]
  8. Walelign, S.Z.; Pouliot, M.; Larsen, H.O.; Smith, C.H. Combining Household Income and Asset Data to Identify Livelihood Strategies and Their Dynamics. J. Dev. Stud. 2016. [Google Scholar] [CrossRef]
  9. Walelign, S.Z. Getting stuck, falling behind or moving forward: Rural livelihood movements and persistence in Nepal. Land Use Policy 2017, 65, 294–307. [Google Scholar] [CrossRef]
  10. Wang, F.; Yang, D.; Wang, C.; Zhang, X. The effect of payments for ecosystem services programs on the relationship of livelihood capital and livelihood strategy among rural communities in Northwestern China. Sustainability 2015, 7, 9628–9648. [Google Scholar] [CrossRef]
  11. Liu, Z.F.; Chen, Q.R.; Xie, H.L. Influence of the farmer’s livelihood assets on livelihood strategies in the Western Mountainous Area, China. Sustainability 2018, 10, 875. [Google Scholar] [CrossRef]
  12. Conte, T.J. The effects of China’s grassland contract policy on Mongolian herders’ attitudes towards grassland management in northeastern Inner Mongolia. J. Polit. Ecol. 2015, 22, 79–97. [Google Scholar] [CrossRef]
  13. Iiyama, M.; Kariuki, P.; Kristjanson, P.; Kaitibie, S.; Maitima, J. Livelihood diversification strategies, incomes and soil management strategies: A case studyfrom Kerio Valley, Kenya. J. Int. Dev. 2008, 20, 380–397. [Google Scholar] [CrossRef]
  14. Fang, Y.; Fan, J.; Shen, M.; Song, M. Sensitivity of livelihood strategy to livelihood capital in mountain areas: Empirical analysis based on different settlements in the upper reaches of the Minjiang River China. Ecol. Indic. 2014, 38, 225–235. [Google Scholar] [CrossRef]
  15. Peng, W.; Zheng, H.; Robinson, B.E.; Li, C.; Wang, F. Household Livelihood Strategy Choices, Impact Factors, and Environmental Consequences in Miyun Reservoir Watershed, China. Sustainability 2017, 9, 175. [Google Scholar] [CrossRef]
  16. Su, F.; Pu, X.D.; Xu, Z.M.; Wang, L.A. Analysis about the relationship between livelihood capital and livelihood strategies: Take Ganzhou in Zhangye as an example. China Popul. Resour. Environ. 2009, 19, 119–125. (In Chinese) [Google Scholar]
  17. Zhao, X.Y.; Li, W.; Yang, P.T.; Liu, S. Impact of livelihood capital on the livelihood activities of farmers and herders on Gannan Plateau. China Popul. Resour. Environ. 2011, 21, 111–118. (In Chinese) [Google Scholar]
  18. Zhang, H.Y.; Yao, J.; Ma, J. Livelihood capital and participation in the tourism industry herders and the livelihood of relation strategy: A case of Kanas ecological tourism scenic area in Xinjiang. Tour. Forum 2013, 6, 40–44. (In Chinese) [Google Scholar]
  19. Shi, Y.L.; Tang, B.; Yu, Y. The research of livelihood strategies in poor areas based on livelihood capitals—The inspection of four villages for the sustainable livelihood projects in Fengshan Country of Guangxi. Reform. Strategy 2014, 30, 83–87. (In Chinese) [Google Scholar]
  20. Zhao, W.J.; Yang, S.L.; Xu, R. The impact of farmers’ livelihood capital on livelihood strategy—Case study in Xinping County of Yuanjiang Dry-Hot Valley. China Popul. Resour. Environ. 2015, 25, 162–165. [Google Scholar]
  21. Wu, Y. Study on farmers livelihood capital impact upon the livelihood strategies. J. South China Agric. Univ. (Soc. Sci.) 2015, 14, 57–66. (In Chinese) [Google Scholar]
  22. Babulo, B.; Muys, B.; Nega, F.; Tollens, E.; Nyssen, J.; Deckers, J.; Mathijs, E. Household livelihood strategies and forest dependence in the highlands of Tigray, Northern Ethiopia. Agric. Syst. 2008, 98, 147–155. [Google Scholar] [CrossRef]
  23. Walelign, S.Z. Livelihood strategies, environmental dependency and rural poverty: The case of two villages in rural Mozambique. Environ. Dev. Sustain. 2016, 18, 593–613. [Google Scholar] [CrossRef]
  24. Nielsena, J.; Rayamajhib, S.; Uberhuagac, P.; Meilbya, H.; Halla, S.C. Quantifying rural livelihood strategies in developing countries using an activity choice approach. Agric. Econ. 2013, 44, 57–71. [Google Scholar] [CrossRef]
  25. Alemu, Z.G. Livelihood strategies in rural South Africa: Implications for poverty reduction. In Proceedings of the 2012 International Association of Agricultural Economists (IAAE) Triennial Conference, Foz do Iguacu, Brazil, 18–24 August 2012; pp. 1–24. [Google Scholar]
  26. Bhandari, P.B. Rural livelihood change? Household capital, community resources and livelihood transition. J. Rural Stud. 2013, 32, 126–136. [Google Scholar] [CrossRef] [PubMed] [Green Version]
  27. Diniz, F.H.; Hoogstra-Klein, M.A.; Kok, K.; Arts, B. Livelihood strategies in settlement projects in the brazilian amazon: Determining drivers and factors within the agrarian reform program. J. Rural Stud. 2013, 32, 196–207. [Google Scholar] [CrossRef]
  28. Su, Y.; Deng, W.; Zhang, J.F.; Koirala, H.L.; Khatiwada, P.; Shanta, P.K. Relationship between livelihood capital and livelihood strategies of rural. Mt. Res. 2016, 34, 645–653. (In Chinese) [Google Scholar]
  29. Xu, D.D.; Zhang, Z.F.; Rasul, G.R.; Liu, S.Q.; Xie, F.T.; Cao, M.T. Household livelihood strategies and dependence on agriculture in the mountainous settlements in the three gorges reservoir area, China. Sustainability 2015, 7, 4850–4869. [Google Scholar] [CrossRef]
  30. Trost, J.E. Statistically non-representative stratified sampling: A sampling technique Qualitative Studies. Qua. Sociol. 1986, 9, 54–57. [Google Scholar] [CrossRef]
  31. Sharp, K. Measuring Destitution: Integrating Qualitative and Quantitative Approaches in the Analysis of Survey Data; IDS Working Paper; IDS: Brighton, UK, 2003; pp. 1–54. [Google Scholar]
  32. Li, X.Y.; Dong, Q.; Rao, X.L. The analysis methods of vulnerability of peasant household and its localization in China. Chin. Rural Econ. 2007, 4, 32–39. (In Chinese) [Google Scholar]
  33. Ding, W.Q. Herders Vulnerability Evaluation in Northern Grassland of China—A Case Study in Mongolia Desert Grassland; Lanzhou University: Lanzhou, China, 2012; pp. 12–26. (In Chinese) [Google Scholar]
  34. Ding, W.Q.; Li, P.; Ren, W.P. Evaluation of the livelihood vulnerability of pastoral households in Northern China to natural disasters and climate change. Rangel. J. 2014, 36, 535–543. [Google Scholar] [CrossRef]
  35. Ding, W.Q.; Li, P.; Yin, Y.T.; Hou, X.Y. Evaluation of the herder households’ vulnerability under the framework of sustainable livelihoods in the grassland of Northern China. Acta Pratacult. Sin. 2017, 26, 1–11. (In Chinese) [Google Scholar]
  36. Hou, X.Y.; Ding, Y.; Wu, X.H. Impact of Climate Change and Adaptation in Northern Grassland of China; Beijing Science Press: Beijing, China, 2014. (In Chinese) [Google Scholar]
  37. Li, A.; Wu, J.; Zhang, X.; Xue, J.; Liu, Z.; Han, X.; Huang, J. China’s new rural “separating three property rights” land reform results in grassland degradation: Evidence from Inner Mongolia. Land Use Policy 2018, 71, 170–182. [Google Scholar] [CrossRef]
  38. Yan, J.Z.; Wu, Y.Y.; Zhang, Y.L.; Zhou, S.B. Livelihood diversification of farmers and nomads of eastern transect in Tibetan Plateau. J. Geogr. Sci. 2010, 20, 757–770. [Google Scholar] [CrossRef]
  39. Shannon, C.E. A mathematical theory of communication. Bell Syst. Tech. J. 1948, 27, 379–423. [Google Scholar] [CrossRef]
  40. Tjoe, Y. Measuring the livelihood vulnerability index of a dry region in Indonesia A case study of three subsistence communities in West Timor. World J. Sci. Technol. Sustain. Dev. 2016, 13, 250–274. [Google Scholar] [CrossRef]
  41. Sun, C.Z.; Zhang, K.L.; Zou, W.; Li, B.; Qin, X.H. Assessment and evolution of the sustainable development ability of human-ocean systems in Coastal Regions of China. Sustainability 2015, 7, 10399–10427. [Google Scholar] [CrossRef]
  42. Wang, T.C.; Lee, H.D. Developing a fuzzy TOPSIS approach based on subjective weights and objective weights. Expert Syst. Appl. 2009, 36, 8980–8985. [Google Scholar] [CrossRef]
  43. Hua, X.B. The Coupling between Livelihood of Farmers and Herders and Land Use—Case Studies of Three Agro-Ecological Zones in Tibetan Plateau; Southwest University: Chongqing, China, 2014. (In Chinese) [Google Scholar]
  44. Guo, X.L.; Zhou, L.H.; Yang, G.J.; Chen, Y.; Zhao, M.M.; Wang, R. Impact of farms’ livelihood capital on livelihood strategy in a typical desertification area in the inner Mongolia Autonomous Region. Acta Ecol. Sin. 2017, 37, 1–10. (In Chinese) [Google Scholar]
  45. Department for International Development. Sustainable Livelihoods Guidance Sheets; Department for International Development: London, UK, 1999.
  46. Wei, Y.R.; Hao, L. Hazard risk identification of animal husbandry in Inner Mongolia. Meteorol. J. Inner Mong. 2001, 1, 21–23. (In Chinese) [Google Scholar]
  47. Han, S.Q. Analysis of land transfer in rural and pastoral areas in Inner Mongolia. North. Econ. 2011, 5, 10–11. (In Chinese) [Google Scholar]
  48. Zhang, Y.D.; Meng, H.J.; Ta, N. The transfer of the right to grassland contractual management in pastoral areas and its impact on pastoralists’ livelihoods. Pratacult. Sci. 2010, 27, 130–135. (In Chinese) [Google Scholar]
  49. Jun, L.W.; Li, S.H.; Zhang, Q. Property rights and grassland degradation: A study of the Xilingol Pasture, Inner Mongolia, China. J. Environ. Manag. 2007, 85, 461–470. [Google Scholar] [CrossRef] [PubMed]
  50. Li, H.L.; Ma, H.X.; Yang, R. Influence of cotton farmer’s livelihood capitals on livelihood strategy—Based on the survey data of Manas and Awat counties Xinjiang. J. Arid Land Resour. Environ. 2017, 31, 57–63. (In Chinese) [Google Scholar]
  51. Du, B.Z.; Zhen, L.; Yan, H.M.; Rudolf, G. Effects of government grassland conservation policy on household livelihoods and dependence on local grasslands: Evidence from Inner Mongolia China. Sustainability 2016, 8, 1314. [Google Scholar] [CrossRef]
  52. Milgroom, J.; Giller, K.E. Courting the rain: Rethinking seasonality and adaptation to recurrent drought in semi-arid southern Africa. Agric. Syst. 2013, 118, 91–104. [Google Scholar] [CrossRef]
  53. Kandulu, J.M.; Brett, A.; Bryan, B.A.; King, D.; Connor, J.D. Mitigating economic risk from climate variability in rain-fed agriculture through enterprise mix diversification. Eco. Econ. 2012, 79, 105–112. [Google Scholar] [CrossRef]
Figure 1. Map showing study areas across different grassland types. Note: 1-1 Chen Barag Banner; 1-2 Ewenke Banner; 1-3 Xin Barag Left Banner; 2-1 East Ujimqin Banner; 2-2 Xilin hot; 2-3 Xianghuang Banner; 3-1 Sunite Left Banner; 3-2 Sunite Right Banner; 3-3 Siziwang Banner; 4-1 Hangjin Banner; 4-2 Otog Banner; 4-3 Uxin Banner; 5-1 Urad Back Banner; 5-2 Alxa Left Banner; 5-3 Alxa Right Banner.
Sustainability 10 03325 g001
Table 1. Definition of evaluation indices of herders’ livelihood capitals.
Type of CapitalEvaluation IndicesDefinition (Unit)
HumanHousehold labor capacity (h1)h1 = h11 × 1 + h12 × 0.5 + h13 × 0
Educational level of the household members (h2)h2 = h21 × 1 + h22 × 0.75 + h23 × 0.5 + h24 × 0.25 + h25 × 0
NaturalProductivity of contracted pasture (n1)n1 = Contracted grassland area × Standard coefficient
Productivity of contracted pasture (n2)n2 = Usable pasture area × Standard coefficient
physicalLivestock ownership (g1)g1 = g11 × 7 + g12 × 5 + g13 × 5 + g14 × 1 + g15 × 0.9
Housing condition (g2)The actual living space per capita in survey year
Shed condition (g3)Total shed area in the survey year
Fixed assets (g4)The proportion of fixed assets owned by family households in total assets
FinancialCash incomes (f1)Total household income in the survey year (RMB )
Loan (f2)The amount of pastoral loans in the survey year (RMB)
SocialCooperation (s1)1 for Long-term cooperative herders; otherwise, 0
Gift expenditure (s2)Total expenses for interpersonal communication in the survey year (RMB)
Renminbi (RMB) is same as Yuan; Note: (1) Incompetent person includes children too young to work, elders too old to work, patients who cannot work. Semi-capacity person includes children and the elderly who can do some simple household chores or farm work. Full capacity person refers to able bodied adults. h11, full capacity person; h12, semi-capacity person; h13, less energetic person. (2) Illiterate refers to those with 0 years of education. Those who received 6 years of education are designated as primary school. Junior high school degree refers to households who received education for 9 years; above junior education are those who received education for 12 years. College degree or above are those with more than 12 years of education. h21, college degree or above; h22, above junior education; h23, junior high school degree; h24, primary school; h25, illiterate [38]. (3) Standard coefficients (“Notice on implementation plan of reward policy for grassland ecological protection in Inner Mongolia Autonomous Region”): Meadow steppe, 1.59; Typical Steppe, 1.06; Desert steppe, 0.85; Sandy steppe, 0.79; Steppe desert, 0.35. (4) g11, Camel × 7; g12, Horse × 5; g13, Cow × 5; g14, Sheep × 1; g15, Goat × 0.9.
Table 2. Measurement indices and weight of herders’ livelihood capitals.
Target LayerCapital TypeWeightMeasurement Indices Weight of Capital TypeWeight of Target Layer
Herders
livelihood
capital in the study area
Human capital0.4737Household labor capacity0.26400.3143
Educational level of the household members0.73600.1594
Natural capital0.1078Production of rented pasture0.51420.0526
Production of contracted pasture0.48580.0552
Physical capital0.1579Livestock ownership0.39580.0590
Housing condition0.21420.0444
Shed condition0.39170.0410
Fixed assets0.01810.0135
Financial capital0.1498Cash incomes0.31680.0669
loan0.68320.0829
Social capital0.4823Cooperation0.60040.3960
Gift expenditure0.39960.0863
Table 3. Livelihood capitals of herders across different livelihood strategies.
Type of CapitalsHerders’s FamiliesPetty-Herders FamiliesNon-Grazing FamiliesTotal Sample
Human0.4900.4590.4530.468
Natural0.1510.1940.1060.169
Physical0.1760.1560.1180.158
Financial0.1840.1450.0780.150
Social0.4880.4810.4780.483
Total livelihood capital1.4901.4351.2341.428
Table 4. Comparison of herders livelihood capitals across grassland types.
Type of CapitalsMeadowTypical SteppeDesert SteppeSandy SteppeSteppe DesertF Valuep Value
Human0.4750.4890.4410.4840.4572.313*
Natural0.1930.1890.2710.0510.13649.402***
Physical0.1650.1580.1440.1380.1837.537***
Financial0.2120.1710.1460.1300.09723.229***
Social0.5000.5080.3860.5610.43912.664***
Total livelihood capital1.5461.5151.3881.3631.3138.387***
Note: *** indicates that the t values are significant at the 1% level, * indicates that the t values are significant at the 10% level.
Table 5. Descriptive statistics of herders’ livelihood strategies across grassland types.
TypeMeadowTypical SteppeDesert SteppeSandy SteppeSteppe DesertMean
Herders’s families5275568516284
Proportion (%)32.70%44.64%31.82%51.20%8.94%33.49%
Petty-herders families97811147194457
Proportion (%)61.01%48.21%64.77%42.77%52.51%53.89%
Non-grazing families101261069107
Proportion (%)6.29%7.14%3.41%6.02%38.55%12.62%
Total Sample159168176166179848
Table 6. Descriptive statistics of herders’ income structure across different livelihood strategies.
ItemHerders’s FamiliesPetty-Herders FamiliesNon-Grazing FamiliesMean
Grazing income211,35086,3604870117,940
Proportion (%)91.69%67.62%9.50%81.24%
Non-grazing income90208025801470
Proportion (%)0.04%1.27%5.30%1.02%
Government transfers income933028,99029,84022,510
Proportion (%)4.05%26.84%61.32%15.51%
Property income480304011,3703230
Proportion (%)0.21%1.83%23.37%2.23%
Total household income230,520123,82048,670145,170
Note: All incomes are in RMB.
Table 7. Multinomial Logit analysis of the influence of livelihood capitals on the choice of herders Livelihood Strategies.
Livelihood CapitalPetty-Herders Families ModelNon-Grazing Families Model
Coef.Coef.
Human−0.512−0.053
Natural2.961 ***1.634 ***
Physical−3.275 ***−6.181 ***
Financial−2.617 ***−11.082 ***
Social−0.216−0.481
Intercept1.286 ***1.361 ***
Note: Continuous grazing was designated as the reference. *** indicates that the t values are significant at the 1% level.
Table 8. Multinomial Logit analysis of the influence of livelihood capital indices on the choice of herders Livelihood Strategies.
Livelihood CapitalEvaluation IndicesPetty-Herders Families ModelNon-Grazing Families Model
Coef.Coef.
HumanHousehold labor capacity1.4886.385 **
Educational level of the household members−0.2420.499
NaturalProduction of rented pasture20.041 ***29.226 ***
Production of contracted pasture−7.603 ***−5.901
PhysicalLivestock ownership−0.403−84.375 ***
Housing condition1.84910.122
Shed condition0.9478.591
Fixed assets−55.527−82.725
FinancialCash incomes20.393 ***−50.572 ***
loan−0.609−0.519
SocialCooperation−0.298−1.024 *
Gift expenditure−2.378 **3.020
Intercept1.765 ***1.488 *
Note: Continuous grazing was designated as the reference. *** indicates that the t values are significant at the 1% level, ** indicates that the t values are significant at the 5% level, and * indicates that the t values are significant at the 10% level.

