Abstract
Air changes per hour (ach) rates for windows of different sizes and opened in different ratios were studied to establish natural ventilation concepts in offices with a Mediterranean climate. Dynamic thermal simulations were carried out in EDSL Tas for whole year investigations of an office. The office lost 0.01 W of heat during the winter but gained 0.01 W of heat during the summer. Annual average heat gain was 2.4 W. The heat gain via an external opaque wall was 138.9 W during the winter and 227.3 W during the summer, with an annual average of 190.7 W. The heat gain via an external glass surface was 128.9 W during the winter and 191 W during the summer, with an annual average of 161.5 W. The office had an average of 170.0 ach during the winter and an average of 144.7 ach during the summer, with an annual average of 157.4. The maximum annual ach performance was 480.4 ach when the external wall was fully glazed and the window was fully open, and the minimum annual ach performance was 9.8 when only 10% of the external wall was glass and 20% of the window area was open.
1. Introduction
In today’s office buildings, the use of computers and office machines causes air pollution. Natural ventilation strategies should be integrated into the architectural design stage of buildings. Mechanical ventilation devices should be considered after them. Natural ventilation is the result of air temperature changes entering into buildings through openings. Natural ventilation of buildings depends on wind-induced pressure or temperature differences for calculating air changes per hour (ach) [1,2]. Natural ventilation is the most effective way of saving energy and improving indoor air quality [3,4,5,6]. Ventilation techniques for buildings that are not using any mechanical devices can be termed as natural ventilation [7]. Temperature, air velocity, and humidity have strong influences on the natural ventilation of buildings [8]. The window design of buildings is very important especially for single-sided natural ventilation schemes [9]. Natural or mechanical ventilation systems needed in buildings for removing air pollutants and providing fresh air into occupied spaces [10]. For buildings where the energy consumption is high, natural ventilation is the best way to reduce energy consumption [11,12] and, moreover, the cost of energy used in naturally ventilated buildings is 40% cheaper than energy used for air-conditioned buildings [13]. Naturally ventilated buildings should integrate window to wall ratios, orientation, glazing properties, and visual and thermal comfort ideas that are designed properly in an architectural sense to maximize efficiency [14]. Since historical times, natural ventilation strategies have been chosen and used in all types of buildings; however, they have lost their popularity within the 20th century because of the standard use of mechanical systems in buildings [15]. It is important in sustainable architectural design to minimize the size of equipment that is needed in order to save energy through an optimal design, to maximize the use of natural energy, and to ensure the high performance of HVAC systems [16]. Sustainable environmental concepts are the favorite concepts in today’s architecture [17].
Indoor environmental quality depends on thermal comfort, indoor air quality, acoustic control, and visual comfort [18]. Ach is necessary for the determination of indoor air temperature for naturally ventilated buildings [19]. Ach should be 12 ach for a new healthcare building and 6 ach for existing healthcare buildings [20,21]. The average air speed should be 0.20 m/s with an average metabolic rate between 1 and 2 met, and clothing insulation between 0 and 1.5 clo according to the ASHRAE standards [22]. In China, the average air temperature is 21.9 ± 2.2 °C/21.5 ± 2.8 °C in urban houses and it is 16.1 ± 3.5 °C/14.6 ± 3.3 °C in rural houses [23]. Whole building air change rates, outdoor air intake systems, and building infiltration rates are the parameters needed for identifying the ventilation for buildings [24,25]. Ventilation rates for buildings are important for indoor air quality because when outdoor air is brought indoors, it needs heating, cooling, humidification, or dehumidification depending on ventilation rates [26]. The high energy demand of today’s buildings and users force people not only to conserve energy but also to lower air ventilation rates that lower the quality of indoor air to an unacceptable level [27]. Air density differences due to temperature variations and wind create air infiltration rates for buildings [28].
In order to provide a healthy environment and comfort in residential buildings, the Chinese standard GB 50736-2012 [29] recommends that ach must be between 0.45 and 0.70; in the USA, ASHRAE 62.1-2016 [30] recommends that fresh air per person must be 2.5 L/s per person, and fresh air per construction area must be 0.3 L/s per m2, and the CIBSE Guide A of the UK recommends that the ventilation rate must be 0.4–1 [31,32]. Research on naturally ventilated buildings can be grouped as steady envelope flow models, flow characteristics of openings, unsteady envelope flow models, internal air motion, zone models and stratification, contaminant transport, age of air, CFD and its applications, scale modelling, and full-scale measurements [33]. Sufficient air ventilation is needed in order to ensure a healthy environment and comfort in buildings [34,35,36]. Brazil needs low energy consumption buildings [37] and natural ventilation offers cross-ventilation and stack ventilation opportunities for buildings [38].
2. Literature Review
Concrete and brick buildings of Estonia have an average ach of 0.24 [39]. A total of 87% of students get disturbed by noise, 63% by smells, and 42% by sunlight on sunny days; 35% are not happy with the indoor temperature of classrooms, and 34% experience temperature changes in Dutch school buildings [40].
Hong and Kim [41] measured infiltration rates of Korean residential buildings. The average rate of ach was 0.2 ach for summer and autumn seasons, and 0.6 ach for the winter season. Infiltration rates get higher at lower floor levels during the autumn and the winter, and if indoor and outdoor air temperatures increase. Moreover, in Korea, it was obligatory to obtain 0.7 ach in residential buildings, but after 2013, the ach requirement was reduced to 0.5 in order to save energy [41]. Majority (80%) of Swedish houses do not reach the 0.5 ach level, which is the minimum standard code value [42].
Chu and Chiang [43] have argued that the length of a building should be less than five times of the height of its ceiling for effective wind-driven cross ventilation [43]. Air quality in Polish high schools can be achieved if supply of air increased from 90 m3/h to 180 m3/h [44]. The lowest ach of 0.67 ± 0.28 can be achieved although it is the worst performance; nevertheless, 4.85 ± 0.57 ach can be achieved when doors and windows are opened simultaneously for indoor air quality of a bedroom during sleep [45]. In the winter season, because of the cooling potential of cold outside air, interior spaces need minimal air ventilation with less need to cool when compared to that in the other seasons [46]. Especially in tropical climates, natural ventilation is helping to reduce operation costs, providing better thermal comfort of spaces and a good level of indoor air quality [47]. In the Mediterranean climate of Corsica in France, there is a need for more than 25 ach of daytime ventilation and close to 10 ach nighttime ventilation [48]. In Athens, Greece, during the spring season, mean ventilation rates per school range between 0.7 and 8 ach, which are greater than what is proposed in the ASHRAE standards [49].
In the hot climate of Brazil, 80% of users are comfortable with the air movement in naturally ventilated buildings. The minimum air velocity should be at least 0.4 m/s at 26 °C room temperature, and 0.9 m/s at 30 °C room temperature, and according to ASHRAE, it should be 0.8 m/s [30]. In living areas, a natural ventilation of 0.35 ach (7.5 L/s) per person is needed [50]. In universities, colleges, and laboratories, fresh air is required at a rate of 1.2 ach [50]. In the breathing zones of office environments, outdoor air rates per m2 need to satisfy 2.5 L/s per person and 0.3 L/s m2 [30]. According to Chinese authorities, proper air supply rates range from 7.5 L/s to 12.8 L/s [50].
3. Methodology for the Study
In this paper, heat gain, heat loss, and ach characteristics/behaviors of office environments were analyzed for winter (cool) and summer (warm) seasons. Moreover, annual average performance values were analyzed and discussed. Furthermore, the mean radiant temperature (MRT) in °C, building heat transfer (BHT) in Watts, heat gain via the internal surface of the external opaque wall and glass surface in Watts, and ach were utilized for the analyses. Window sizes on the opaque wall ranged between 10% and 100% while the percentage of open window areas ranged from 10% to 100%. The EDSL Tas version 9.3.3 [51] was used for the dynamic thermal simulations of a 3 m × 5 m × 3 m office. The office had one zone with two opposing windows (inlet-outlet) on the east to west axis in order to get the best wind flow. Moreover, the office was located in Famagusta; therefore, the weather file of Famagusta was used for these simulations. The categories I, II, III, and minimum ventilation rates for breathing zones can be seen in Table 1 and Table 2. For opaque construction layers, U-values for ground floor, walls and ceiling were 0.283 W/m2K, 1.135 W/m2K, and 1.01 W/m2K, respectively. Moreover, for windows (clear 6-12-6 double glazing low-e), the U-value was 1.803 W/m2K with 0.498 solar transmittance and 0.760 light transmittance.

Table 1.
Ventilation rates for the building emission categories recommended in BS EN 15251 [52].
Table 2.
Minimum ventilation rates in breathing zones recommended in the ANSI/ASHRAE Standard 62.1-2016 [29].
Results and Discussion
As indicated in Table 3, among the 21st days of all months within the cool period, the 21st of January had the minimum MRT as 12.85 °C at 7 a.m. when the external wall was constructed fully of glass and 10% of the window area was open. The maximum MRT was found on the 21st of April as 27.9 °C at noon when the window size was 10% of the external wall and 100% of the window area was open. The average of the MRT values of the whole cool period was 16.8 °C. Within the warm period, the 21st of May had the minimum MRT as 22.7 °C at 7 a.m. when the external wall was constructed fully of glass and 10% of the window area was open. The maximum MRT was found on the 21st of July as 40.4 °C at noon when the window size was 10% of the external wall and the window was fully open. The average of the MRT values of the whole warm period was 29.8 °C. When the window size was 10% and the window was fully open, the average minimum MRT was 11.7 °C throughout January; the average maximum MRT was 35.5 °C throughout July when the external wall was constructed fully of glass and 10% of the window was open. When 10% of the window was constructed of glass and the window was fully open, the annual average minimum MRT was 21.2 °C, but when the window was constructed fully of glass and 10% of the windows area was open, the annual average of the maximum MRT values was 25.0 °C. The average MRT of only the 21st days of all months (cool and warm seasons) was 23.5 W. The average MRT of the whole year (8760 h) was 23.2 W. Figure 1 shows the MRTs of the office for all window sizes on the opaque wall and for all percentages of the open window area.
Table 3.
Seasonal and annual MRTs of the office on the 21st days of all months.
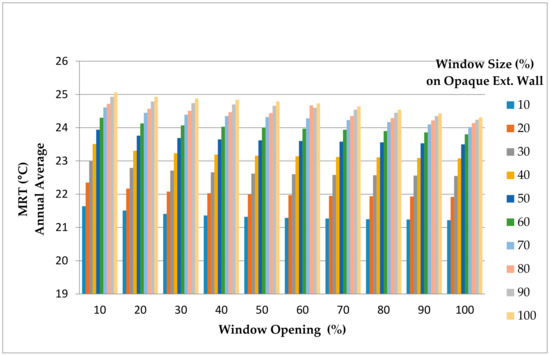
Figure 1.
MRTs of the office for all window sizes on the opaque wall and for all percentages of the open window area.
As indicated in Table 4, among the 21st days of all months within the cool period, the 21st of April had the minimum heat gain as 69.3 W in the morning when the window size was 10% of the external wall and the window was fully open. The maximum heat gain was 0.08 W on the 21st of February in the morning when the window size was 10% of the external wall and 10% of the window area was open. The minimum heat loss of the 21st days of all months within the cool period was 0.1 W on the 21st of January at noon when the window size was 10% of the external wall and the window was fully open. The maximum heat loss was 40.5 W on the 21st of January at 7 p.m. when 90% of the external wall was constructed of glass and the window was fully open. Within the warm period, among the 21st days of all months, the 21st of July had the minimum heat gain as 50.3 W in the morning when the window size was 10% of the external wall and the window was fully open. The maximum heat gain was 3.2 W on the 21st of June in the morning when the window size was 10% of the external wall and 10% of the window area was open. Among the 21st days of all months within the warm period, the 21st of October had the minimum heat loss as 3.9 W at 7 p.m. when the window size was 10% of the external wall and 10% of the window area was open. The maximum heat loss was 37.1 W on the 21st of July at 7 p.m. when 10% of the external wall was constructed of glass and the window was fully open. When the window was constructed fully of glass and 10–80% of the window area was open, the annual average of the minimum BHT values (heat gain) was 0.00099 W. The annual maximum BHT (heat gain) was 0.00069 W when the window size was 50% of the opaque wall and the window was fully open.
Table 4.
Seasonal and annual average BHTs (heat gain/loss) of the office on the 21st days of all months.
Within the winter (cool) period, the minimum heat loss was found to be in March when 10% of the external wall was constructed of glass and 90% of it was opaque brick wall, and 10% of the window area was open. The office lost 0.0014 W of heat in that period. The maximum heat loss was in February when the external wall was constructed fully of glass and 10–100% of the window was open. The office lost 0.1 W of heat then. The minimum heat gain was 0.1 W in February when the external wall was constructed fully of glass and the window was fully open. The maximum heat gain within the cool period was 0.0005 W in November when the window size was 20–100% of the wall and 20–100% of the window was open. In the whole cool period, the average heat transfer of the building was 0.01 W (heat loss). Within the summer (warm) period, the minimum heat loss was in August when 10% of the external wall was constructed of glass and 90% of it was opaque brick wall, and 10% of the window was open. The office lost 0.02 W of heat in that period. The maximum heat loss was 0.07 W in October when 10% of the external wall was constructed of glass and 10% of the window was open. The minimum heat gain was 0.1 W in May when 100% of the external wall was constructed of glass and 20–100% of the window area was open. The maximum heat gain during the cool period was 0.02 W in July when the window size was 70–80% of the wall and 60–100% of the window was open. In the whole warm period, the average BHT was 0.01 W (heat gain). When the wall was constructed fully of glass and 10–80% of the window area was open, the annual average minimum BHT was 0.00099 W (heat gain). The annual average maximum BHT was 0.00069 W (heat gain) when 50% the wall was constructed of glass and 100% of the window area was open. The average BHT of only the 21st days of all months was 2.5 W (heat loss). The average BHT of the whole year (8760 h) was 2.4 W (heat gain).
As indicated in Table 5, among the 21st days of all months within the cool period, the 21st of April had the minimum heat gain of the external conduction opaque (ECO) as 2539.0 W in the morning when the window size was 10% of the external wall and the window was fully open. The maximum heat gain was 1.5 W on the 21st of November in the morning when the window was constructed of 100% glass and 10% of the window area was open. Among the 21st days of all months within the cool period, the 21st of March had the minimum heat loss as 46.4 W at 7 p.m. when the window size was 10% of the external wall and 10% of the window area was open. The maximum heat loss was 79950.0 W on the 21st of December at 7 p.m. when 30% of the external wall is constructed of glass and the window was fully open. In the whole cool period, the average heat gain via ECO was 138.9 W. Among the 21st days of all months within warm period, the 21st of May had the minimum heat gain for 2572.0 W in the morning when the window size was 10% of the external wall and the window was fully open. The maximum heat gain was 166.4 W on the 21st of October in the morning when the window size was 40% of the external wall and 10% of the window area was open. Among the 21st days of all months within the warm period, the 21st of June had the minimum heat loss as 71.0 W at 7 p.m. when the window size was 10% of the external wall and 10% of the window area was open. The maximum heat loss was 1163.7 W on the 21st of July at 7 p.m. when 40% of the external wall was constructed of glass and the window was fully open. In the whole warm period, the average heat gain via ECO was 227.3 W. The annual average (heat gain) minimum ECO was 333.9 W when the window was constructed of 100% glass and 10% of the window area was open. The annual (heat gain) maximum ECO was 20.0 W when the window size was 10% of the opaque wall size and the window was fully open. Within the winter (cool) period, the maximum heat gain was 6.8 W in December when the external wall was constructed of 10% glass and the window was 100% open. However, the minimum heat gain (201.3 W) was also in December. Within the summer (warm) period, the maximum heat gain was 15.8 W in October when the external wall was constructed of 10% glass and the window was fully open. The office gained 490.8 W of heat in June when the external wall was constructed fully of glass and 10% of the window area was open. The average ECO of only the 21st days of all months (heat gain) was 191.2 W, while the average ECO (heat gain) of the whole year (8760 h) was 190.7 W.
Table 5.
Seasonal and annual heat gain via the internal surface of external opaque surface of the office on the 21st days of all months.
As indicated in Table 6, among the 21st days of all months within the cool period, the 21st of March had the minimum heat gain of external conduction glazing (ECG) as 566.6 W in the morning when the window size was 10% of the external wall and the window was fully open. The maximum heat gain was 0.2 W on the 21st of December at noon when the window was constructed fully of glass and 10% of the window area was open. No heat loss was observed. In the whole cool period the average of ECG was 128.9 W (heat gain). Among the 21st days of all months within the warm period, the 21st of June had the minimum heat gain as 668.1 W in the morning when the window size was 10% of the external wall and the window was fully open. The maximum heat gain was 4.2 W on the 21st of October at noon when the window size was 100% glass and 10% of the window area was open. Among the 21st days of all months within the warm period, the 21st of September had the minimum heat loss as 2.3 W at noon when the window size was 100% glass and 10% of the window area was open. The maximum heat loss was 23.9 W on the 21st of July at noon when the external wall was constructed fully of glass and 10% of the window area was open. In the whole warm period, the average of ECG was 191.0 W (heat gain). Within the winter (cool) period, the minimum heat gain was 413.0 W is in April when the window was constructed fully of glass and 10% of the window area was open. The maximum heat gain was in February when the external wall was constructed of 10% glass and 60–100% of the window area was open. The office gained 11.7 W of heat then. Within the summer (warm) period, the minimum heat the office gained was 501.4 W in June when the external wall was constructed fully of glass and 10% of the window area was open. The maximum heat gain was 15.4 W in October when the external wall was constructed of 10% glass and 50–100% of the window area was open. The average ECG of only the 21st days of all months (heat gain) was 165.9 W, while the average ECG of the whole year (heat gain for 8760 h) was 161.5 W.
Table 6.
Seasonal and annual heat gain via the internal surface of external glass surface of the office on the 21st days of all months.
As indicated in Table 7, among the 21st days of all months within the cool period, the 21st of March had the minimum ach as 1.5 at 7 p.m. when the external wall was constructed of 20% glass and 10% of the window area was open. The maximum ach was found to be 1636.0 on the 21st January at noon when the window size was 100% glass and the window was fully open. In the whole cool period, the average was 170.0 ach. Within the warm period, the 21st of August had the minimum ach as 2.3 at 7 p.m. when the external wall as constructed of 20% glass and 10% of the window area was open. The maximum ach was 859.7 on the 21st of August at noon when the window size was 100% glass and the window was fully open. In the whole warm period, the average ach was 144.7. When the window was constructed of 10% glass and 10% of the window was open, the annual average minimum ach was 9.8. When the external opaque wall was constructed of 100% glass and the window was fully open, the annual average maximum ach was 480.4. The average ach of only the 21st days of all months was 157.6, while the average ach of the whole year (8760 h) was 157.4.
Table 7.
Seasonal and annual average ach of the office on the 21st days of all months.
When 10% of the window was open and the window size was 10%, 20%, 30%, 40%, 70%, 80%, 90%, or 100% of the opaque wall, the office gained −0.04 W maximum heat flow in July. When the window size was 50% or 60% of the opaque wall, the office gained 0.03 W maximum heat flow in July. Moreover, the office lost 0.07 W, 0.08 W, 0.09 W, 0.11 W, and 0.12 W maximum heat when the window size was 10%, 20%, 30–70%, 80–90%, and 100% of the opaque wall, respectively, in January. When 20% of the window area was open and the window size was 10–40% or 80% of the opaque wall, the office gained 0.04 W maximum heat in July. When the window size was 50–70% of the opaque wall, the office gained 0.03 W maximum heat in July. The office lost maximum heat, which was very close to 0 W, window size was 90–100% of the opaque wall (full glass wall).
The office lost 0.08 W, 0.09 W, 0.10 W, 0.11 W, and 0.12 W maximum heat when the window size was 10%, 20–60%, 70%, 80%, and 90–100% of the opaque wall, respectively, in January. When 30% of the window area was open and the window size was 10–30% of the opaque wall, the office gained 0.04 W maximum heat in July, but when the window size was 40–50% of the opaque wall, the office gained 0.03 W maximum heat in July. The office lost maximum heat that was close to zero when the window size was 60–100% of the opaque wall in November. Moreover, the office lost 0.09 W, 0.10 W, 0.11 W, 0.12 W, and 0.13 W maximum heat when the window size was 10–40%, 50–70%, 80%, 90%, and 100% of the opaque wall, respectively, in January. When 40% of the window area was open and the window size was 10% of the opaque wall, the office gained 0.04 W maximum heat in July. When the window size was 20–40% of the opaque wall, the office gained 0.03 W maximum heat in July, but the office gained maximum heat, which was very close to zero, when the windows size was 50–100% of the opaque wall in November.
The office lost 0.09 W, 0.10 W, 0.12 W, and 0.13 W maximum heat with when the window size was 10–30%, 40–70%, 80–90%, and 100% of the opaque wall in January. When 50–100% of the window area was open and the window size was 10% of the opaque wall, the office gained 0.04 W maximum heat in July. When the window size was 20% of the opaque wall, the office gained 0.03 W maximum heat in November. The office gained 0 W maximum heat in November when the window size was 30–100% of the opaque wall. Moreover, the office lost 0.10 W, 0.12 W, and 0.13 W maximum heat when the windows size was 10–70%, 80–90%, and 100% of the opaque wall, respectively, in January.
When the window size was 10% of the opaque external wall and 10% of the window area was open, the minimum ach was 20.6 in August, the maximum was 28.8 in February, and the annual average ach was 24.5. When 20% of the window area was open, the minimum ach was 8.2 in August, the maximum ach was 11.56 in February, and the annual average ach was 9.8. When 30% of the window area was open, the minimum ach was 12.3 in August, the maximum ach was 17.3 in February, and the annual average was 14.7. When 40% of the window area was open, the minimum ach was 16.5 in August, the maximum ach was 23.1 in February, and the annual average was 19.6. When 50% of the window was open, the minimum ach was 20.6 in August, the maximum ach was 28.8 in February, and the annual average was 24.5. When 60% of the window area was open, the minimum ach was 24.7 in August, the maximum ach was 34.6 in February, and the annual average was 29.4. When 70% of the window area was open, the minimum ach was 28.9 in August, the maximum ach was 40.4 in February, and the annual average was 34.3. When 80% of the window area was open, the minimum ach was 33.0 in August, the maximum ach was 46.2 in February, and the annual average was 39.3. When 90% of the window area was open, the minimum ach was 37.1 in August, the maximum ach was 51.9 in February, and the annual average was 44.2. When 100% of window area was open (fully open), the minimum ach was 44.3 in August, the maximum ach was 57.7 in February, and the annual average was 49.1.
When the window size was 20% of the opaque external wall and 10% of the window area was open, the minimum ach was 9.1 in August, the maximum ach was 12.9 in February, and the annual average ach was 10.9. When 20% of the window area was open, the minimum ach was 18.2 in August, the maximum ach was 25.8 in February, and the annual average was 21.8. When 30% of the window area was open, the minimum ach was 27.3 in August, the maximum ach was 38.7 in February, and the annual average was 32.7. When 40% of the window area was open, the minimum ach was 36.3 in August, the maximum ach was 51.6 in February, and the annual average was 43.6. When 50% of the window area was open, the minimum ach was 45.4 in August, the maximum ach was 64.5 in February, and the annual average was 54.6. When 60% of the window area was open, the minimum ach was 54.5 in August, the maximum ach was 77.4 in February, and the annual average was 65.5. When 70% of the window area was open, the minimum ach was 63.6 in August, the maximum ach was 90.3 in February, and the annual average was 76.4. When 80% of the window area was open, the minimum ach was 72.7 in August, the maximum ach was 103.2 in February, and the annual average was 87.3. When 90% of the window area was open, the minimum ach was 81.8 in August, the maximum was 116.1 in February, and the annual average was 98.2. When 100% of the window area was open (fully open), the minimum ach was 90.9 in August, the maximum ach was 129.0 in February, and the annual average was 109.1.
When the window size was 30% of the opaque external wall and 10% of the window area was open, the minimum air change per hour (ach was 13.8 in August, the maximum ach was 19.5 in February, and the annual average was 16.5. When 20% of the window area was open, the minimum ach was 27.7 in August, the maximum ach was 39.0 in February, and the annual average was 33.1. When 30% of the window area was open, the minimum ach was 41.5 in August, the maximum ach was 58.5 in February, and the annual average was 49.6. When 40% of the window area was open, the minimum ach was 55.4 in August, the maximum ach was 78.0 in February, and the annual average was 66.2. When 50% of the window area was open, the minimum ach was 69.2 in August, the maximum ach was 97.5 in February, and the annual average was 82.7. When 60% of the window area was open, the minimum ach was 83.0 in August, the maximum ach was 117.0 in February, and the annual average was 99.2. When 70% of the window area was open, the minimum ach was 96.9 in August, the maximum ach was 136.5 in February, and the annual average was 115.8. When 80% of the window area was open, the minimum ach was 110.7 in August, the maximum ach was 156.0 in February, and the annual average was 132.3. When 90% of the window area was open, the minimum ach was 124.6 in August, the maximum ach was 175.5 in February, and the annual average was 148.8. When 100% of the window area was open (fully open), the minimum ach was 138.4 in August, the maximum ach was 194.9 in February, and the annual average was 165.3.
When the window size was 40% of the opaque external wall and 10% of the window area was open, the minimum ach was 19.2 in August, the maximum ach was 27.2 in February, and the annual average was 23.0. When 20% of the window area was open, the minimum ach was 38.4 in August, the maximum ach was 54.5 in February, and the annual average was 46.1. When 30% of the window area was open, the minimum ach was 57.6 in August, the maximum ach was 81.7 in February, and the annual average was 69.1. When 40% of the window area was open, the minimum ach was 76.8 in August, the maximum ach was 108.9 in February, and the annual average was 92.1. When 50% of the window area was open, the minimum ach was 95.9 in August, the maximum ach was 136.1 in February, and the annual average was 115.2. When 60% of the window area was open, the minimum ach was 115.1 in August, the maximum ach was 163.4 in February, and the annual average was 138.2. When 70% of the window area was open, the minimum ach was 134.3 in August, the maximum ach was 190.6 in February, and the annual average was 161.2. When 80% of the window area was open, the minimum ach was 153.5 in August, the maximum ach was 217.8 in February, and the annual average was 184.2. When 90% of the window area was open, the minimum ach was 172.7 in August, the maximum ach was 245.0 in February, and the annual average was 207.2. When 100% of the window area was open (fully open), the minimum ach was 191.8 in August, the maximum ach was 272.2 in February, and the annual average was 230.2.
When the window size was 50% of the opaque external wall and 10% of the window area was open, the minimum ach was 23.5 in August, the maximum ach was 32.6 in February; the annual average ach was 27.9. When 20% of the window area was open, the minimum ach was 47.0 in August, the maximum ach was 65.2 in February, and the annual average was 55.7. When 30% of the window area was open, the minimum ach was 70.5 in August, the maximum ach was 97.7 in February, and the annual average was 83.5. When 40% of the window area was open, the minimum ach was 94.0 in August, the maximum ach was 130.3 in February, and the annual average was 111.3. When 50% of the window area was open, the minimum ach was 117.4 in August, the maximum ach was 162.8 in February, and the annual average was 139.1. When 60% of the window area was open, the minimum ach was 140.9 in August, the maximum ach was 195.3 in February, and the annual average was 166.9. When 70% of the window area was open, the minimum ach was 164.3 in August, the maximum ach was 227.9 in February, and the annual average was 194.7. When 80% of the window area was open, the minimum ach was 187.8 in August, the maximum ach was 260.4 in February, and the annual average was 222.5. When 90% of the window area was open, the minimum ach was 211.3 in August, the maximum ach was 292.9 in February, and the annual average was 250.3. When 100% of the window area was open (fully open), the minimum ach was 234.7 in August, the maximum ach was 325.4 in February, and the annual average was 278.0.
When the window size was 60% of the opaque external wall and 10% of the window area was open, the minimum ach was 28.7 in August, the maximum ach was 40.1 in February, and the annual average was 34.2. When 20% of the window area was open, the minimum ach 57.4 in August, the maximum ach was 80.1 in February; the annual average was 68.3. When 30% of the window area was open, the minimum ach was 86.0 in August, the maximum ach was 120.1 in February, and the annual average was 102.3. When 40% of the window area was open, the minimum ach was 114.6 in August, the maximum ach was 160.1 in February, and the annual average was 136.4. When 50% of the window area was open, the minimum ach was 143.2 in August, the maximum ach was 200.1 in February, and the annual average was 170.4. When 60% of the window area was open, the minimum ach was 171.8 in August, the maximum ach was 240.1 in February, and the annual average was 204.5. When 70% of the window area was open, the minimum ach was 200.4 in August, the maximum ach was 280.0 in February, and the annual average was 238.5. When 80% of the window area was open, the minimum ach was 229.0 in August, the maximum ach was 320.0 in February, and the annual average was 272.5. When 90% of the window area was open, the minimum ach was 257.6 in August, the maximum ach was 360.0 in February, and the annual average was 306.5. When 100% of the window area was open (fully open), the minimum ach was 286.2 in August, the maximum ach was 399.9 in February, and the annual average was 340.6.
When the window size was 70% of the opaque external wall and 10% of the window area was open, the minimum ach was 33.6 in August, the maximum ach was 46.8 in February, and the annual average was 39.9. When 20% of the window area was open, the minimum ach was 67.2 in August, the maximum ach was 93.6 in February, and the annual average was 79.8. When 30% of the window area was open, the minimum ach was 100.7 in August, the maximum ach was 140.3 in February, and the annual average was 119.6. When 40% of the window area was open, the minimum ach was 134.2 in August, the maximum ach was 187.0 in February, and the annual average was 159.4. When 50% of the window area was open, the minimum ach was 167.6 in August, the maximum ach was 233.7 in February, and the annual average was 199.2. When 60% of the window area was open, the minimum ach was 201.1 in August, the maximum ach was 280.4 in February, and the annual average was 239.0. When 70% of the window area was open, the minimum ach was 234.6 in August, the maximum ach was 327.1 in February, and the annual average was 278.8. When 80% of the window area was open, the minimum ach was 268.1 in August, the maximum ach was 373.8 in February, and the annual average was 318.6. When 90% of the window area was open, the minimum ach was 301.5 in August, the maximum ach was 420.5 in February, and the annual average was 358.4. When 100% of the window area was open (fully open), the minimum ach was 335.0 in August, the maximum ach was 467.2 in February, and the annual average was 398.1.
When the window size was 80% of the opaque external wall and 10% of the window area was open, the minimum ach was 33.6 in August, the maximum ach was 46.7 in February, and the annual average was 39.8. When 20% of the window area was open, the minimum ach was 67.0 in August, the maximum ach was 93.3 in February, and the annual average was 79.6. When 30% of the window area was open, the minimum ach was 100.5 in August, the maximum ach was 139.8 in February, and the annual average was 119.2. When 40% of the window area was open, the minimum ach was 133.9 in August, the maximum ach was 186.4 in February, and the annual average was 158.9. When 50% of the window area was open, the minimum ach was 167.3 in August, the maximum ach was 232.9 in February, and the annual average was 198.6. When 60% of the window area was open, the minimum ach was 211.1 in August, the maximum ach was 290.4 in February, and the annual average was 261.4. When 70% of the window area was open, the minimum ach was 234.1 in August, the maximum ach was 325.9 in February, and the annual average was 278.0 for yearly average. When 80% of the window area was open, the minimum ach was 267.5 in August, the maximum ach was 372.5 in February, and the annual average was 317.6. When 90% of the window area was open, the minimum ach was 300.9 in August, the maximum ach was 419.0 in February, and the annual average was 357.3. When 100% of the window area was open (fully open), the minimum ach was 334.3 in August, the maximum ach was 465.5 in February, and the annual average was 397.0.
When window size was 90% of the opaque external wall and 10% of the window area was open, the minimum ach was 38.1 in August, the maximum ach was 53.2 in February, and the annual average was 45.3. When 20% of the window area was open, the minimum ach was 76.1 in August, the maximum ach was 106.2 in February, and the annual average 90.5. When 30% of the window area was open, the minimum ach was 114.1 in August, the maximum ach was 159.2 in February, and the annual average was 135.6. When 40% of the window area was open, the minimum ach was 152.0 in August, the maximum ach was 212.2 in February, and the annual average was 180.8. When 50% of the window area was open, the minimum ach was 190.0 in August, the maximum ach was 265.2 in February, and the annual average was 225.9. When 60% of the window area was open, the minimum ach was 227.9 in August, the maximum ach was 318.2 in February, and the annual average was 271.0. When 70% of the window are was open, the minimum ach was 265.8 in August, the maximum ach was 371.1 in February, and the annual average was 316.1. When 80% of the window area was open, the minimum ach was 303.7 in August, the maximum ach was 424.1 in February, and the annual average was 361.3. When 90% of the window area was open, the minimum ach was 341.6 in August, the maximum ach was 477.1 in February, and the annual average was 406.4. When 100% of the window area was open (fully open), the minimum ach was 379.5 in August, the maximum ach was 530.1 in February, and the annual average was 451.5.
When the window size was 100% of the opaque external wall and 10% of the window area was open, the minimum ach was 40.5 in August, the maximum ach was 56.6 in February, and the annual average was 48.2. When 20% of the window area was open, the minimum ach was 80.9 in August, the maximum ach was 113.1 in February, and the annual average was 96.3. When 30% of the window area was open, the minimum ach was 121.2 in August, the maximum ach was 169.5 in February, and the annual average was 144.3. When 40% of the window area was open, the minimum ach was 161.5 in August, the maximum ach was 225.9 in February, and the annual average was 192.3. When 50% of the window area was open, the minimum ach was 201.8 in August, the maximum ach was 282.3 in February, and the annual average was 240.4. When 60% of the window area was open, the minimum ach was 242.1 in August, the maximum ach was 338.8 in February, and the annual average was 288.4. When 70% of the window area was open, the minimum ach was 282.4 in August, the maximum ach was 395.2 in February, and the annual average was 336.4. When 80% of the window area was open, the minimum ach was 322.7 in August, the maximum ach was 451.6 in February, and the annual average was 384.4. When 90% of the window area was open, the minimum ach was 363.0 in August, the maximum ach was 508.0 in February, and the annual average was 432.4. When 100% of the window area was open (fully open), the minimum ach was 403.3 in August, the maximum ach was 564.4 in February, and the annual average was 480.4.
Category I, II, and III for very low polluted buildings as stated in Table 1 should have at least 0.6, 0.42 and 0.24 ach, respectively. These ach values should always be achievable through all window sizes on opaque walls and all percentages of open window areas. Moreover, category I, II, and III for very low polluted buildings where people smoke should at least have ach values of 1.44, 0.42 and 0.24, respectively. Category I for very low polluted building where smoking is allowed could not be achieved for 60 h (0.007% of the whole year) when the window size was 10% of the opaque wall and 20% of the window area was opening. This category could not be achieved for 11 h (0.001% of the whole year) when the window size was 10% of the opaque wall and 30% of the window was open, either. All remaining window sizes on the opaque wall and all remaining percentages of the open window area were able to yield the minimum ach for this category. Category II for very low polluted buildings where smoking is allowed could not be achieved for 12 h (0.001% of the whole year) when the window size was 10% of the opaque wall and 20% of the window area was open. Category II for very low polluted buildings where smoking is allowed could not be achieved for only one hour (0.0001% of the whole year) when the window size was 10% of the opaque wall and 30% of the window area was open. Category III for very low polluted buildings where smoking is allowed could not be achieved for 2 h (0.0002% of the whole year) when the window size was 10% of the opaque wall and 20% of the window area was open. However, category III where smoking is allowed could be achieved in all remaining window sizes on the opaque wall and all remaining percentages of the open window area.
Category I, II, and III for low polluted buildings as stated in Table 1 should have at least 1.2, 0.84 and 0.48 ach, respectively. Category I for low polluted buildings could not be achieved for 20 h (0.002% of the whole year) when the window size was 10% of the opaque wall and 20% of the window was open. Category I for low polluted buildings could not be achieved for 5 h (0.0006% of the whole year) when the window size was 10% of the opaque wall and 30% of the window area was open. All remaining window sizes on the opaque wall and all remaining percentages of the open window area could yield at least 1.2 ach for this category. Category II for low polluted buildings could not be achieved for 5 h (0.0006% of the whole year) when the window size was 10% of the opaque wall and 20% of the window area was open. All remaining window sizes on the opaque wall and all remaining percentages of the open window area could yield at least 0.84 ach for category II. All window sizes on the opaque wall and all percentages of the open window area could yield at least 0.48 ach for category III, for low polluted buildings. Category I, II, and III for low polluted buildings where smoking is allowed should have at least 2.04, 1.44, and 0.84 ach, respectively. Category I for low polluted buildings where smoking is allowed could not be achieved for 7 h (0.0008% of the whole year) when the window size was 10% of the opaque wall and 10% of the window area was open. Category I for low polluted buildings where smoking is allowed could not be achieved for 250 h (0.03% of the whole year) when the window size was 10% of the opaque wall and 20% of the window area was open. Category I for low polluted buildings where smoking is allowed could not be achieved for 52 h (0.006% of the whole year) when the window size was 10% of the opaque wall and 30% of the window area was open. Category I for low polluted buildings where smoking is allowed could not be achieved for 15 h (0.002% of the whole year) when the window size was 10% of the opaque wall and 40% of the window area was open. Category I for low polluted buildings where smoking is allowed could not be achieved for 8 h (0.0009% of the whole year) when the window size was 10% of the opaque wall and 50% of the window area was open (half open window). All remaining window sizes on the opaque wall and all remaining percentages of the open window area could yield at least 2.04 ach for category I for low polluted buildings where smoking is allowed. Category II for low polluted buildings where smoking is allowed could not be achieved for 61 h (0.007% of the whole year) when the window size was 10% of the opaque wall and 20% of the window area was open. Category II for low polluted buildings where smoking is allowed could not be achieved for 12 h (0.001% of the whole year) when the window size was 10% of the opaque wall and 30% of the window area was open. Category II for low polluted buildings where smoking is allowed could not be achieved for 4 h (0.0005% of the whole year) when the window size was 10% of the opaque wall and 40% of the window area was open. Category II for low polluted buildings where smoking is allowed could be achieved in all remaining window sizes on the opaque wall and all percentages of the open window area. Category III for low polluted buildings where smoking is allowed could not be achieved for 5 h (0.0006% of the whole year) when the window size was 10% of the opaque wall and 20% of the window area was open. All remaining window sizes on the opaque wall and all remaining percentages of the open window area could yield at least 0.84 ach according to category III for low polluted buildings where smoking is allowed.
Category I, II, and III for non-low polluted buildings as stated in Table 1 should have at least 2.4, 1.68, and 0.96 ach, respectively. Category I for non-low polluted buildings could not be achieved for 13 h (0.001% of the whole year) when the window size was 10% of the opaque wall and 10% of the window area was open. Category I for non-low polluted buildings could not be achieved for 373 h (0.04% of the whole year) when the window size was 10% of the opaque wall and 20% of the window area was open. Category I for non-low polluted buildings could not be achieved for 105 h (0.01% of the whole year) when the window size was 10% of the opaque all and 30% of the window area was open. Category I for non-low polluted buildings could not be achieved for 29 h (0.003% of the whole year) when the window size was 10% of the opaque wall and 40% of the window area was open. Category I for non-low polluted buildings could not be achieved for 13 h (0.001% of the whole year) when the window size was 10% of the opaque wall and 50% of the window area was open. Category I for non-low polluted buildings could not be achieved for 7 h (0.0008% of the whole year) when the window size was 10% of the opaque wall and 60% of the window area was open. Category I for non-low polluted buildings could not be achieved for only one hour (0.0001% of the whole year) when the window size was 10% of the opaque wall and 70% of the window area was open. All remaining window sizes on the opaque wall and all remaining percentages of the open window area could yield at least 2.4 ach for category I for non-low polluted buildings.
Category II for non-low polluted buildings could not be achieved for 116 h (0.01% of the whole year) when the window size was 10% of the opaque wall and 20% of the window area was open. Category II for non-low polluted buildings could not be achieved for 19 h (0.002% of the whole year) when the window size was 10% of the opaque wall and 30% of the window area was open. Category II for non-low polluted buildings could not be achieved for 8 h (0.0009% of the whole year) when the window size was 10% of the opaque wall and 40% of the window area was open. All remaining window sizes on the opaque wall and all remaining percentages of the open window area could yield at least 1.68 ach for category II for non-low polluted buildings.
Category III, for non-low polluted buildings could not be achieved for 10 h (0.001% of the whole year) when the window size was 10% of the opaque wall and 20% of the window area was open. Category III for non-low polluted buildings could not be achieved for only one hour (0.0001% of the whole year) when the window size was 10% of the opaque wall and 30% of the window area was open. The minimum ach of 0.96 could be achieved successfully for category III for non-low polluted buildings. Category I, II, and III for non-low polluted buildings as state in Table 1 where smoking is allowed should have at least 3.24, 2.28, and 1.32 ach, respectively.
Category I for non-low polluted buildings where smoking is allowed could not be achieved for 48 h (0.005% of the whole year) when the window size was 10% of the opaque wall and 10% of the window area was open. Category I for non-low polluted buildings where smoking is allowed could not be achieved for 782 h (0.09% of the whole year) when the window size was 10% of the opaque wall and 20% of the window area was open. Category I for non-low polluted buildings where smoking is allowed could not be achieved for 311 h (0.04% of the whole year) when the window size was 10% of the opaque wall and 30% of the window area was open. Category I for non-low polluted buildings where smoking is allowed could not be achieved for 124 h (0.01% of the whole year) when the window size was 10% of the opaque wall and 40% of the window area was open. Category I for non-low polluted buildings where smoking is allowed could not be achieved for 48 h (0.005% of the whole year) when the window size was 10% of the opaque wall and 50% of the window area was open (half open window). Category I for non-low polluted buildings where smoking is allowed could not be achieved for 22 h (0.002% of the whole year) when the window size was 10% of the opaque wall and 60% of the window area was open. Category I for non-low polluted buildings where smoking is allowed could not be achieved for 12 h (0.001% of the whole year) when the window size was 10% of the opaque wall and 70% of the window area was open. Category I for non-low polluted buildings where smoking is allowed could not be achieved for 10 h (0.001% of the whole year) when the window size was 10% of the opaque wall and 80% of the window area was open. Category I for non-low polluted buildings where smoking is allowed could not be achieved for 5 h (0.0006% of the whole year) when the window size was 10% of the opaque wall and 90% of the window was open. Category I for non-low polluted buildings where smoking is allowed could not be achieved for only one hour (0.0001% of the whole year) when the window size was 100% of the opaque wall (full size glass) and 100% of the window area was open (fully open). The minimum ach value of 3.24 could be achieved in the rest of the combinations for category I for non-low polluted buildings.
Category II for non-low polluted buildings where smoking is allowed could not be achieved for 11 h (0.001% of the whole year) when the window size was 10% of the opaque wall and 10% of the window area was open. Category II for non-low polluted buildings where smoking is allowed could not be achieved for 347 h (0.04% of the whole year) when the window size was 10% of the opaque wall and 20% of the window area was open. Category II for non-low polluted buildings where smoking is allowed could not be achieved for 84 h (0.009% of the whole year) when the window size was 10% of the opaque wall and 30% of the window area was open. Category II for non-low polluted buildings where smoking is allowed could not be achieved for 24 h (0.003% of the whole year) when the window size was 10% of the opaque wall and 40% of the window area was open. Category II for non-low polluted buildings where smoking is allowed could not be achieved for 12 h (0.001% of the whole year) when the window size was 10% of the opaque wall and 50% of the window area was open (half open). Category II for non-low polluted buildings where smoking is allowed could not be achieved for 5 h (0.0006% of the whole year) when the window size was 10% of the opaque wall and 60% of the window area was open. All remaining window sizes on the opaque wall and all remaining percentages of the open window area could yield at least 2.28 ach for category II for non-low polluted buildings where smoking is allowed.
Category III for non-low polluted buildings where smoking is allowed could not be achieved for 39 h (0.004% of the whole year) when the window size was 10% of the opaque wall and 20% of the window area was open. Category III for non-low polluted buildings where smoking is allowed could not be achieved 9 h (0.001% of the whole year) when the window size was 10% of the opaque wall and 30% of the window area was open. All remaining window sizes on the opaque wall and all remaining percentages of the open window area could yield at least 1.32 ach for category III for non-low polluted buildings where smoking is allowed.
4. Conclusions
Regarding the BHT, the office environment lost 0.001 W of heat during the winter (cool season) and gained 0.01 W of heat during the summer (warm) season. In addition to these, the average BHT as heat loss was 2.5 Watts on only the 21st days of all months. The average heat transfer (heat gain) in the whole year (8760 h) was 2.4 W, which was heat gain. The external conduction opacity of the office environment gained 138.9 W of heat during the winter (cool season), but 227.3 W of heat during the summer (warm) season. The average heat gain of the external conduction opacity on only the 21st days of all months was 191.2 W, and its average heat gain of the whole year (8760 h) was 190.7 W. However, the external conduction glazing of the office environment gained 128.9 W of heat during the winter (cool season) and 191.0 W of heat during the summer (warm) season. The average heat gain of the external conduction opaque on only the 21st days of all months was 165.9 W, and its average heat gain of the whole year (8760 h) was 161.5 W.
The ach of the office environment was 170.0 during winter (cool season) and 144.7 during the summer (warm) season. The ach on only the 21st days of all months was 157.6, but the ach of the whole year (8760 h) was 157.4.
The ach according to very low polluted smoke-free buildings in category I, II, and III (min. 0.6, 0.42 and 0.24 ach, respectively) could be achieved in all window sizes on the opaque wall and all percentages of the open window area. However, the ach could not be achieved according to very low polluted buildings where smoking is allowed in category I, II, and III (min. 1.44, 1.02, and 0.6 ach, respectively) as follows: The ach for category I could not be achieved for 0.007% of the whole year when the window size was 10% of the opaque wall and 20% of the window area was open. The minimum ach could not be achieved for 0.001% of the whole year when the window size was 10% of the opaque wall and 30% of the window area was open, either. The minimum ach value of 1.02 according to very low polluted buildings in category II could not be achieved for 0.001% of the whole year when the window size was 10% of the opaque wall and 20–30% of the window area was open. The minimum ach of 0.6 according to very low polluted buildings where smoking is allowed in category III could not be obtained for 0.0002% of the whole year when the window size was 10% of the opaque wall and 20% of the window area was open. The ach could not be achieved according to low polluted smoke-free buildings in category I, II, and III (min. 1.2, 0.84, and 0.48 ach, respectively) as follows: The minimum ach could not be achieved according to category I for 0.002% of the whole year when the window size was 10% of the opaque wall and 20% of the window area was open. The ach according to category I could not be achieved for 0.0006% of the whole year when the window size was 10% of the opaque wall and 30% of the window area was open. The ach according to category II could not be achieved for 0.0006% of the whole year when the window size was 10% of the opaque wall and 20% of the window area was open. The ach according to category III could always be achieved in all window sizes and all percentages of the open window area.
The ach according to low polluted smoke-free buildings in category I, II, and III (min. 1.2, 0.84, and 0.48 ach, respectively) could not be achieved as follows: The ach according to category I could not be achieved for 0.002% of the whole year when the window size was 10% of the opaque wall and 20% of the window area was open. The ach could not be achieved for 0.0006% of the whole year when the window size was 10% of the opaque wall and 30% of the window area was open. The ach in category II could not be provided for 0.0006% of the whole year when the window size was 10% of the opaque wall and 20% of the window area was open. Moreover, the ach values according to low polluted buildings where smoking is allowed in category I, II, and III (min. 2.04, 1.44, and 0.84 ach, respectively) could not be achieved as follows: The ach according to category I could not be achieved for 0.0008% of the whole year when the window size was 10% of the opaque wall and 10% of the window area was open. The ach according to category I could not be achieved for 0.03% of the whole year when the window size was 10% of the opaque wall and 20% of the window area was open. The ach according to category I could not be achieved for 0.006% of the whole year when the window size was 10% of the opaque wall and 30% of the window area was open. The ach according to category I could not be achieved for 0.002% of the whole year when the window size was 10% of the opaque wall and 40% of the window area was open. The ach according to category I could not be achieved for 0.0009% of the whole year when the window size was 10% of the opaque wall and 50% of the window area was open (half open). The ach according to category II could not be achieved for 0.007% of the whole year when the window size was 10% of the opaque wall and 20% of the window area was open. The ach according to category II could not be achieved for 0.001% of the whole year when the window size was 10% of the opaque wall and 30% of the window area was open. The ach according to category II could not be achieved for 0.0005% of the whole year when the window size was 10% of the opaque wall and 40% of the window area was open. The ach according to category III could not be achieved for 0.0006% of the whole year when the window size was 10% of the opaque wall and 20% of the window area was open.
The ach according to non-low polluted smoke-free buildings in category I, II, and III (min. 2.4, 1.68 and 0.96 ach, respectively) could not be achieved as follows: The ach according to category I could not be achieved for 0.001% of the whole year when the window size was 10% of the opaque wall and 10% of the window area was open. The ach according to category I could not be achieved for 0.04% of the whole year when the window size was 10% of the opaque wall and 20% of the window area was open. The ach according to category I could not be achieved for 0.01% of the whole year when the window size was 10% of the opaque wall and 30% of the window area was open. The ach according to category I could not be achieved for 0.003% of the whole year when the window size was 10% of the opaque wall and 40% of the window area was open. The ach according to category I could not be achieved for 0.001% of the whole year when the window size was 10% of the opaque wall and 50% of the window area was open. The ach according to category I could not be achieved for 0.0008% of the whole year when the window size was 10% of the opaque wall and 60% of the window area was open. The ach according to category I could not be achieved for 0.0001% of the whole year when the window size was 10% of the opaque wall and 70% of the window area was open. The ach according to category II could not be achieved for 0.01% of the whole year when the window size was 10% of the opaque wall and 20% of the window area was open. The ach according to category II could not be achieved for 0.002% of the whole year when the window size was 10% of the opaque wall and 30% of the window area was open. The ach according to category II could not be achieved for 0.0009% of the whole year when the window size was 10% of the opaque wall and 40% of the window area was open. The ach according to category III could not be achieved for 0.001% of the whole year when the window size was 10% of the opaque wall and 20% of the window area was open. The ach according to category III could not be achieved for 0.0001% of the whole year when the window size was 10% of the opaque wall and 30% of the window area was open.
Moreover, the ach values according to non-low polluted buildings where smoking is allowed in category I, II, and III (min. 3.24, 2.28, and 1.32 ach, respectively) could not be achieved. The ach according to category I could not be achieved for 0.005% of the whole year when the window size was 10% of the opaque wall and 10% of the window area was open. The ach according to category I could not be achieved for 0.09% of the whole year when the window size was 10% of the opaque wall and 20% of the window area was open. The ach according to category I could not be achieved for 0.04% of the whole year when the window size was 10% of the opaque wall and 30% of the window area was open. The ach according to category I could not be achieved for 0.01% of the whole year when the window size was 10% of the opaque wall and 40% of the window area was open. The ach according to category I could not be achieved for 0.005% of the whole year when the window size was 10% of the opaque wall and 50% of the window area was open. The ach according to category I could not be achieved for 0.002% of the whole year when the window size was 10% of the opaque wall and 60% of the window area was open. The ach according to category I could not be achieved for 0.001% of the whole year when the window size was 10% of the opaque wall and 70% of the window area was open. The ach according to category I could not be achieved for 0.001% of the whole year when the window size was 10% of the opaque wall and 80% of the window area was open. The ach according to category I could not be achieved for 0.0006% of the whole year when the window size was 10% of the opaque wall and 90% of the window area was open. The ach according to category I could not be achieved for 0.0001% of the whole year when the windows size was 100% of the opaque wall and 100% of the window area was open (fully open window). The ach according to category II could not be achieved for 0.001% of the year when the window size was 10% of the opaque wall and 10% of the window area was open. The ach according to category II could not be achieved for 0.04% of the whole year when the window size was 10% of the opaque wall and 20% of the window area was open. The ach according to category II could not be achieved for 0.009% of the whole year when the window size was 10% of the opaque wall and 30% of the window area was open. The ach according to category II could not be achieved for 0.003% of the year when the window size was 10% of the opaque wall and 40% of the window area was open. The ach according to category II could not be achieved for 0.001% of the year when the window size was 10% of the opaque wall and 50% of the window area was open (half open). The ach according to category II could not be achieved for 0.0006% of the year when the window size was 10% of the opaque wall and 60% of the window area was open. The ach according to category III could not be achieved for 0.004% of the whole year when the window size was 10% of the opaque wall and 20% of the window area was open. The ach according to category III could not be achieved for 0.001% of the year when the window size was 10% of the opaque wall and 30% of the window area was open.
Funding
This research received no external funding.
Conflicts of Interest
The author declares no conflict of interest.
References
- Teppner, R.; Langensteiner, B.; Meile, W.; Brenn, G.; Kerschbaumer, S. Air change rates driven by the flow around and through a building storey with fully open or tilted windows: An experimental and numerical study. Energy Build. 2014, 76, 640–653. [Google Scholar] [CrossRef]
- Tang, Y.; Li, X.; Zhu, W.; Cheng, P.L. Predicting single-sided airflow rates based on primary school experimental study. Build. Environ. 2016, 98, 71–79. [Google Scholar] [CrossRef]
- Wang, Y.; Zhao, F.-Y.; Kuckelkorn, J.; Liu, D.; Liu, J.; Zhang, J.-L. Classroom energy efficiency and air environment with displacement natural ventilation in a passive public school building. Energy Build. 2014, 70, 258–270. [Google Scholar] [CrossRef]
- Schulze, T.; Eicker, U. Controlled natural ventilation for energy efficient buildings. Energy Build. 2013, 56, 221–232. [Google Scholar] [CrossRef]
- Bayoumi, M. Energy saving method for improving thermal comfort and air quality in warm humid climates using isothermal high velocity ventilation. Renew. Energy 2017, 114, 502–512. [Google Scholar] [CrossRef]
- Lei, Z.; Liu, C.; Wang, L.; Li, N. Effect of natural ventilation on indoor air quality and thermal comfort in dormitory during winter. Build. Environ. 2017, 125, 240–247. [Google Scholar] [CrossRef]
- Schulze, T.; Gürlich, D.; Eicker, U. Performance assessment of controlled natural ventilation for air quality control and passive cooling in existing and new office type buildings. Energy Build. 2018, 172, 265–278. [Google Scholar] [CrossRef]
- Elshafei, G.; Negm, A.; Bady, M.; Suzuki, M.; Ibrahim, M.G. Numerical and experimental investigations of the impacts of window parameters on indoor natural ventilation in a residential building. Energy Build. 2017, 141, 321–332. [Google Scholar] [CrossRef]
- Wang, J.; Wang, S.; Zhang, T.; Battaglia, F. Assessment of single-sided natural ventilation driven by buoyancy forces through variable window configurations. Energy Build. 2017, 139, 762–779. [Google Scholar] [CrossRef]
- Von Grabe, J.; Svoboda, P.; Bäumler, A. Window ventilation efficiency in the case of buoyancy ventilation. Energy Build. 2014, 72, 203–211. [Google Scholar] [CrossRef]
- Nomura, M.; Hiyama, K. A review: Natural ventilation performance of office buildings in Japan. Renew. Sustain. Energy Rev. 2017, 74, 746–754. [Google Scholar] [CrossRef]
- Castillo, J.A.; Huelsz, G. A methodology to evaluate the indoor natural ventilation in hot climates: Heat balance index. Build. Environ. 2017, 114, 366–373. [Google Scholar] [CrossRef]
- Energy Consumption Guide 19, Energy Use in Offices. Available online: http://www.cibse.org/getmedia/7fb5616f-1ed7-4854-bf72-2dae1d8bde62/ECG19-Energy-Use-in-Offices-(formerly-ECON19).pdf.aspx (accessed on 2 August 2018).
- Zomorodian, Z.S.; Tahsildoost, M. Assessment of window performance in classrooms by long term spatial comfort metrics. Energy Build. 2017, 134, 80–93. [Google Scholar] [CrossRef]
- Da Graça, G.C.; Linden, P. Ten questions about natural ventilation of non-domestic buildings. Build. Environ. 2016, 107, 263–273. [Google Scholar] [CrossRef]
- Lee, J.-Y.; Leigh, S.-B.; Kim, T.; Cho, S. Development and application of the KLT method for the energy performance evaluation of non-residential buildings in the early design stage. J. Asian Archit. Build. 2015, 14, 701–708. [Google Scholar] [CrossRef]
- Ismail, M.A.; Keumala, N.; Dabdoob, R.M. Review on integrating sustainability knowledge into architectural education: Practice in the UK and USA. J. Clean. Prod. 2017, 140, 1542–1552. [Google Scholar] [CrossRef]
- Sarbu, I.; Sebarchievici, C. Aspects of indoor environmental quality assessment in buildings. Energy Build. 2013, 60, 410–419. [Google Scholar] [CrossRef]
- Mousa, W.A.Y.; Lang, W.; Auer, T.; Yousef, W.A. A pattern recognition approach for modeling the air change rates in naturally ventilated buildings from limited steady-state CFD simulations. Energy Build. 2017, 155, 54–65. [Google Scholar] [CrossRef]
- Grygierek, K.; Ferdyn-Grygierek, J. Multi-objective optimization of the envelope of building with natural ventilation. Energies 2018, 11, 1383. [Google Scholar] [CrossRef]
- Coccagna, M.; Cesari, S.; Valdiserri, P.; Romio, P.; Mazzacane, S. Impact of morphological and functional features on hospitals’ energy consumption: A comparative analysis of six case studies. WSEAS Trans. Environ. Dev. 2018, 14, 212–225. [Google Scholar]
- The American Society of Heating, Refrigerating and Air-Conditioning Engineers (ASHRAE). ANSI/ASHRAE Standard 55-2013. In ASHRAE Standard-Thermal Environmental Conditions for Human Occupancy, American Society of Heating, Refrigeration and Air-Conditioning Engineers; ASHRAE: Atlanta, GA, USA, 2013. [Google Scholar]
- Fan, G.; Xie, J.; Yoshino, H.; Yanagi, U.; Hasegawa, K.; Wang, C.; Zhang, X.; Liu, J. Investigation of indoor thermal environment in the homes with elderly people during heating season in Beijing, China. Build. Environ. 2017, 126, 288–303. [Google Scholar] [CrossRef]
- Persily, A.K. Field measurement of ventilation rates. Indoor Air 2016, 26, 97–111. [Google Scholar] [CrossRef] [PubMed]
- Jomehzadeh, F.; Nejat, P.; Calautit, J.K.; Yusof, M.B.M.; Zaki, S.A.; Hughes, B.R.; Yazid, M.N.A.W.M. A review on windcatcher for passive cooling and natural ventilation in buildings, Part 1: Indoor air quality and thermal comfort assessment. Renew. Sustain. Energy Rev. 2017, 70, 736–756. [Google Scholar] [CrossRef]
- The American Society of Heating, Refrigerating and Air-Conditioning Engineers (ASHRAE). Handbook of Fundamentals, American Society of Heating, Refrigerating and Air-Conditioning Engineers; ASHRAE: Atlanta, GA, USA, 2013. [Google Scholar]
- Kumar, P.; Martani, C.; Morawska, L.; Norford, L.; Choudhary, R.; Bell, M.; Leach, M. Indoor air quality and energy management through real-time sensing in commercial buildings. Energy Build. 2016, 111, 145–153. [Google Scholar] [CrossRef]
- Han, G.; Srebric, J.; Enache-Pommer, E. Different modeling strategies of infiltration rates for an office building to improve accuracy of building energy simulations. Energy Build. 2015, 86, 288–295. [Google Scholar] [CrossRef]
- National Standard of the People’s Republic of China. GB 50736-2012, Design Code for Heating Ventilation and Air Conditioning of Civil Buildings; China Architecture and Building Press: Beijing, China, 2012. [Google Scholar]
- The American Society of Heating, Refrigerating and Air-Conditioning Engineers (ASHRAE). ANSI/ASHRAE Standard 62.1-2016. Ventilation for acceptable indoor air quality. In American Society of Heating, Refrigerating and Air-Conditioning Engineers; ASHRAE: Atlanta, GA, USA, 2016. [Google Scholar]
- Fletcher, M.J.; Johnston, D.K.; Glew, D.W.; Parker, J.M. An empirical evaluation of temporal overheating in an assisted living Passivhaus dwelling in the UK. Build. Environ. 2017, 121, 106–118. [Google Scholar] [CrossRef]
- Zhou, C.; Wang, Z.; Chen, Q.; Jiang, Y.; Pei, J. Design optimization and field demonstration of natural ventilation for high-rise residential buildings. Energy Build. 2014, 82, 457–465. [Google Scholar] [CrossRef]
- Etheridge, D. A perspective on fifty years of natural ventilation research. Build. Environ. 2015, 91, 51–60. [Google Scholar] [CrossRef]
- Dimitroulopoulou, C. Ventilation in European dwellings: A review. Build. Environ. 2012, 47, 109–125. [Google Scholar] [CrossRef]
- Cheng, Y.; Lin, Z.; Fong, A.M.L. Effects of temperature and supply airflow rate on thermal comfort in a stratum-ventilated room. Build. Environ. 2015, 92, 269–277. [Google Scholar] [CrossRef]
- Li, H.; Li, X.; Qi, M. Field testing of natural ventilation in college student dormitories (Beijing, China). Build. Environ. 2014, 78, 36–43. [Google Scholar] [CrossRef]
- Caetano, D.S.; Klaz, D.E.; Lomardo, L.L.B.; Rosa, L.P. Evaluation of thermal comfort and occupant satisfaction in office buildings in hot and humid climate regions by means of field surveys. Energy Procedia 2017, 115, 183–194. [Google Scholar] [CrossRef]
- Shetabivash, H. Investigation of opening position and shape on the natural cross ventilation. Energy Build. 2015, 93, 1–15. [Google Scholar] [CrossRef]
- Mikola, A.; Kalamees, T.; Kõiv, T.-A. Performance of ventilation in Estonian apartment buildings. Energy Procedia 2017, 132, 963–968. [Google Scholar] [CrossRef]
- Bluyssen, P.M.; Zhang, D.; Kurvers, S.; Overtoom, M.; Ortiz-Sanchez, M. Self-reported health and comfort of school children in 54 classrooms of 21 Dutch school buildings. Build. Environ. 2018, 138, 106–123. [Google Scholar] [CrossRef]
- Hong, G.; Kim, B.S. Field measurements of infiltration rate in high rise residential buildings using the constant concentration method. Build. Environ. 2016, 97, 48–54. [Google Scholar] [CrossRef]
- Langer, S.; Bekö, G. Indoor air quality in the Swedish housing stock and its dependence on building characteristics. Build. Environ. 2013, 69, 44–54. [Google Scholar] [CrossRef]
- Chu, C.-R.; Chiang, B.-F. Wind-driven cross ventilation in long buildings. Build. Environ. 2014, 80, 150–158. [Google Scholar] [CrossRef]
- Telejko, M. Attempt to improve indoor air quality in computer laboratories. Procedia Eng. 2017, 172, 1154–1160. [Google Scholar] [CrossRef]
- Canha, N.; Lage, J.; Candeias, S.; Alves, C.; Almeida, S.M. Indoor air quality during sleep under different ventilation patterns. Atmos. Pollut. Res. 2017, 8, 1132–1142. [Google Scholar] [CrossRef]
- Yu, T.; Heiselberg, P.; Lei, B.; Pomianowski, M.; Zhang, C. A novel system solution for cooling and ventilation in office buildings: A review of applied technologies and a case study. Energy Build. 2015, 90, 142–155. [Google Scholar] [CrossRef]
- Aflaki, A.; Mahyuddin, N.; Mahmoud, Z.A.-C.; Baharum, M.R. A review on natural ventilation applications through building facade components and ventilation openings in tropical climates. Energy Build. 2015, 101, 153–162. [Google Scholar] [CrossRef]
- Faggianelli, G.A.; Brun, A.; Wurtz, E.; Muselli, M. Natural cross ventilation in buildings on Mediterranean coastal zones. Energy Build. 2014, 77, 206–218. [Google Scholar] [CrossRef]
- Dorizas, P.V.; Assimakopoulos, M.-N.; Helmis, C.; Santamouris, M. An integrated evaluation study of the ventilation rate, the exposure and the indoor air quality in naturally ventilated classrooms in the Mediterranean region during spring. Sci. Total Environ. 2015, 502, 557–570. [Google Scholar] [CrossRef] [PubMed]
- Ren, J.; Liu, J.; Cao, X.; Hou, Y. Influencing factors and energy-saving control strategies for indoor fine particles in commercial office buildings in six Chinese cities. Energy Build. 2017, 149, 171–179. [Google Scholar] [CrossRef]
- EDSL Tas. Software Package for the Thermal Analysis of Buildings. Available online: http://www.edsl.net/main/Support/Documentation.aspx (accessed on 2 August 2018).
- Technical Committee CEN/TC 156 “Ventilation for Buildings”. Standard, C.B. EN 15251: Indoor Environmental Input Parameters for Design and Assessment of Energy Performance of Buildings Addressing Indoor Air Quality, Thermal Environment, Lighting and Acoustics; European Committee for Standardization: Brussels, Belgium, 2007. [Google Scholar]
© 2018 by the author. Licensee MDPI, Basel, Switzerland. This article is an open access article distributed under the terms and conditions of the Creative Commons Attribution (CC BY) license (http://creativecommons.org/licenses/by/4.0/).