Abstract
Sustainable reservoir use is globally threatened by sedimentation. It has been generally recognized that inadequate consideration of reservoir sedimentation has caused the worldwide decline of net storage. Numerical models are useful tools to simulate sedimentation processes and can be used to derive efficient counter-measures and sediment management strategies. They can be applied to both existing and potential future reservoirs to predict long-term sedimentation. In this study, an application of a simple, robust, and stable numerical 1D model to Gebidem reservoir in Switzerland accompanied by field measurements is presented. It focusses on seasonal and large-scale reservoir sedimentation processes that occur continuously throughout the whole deposition season, while episodic events like turbidity currents are not taken into account. The model simulates both the delta formation of coarse sediments and the lake-wide sedimentation from homopycnal flows. The model is used to assess the effects and significance of varying boundary conditions like inflow, suspended sediment concentration, particle size distribution (PSD), or reservoir operation. It will be demonstrated that future reservoir operation and PSD are as important as future runoff evolution. Based on these findings, implications on future reservoir operation, also considering climate change, are discussed. Finally, an outlook on pending research topics is given.
1. Introduction
Sustainable use of reservoirs is threatened by reservoir sedimentation. Global reservoir capacity has peaked in 2006 and is declining since then [1], because sedimentation increases faster than the installation of new reservoir capacity [2]. 0.8% of annual storage capacity are lost each year worldwide, and 0.2% are lost each year in Switzerland on average [3]. Experience from the past shows that the decline of global net reservoir storage is due to inadequate consideration of reservoir sedimentation [4]. Usually, estimated sedimentation rates of the planning phase differ from observed sedimentation rates [5]. Furthermore, observed infill times (time until the reservoir is completely filled with sediments) of periglacial reservoirs in Switzerland cover several orders of magnitude, indicating that reservoir sedimentation is highly site-specific, as this large scatter cannot be explained by the reservoir size alone. This is shown in Figure 1 for Swiss periglacial reservoirs where infill times are available and have been calculated based on current sedimentation rates provided by Ref. [6,7,8,9,10]. Reservoir sedimentation causes problems, for example, decreasing reservoir volumes and resulting production losses or endangering operating safety by blocking outlet structures. Both the reservoir volume and safe operation must be maintained to ensure a reliable electricity production. It is currently not known how climate change will affect periglacial reservoir sedimentation. As many Swiss reservoirs are located in the periglacial environment, it is important to quantify these effects and to implement efficient counter-measures if necessary.
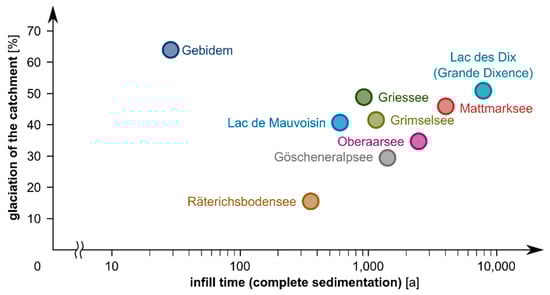
Figure 1.
Observed infill times (based on bathymetry measurements) in different Swiss reservoirs located within the periglacial environment (potentially changing sediment input due to climate change is not taken into account).
Sediment input into reservoirs can be calculated using observed catchment denudation rates, statistical regressions, or physically-based relationships. Observed denudation rates of Swiss catchments have been reported by Ref. [11,12,13]. Common approaches based on statistical regression are those of Ref. [14] or Ref. [15], linking annual suspended sediment input and runoff volume. The amount of bed-load can be estimated with the approaches of Ref. [12,16]. Physically-based relationships have been developed by Ref. [10] or Ref. [17], for example, taking variables and processes such as rainfall, coverage with erodible soils and vegetation, glacier length change or snow and ice melt into account. Once the sediment input into the reservoir has been estimated, the well-known relationship of Ref. [18] can be used to determine the trap efficiency. The sedimentation patterns can be estimated using conceptual approaches like those in Ref. [19,20,21].
Although these relationships provide valuable insights, they are not sufficiently detailed to explain the large scatter of observed infill times of periglacial reservoirs (Figure 1). This is mainly due to the fact that site-specific boundary conditions like the SSC-Q relationship between suspended sediment concentration (SSC) and water discharge (Q), the particle size distribution (PSD) in the inflowing river water, or hydraulic conditions (for example flow velocities) inside the reservoirs are not accounted for. Numerical models help to overcome these shortcomings. Depending on spatial and temporal resolution, 1D [22,23,24,25,26,27,28,29], 2D [30,31,32,33], or 3D [34,35,36,37,38] models are suitable to assess reservoir sedimentation. Detailed literature reviews are given in Ref. [39,40,41,42].
In this study, we present a simple, robust, and stable numerical 1D model that has been designed to efficiently and accurately simulate large-scale and long-term processes in reservoirs. We will (1) recap the main findings from a field measurement campaign and derive the scope of application and the challenges that a numerical model must master to simulate periglacial reservoir sedimentation; (2) outline the numerical model and the study site as well as the available data for model verification; (3) present the results of the model verification; (4) discuss the sensitivity of the boundary conditions and the impacts of climate change and identify the main drivers of reservoir sedimentation; and (5) draw the main conclusions of this study and recommend future research.
2. Methods
2.1. Field Measurements and Consequences on the Numerical Model
Three main reservoir sedimentation processes can be distinguished [43]:
- transport of coarse particles as bed-load along the topset of deltas;
- transport of fine particles in homopycnal (non-stratified) flows;
- transport of fine particles in stratified flows; for example, turbidity currents (hyperpycnal flows).
Only little field data regarding these sedimentation processes are available for Swiss periglacial reservoirs. Hence, antecedent field measurements in the three Swiss periglacial reservoirs Lac de Mauvoisin, Griessee, and Gebidem were realized to gain data for model verification [7]. A systematic combination of water sample analysis, laser in-situ scattering and transmissometry (LISST), and acoustic Doppler current profiler (ADCP) was applied. They revealed predominantly homopycnal flow conditions without significant changes of PSD or SSC within these reservoirs. This does not deny the significance of turbidity currents, as relatively coarse sediment deposits close to some dams prove the existence of such underflows. Nevertheless, these events are most likely episodic in most of the periglacial reservoirs. The triggering boundary conditions (minimum density excess required) and the corresponding return periods as well as propagation distances and sediment transport capacities are usually not known. With this in mind, the numerical model presented herein is restricted to the continuous processes of delta formation and sedimentation from homopycnal flows.
The field measurements indicated that periglacial reservoirs feature six challenges that should be mastered by the numerical model:
- flow transition (hydraulic jump): supercritical flow may appear at the inflow due to tributaries with steep bottom slope, whereas subcritical flow establishes in the reservoirs;
- highly unsteady boundary conditions: large gradients in lake levels (several meters per day) and water and sediment inflows are observed in periglacial reservoirs;
- large ranges of PSD: particles from clay (<0.002 mm) to gravel (2–60 mm) are being conveyed into the reservoirs;
- two transport modes: both bed-load and suspended-load transport occur simultaneously, resulting in Gilbert-type delta formation of coarse particles and sedimentation from homopycnal flows of fine particles;
- strongly varying geometry: large gradients in bed level and width;
- long simulation periods: seasons to decades are needed to investigate sedimentation processes.
These challenges can be accomplished by a depth- and width-averaged 1D model. Reservoirs impounded by narrow gorges, as they are often found in periglacial valleys, are suitable for 1D models because longitudinal (stream-wise) transport processes are dominant and cross-sectional changes of SSC or PSD can be neglected if large-scale processes on the reservoir scale are of interest. Further, 1D models have the advantage of relatively low computational effort compared to 2D or 3D models and are thus favorable for long-term simulations.
2.2. Numerical Model
The numerical model was implemented into the software BASEMENT [44]. The Saint-Venant equations are discretized by a finite volume method. Fluxes of mass and momentum are computed using the Riemann solver of Roe [45] according to the formulation of Beffa [46] in an explicit scheme. The Manning–Strickler equation is applied as closure for friction.
Sediment transport is split up into bed-load transport modelled with the transport formula of Meyer-Peter & Müller [47] and suspended-load transport modelled with a convection equation, considering that diffusion can be neglected due to dominant convective transport. The QUICKEST scheme of Ref. [48] was used with a limiter to avoid negative SSC in locations of flow transition to ensure mass conservation.
Exchange between suspended- and bed-load was modelled with the approach of Xu [49] based on shear stresses. The erosion coefficient and (dimensionless) sedimentation coefficient were taken as suggested by the author based on calibration for the Lauffen reservoir (Germany); that is 7.5 × 10⁻⁴ kg/(m2∙s) and 0.005. Furthermore, linear erosion rates were assumed. Flow and sediment transport are solved in an uncoupled manner, thus a relatively low Courant number of 0.5 was applied to enhance stability and mass conservation in locations of flow transition. The erosion depth in the model is limited to the initial bed level of the cross sections (which corresponds to the bed rock level), i.e., deposited sediments can be eroded again, but no incision lower then initial bed level is possible.
Control volumes are represented by cross sections taken from bathymetry measurements and converted into rectangular cross sections while maintaining bed level and flow area. Rectangular cross sections are again needed to enhance stability and mass conservation in locations of flow transition. Furthermore, they speed up the simulations because of analytical conversion between flow area and water level. The thalweg of measured cross sections equals the bed level of rectangular cross sections. The flow area at full supply level was maintained, which defined the width of the rectangular cross section. The maximum flow depths are maintained as well, because of identical thalweg in both measured and rectangular cross sections in combination with measured lake levels. The spacing between cross sections is 20 m.
2.3. Study Area
The model was verified for Gebidem (WGS84: 46.37114, 8.00259), a reservoir located in the Bernese Alps in the canton of Valais in southern Switzerland. Gebidem is a unique case regarding reservoir sedimentation, because it has a small infill time of only 20–30 years (Figure 1). Furthermore, boundary conditions like inflow and lake level are recorded at high temporal resolution (daily) and occasional measurements of sediment input allow reliable estimates of PSD and SSC. Bathymetry measurements are carried out each year. High sediment loads lead to both delta formation and sedimentation from homopycnal flows, which have been documented by multi-beam echo-soundings (Figure 2). Gebidem reservoir features a gross capacity of 9.2 hm3 (N.B.: 1 hm3 equals 106 m3), of which 5.8 hm3 constitute the active storage between the full supply level at = 1436.5 m a.s.l. (N.B.: m a.s.l. stands for “meters above sea level” with reference point “Pierre du Niton” in the Lake Geneva) and the minimum operating level at = 1400 m a.s.l. [50]. With a total annual inflow of 429 hm3, the capacity-inflow-ratio amounts to 0.02 [51]. According to [18], the average trap efficiency is 46%, using the empirical relation for fine-grained sediments. Due to the small infill time, the reservoir is flushed annually (except in 1978, 2015, and 2017).
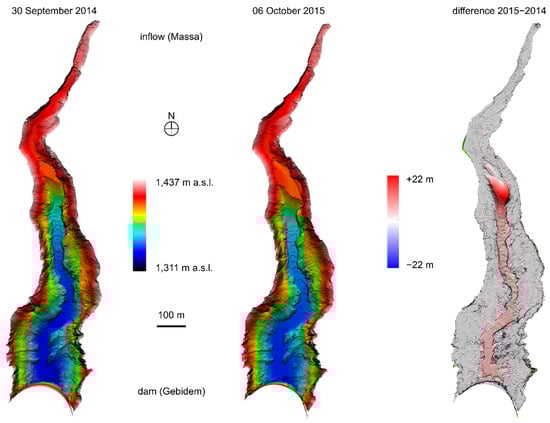
Figure 2.
Evolution of the Gilbert-type delta and sedimentation from homopycnal flows in Gebidem reservoir [multi-beam echo-sounding data acquisition, post-processing, and visualization by G. Bourban/HYDRO Exploitation].
2.4. Boundary Conditions
The inflow to Gebidem reservoir is measured at a gauging station 400 m upstream of the reservoir [52] and lake levels are recorded by the dam operator (Electra-Massa AG). Inflow discharge () was set as upstream boundary of the model and mean daily lake levels () were imposed at the downstream boundary. To save computation time, the time period was restricted to June–September, as the majority of the annual water inflow occurs within these four months (for example, 89% in 2015), and it was shown that longer time periods lead to almost identical results. Winter season can be neglected, as there is hardly any inflow due to below mostly zero temperatures in the catchment. The inflow of water and the lake levels used for calibration are shown in Figure 3.
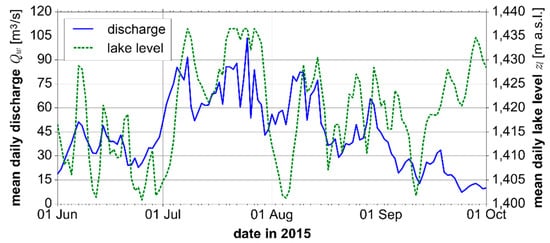
Figure 3.
Measured mean daily inflow discharge into Gebidem reservoir (upstream boundary) and mean daily lake level (downstream boundary) for the calibration period of 1 June 2015 until 1 October 2015.
A representative PSD was derived combining measurements of Ref. [7,53]. The unimodal PSD was then discretized into ten fractions and finally represented by five grain fractions, as the six lowermost grain fractions can be summarized into one grain fraction due to their quasi-identical transport behavior. The PSD is shown in Figure 4. Measurements of Ref. [53] showed that 26% of the total sediment load are attributed to bed-load. This is in good agreement with the empirical relations of Ref. [12,16].
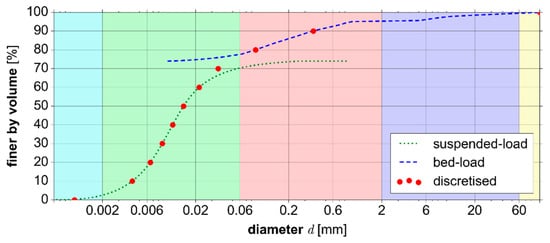
Figure 4.
Composite PSD of the sediment discharge into Gebidem, combing bed-load data of Ref. [53] with own measurements [7] of suspended sediment transport (N.B.: the gap between the suspended-load and bed-load curve is due to the fact that both curves have been weighted according to the suggestion of Ref. [53]).
The sediment input was back-calculated using a SSC-Q power-law relationship:
where [g/L] is the suspended sediment concentration; [m3/s] is the inflow discharge; and and are dimensionless calibration coefficients. The two calibration coefficients require two conditions. Ref. [54] estimated a mean annual sediment input of 0.28 hm3, which was used as the first condition. Own measurements showed that for a discharge of 11 m3/s a SSC of 75 mg/L can be expected, which was used as the second conditions. Unfortunately, there are no continuous long-term measurements of SSC in the inflow; therefore, no statistically based SSC-Q relationship could be developed. This led to and . A volume of 0.168 hm3 (60%) is attributed to the smallest grain fraction, represented by the diameter 11 μm; and 0.028 hm3 (10%) are attributed to each of the other four grain fractions, represented by the diameters 28 μm, 62 μm, 229 μm, and 50 mm, respectively.
3. Results and Discussion
3.1. Model Verification
The total sediment input in the deposition season 2015 (June–September) is 0.28 hm3, of which 0.11 hm3 are trapped in the reservoir; the trap efficiency is therefore 41%. The remaining 0.17 hm3 are discharged via the turbines or over the spillway (the latter in case of flood peaks). This is in good agreement with the estimated sediment volume of 0.18 hm3 discharged via the turbines (M. Cortesi, pers. comm.). It was assumed that the porosity is the average porosity of the deposited particles. Applying the formula of Ref. [55] results in a porosity of 37%. Then the deposition volume amounts to 0.18 hm3 and the measured deposition volume of 0.18 hm3 is met.
The results of the calibration are shown in Figure 5. Initial and final bed levels () as well as bed level changes () are compared to the mass fluxes of sediment () of each of the five grain fractions, represented by its particle diameter (). It can be observed that the finest silt particles of 11 μm are quasi totally kept in suspension and transported through the reservoir as wash-load. This is in agreement with measurements [7], where the median particle size of suspended sediments was 6–20 μm. The intermediate silt particles of 28 and 62 μm lead to sedimentation from homopycnal flows. Like the wash-load, this sedimentation process depends on sediment characteristics (e.g., diameter, shape or settling velocity), hydraulic conditions (e.g., flow velocity or depth), which are a function of the reservoir size (e.g., cross section geometry), leading to either convex or concave shapes of the transport diagrams (Figure 5b). The larger sand (229 μm) and gravel particles (50 mm) lead to Gilbert-type delta formation, i.e., they are being deposited right after they enter the reservoir. These sediments settle down on the topset of the delta (indicated by the grey band in Figure 5a). However, whenever the lake level is lowered towards the minimum operating level of 1400 m a.s.l., the deposits are relocated by means of bed-load transport. This is in good agreement with the measurements [7], as no particles larger than 200 μm were recorded in suspension. The simulated maximum deposition at the delta front amounts to 18 m (Figure 5a), which is in agreement with the measured maximum deposition of 22 m (Figure 2; as well as G. Bourban, pers. comm.).
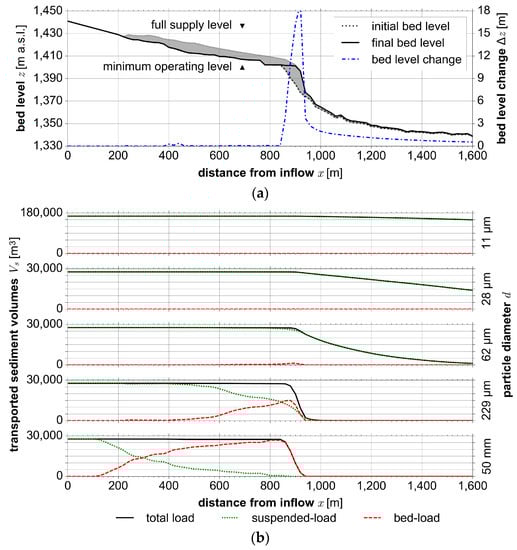
Figure 5.
Simulation results of Gebidem test case for the calibration season 2015: (a) initial and final bed levels (initial bed level refers to the bathymetry measurements on 30 September 2014) as well as bed level changes and maximum bed levels that evolved throughout the simulation (grey shaded area); (b) mass fluxes of sediment, which are broken down into single fractions of representative particle diameters (N.B.: the dam is located at ).
The validation of the numerical model was carried out for the deposition season 2014. The time period starts in June after a flushing event and ends in September when the bathymetry measurements were carried out. Measured boundary conditions of inflow and lake level were imposed, and equal PSD and SSC-Q relationship as for the calibration were used. A sedimentation volume of 0.06 hm3 results, which is half of the measured value of 0.11 hm3. The trap efficiency would be 46%. The difference between measured and simulated deposition volumes is due to either inadequate assumption of porosity, PSD or SSC-Q relationship. There is no evidence of short-term fluctuations of porosity or PSD based on measurements at the Massa river, but these measurements did not reveal an unique SSC-Q relationship [56], so it is likely that the SSC-Q relationship is wrong. Correct deposition volumes would be achieved if the pre-factor of Equation (1) was changed from 0.001 to 0.00057 and the exponent from 1.8 to 2.1. This exponent would come closer to 2.2, which has been proposed in other studies for pro-glacial and pro-Alpine streams [14,57]. The reason for the diverging SSC-Q relationships can be found in the different weather conditions of 2014 and 2015: midsummer 2014 (July and August) had a record deficit of sunshine hours (28% below long-term norm) as well as record precipitation (200–300% above long-term norm) since the beginning of measurements (in 1864), whereas 2015 was the warmest year since then [58]. The SSC-Q relationship does not account for all temporal variations, as it is based on discharge only. At Gebidem, subglacial sediment evacuation is an important sediment source, as 64% of the catchment are covered by glaciers (Figure 1) and the non-glaciated area between glacier terminus and reservoir is relatively small. The SSC-Q relationship neglects the origin of the sediments completely; i.e., it does not distinguish whether high sediment loads arise from strong erosion due to heavy rainfall or large subglacial sediment transport induced by intense glacier melt. The sediment dynamics will be different, however [56]. A study on the upper Rhône catchment demonstrated that the SSC-Q relationships were not capable of reproducing probability distribution functions of SSC because they neglect physical processes that govern seasonal patterns of SSC, especially in summer [17]. Instead, a non-linear multi-variate rating curve performed fairly well, although it does not use discharge at all, but includes the input variables mean daily rainfall, ice melt, snow melt over unregulated areas, and release from reservoirs, which are governing the changes in SSC.
3.2. Effects and Significance of Boundary Conditions
First, the sensitivity of the temporal resolution of the upstream boundary conditions was investigated. Future boundary conditions, such as runoff, usually originate from climate change scenario simulations which have a relatively coarse temporal resolution. For Gebidem reservoir, monthly runoff predictions are available for the scenarios SRES-A1B, RCP2.6, RCP4.5, and RCP8.5 [59] until the year 2100 [60,61]. The temporal resolution of the water and sediment input can be changed from daily-averaged values as for the calibration and validation periods to monthly-averaged values as for predictions if the SSC-Q relationship is recalibrated. Then, both trap efficiency and sedimentation pattern remain the same. Such a recalibration of SSC-Q relationship can be done when the sediment input is known, which requires an estimate of future sediment conveyance. The simplest approach is the one proposed by Ref. [15], linking runoff volume and suspended sediment input directly. For the SRES-A1B climate change scenario, annual runoff volumes at Gebidem are expected to increase until 2040, when annual runoff volumes are up to 26% higher than today. After this “peak water” [62], annual runoff volume will decline and be 5% lower than today by the end of the century (i.e., in 2100). According to Ref. [15], an increase in discharge of 26% leads to an increase of sediment input of 31%, whereas a reduction of 5% leads to a reduction of sediment input of 6% (i.e., changes in runoff volume and sediment input are close to be linear). Corresponding deposition volumes are 0.23 hm3 (in 2040) and 0.17 hm3 (in 2100), which is close to the current values. Another option would be to up- or downscale current hydrographs by 26% or 5%, respectively, and apply the calibrated SSC-Q relationship. Corresponding changes in sediment input would be +93% or −13%, respectively, and deposition volumes of 0.34 hm3 (in 2040) and 0.15 hm3 (in 2100) would result. These changes are much larger because of the non-linear nature of the originally calibrated SSC-Q relationship (SSC is proportional to ).
Second, the same sensitivity analysis was repeated for the downstream boundary condition. If monthly-averaged lake levels are used instead of the daily-averaged ones, then trap efficiency will still be 41%. The deposition pattern looks completely different, however (Figure 6a): Whereas only 753 m3 of sediment are deposited on the delta topset (i.e., between 0 and 840 m from the inflow) at the end of the simulation for the daily-averaged lake levels (Figure 5a), as much as 47,736 m3 are deposited for the monthly-averaged lake levels. This highlights the importance of lake level fluctuations, as these “partial flushings” lead to a relocation of sediments. Drawdowns to the minimum operating level free the active storage from sediments and move them into the inactive storage. The homopycnal sedimentation remains unchanged. Future reservoir operation defines lake levels and must be taken into account to correctly model sedimentation patterns.
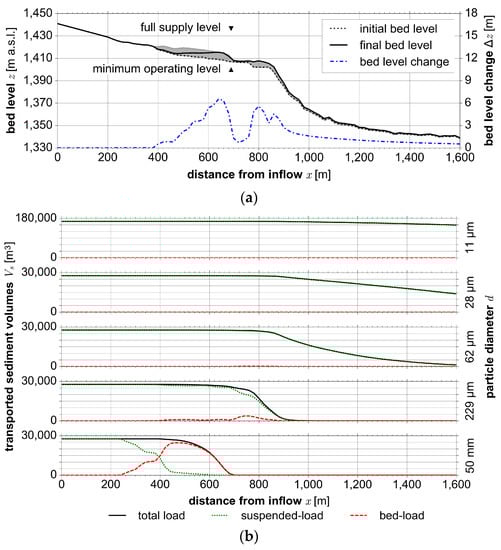
Figure 6.
Simulation results of Gebidem test case for the calibration season 2015 using monthly-averaged lake levels instead of daily-averaged lake levels (as in Figure 5): (a) initial and final bed level (initial bed level refers to the bathymetry measurements on 30 September 2014) as well as bed level changes and maximum bed levels that evolved throughout the simulation (grey shaded area); (b) mass fluxes of sediment, which are broken down into single fractions of representative particle diameters (N.B.: the dam is located at ).
Third, the sensitivity of the PSD of the sediment input was analyzed, as runoff regime changes are likely mirrored in PSD changes. Several proglacial lakes are expected to form in currently subglacial depressions between the terminus of the receding Aletsch Glacier and Gebidem reservoir in the next decades [63]. PSD will be distorted, because such lakes are “natural desanders” which interrupt bed-load transport and reduce grain sizes of suspended sediments [64]. This would result in a finer PSD. In contrast, glacier retreat may leave instable slopes and forefields, which are a rich sediment source of all different grain sizes and prone to erosion. Furthermore, subglacial erosion is an important source of sediments, which has impacts on PSD as well [65,66]. Hence, PSD might also be coarser in the future. PSD changes are reflected in non-linear changes of trap efficiency: If all diameters were doubled (i.e., 22 μm, 56 μm, 124 μm, 458 μm, and 100 mm instead of 11 μm, 28 μm, 62 μm, 229 μm, and 50 mm), then trap efficiency would be 60% (instead of 41%). Vice versa, if all diameters were halved, then trap efficiency would be 29%. Thus, the impact of the PSD is non-linear. The results of the model with halved diameters are shown in Figure 7: Delta formation remains the same, but homopycnal sedimentation is reduced because of the lower settling velocities of the finer particles. Trap efficiency is mainly governed by PSD, because it defines the amount of wash-load, which is transported through the reservoir, whereas all other sediments will settle in the reservoir. The coarser particles may be relocated when the lake level is lowered, but usually never leave the reservoir unless flushing operations are carried out. Numerical models are needed to evaluate which grains will be transported as bed-load or suspended-load, because the transport mode depends not only on grain size, weight, and shape, but also on ambient hydraulic conditions, which is determined by reservoir size and operation (induced lake level fluctuations).
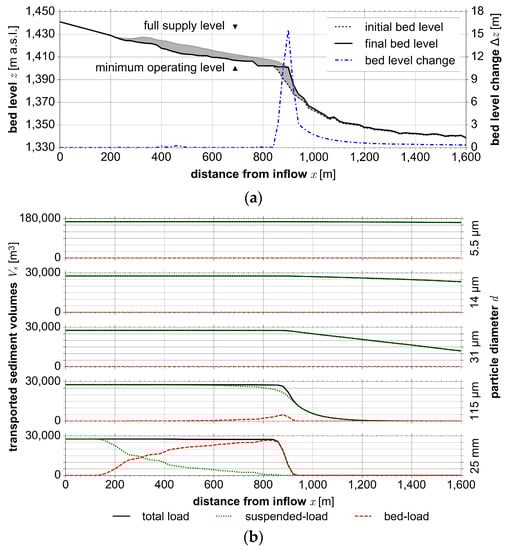
Figure 7.
Simulation results of Gebidem test case for the calibration season 2015 when all diameters of the PSD are halved: (a) initial and final bed level (initial bed level refers to the bathymetry measurements on 30 September 2014) as well as bed level changes and maximum bed levels that evolved throughout the simulation (grey shaded area); (b) mass fluxes of sediment, which are broken down into single fractions of representative particle diameters (N.B.: the dam is located at ).
3.3. Consequences on Future Reservoir Operation
On the one hand, increased runoff volumes in the next decades will provide additional flexibility regarding reservoir operation. More drawdowns to minimum operating level can be carried out without losses in electricity production. This allows to keep the active storage free from sediments by “partial flushings”. Gebidem reservoir has a small capacity/inflow ratio of 0.02, which allows efficient (bi-)annual flushings. The increase in runoff is beneficial, because the reservoir can be filled faster after the flushings, resulting in reduced economic losses. Furthermore, if proglacial lakes form between the reservoir and the terminus of Aletsch Glacier, then these “natural sediment traps” will likely reduce the sediment input and the sedimentation of Gebidem reservoir.
On the other hand, increased runoff volumes tend to convey more sediments into the reservoir. Depending on the future evolution of the SSC-Q relationship and the PSD, larger depositions have to be expected. Larger and more frequent peak SSC will intensify turbidity currents that lead to modified sedimentation patterns, as their deposits are usually located in the vicinity of the dam. New problems like blocked outlet structures may require new solutions, such as venting of turbidity currents, keeping fines in suspension with subsequent turbine venting, sediment sluicing with partial reservoir drawdown during floods or sediment bypass tunnels, which allow to divert highly sediment-laden river water around the reservoir. This would improve the interrupted sediment continuity and improve downstream ecology, although not necessarily being economically feasible. Around 2040, yearly-averaged runoff will peak at Gebidem reservoir, followed by a continuous decrease. The positive economic effects mentioned above will cease, while negative effects from sediment input will likely be reduced as well.
4. Conclusions
4.1. Summary and Outlook
Impacts of climate change on continuous seasonal and large-scale periglacial reservoir sedimentation have been identified by the use of a numerical 1D model. The model is able to simulate suspended-load and bed-load transport as well as their interaction with five grain fractions throughout a whole reservoir. This has been verified for Gebidem reservoir, a typical Swiss periglacial reservoir. It has been further demonstrated that the continuous processes of delta formation and sedimentation from homopycnal flows can be captured. The ratio of simulation period to computation time of ca. 450 convincingly demonstrates the efficiency of such a 1D model. This allows for long-term simulations over seasons to decades and a large set of model runs which, amongst others, is a prerequisite for Monte Carlo simulations to assess uncertainty in a probabilistic framework. Long-term simulations have already been performed for other reservoirs to predict future sedimentation patterns, e.g., for a potential future reservoir at Gorner glacier in Switzerland [67]. In Gebidem reservoir, such simulations cannot be made, however, because the reservoir would be filled within a 20–30 years only, which inherently makes long-term simulations impossible (without integrating flushing operations); however, Monte Carlo simulations would be possible, for example, to study the global sensitivity of uncertain parameters.
Impacts of climate change are obscured by the sensitivity of the boundary conditions. This can be demonstrated for the future sediment input. On one hand, sediment input can be estimated using annual runoff volumes and correlating them with suspended sediment input, as suggested by [15]. On the other hand, hydrographs can be up- or downscaled, so that they lead to the respective annual runoff volumes, but maintain fluctuations like peak discharge. The sediment input is then calculated using a calibrated SSC-Q relationship like in Ref. [14]. At peak water in 2040, the annual runoff volume will be 26% higher than today. The first approach would result in a deposition volume of 0.15 hm3 (136% of the deposition volume in 2015), whereas the second approach leads to a deposition volume of 0.54 hm3 (491% of the 2015 deposition volume). PSD is another sensitive boundary condition, non-linearly affecting deposition volumes: Distorting the original PSD with a factor of 2.0 and 0.5, respectively, leads to deposition volumes of 0.17 hm3 (155% of the deposition volume in 2015) and 0.08 hm3 (73% of the 2015 deposition volume), respectively. These numbers highlight that runoff projections alone do not allow reliable estimates of future reservoir sedimentation, because future sediment input and PSD are of paramount importance as well. Most likely, both are affected by climate change and will not remain constant over the next decades. Last but not least, future reservoir operation may change as well: The minimum operating level might be adapted or the gradients of lake level fluctuations might be reduced or increased due to adjusted reservoir use following changes in the energy market. This has impacts on the sedimentation patterns, especially on delta formation, which is mainly governed by the frequency of drawdowns to the minimum operating level.
PSD defines the amount of sediments that contribute to delta formation, homopycnal sedimentation and wash-load. In contrast to homopycnal sedimentation and wash-load, delta formation of the coarse particles is independent of the hydraulic conditions. Hence, trap efficiency is not only a function of PSD, but also of hydraulic conditions. This is only partially accounted for in Ref. [18], which is solely focusing on suspended sediment transport. The numerical model allows the reservoir-specific partitioning into “coarse” particles that contribute to delta formation and into “fine” particles contributing to sedimentation from homopycnal flows as well as the cut-off of “finest” particles that are wash-load. Furthermore, the longitudinal mass fluxes of suspended sediments can be used to determine the sedimentation patterns, which are far more accurate than the empirical approaches [19,20,21]. Sedimentation patterns arising from sedimentation from homopycnal flows are essential, because they can lead to critical aggradation at intake and outlet structures and thereby endanger operating safety. This type of deposition requires specific monitoring, because it cannot be monitored visually (unlike delta formation) and therefore may remain undetected over a long time.
It has been shown that reservoir operation defines the pivot point (the topset-foreset break of the delta) and therefore the delta evolution. Reservoir drawdowns to the minimum operating level can be interpreted as “partial flushings” which lead to a relocation of sediments inside the reservoir, because topset deposits are moved by means of bed-load due to the change of flow regime from lacustrine to fluvial. The active storage will be emptied and full capacity for production is restored. Reservoir operation should not be defined by market conditions and electricity production alone, but also by sediment management strategies. Additional discharge due to melting glaciers may provide additional degrees of freedom in reservoir operation. Delta formation can be controlled by reservoir operation and can easily be monitored, as the delta front can be visually detected at minimum operating level.
4.2. Recommendations for Future Research
Impacts of climate change on runoff have been examined for Swiss periglacial reservoirs. However, it is not known how PSD and SSC-Q relationships will be affected by the atmospheric warming. It has been demonstrated that the PSD and SSC-Q relationship are as important as the runoff projections regarding trap efficiency; reservoir operation and the induced lake level fluctuations are governing the sedimentation pattern. These effects are non-linear, which emphasizes the importance of sound boundary conditions. Unfortunately, long-term series of PSD and SSC records are missing for most periglacial reservoirs. Runoff projections alone are not sufficient to predict future reservoir sedimentation, thus more field data are needed. Once this information will be acquired, numerical models will be able to simulate future reservoir sedimentation, as it has been shown.
The numerical model itself can be improved further by implementing sediment transport by stratified flows (for example, turbidity currents). Even if these events are episodic in periglacial reservoirs, they might be important for sedimentation patterns inside the reservoirs and consequently trigger operational issues. Coarse-grained turbidites close to the dam of some periglacial reservoirs are clear evidence of sediment transport by gravity-driven underflows. Until peak water has been reached, higher SSC may occur and return periods of turbidity currents may consequently be lower.
Author Contributions
The field work, numerical modelling and writing of the manuscript was performed by D.E. under the supervision of D.F.V., L.S., and R.M.B. M.D. supported field measurements and data processing. M.C. provided boundary conditions for Gebidem reservoir. G.B. processed and provided bathymetry data of Gebidem reservoir. All authors were involved in editing the manuscript.
Funding
The project and the first author were financially supported by the Swiss National Science Foundation (SNSF) within the National Research Programme NRP 70 “Energy Turnaround”, Project No. 153927.
Acknowledgments
The project is under the umbrella of the Swiss Competence Center for Energy Research—Supply of Electricity (SCCER–SoE). The field work was technically supported by Electra-Massa AG/Alpiq and HYDRO Exploitation SA, who also provided bathymetry measurements as well as lake level and discharge records. The valuable inputs of Daniel Brülisauer, Yannick Marschall, Helen Schönbächler and Adrian Castrischer in the framework of their student projects and Master theses, respectively, at the chair of hydraulic engineering of ETH Zurich is gratefully acknowledged. The article fees to publish in open access are covered by the ETH Zurich library. The presented simulations were performed with Version 2.8 of the software BASEMENT. The software is available for free and can be downloaded online at www.basement.ethz.ch.
Conflicts of Interest
The authors declare no conflict of interest.
References
- Wisser, D.; Frolking, S.; Hagen, S.; Bierkens, M.F.P. Beyond peak reservoir storage? A global estimate of declining water storage capacity in large reservoirs. Water Resour. Res. 2013, 49, 5732–5739. [Google Scholar] [CrossRef]
- Auel, C.; Boes, R.M. Sustainable reservoir management using sediment bypass tunnels. In Proceedings of the 24th ICOLD Congress, Kyoto, Japan, 2012; International Commission on Large Dams (ICOLD); pp. 224–241. Available online: https://www.researchgate.net/profile/Christian_Auel/publication/273124331_Sustainable_reservoir_management_using_sediment_bypass_tunnels/links/54f7c1bb0cf28d6dec9effd7/Sustainable-reservoir-management-using-sediment-bypass-tunnels.pdf?origin=publication_detail (accessed on 28 March 2018).
- Schleiss, A.; de Cesare, G.; Jenzer Althaus, J. Verlandung der Stauseen gefährdet die nachhaltige Nutzung der Wasserkraft (‘Reservoir sedimentation threatens the sustainable use of hydropower’). Wasser Energie Luft 2010, 102, 31–40. Available online: https://infoscience.epfl.ch/record/147714/files/Schleiss_DeCesare_Jenzer_wel_2010_Verlandung.pdf (accessed on 28 March 2018).
- Annandale, G.W. Policy considerations for sustainable hydropower: Reliability, climate change and sedimentation. In Proceedings of the HYDRO 2015, Bordeaux, France, 26–28 October 2015. [Google Scholar]
- Podolak, C.J.P.; Doyle, M.W. Reservoir Sedimentation and Storage Capacity in the United States: Management Needs for the 21st Century. J. Hydraul. Eng. 2015, 141, 02515001. [Google Scholar] [CrossRef]
- Schleiss, A.; Feuz, B.; Aemmer, M.; Zünd, B. Verlandungsprobleme im Stausee Mauvoisin (‘Problems of reservoir sedimentation in the lake Mauvoisin’). In Proceedings of the Verlandung von Stauseen und Stauhaltungen, Sedimentprobleme in Leitungen und Kanälen (‘Sedimentation of Reservoirs, Sedimentation Problems in Conduits and Channels’), Zurich, Switzerland, 1996; Vischer, D., Ed.; Laboratory of Hydraulics, Hydrology and Glaciology, ETH Zurich; pp. 37–58. Available online: https://www.ethz.ch/content/dam/ethz/special-interest/baug/vaw/vaw-dam/documents/das-institut/mitteilungen/1990-1999/142.pdf (accessed on 28 March 2018).
- Ehrbar, D.; Schmocker, L.; Vetsch, D.F.; Boes, R.M.; Doering, M. Measuring suspended sediments in periglacial reservoirs using water samples, laser in-situ scattering and transmissometry and acoustic Doppler current profiler. Int. J. River Basin Manag. 2017, 15, 413–431. [Google Scholar] [CrossRef]
- Meile, T.; Bretz, N.-V.; Imboden, B.; Boillat, J.-L. Reservoir sedimentation management at Gebidem Dam (Switzerland). In Reservoir Sedimentation; Schleiss, A., De Cesare, G., Franca, M.J., Pfister, M., Eds.; Taylor & Francis Group: London, UK, 2014; pp. 245–255. ISBN 978-1-138-02675-9. [Google Scholar]
- Anselmetti, F.S.; Bühler, R.; Finger, D.; Girardclos, S.; Lancini, A.; Rellstab, C.; Sturm, M. Effects of Alpine hydropower dams on particle transport and lacustrine sedimentation. Aquat. Sci. 2007, 69, 179–198. [Google Scholar] [CrossRef]
- Beyer Portner, N. Érosion des Bassins Versant Alpins Suisses par Ruisellement de Surface (‘Erosion of Alpine Catchments in Switzerland by Overland Flow’). Ph.D. Thesis, École Polytechnique Fédérale de Lausanne (EPFL), Lausanne, Switzerland, 1998. Available online: https://infoscience.epfl.ch/record/116153/files/Comm_LCH_6.pdf&version=1 (accessed on 28 March 2018).
- Hallet, B.; Hunter, L.; Bogen, J. Rates of erosion and sediment evacuation by glaciers: A review of field data and their implications. Glob. Planet. Chang. 1996, 12, 213–235. [Google Scholar] [CrossRef]
- Schlunegger, F.; Hinderer, M. Pleistocene/Holocene climate change, re-establishment of fluvial drainage network and increase in relief in the Swiss Alps. Terra Nova 2003, 15, 88–95. [Google Scholar] [CrossRef]
- Wittmann, H.; von Blanckenburg, F.; Kruesmann, T.; Norton, K.P.; Kubik, P.W. Relation between rock uplift and denudation from cosmogenic nuclides in river sediment in the Central Alps of Switzerland. J. Geophys. Res. 2007, 112. [Google Scholar] [CrossRef]
- Müller, G.; Förstner, U. General Relationship between Suspended Sediment Concentration and Water Discharge in the Alpenrhein and some other Rivers. Nature 1968, 217, 244–245. [Google Scholar] [CrossRef]
- Gurnell, A.; Hannah, D.; Lawler, D. Suspended sediment yield from glacier basins. In Erosion and Sediment Yield: Global and Regional Perspectives; Walling, D.E., Webb, B., Eds.; International Association of Hydrological Sciences (IAHS): Exeter, UK, 1996; pp. 97–104. ISBN 978-0-947571-89-4. [Google Scholar]
- Turowski, J.M.; Rickenmann, D.; Dadson, S.J. The partitioning of the total sediment load of a river into suspended load and bedload: A review of empirical data. Sedimentology 2010, 57, 1126–1146. [Google Scholar] [CrossRef]
- Costa, A.; Anghileri, D.; Molnar, P. Hydroclimatic control on suspended sediment dynamics of a regulated Alpine catchment: A conceptual approach. Hydrol. Earth Syst. Sci. Discuss. 2018. in review. [Google Scholar] [CrossRef]
- Brune, G.M. Trap efficiency of reservoirs. Trans. Am. Geophys. Union 1953, 34, 407–418. [Google Scholar] [CrossRef]
- Annandale, G.W. Reservoir Sedimentation; Elsevier: Amsterdam, The Netherlands, 1987; ISBN 0-444-42729-5. [Google Scholar]
- Borland, W.M.; Miller, C.R. Distribution of sediment in large reservoirs. J. Hydraul. Div. 1958, 84, 1–18. Available online: http://cedb.asce.org/CEDBsearch/record.jsp?dockey=0011217 (accessed on 28 March 2018).
- Rahmanian, M.R.; Banihashemi, M.A. Sediment distribution pattern in some Iranian dams based on a new empirical reservoir shape function. Lake Reserv. Manag. 2011, 27, 244–255. [Google Scholar] [CrossRef]
- Chang, H.H.; Harrison, L.L.; Lee, W.; Tu, S. Numerical Modeling for Sediment-Pass-Through Reservoirs. J. Hydraul. Eng. 1996, 122, 381–388. [Google Scholar] [CrossRef]
- Nicklow, J.W.; Mays, L.W. Optimization of Multiple Reservoir Networks for Sedimentation Control. J. Hydraul. Eng. 2000, 126, 232–242. [Google Scholar] [CrossRef]
- Kostic, S.; Parker, G. Progradational sand-mud deltas in lakes and reservoirs. Part 1: Theory and numerical modeling. J. Hydraul. Res. 2003, 41, 127–140. [Google Scholar] [CrossRef]
- Kostic, S.; Parker, G. Progradational sand-mud deltas in lakes and reservoirs. Part 2: Experiment and numerical simulation. J. Hydraul. Res. 2003, 41, 141–152. [Google Scholar] [CrossRef]
- González, J.; Tamburrino, A.; Niño, Y. Reservoir sedimentation: 1D model of turbidity currents and delta deposits. In Proceedings of the River Flow 2006, Lisbon, Portugal, 6–8 September 2006; pp. 1607–1616. [Google Scholar]
- Mamede, G.L.; Bronstert, A.; Francke, T.; Müller, E.N.; de Araujo, J.C.; Batalla, R.J.; Güntner, A. 1D Process-based modelling of reservoir sedimentation: A case study for the Barasona reservoir in Spain. In Proceedings of the River Flow 2006, Lisbon, Portugal, 6–8 September 2006; pp. 1585–1594. [Google Scholar]
- Toniolo, H.; Parker, G.; Voller, V. Role of ponded turbidity currents in reservoir trap efficiency. J. Hydraul. Eng. 2007, 133, 579–595. [Google Scholar] [CrossRef]
- Guertault, L.; Camenen, B.; Peteuil, C.; Paquier, A.; Faure, J.B. One-Dimensional Modeling of Suspended Sediment Dynamics in Dam Reservoirs. J. Hydraul. Eng. 2016, 142, 04016033. [Google Scholar] [CrossRef]
- Ziegler, C.K.; Nisbet, B.S. Long-Term Simulation of Fine-Grained Sediment Transport in Large Reservoir. J. Hydraul. Eng. 1995, 121, 773–781. [Google Scholar] [CrossRef]
- Olsen, N.R.B. Two-dimensional numerical modelling of flushing processes in water reservoirs. J. Hydraul. Res. 1999, 37, 3–16. [Google Scholar] [CrossRef]
- Scully, M.E.; Friedrichs, C.T.; Wright, L.D. Numerical modeling of gravity-driven sediment transport and deposition on an energetic continental shelf: Eel River, northern California. J. Geophys. Res. 2003, 108. [Google Scholar] [CrossRef]
- Souza, L.B.S.; Schulz, H.E.; Villela, S.M.; Gulliver, J.S. Experimental study and numerical simulation of sediment transport in a shallow reservoir. J. Appl. Fluid Mech. 2010, 3, 9–21. Available online: http://jafmonline.net/JournalArchive/download?file_ID=15254&issue_ID=202 (accessed on 28 March 2018).
- Fang, H.-W.; Rodi, W. Three-dimensional calculations of flow and suspended sediment transport in the neighborhood of the dam for the Three Gorges Project (TGP) reservoir in the Yangtze River. J. Hydraul. Res. 2003, 41, 379–394. [Google Scholar] [CrossRef]
- Umeda, M.; Yokoyama, K.; Ishikawa, T. Observation and Simulation of Floodwater Intrusion and Sedimentation in the Shichikashuku Reservoir. J. Hydraul. Eng. 2006, 132, 881–891. [Google Scholar] [CrossRef]
- Chung, S.W.; Hipsey, M.R.; Imberger, J. Modelling the propagation of turbid density inflows into a stratified lake: Daecheong Reservoir, Korea. Environ. Model. Softw. 2009, 24, 1467–1482. [Google Scholar] [CrossRef]
- Mirbach, S.; Lang, U. Density driven underflows with suspended solids in Lake Constance. J. Soils Sediments 2017, 1–8. [Google Scholar] [CrossRef]
- Haun, S.; Olsen, N.R.B. Three-dimensional numerical modelling of the flushing process of the Kali Gandaki hydropower reservoir. Lakes Reserv. Res. Manag. 2012, 17, 25–33. [Google Scholar] [CrossRef]
- Sloff, C.J. Sedimentation in Reservoirs. Ph.D. Thesis, Delft University of Technology, Delft, The Netherlands, 1997. Available online: http://repository.tudelft.nl/islandora/object/uuid:4d5cd422-931f-4e46-9730-d7c489ea87e4/datastream/OBJ/download (accessed on 28 March 2018).
- Abood, M.M.; Mohammed, T.A.; Ghazali, A.H.; Mahmud, A.R.; Sidek, L.M. Review study and assessment for sedimentation models applied to impounding reservoirs. J. Eng. Appl. Sci. 2009, 4, 152–160. Available online: http://medwelljournals.com/abstract/?doi=jeasci.2009.152.160 (accessed on 28 March 2018).
- Ahn, J. Numerical Modeling of Reservoir Sedimentation and Flushing Processes. Ph.D. Thesis, Colorado State University, Fort Collins, CO, USA, 2011. Available online: https://dspace.library.colostate.edu/bitstream/handle/10217/70431/Ahn_colostate_0053A_10781.pdf?sequence=1 (accessed on 28 March 2018).
- Harb, G. Numerical Modeling of Sediment Transport Processes in Alpine Reservoirs. Ph.D. Thesis, Graz University of Technology, Graz, Austria, 2016. Available online: https://diglib.tugraz.at/download.php?id=576a7b92cfdf5&location=browse (accessed on 28 March 2018).
- Morris, G.L.; Fan, J. Reservoir Sedimentation Handbook: Design and Management of Dams, Reservoirs, and Watersheds for Sustainable Use; McGraw-Hill: New York, NY, USA, 2010; ISBN 0-07-043302-X. [Google Scholar]
- Vetsch, D.F.; Siviglia, A.; Caponi, F.; Ehrbar, D.; Facchini, M.; Gerke, E.; Kammerer, S.; Koch, A.; Peter, S.; Vonwiller, L. BASEMENT Version 2.7; ETH Zurich: Zurich, Switzerland, 2017; Available online: http://people.ee.ethz.ch/~basement/baseweb/download/documentation/BMdoc-Reference-Manual-v2-7.pdf (accessed on 28 March 2018).
- Roe, P.L. Approximate Riemann solvers, parameter vectors, and difference schemes. J. Comput. Phys. 1981, 43, 357–372. [Google Scholar] [CrossRef]
- Beffa, C.J. Praktische Lösung der Tiefengemittelten Flachwassergleichungen (‘Solutions of the Depth-averaged Shallow Water Equations’). Ph.D. Thesis, ETH Zurich, Zurich, Switzerland, 1994. Available online: https://www.ethz.ch/content/dam/ethz/special-interest/baug/vaw/vaw-dam/documents/das-institut/mitteilungen/1990-1999/133.pdf (accessed on 28 March 2018).
- Meyer-Peter, E.; Müller, R. Formulas for Bed-Load transport. In Proceedings of the IAHSR 2nd Meeting, Stockholm, Sweden, 1948; International Association for Hydraulic Structures Research (IAHSR); pp. 39–64. Available online: https://repository.tudelft.nl/islandora/object/uuid:4fda9b61-be28-4703-ab06-43cdc2a21bd7/datastream/OBJ/download (accessed on 28 March 2018).
- Leonard, B.P. A stable and accurate convective modelling procedure based on quadratic upstream interpolation. Comput. Methods Appl. Mech. Eng. 1979, 19, 59–98. [Google Scholar] [CrossRef]
- Xu, J. Numerical Modeling of Suspended Sediment Transport in RIVERS. Ph.D. Thesis, University of Stuttgart, Stuttgart, Germany, 1998. Available online: http://www.iws.uni-stuttgart.de/institut/wasserbau/publikationen/098_Xu_Yichun.pdf (accessed on 28 March 2018).
- Rechsteiner, G. Ablagerungen im Stausee Gebidem und einige ihrer Folgen (‘Sedimentation in the Gebidem hydroelectric reservoir and some of its consequences’). In Proceedings of the Verlandung von Stauseen und Stauhaltungen, Sedimentprobleme in Leitungen und Kanälen (‘Sedimentation of Reservoirs, Sedimentation Problems in Conduits and Channels’), Zurich, Switzerland, 1996; Vischer, D., Ed.; Laboratory of Hydraulics, Hydrology and Glaciology, ETH Zurich; pp. 137–148. Available online: https://www.ethz.ch/content/dam/ethz/special-interest/baug/vaw/vaw-dam/documents/das-institut/mitteilungen/1990-1999/142.pdf (accessed on 28 March 2018).
- Boes, R.M.; Hagmann, M. Sedimentation countermeasures—Examples from Switzerland. In Proceedings of the First International Workshop on Sediment Bypass Tunnels, Zurich, Switzerland, 2015; Boes, R.M., Ed.; Laboratory of Hydraulics, Hydrology and Glaciology, ETH Zurich; pp. 193–210. Available online: https://www.ethz.ch/content/dam/ethz/special-interest/baug/vaw/vaw-dam/documents/das-institut/mitteilungen/2010-2019/232.pdf (accessed on 28 March 2018).
- Hydrological Data of “Massa-Blatten bei Naters” (Station Number 2161). Available online: https://www.hydrodaten.admin.ch/en/2161.html (accessed on 28 March 2018).
- Giezendanner, W.; Dawans, P. Die Freihaltung des Stauraumes von Gebidem (‘Keeping Gebidem reservoir clear of sedimentation’). In Proceedings of the International Symposium on Sedimentation of Run-of-River Plants and Alpine Reservoirs, Zurich, Switzerland, 1981; Vischer, D., Ed.; Laboratory of Hydraulics, Hydrology and Glaciology, ETH Zurich; pp. 197–205. Available online: https://www.ethz.ch/content/dam/ethz/special-interest/baug/vaw/vaw-dam/documents/das-institut/mitteilungen/1980-1989/053.pdf (accessed on 28 March 2018).
- Stutenbecker, L.A.; Delunel, R.; Schlunegger, F.; Silva, T.A.; Šegvić, B.; Girardclos, S.; Bakker, M.; Costa, A.; Lane, S.N.; Loizeau, J.-L.; et al. Reduced sediment supply in a fast eroding landscape? A multi-proxy sediment budget of the upper Rhône basin, Central Alps. Sediment. Geol. 2017. [Google Scholar] [CrossRef]
- Wu, W.; Wang, S.S.Y. Formulas for Sediment Porosity and Settling Velocity. J. Hydraul. Eng. 2006, 132, 858–862. [Google Scholar] [CrossRef]
- Delaney, I.; Bauder, A.; Werder, M.A.; Farinotti, D. Regional and annual variability in subglacial sediment transport by water for two glaciers in the Swiss Alps. Front. Cryosphere 2018, in press. [Google Scholar]
- Swift, D.A.; Nienow, P.W.; Hoey, T.B. Basal sediment evacuation by subglacial meltwater: Suspended sediment transport from Haut Glacier d’Arolla, Switzerland. Earth Surf. Process. Landf. 2005, 30, 867–883. [Google Scholar] [CrossRef]
- Bader, S.; Schlegel, T. Klimareport 2015 (‘Climate Report 2015’); Federal Office of Meteorology and Climatology MeteoSwiss: Zurich, Switzerland, 2016; Available online: http://www.meteoswiss.admin.ch/content/dam/meteoswiss/de/service-und-publikationen/Publikationen/doc/klimareport_2015.pdf (accessed on 28 March 2018).
- Intergovernmental Panel on Climate Change (IPCC). Climate Change 2013: The Physical Science Basis. 2013. Available online: http://www.climatechange2013.org/images/report/WG1AR5_ALL_FINAL.pdf (accessed on 28 March 2018).
- Farinotti, D.; Usselmann, S.; Huss, M.; Bauder, A.; Funk, M. Runoff evolution in the Swiss Alps: Projections for selected high-alpine catchments based on ENSEMBLES scenarios. Hydrol. Process. 2012, 26, 1909–1924. [Google Scholar] [CrossRef]
- Farinotti, D.; Pistocchi, A.; Huss, M. From dwindling ice to headwater lakes: Could dams replace glaciers in the European Alps? Environ. Res. Lett. 2016, 11. [Google Scholar] [CrossRef]
- Huss, M.; Hock, R. Global-scale hydrological response to future glacier mass loss. Nat. Clim. Chang. 2018, 8, 135–140. [Google Scholar] [CrossRef]
- Haeberli, W.; Schleiss, A.; Linsbauer, A.; Künzler, M.; Bütler, M. Gletscherschwund und neue Seen in den Schweizer Alpen (‘Glacier retreat and new lakes in the Swiss Alps’). Wasser Energie Luft 2012, 104, 93–102. Available online: https://infoscience.epfl.ch/record/178376/files/2012-846_Haeberli_Schleiss_Linsbauer_K%C3%BCnzler_B%C3%BCtler_Gletscherschwund_und_neue_Seen_in_de_Schweizer_Alpen.pdf (accessed on 28 March 2018).
- Geilhausen, M.; Morche, D.; Otto, J.-C.; Schrott, L. Sediment discharge from the proglacial zone of a retreating Alpine glacier. Z. Geomorphol. Suppl. Issues 2013, 57, 29–53. [Google Scholar] [CrossRef]
- Alley, R.B.; Cuffey, K.M.; Evenson, E.B.; Strasser, J.C.; Lawson, D.E.; Larson, G.J. How glaciers entrain and transport basal sediment: Physical constraints. Quat. Sci. Rev. 1997, 16, 1017–1038. [Google Scholar] [CrossRef]
- Guillon, H.; Mugnier, J.-L.; Buoncristiani, J.-F.; Carcaillet, J.; Godon, C.; Prud’Homme, C.; Beek, P.; Vassallo, R. Improved discrimination of subglacial and periglacial erosion using 10Be concentration measurements in subglacial and supraglacial sediment load of the Bossons glacier (Mont Blanc massif, France). Earth Surf. Process. Landf. 2015, 40, 1202–1215. [Google Scholar] [CrossRef]
- Ehrbar, D.; Schmocker, L.; Vetsch, D.F.; Boes, R.M. Hydropower potential in the periglacial environment of Switzerland under climate change. Sustainability 2018, 10, 2794. [Google Scholar] [CrossRef]
© 2018 by the authors. Licensee MDPI, Basel, Switzerland. This article is an open access article distributed under the terms and conditions of the Creative Commons Attribution (CC BY) license (http://creativecommons.org/licenses/by/4.0/).