GIS-Based Energy Consumption and Spatial Variation of Protected Grape Cultivation in China

Abstract
1. Introduction
2. Materials and Methods
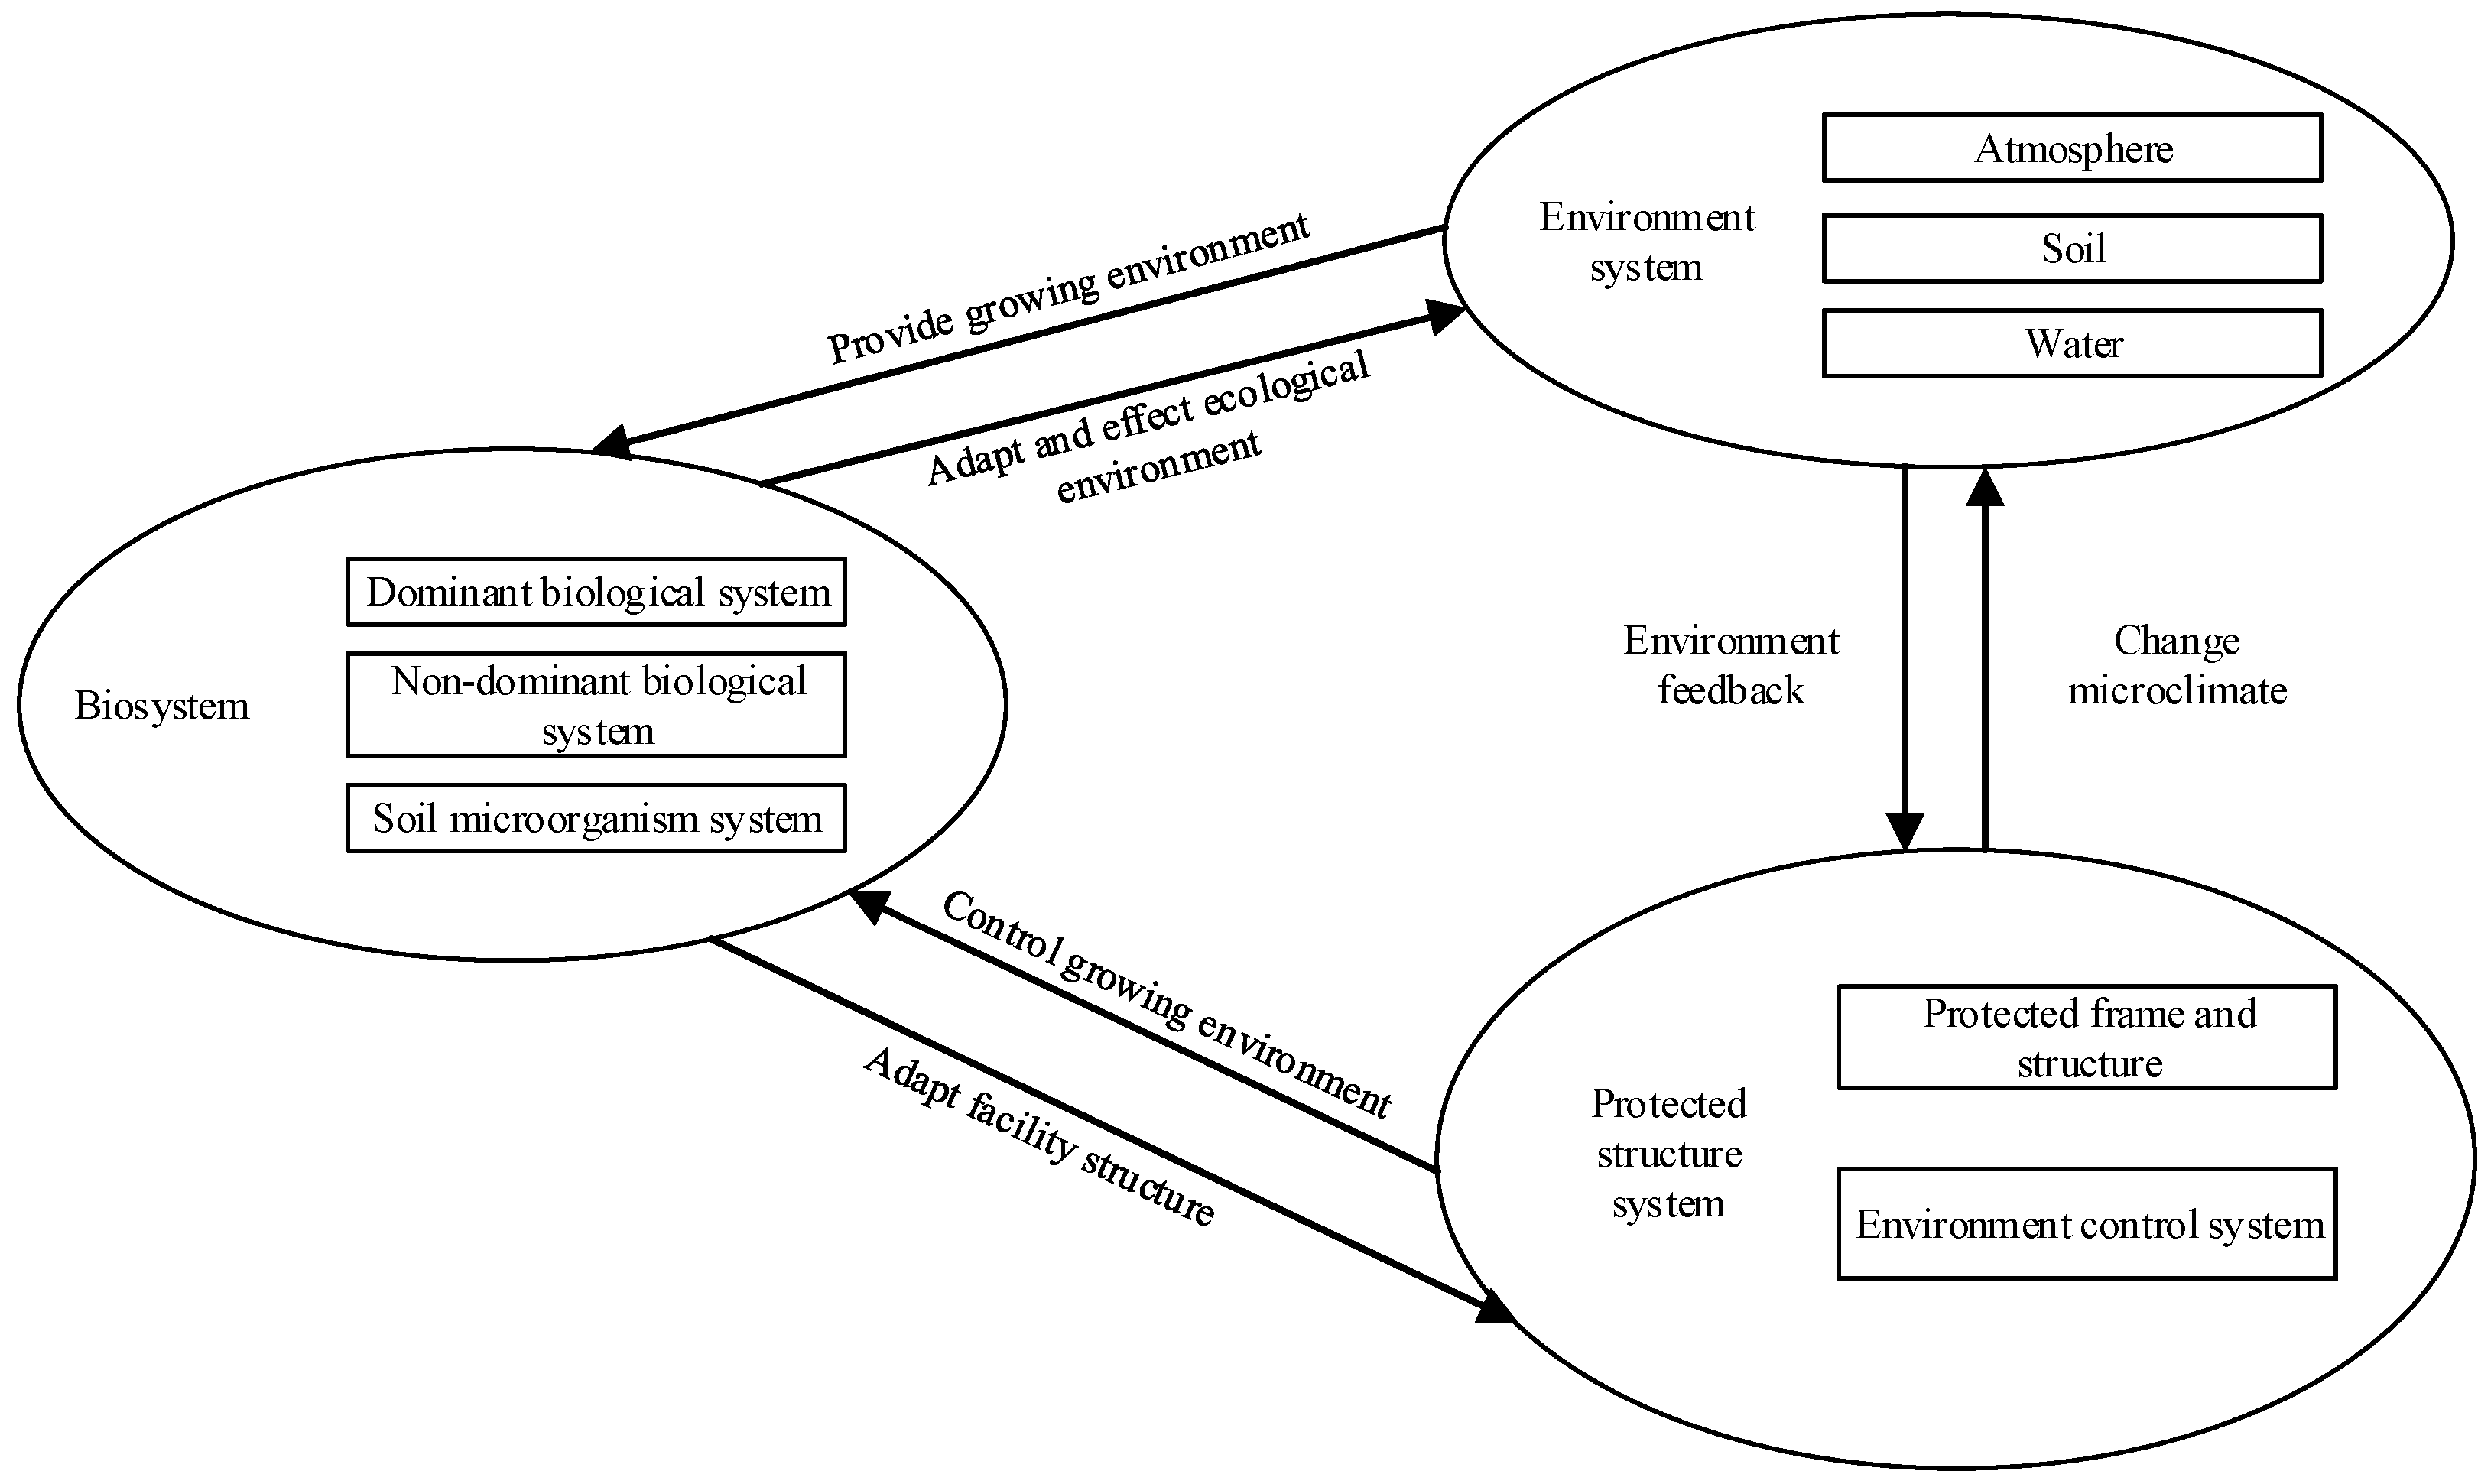
2.1. Protected Grape Cultivation System Analysis
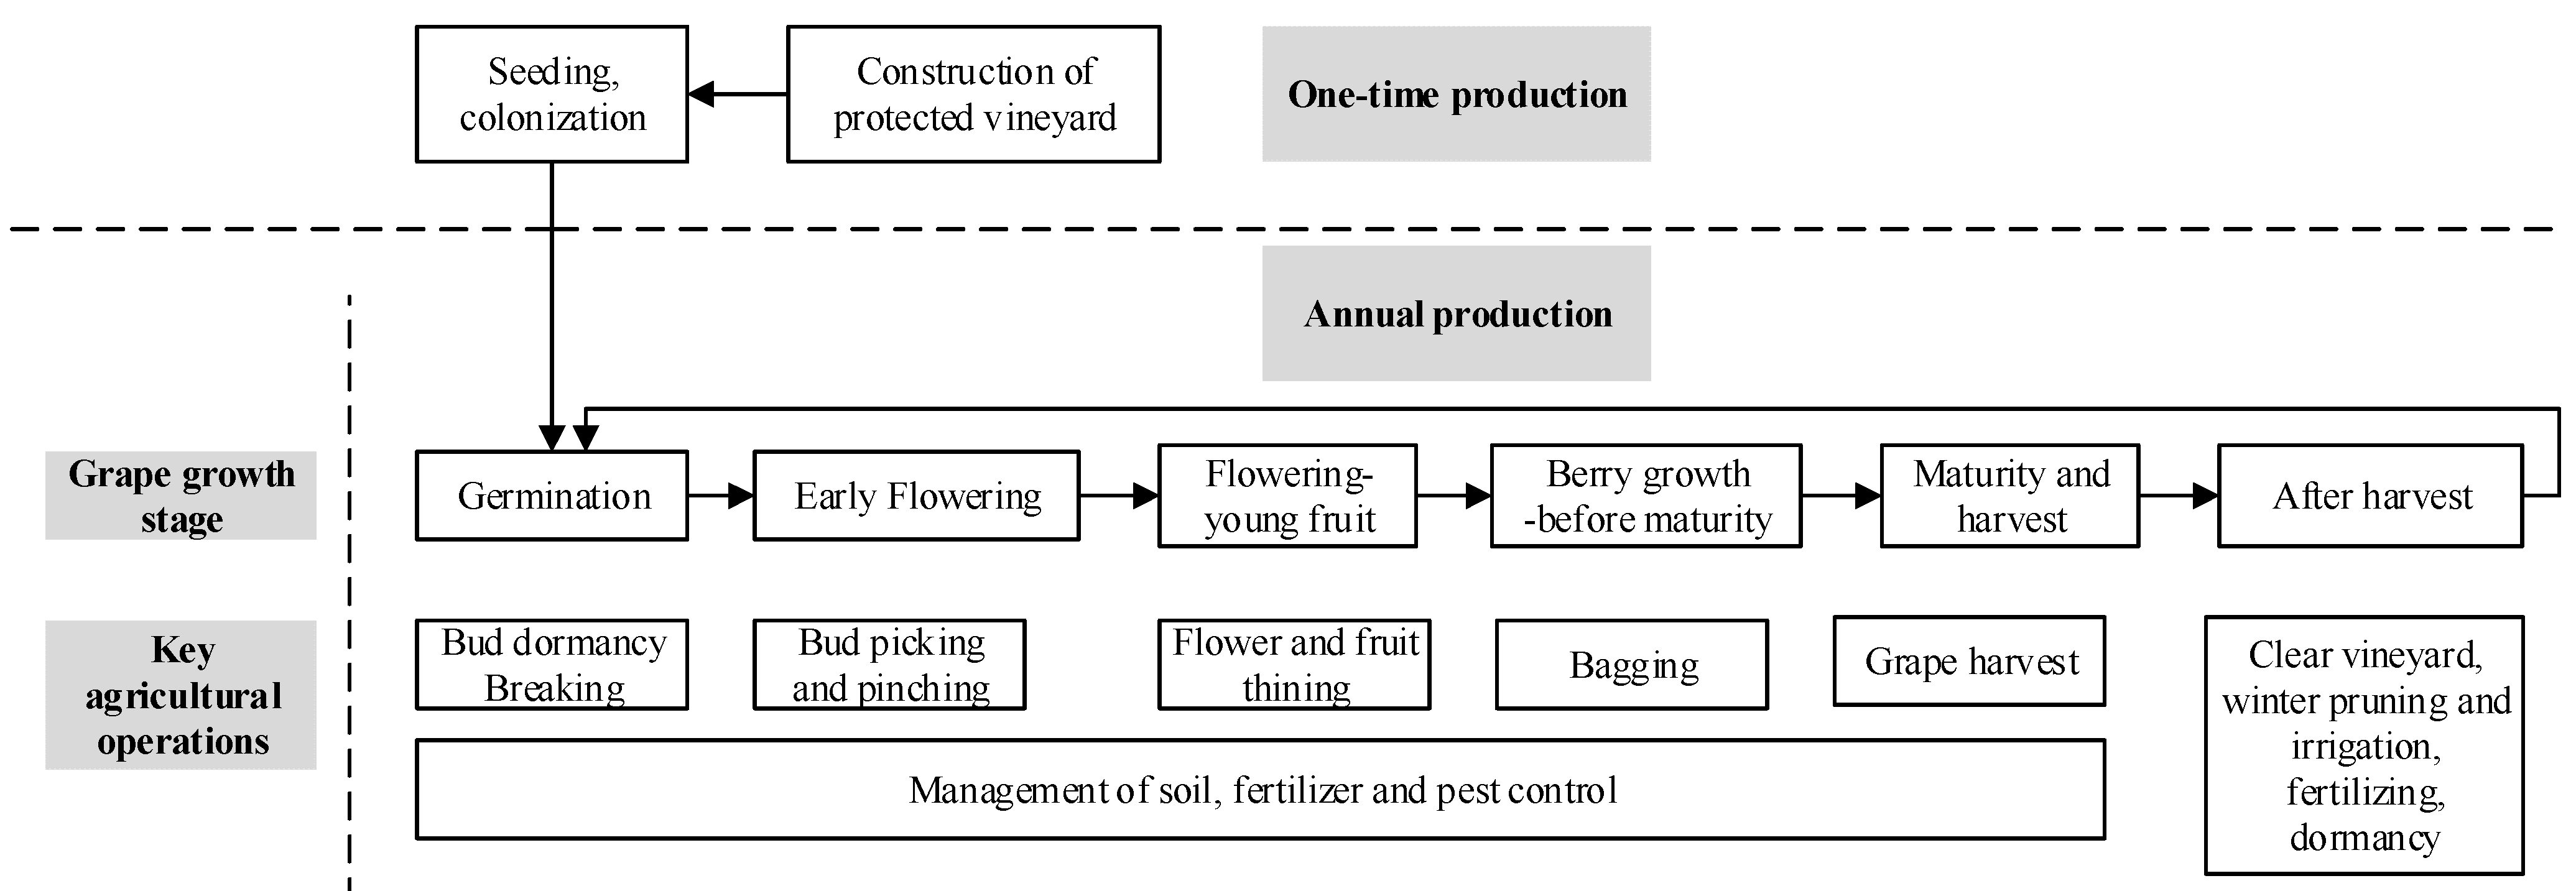
2.1.1. Production Flow
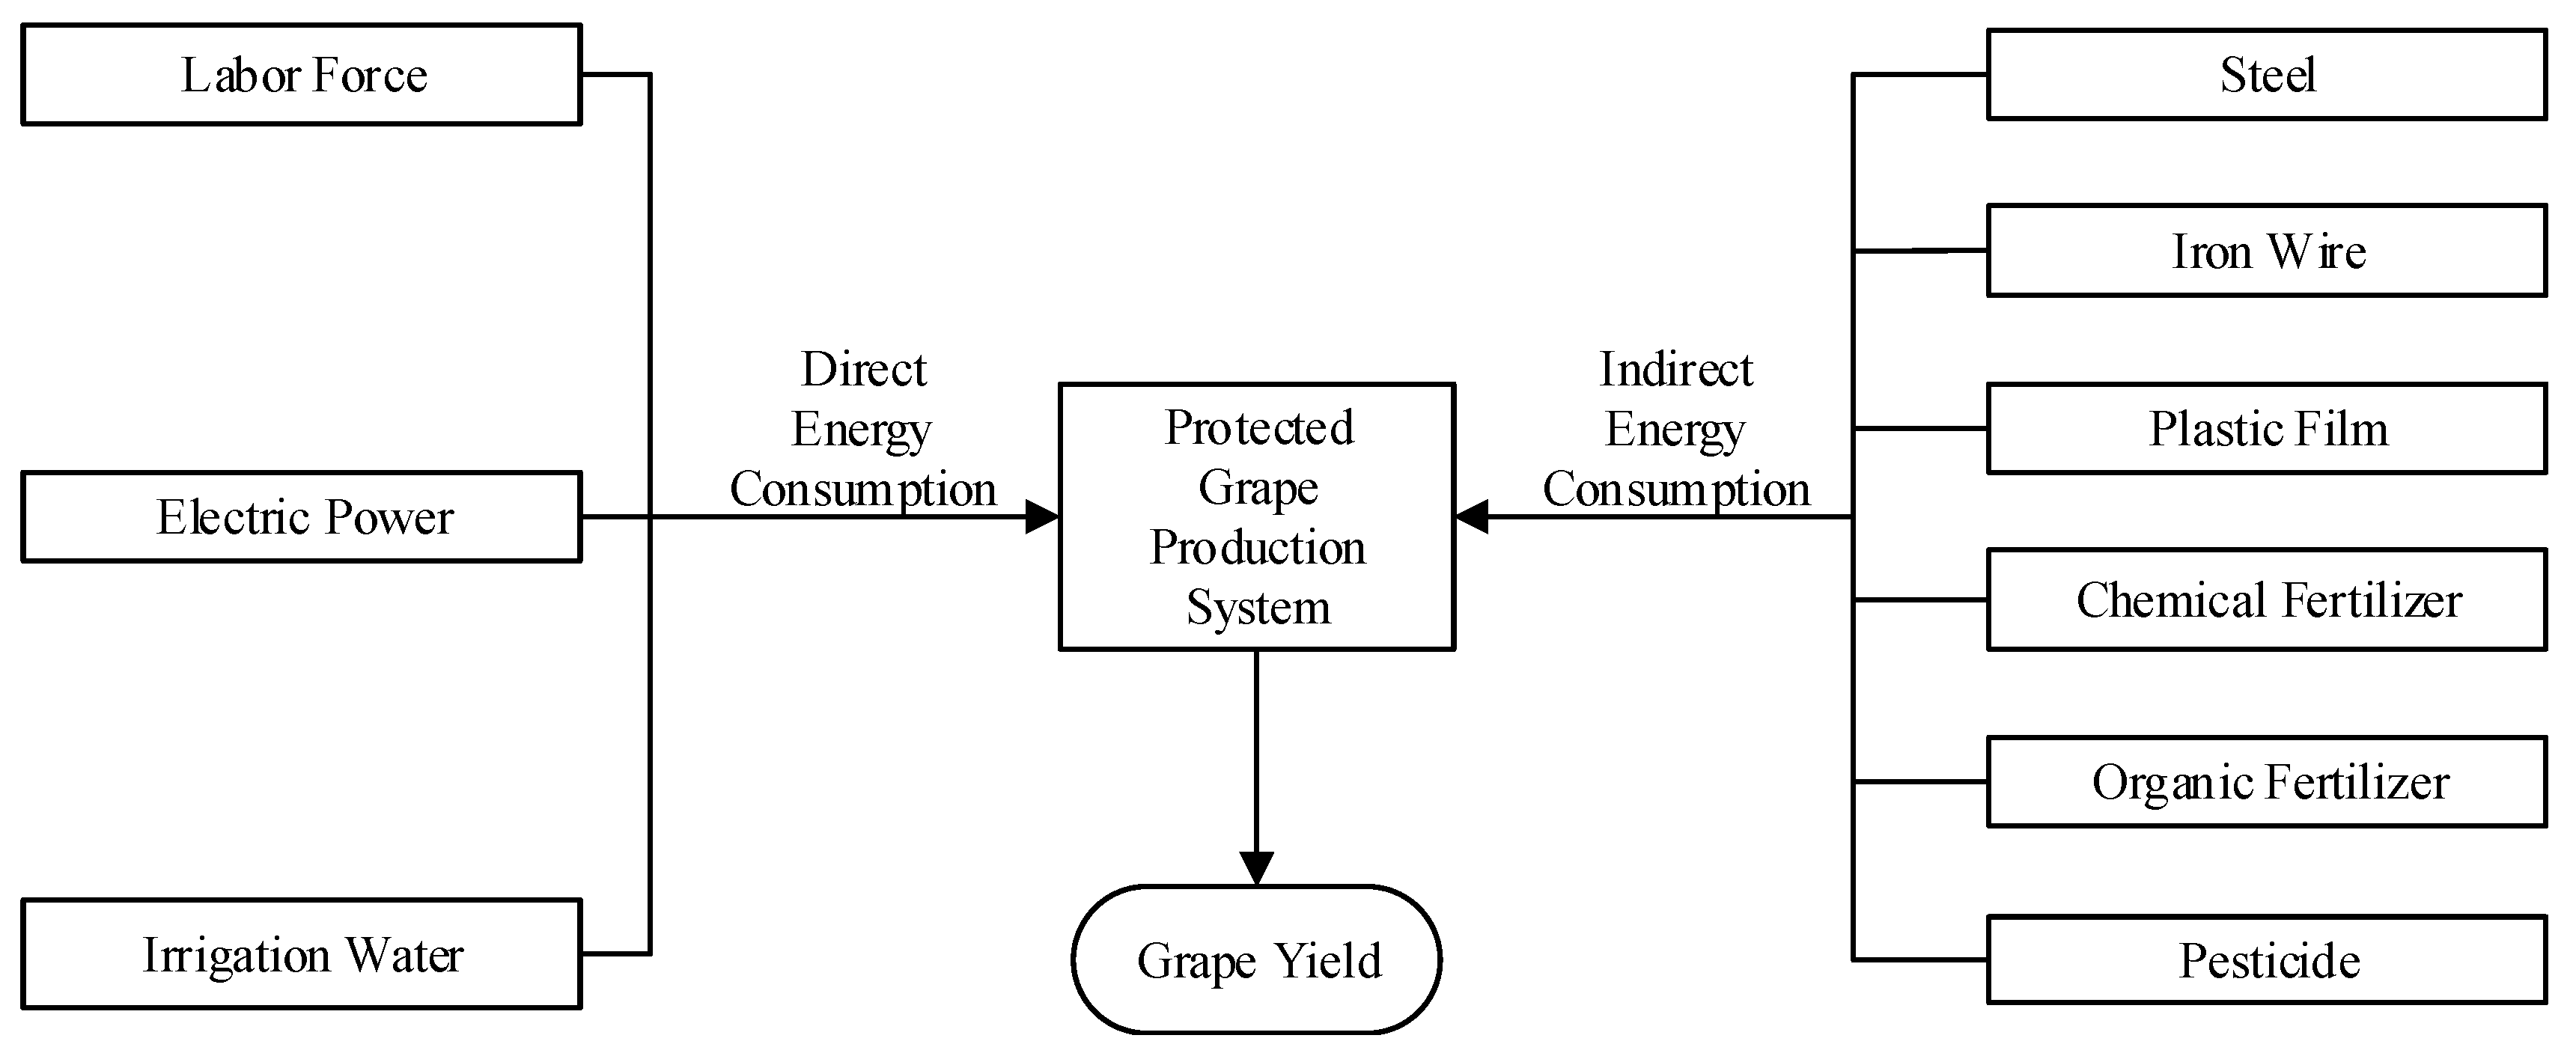
2.1.2. Energy Input and Output Index
2.2. Spatial Variation Analysis Model
2.3. Data Collection and Analysis
2.3.1. Data Collection
- (1)
- The basic information of the vineyard including the vineyard location, the year of vineyard construction, the energy consumption for constructing the vineyard, etc.
- (2)
- Production information including the grape varieties, the specific sub-pattern of protected cultivation.
- (3)
- Energy input information in grape cultivation including the detailed type and quantity information of each type of energy consumption during the period of protected grape growth.
- (4)
- Energy output information including the output of protected grape production, which only refers the grape in this research.
2.3.2. Data Processing and Analysis
3. Results and Discussion
3.1. General Situation of Energy Consumption
3.2. Energy Consumption Structure
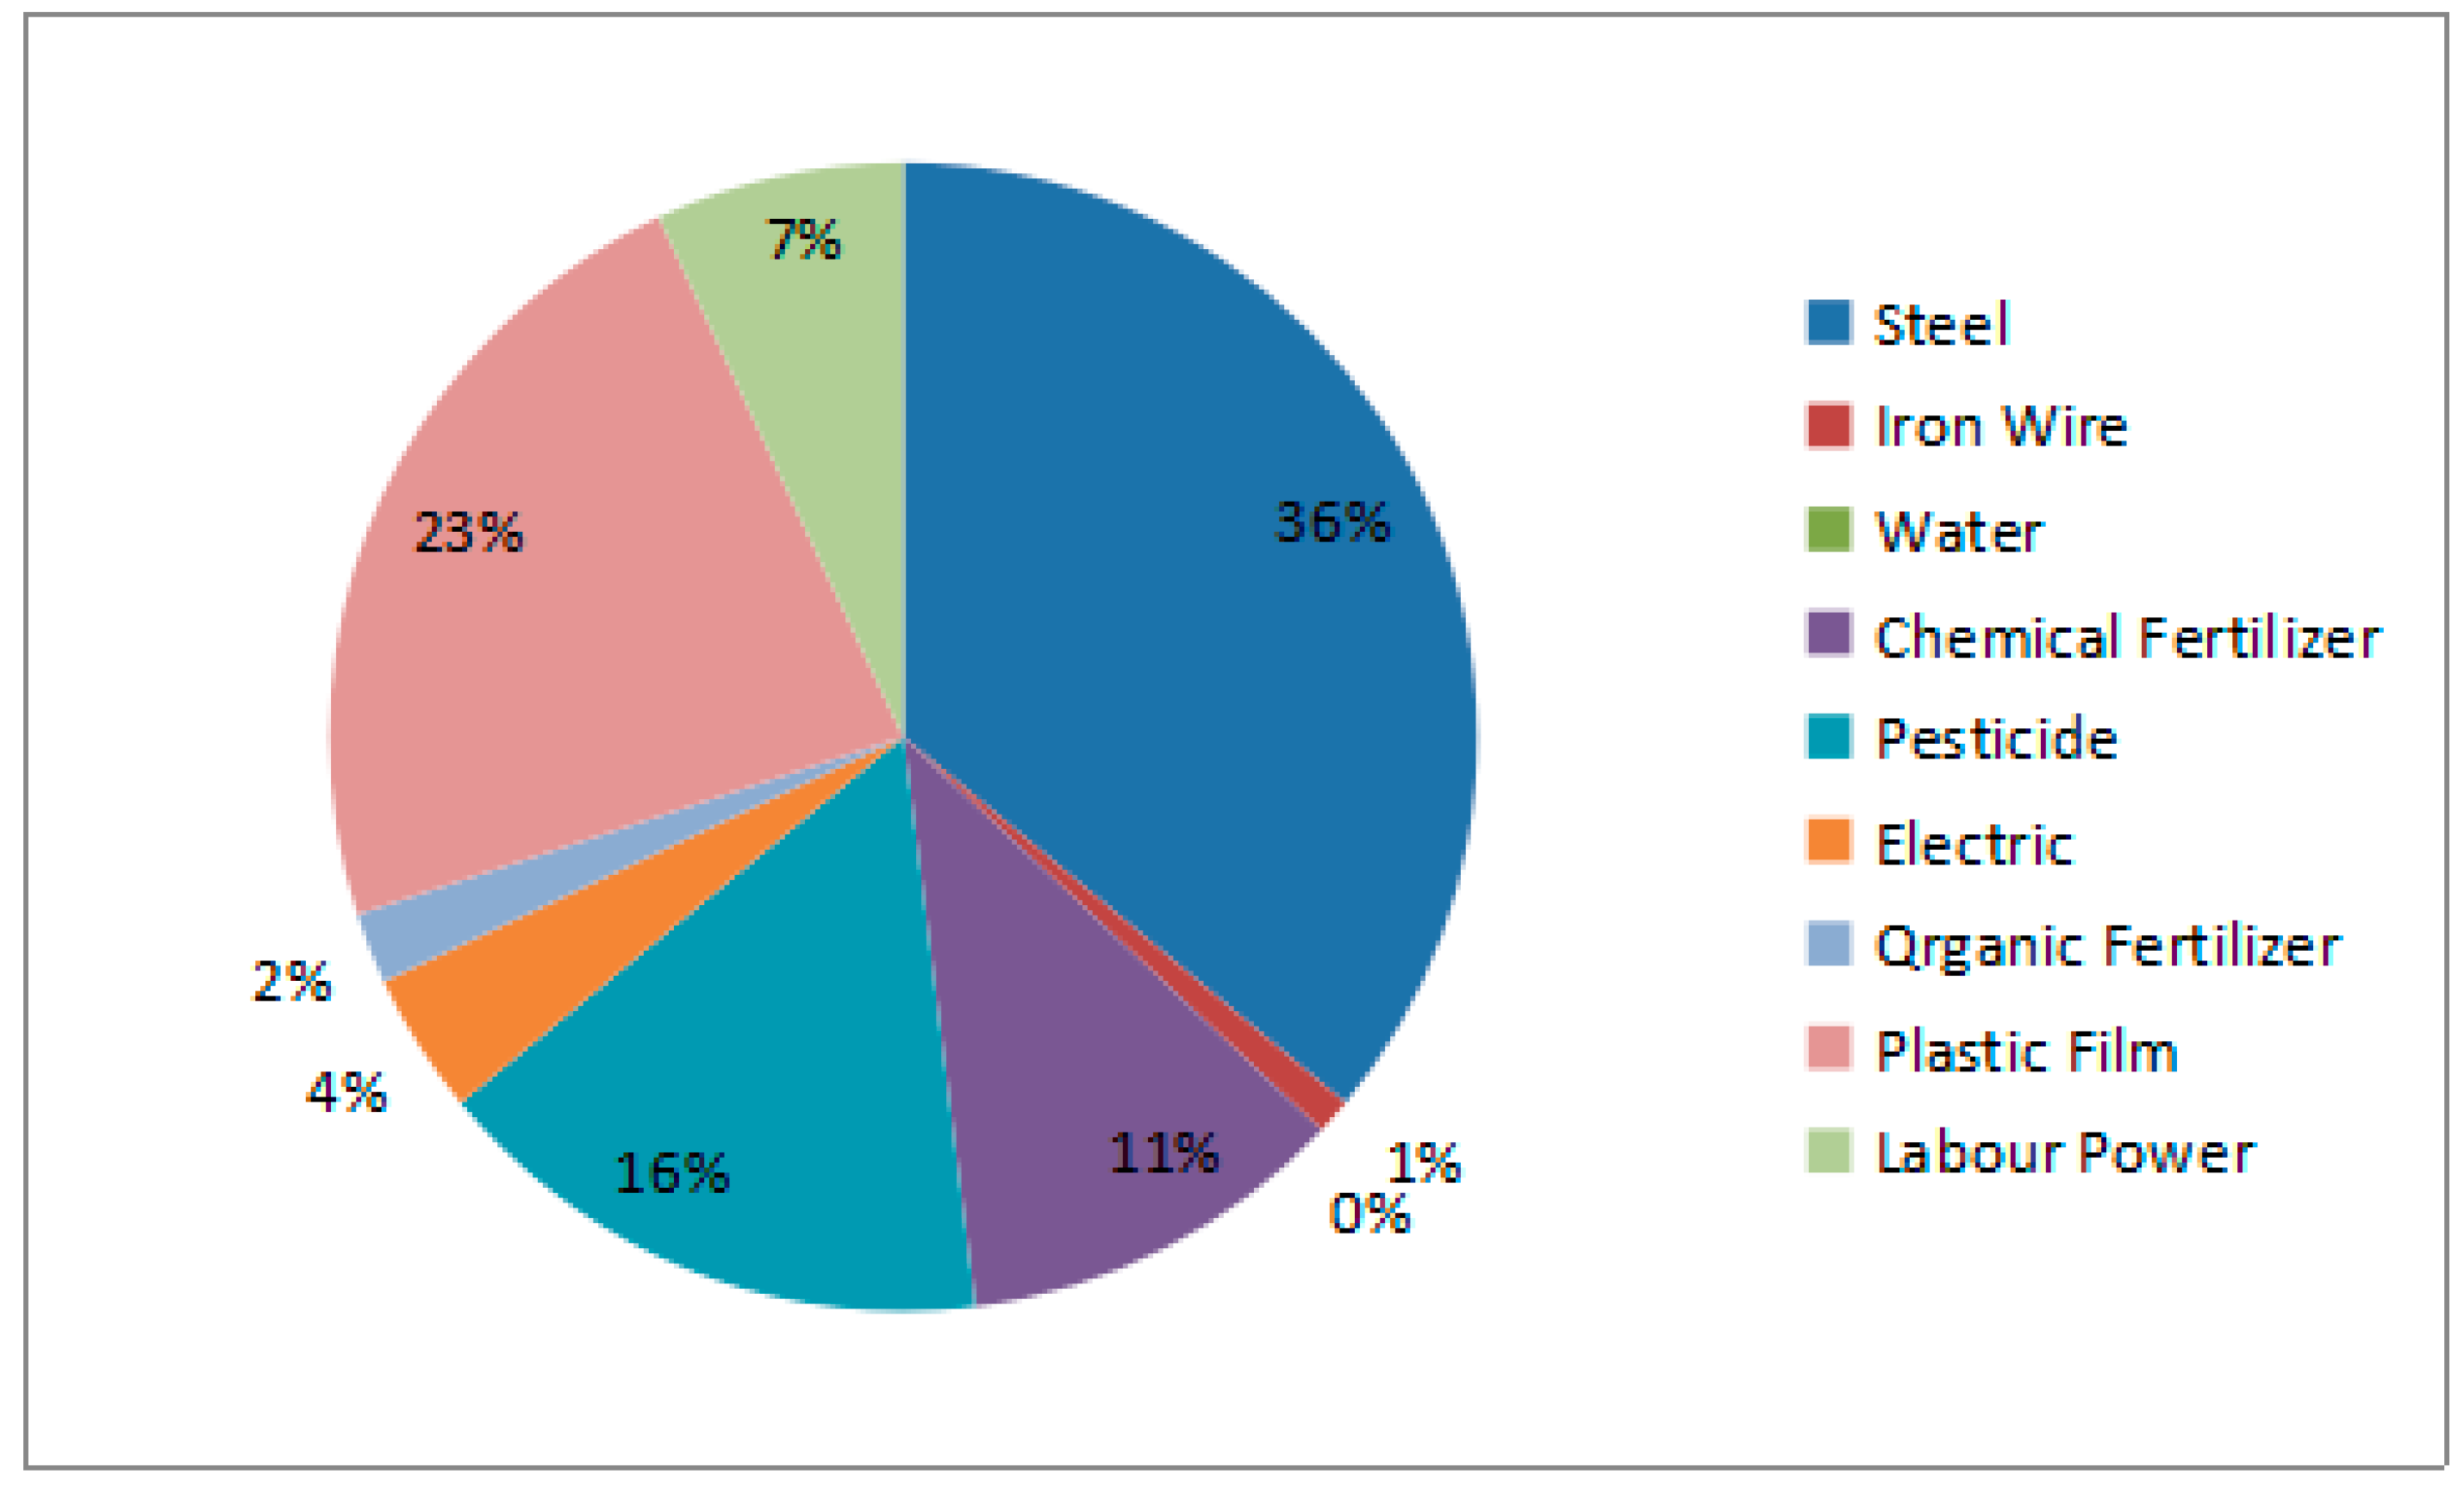
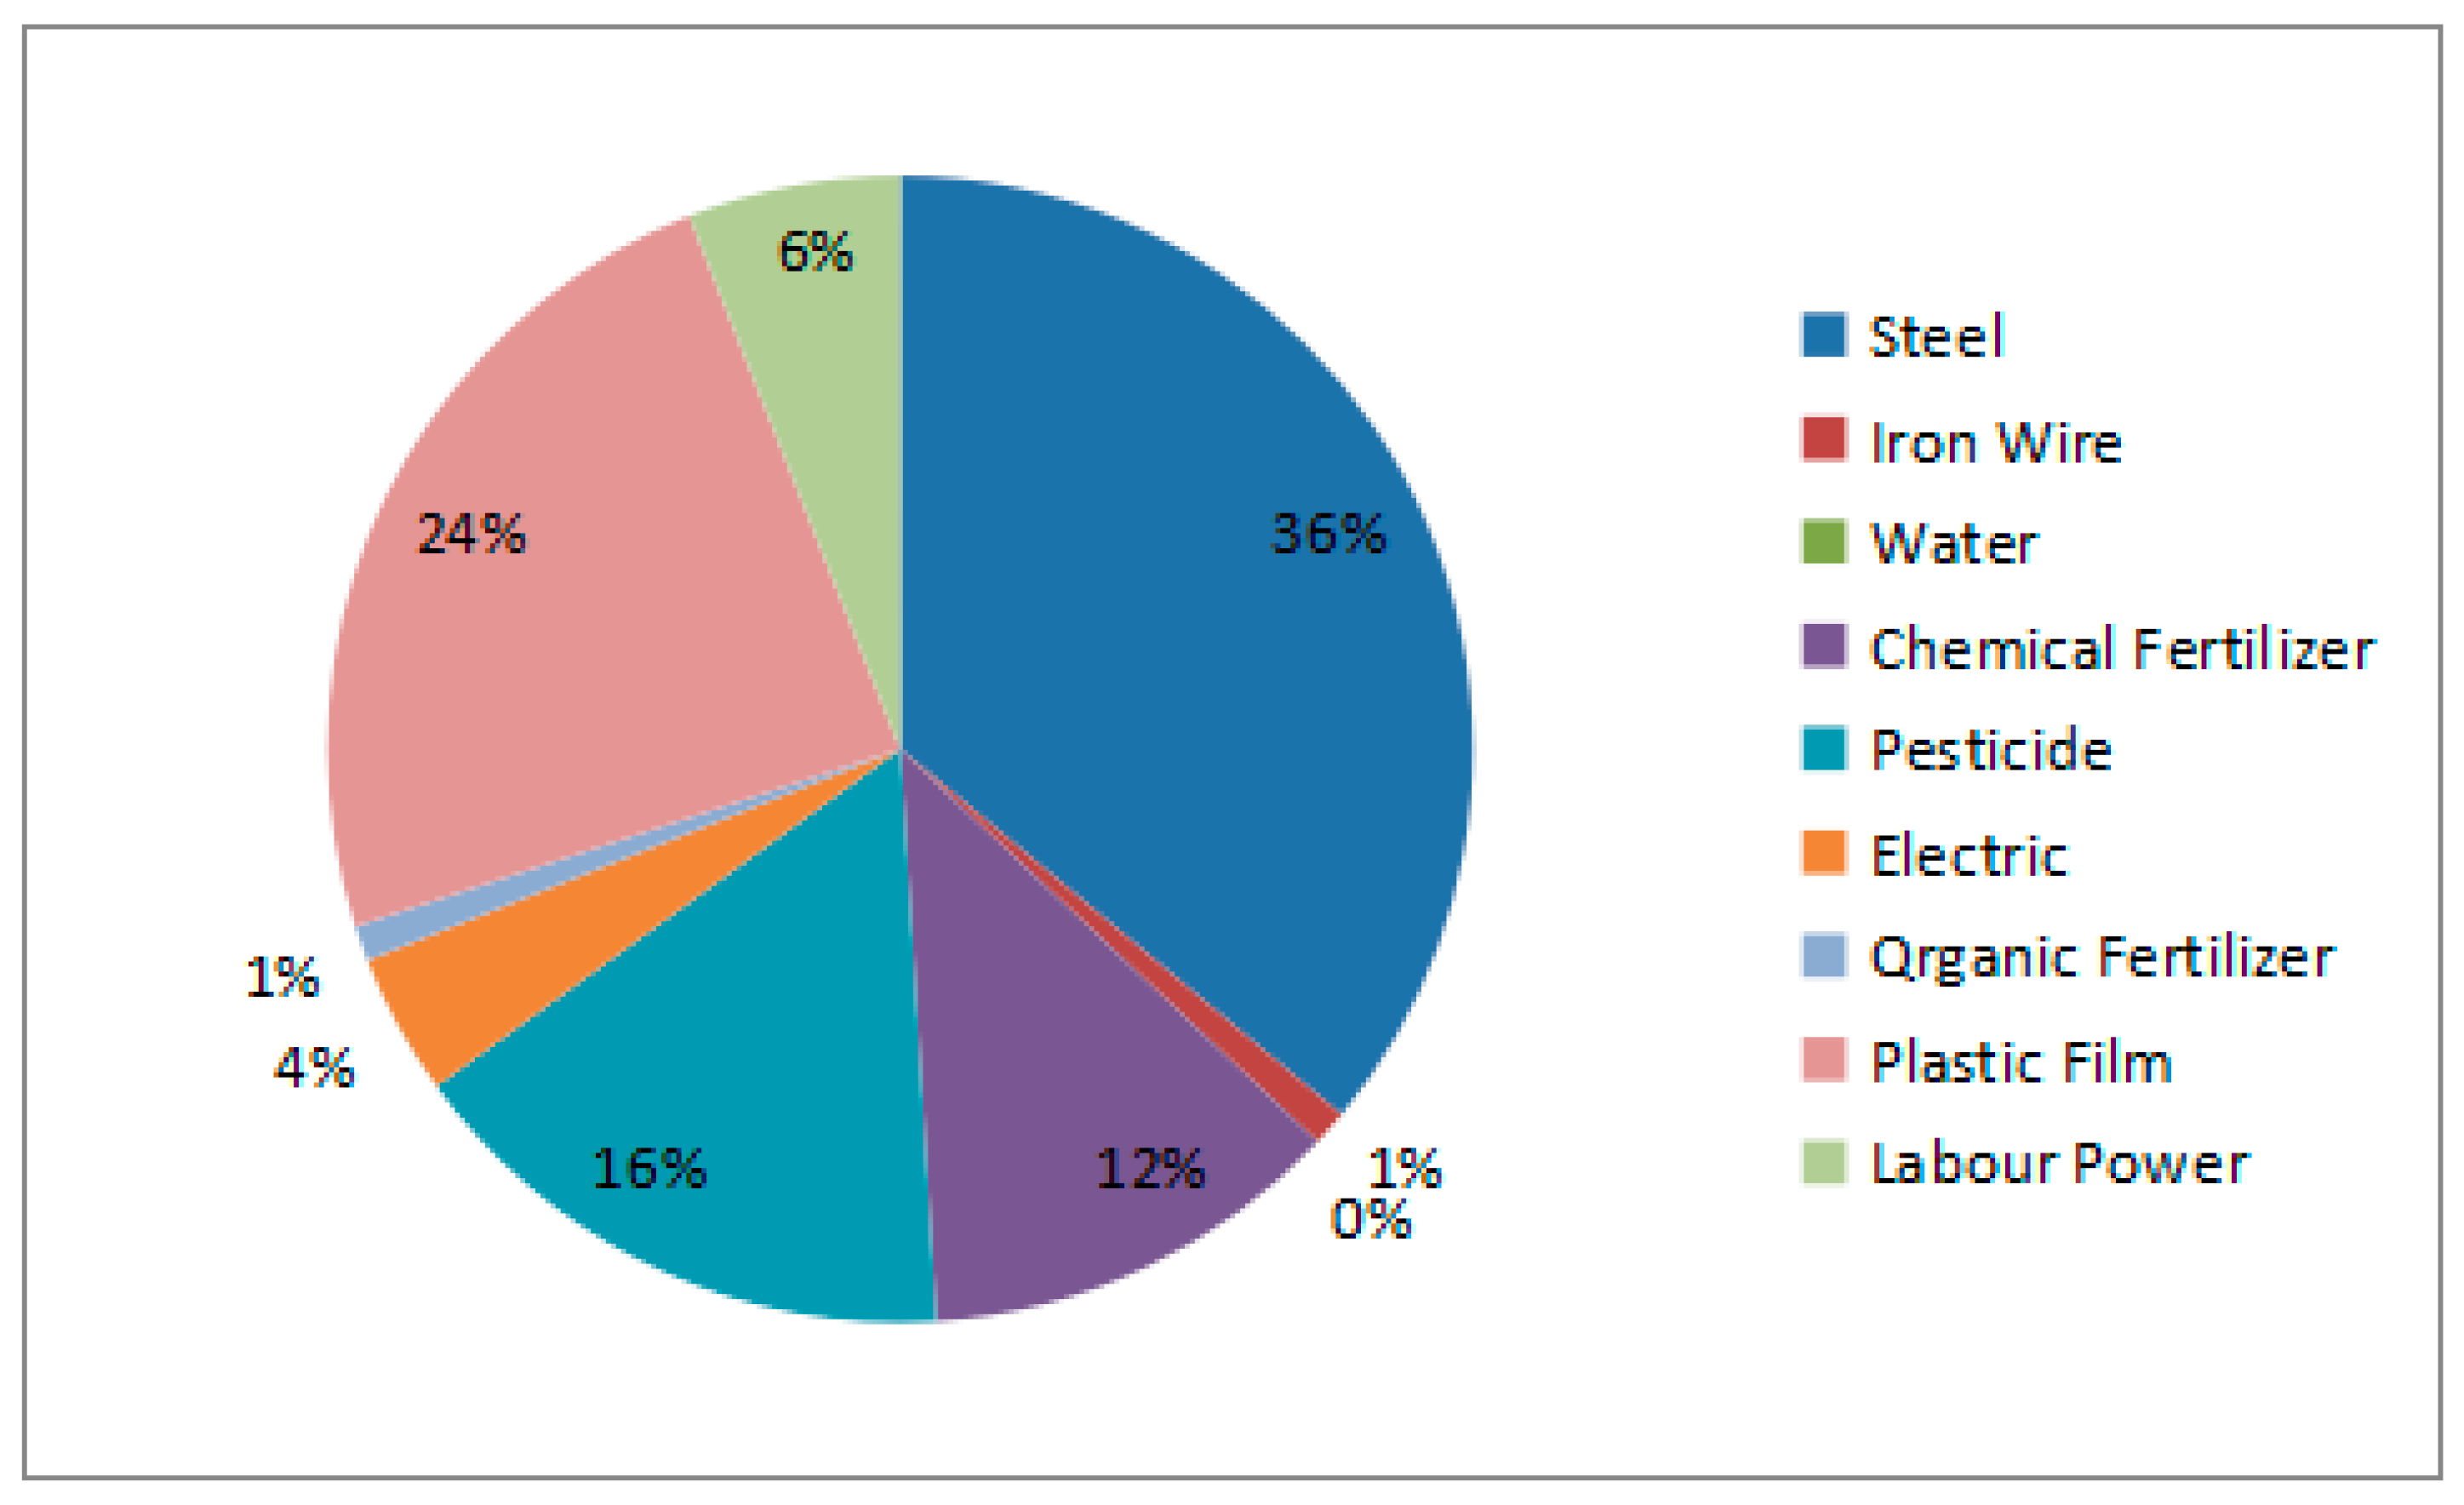
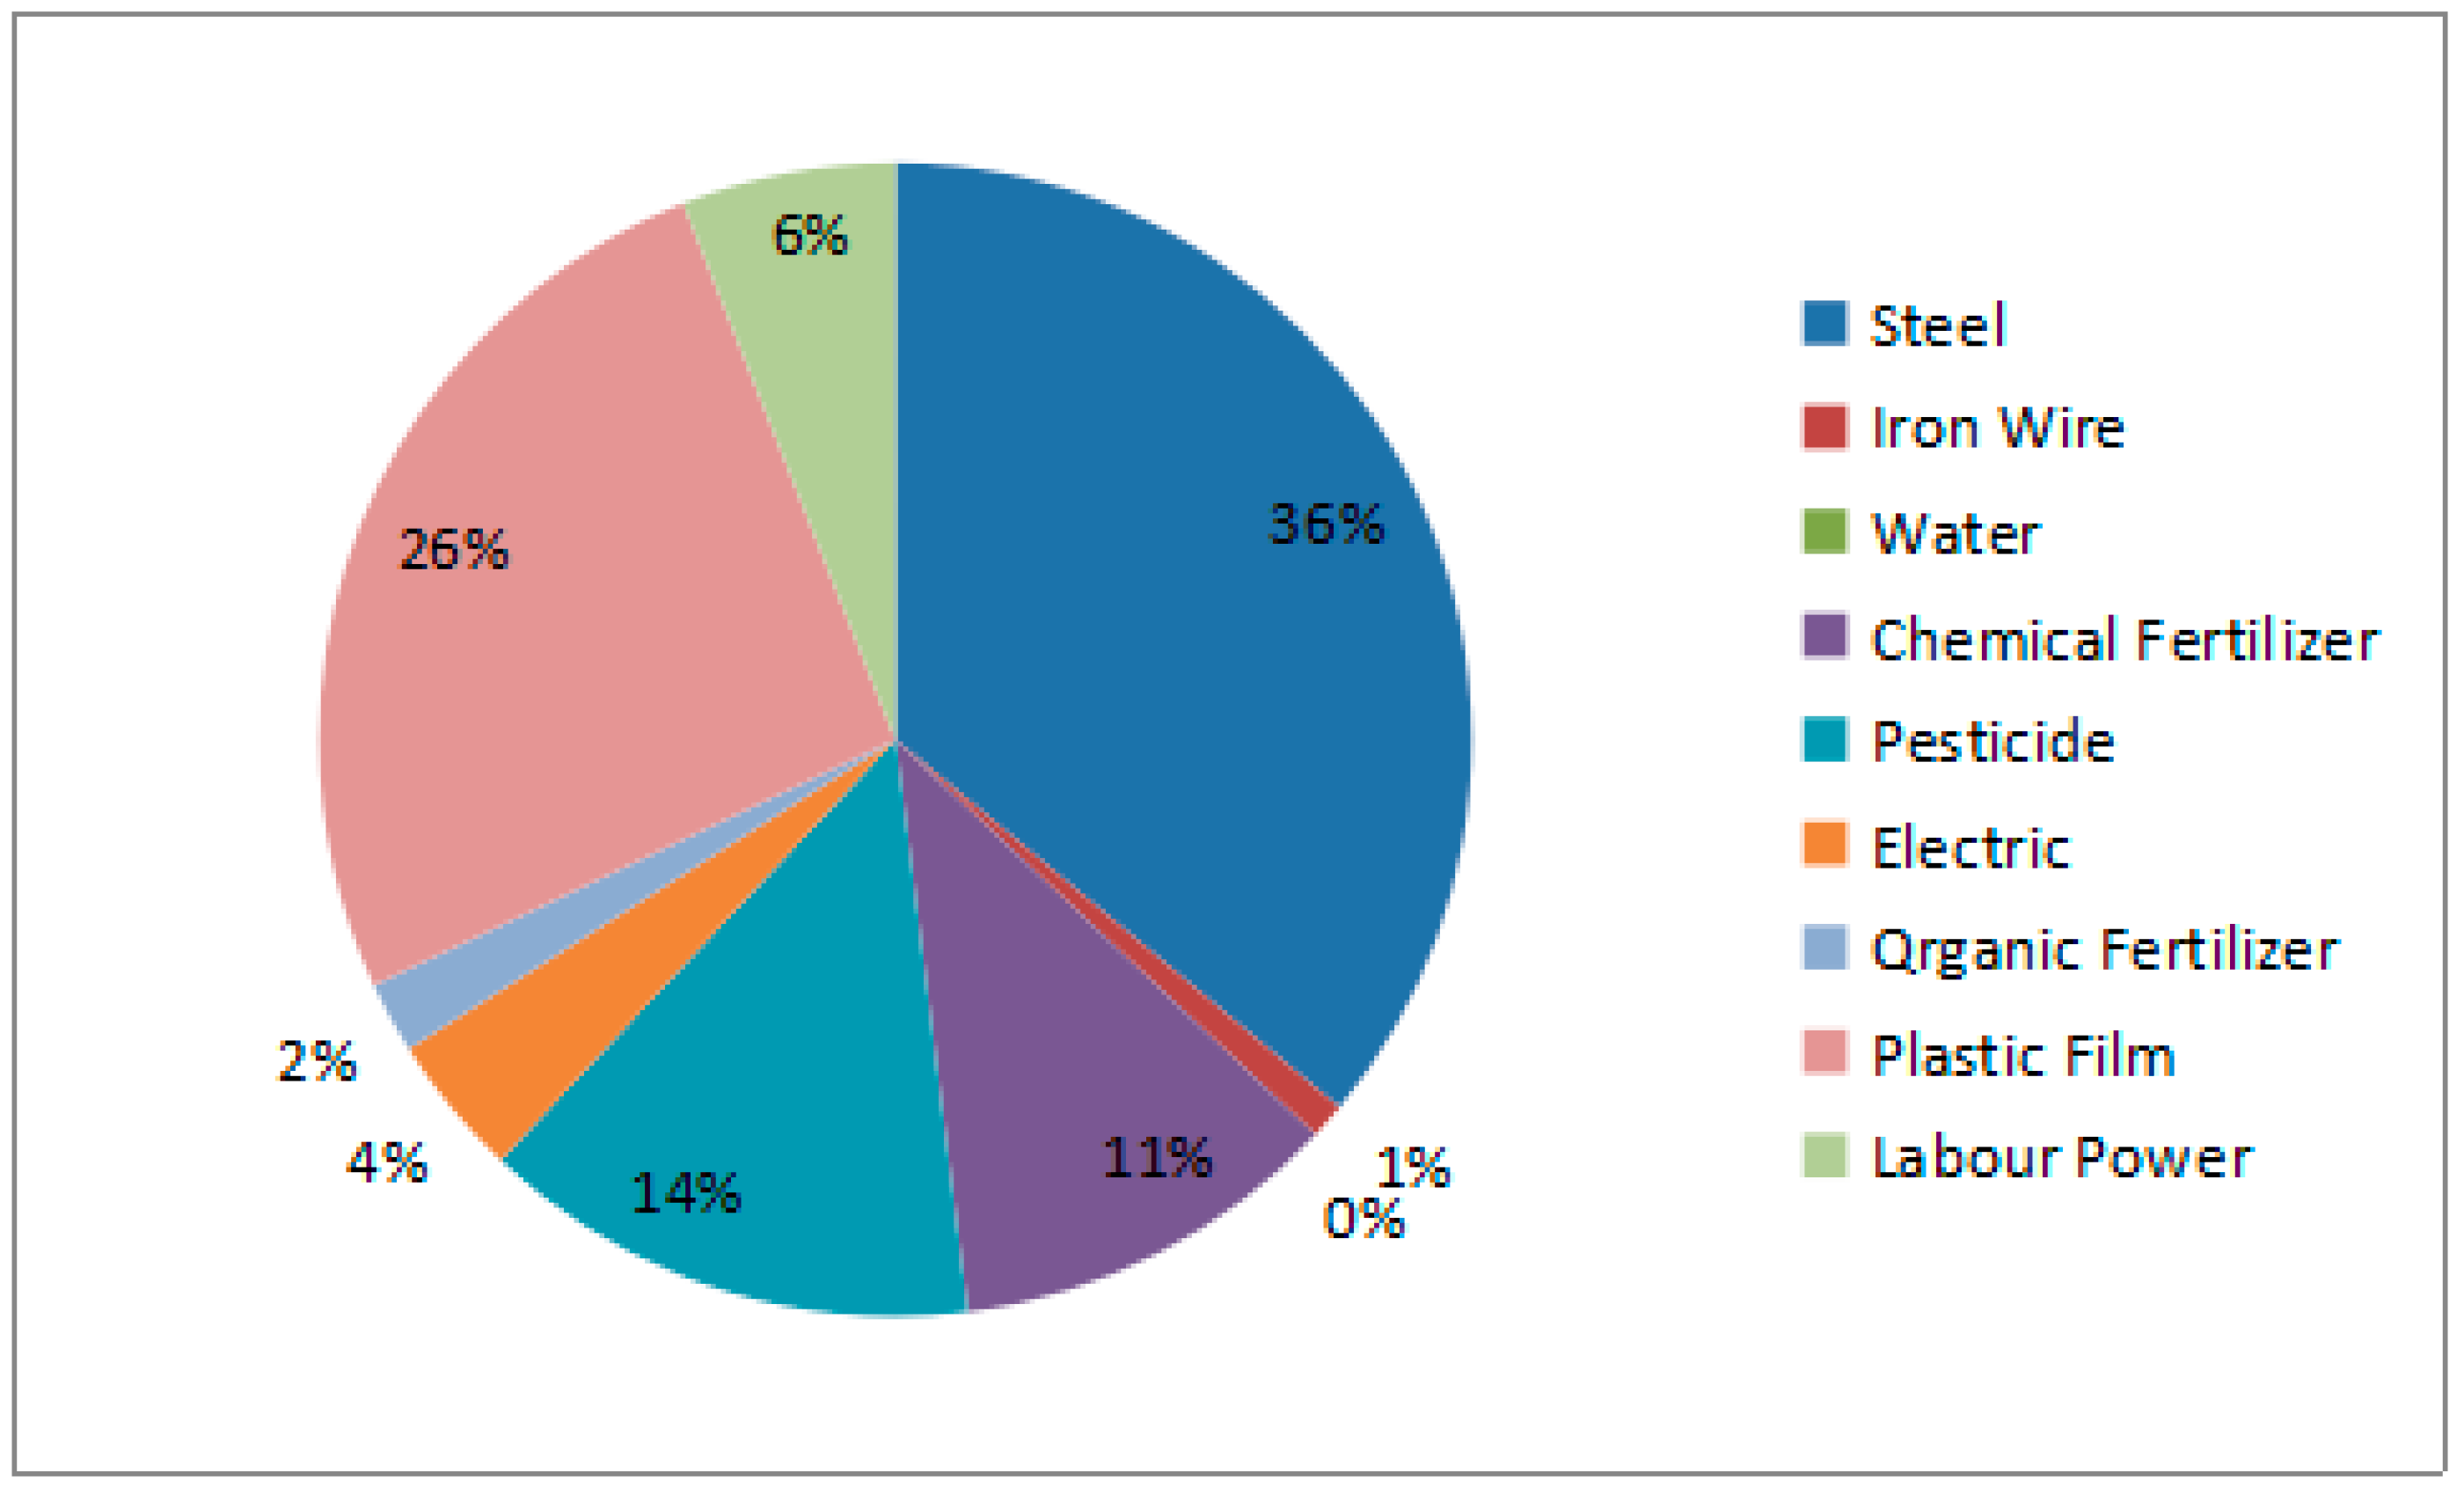
3.2.1. General Energy Items Structure
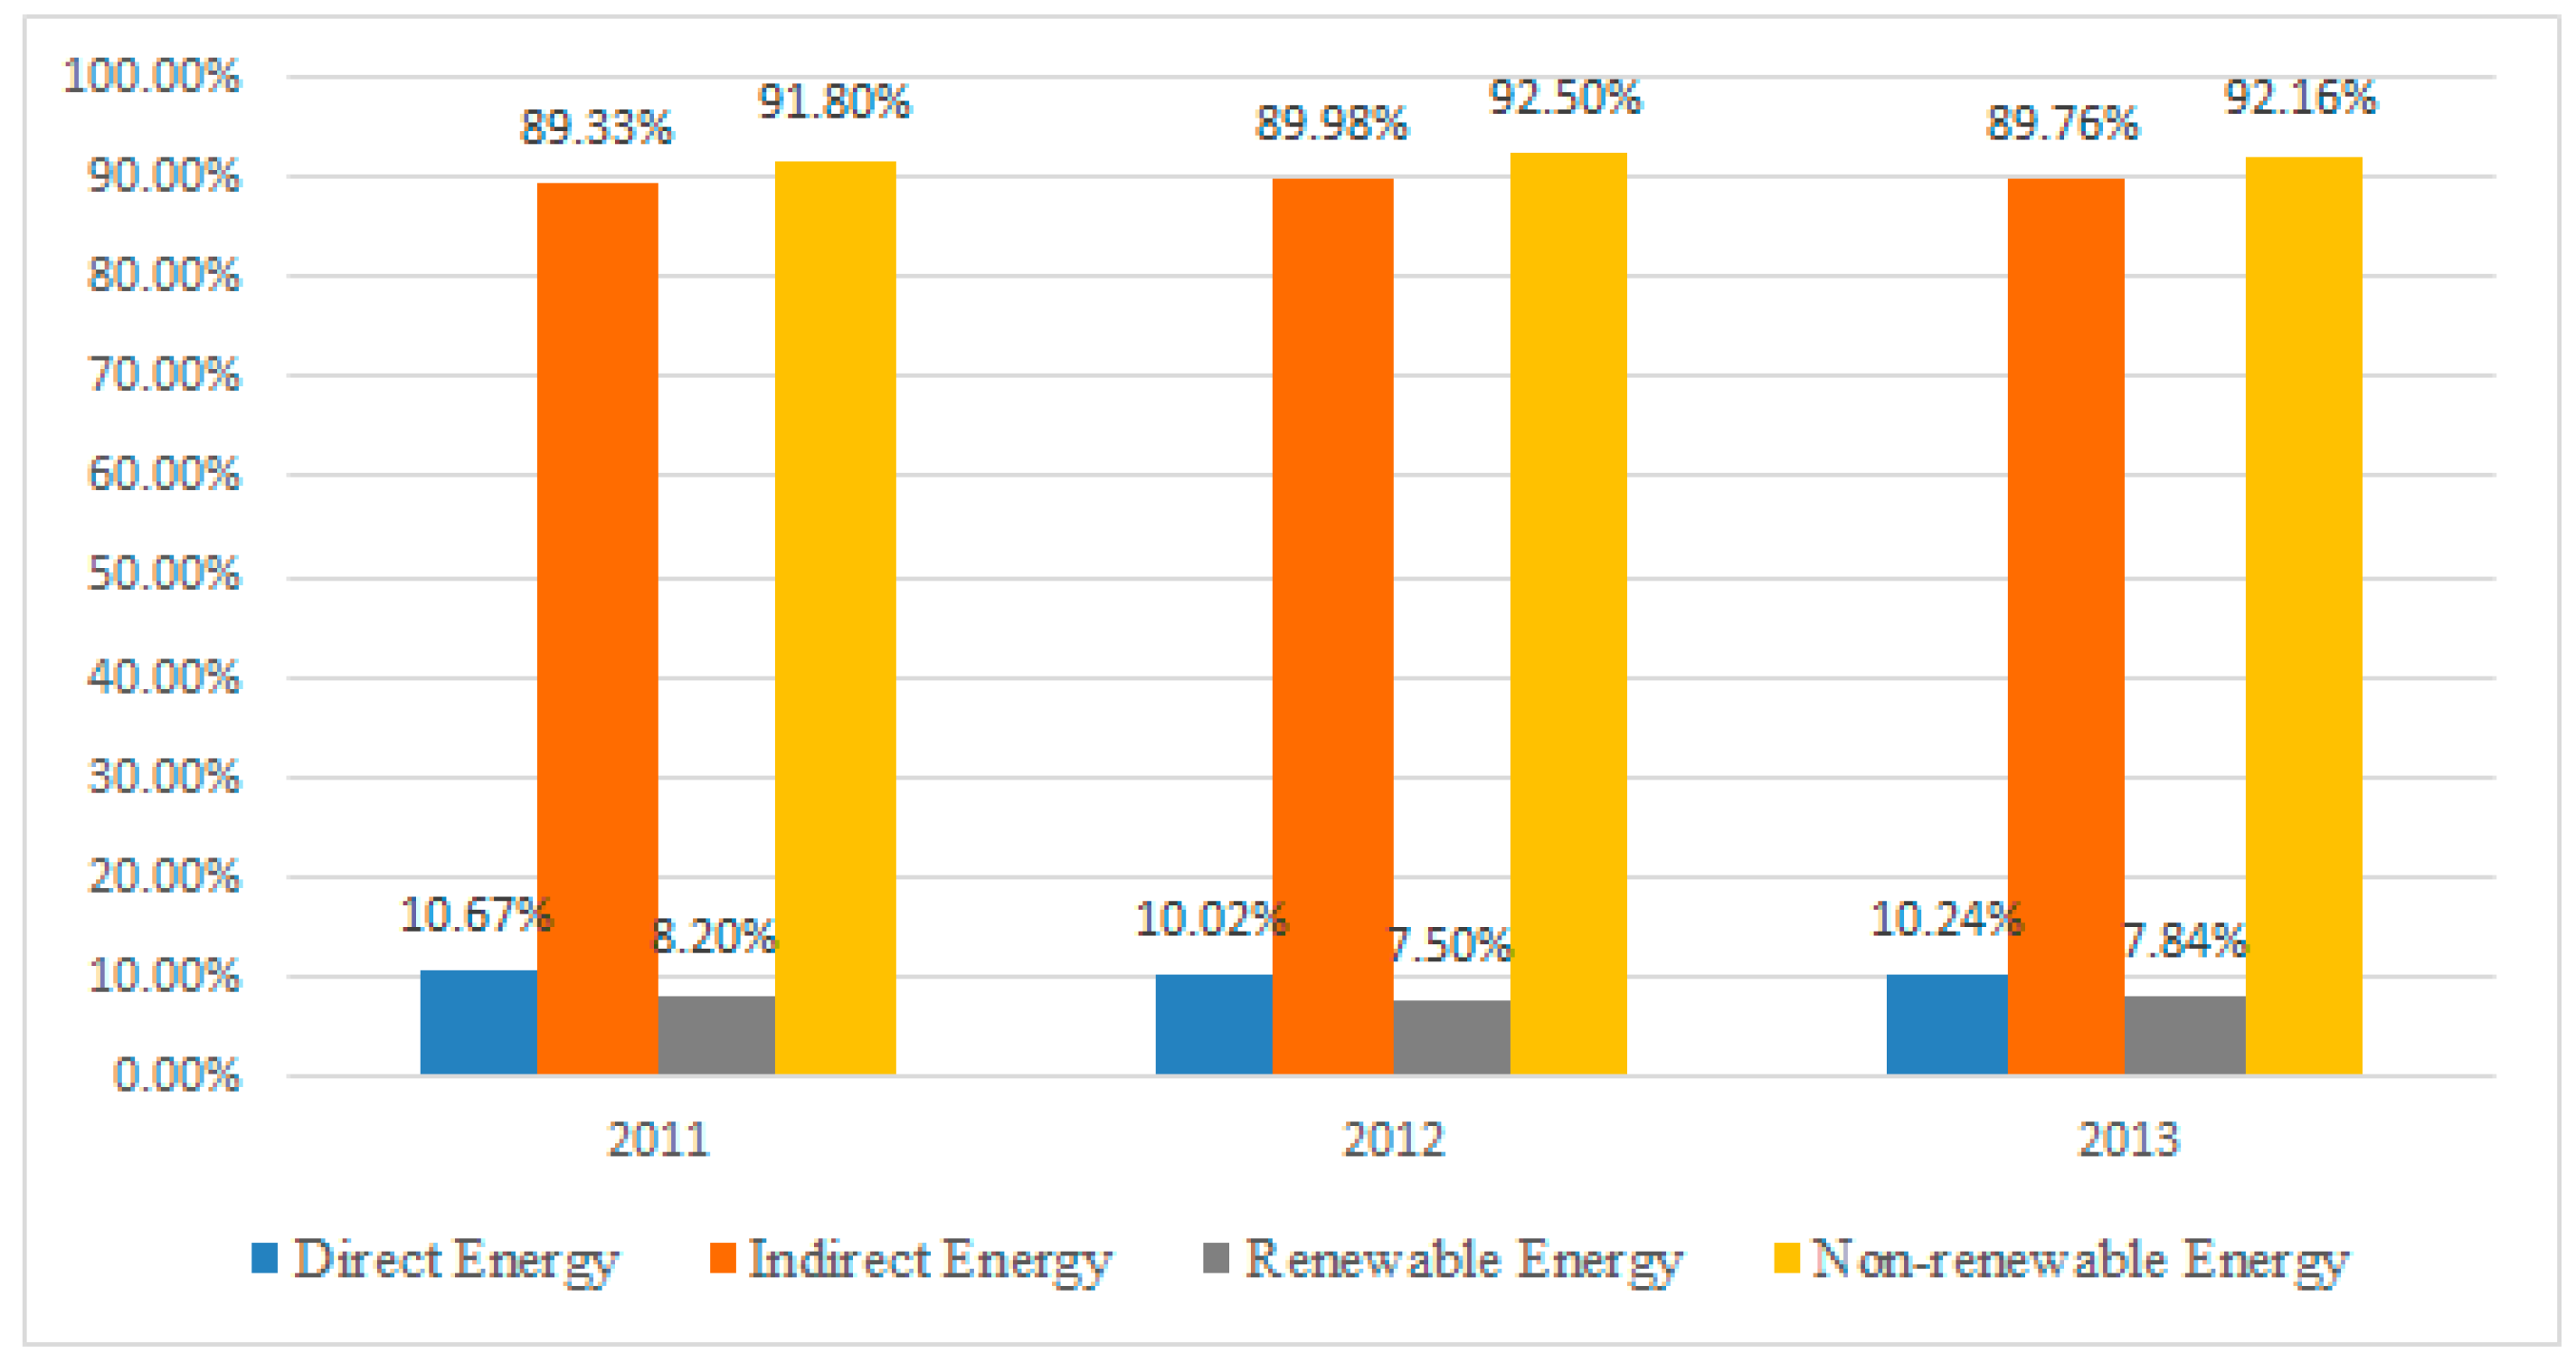
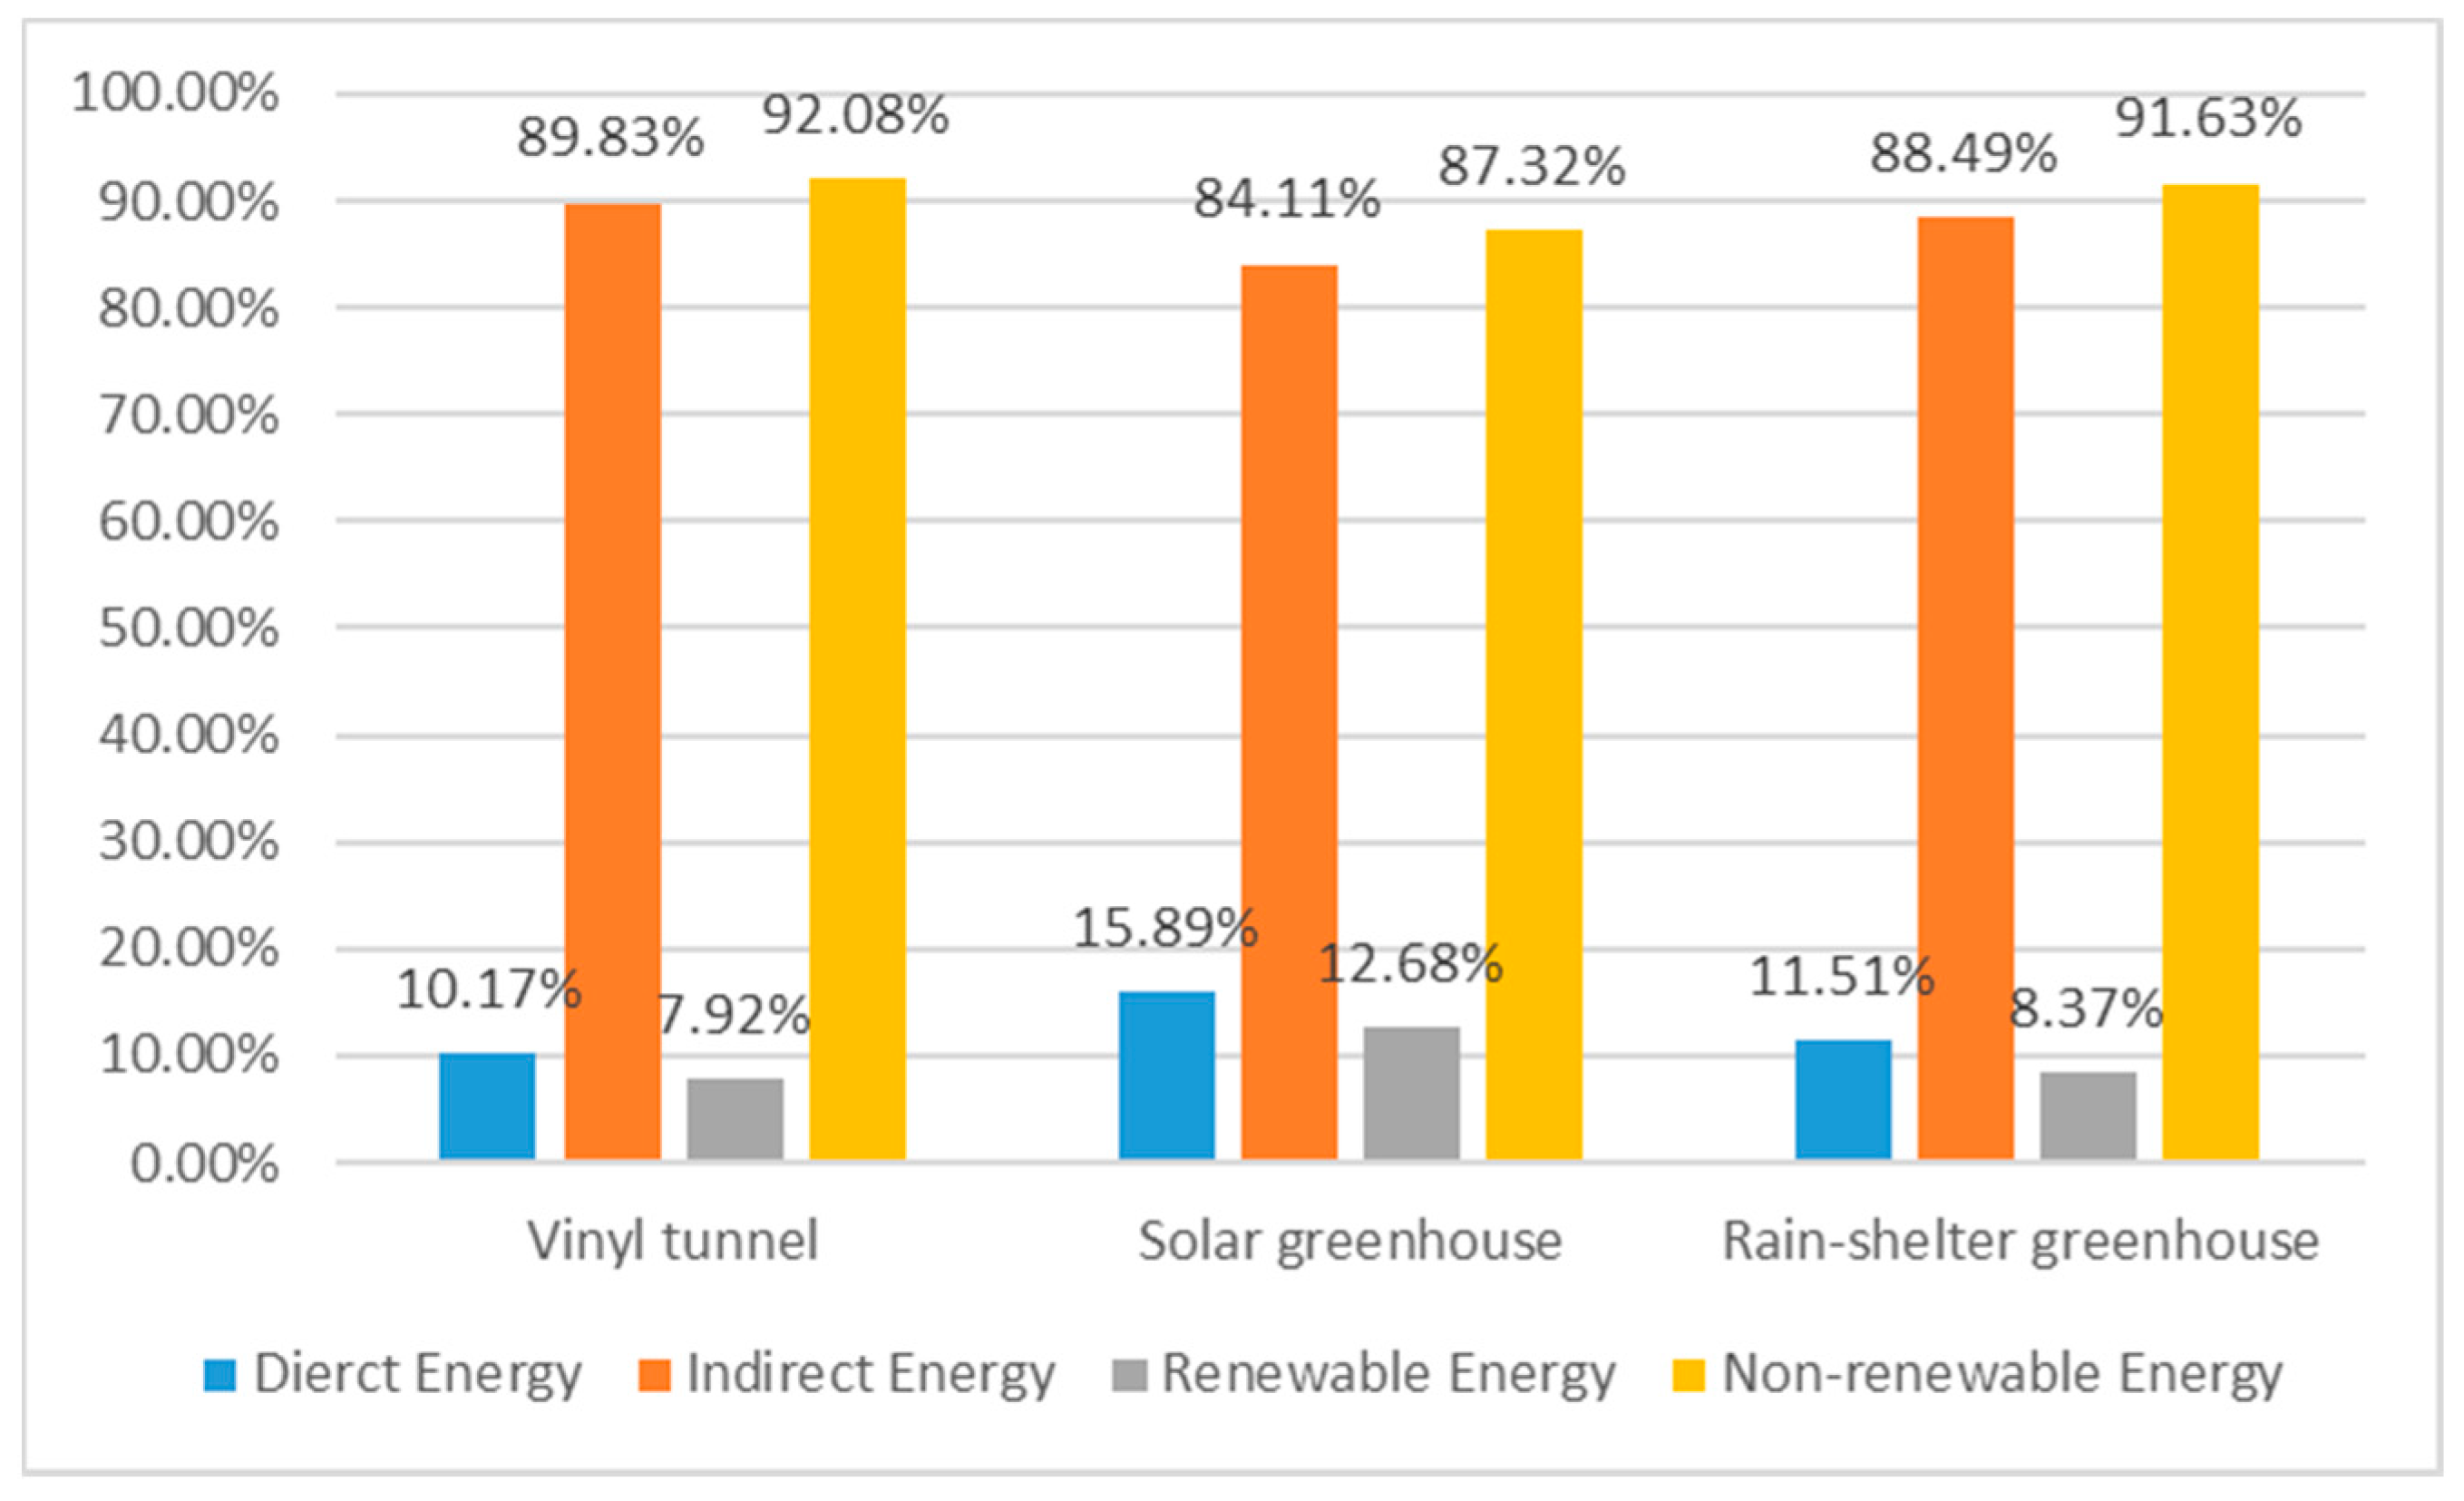
3.2.2. Classification Structure
3.3. Difference of Energy Consumption in Different Sub-Patterns of Protected Grape Cultivation
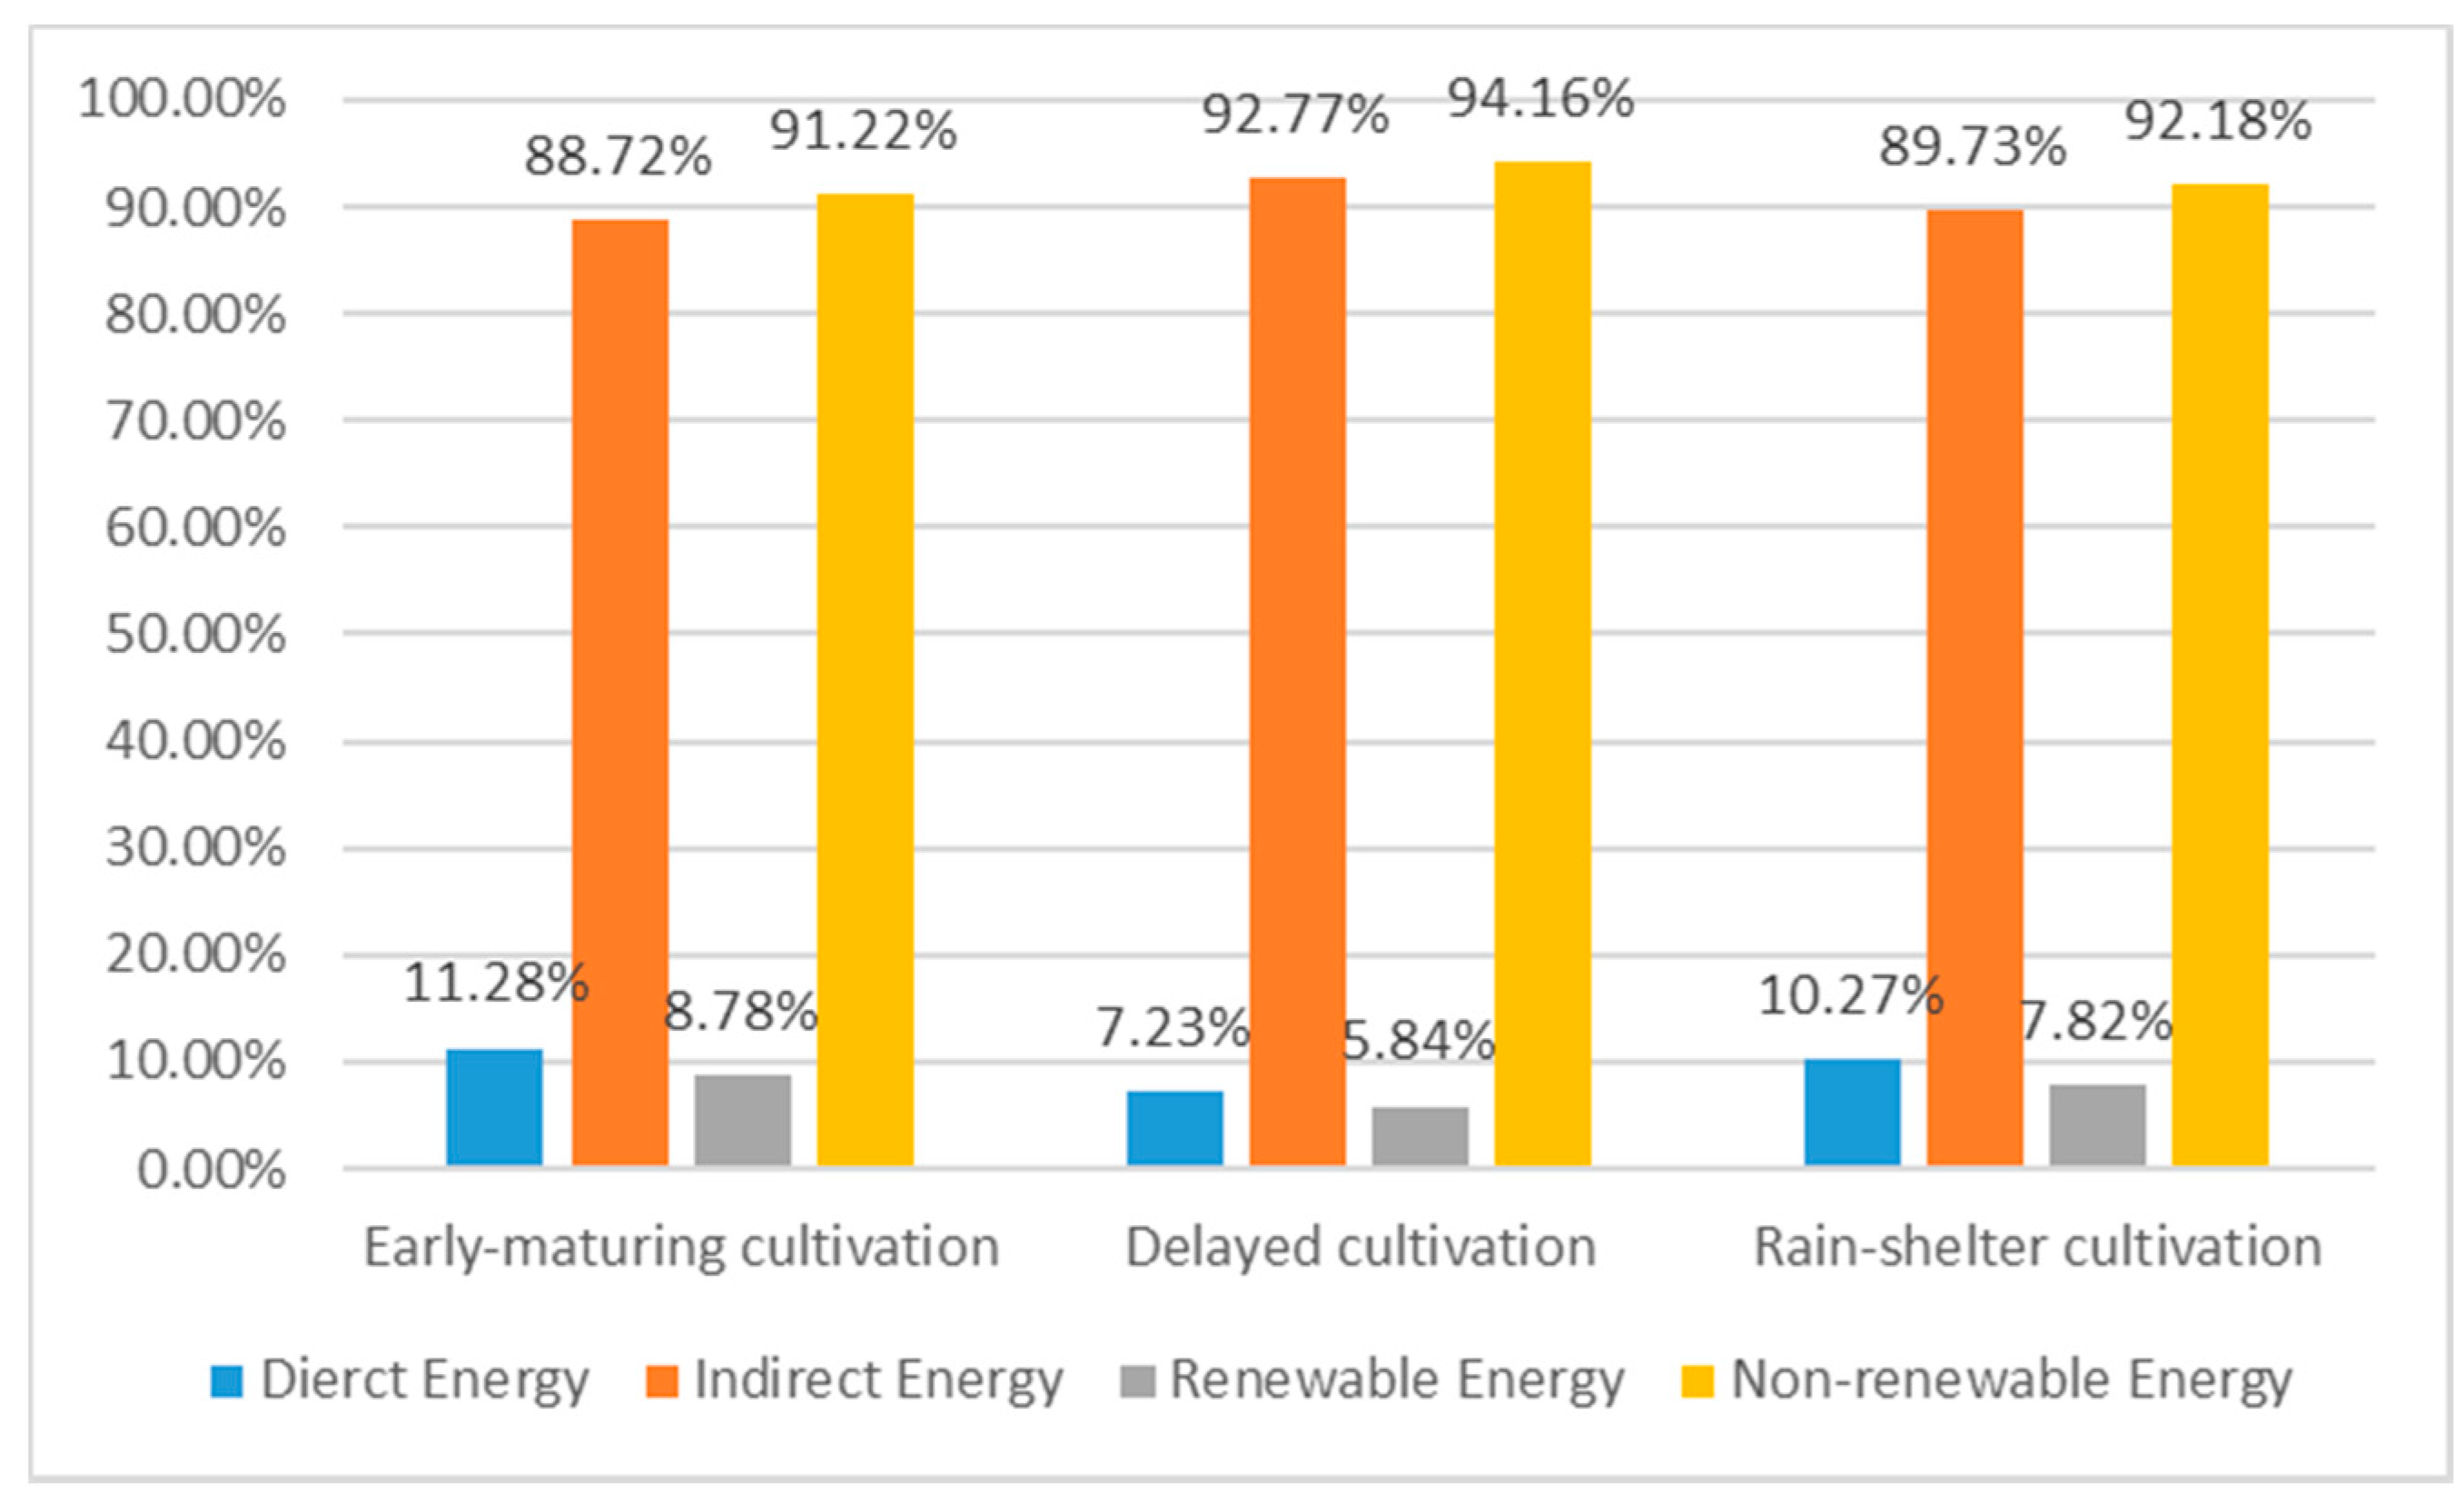
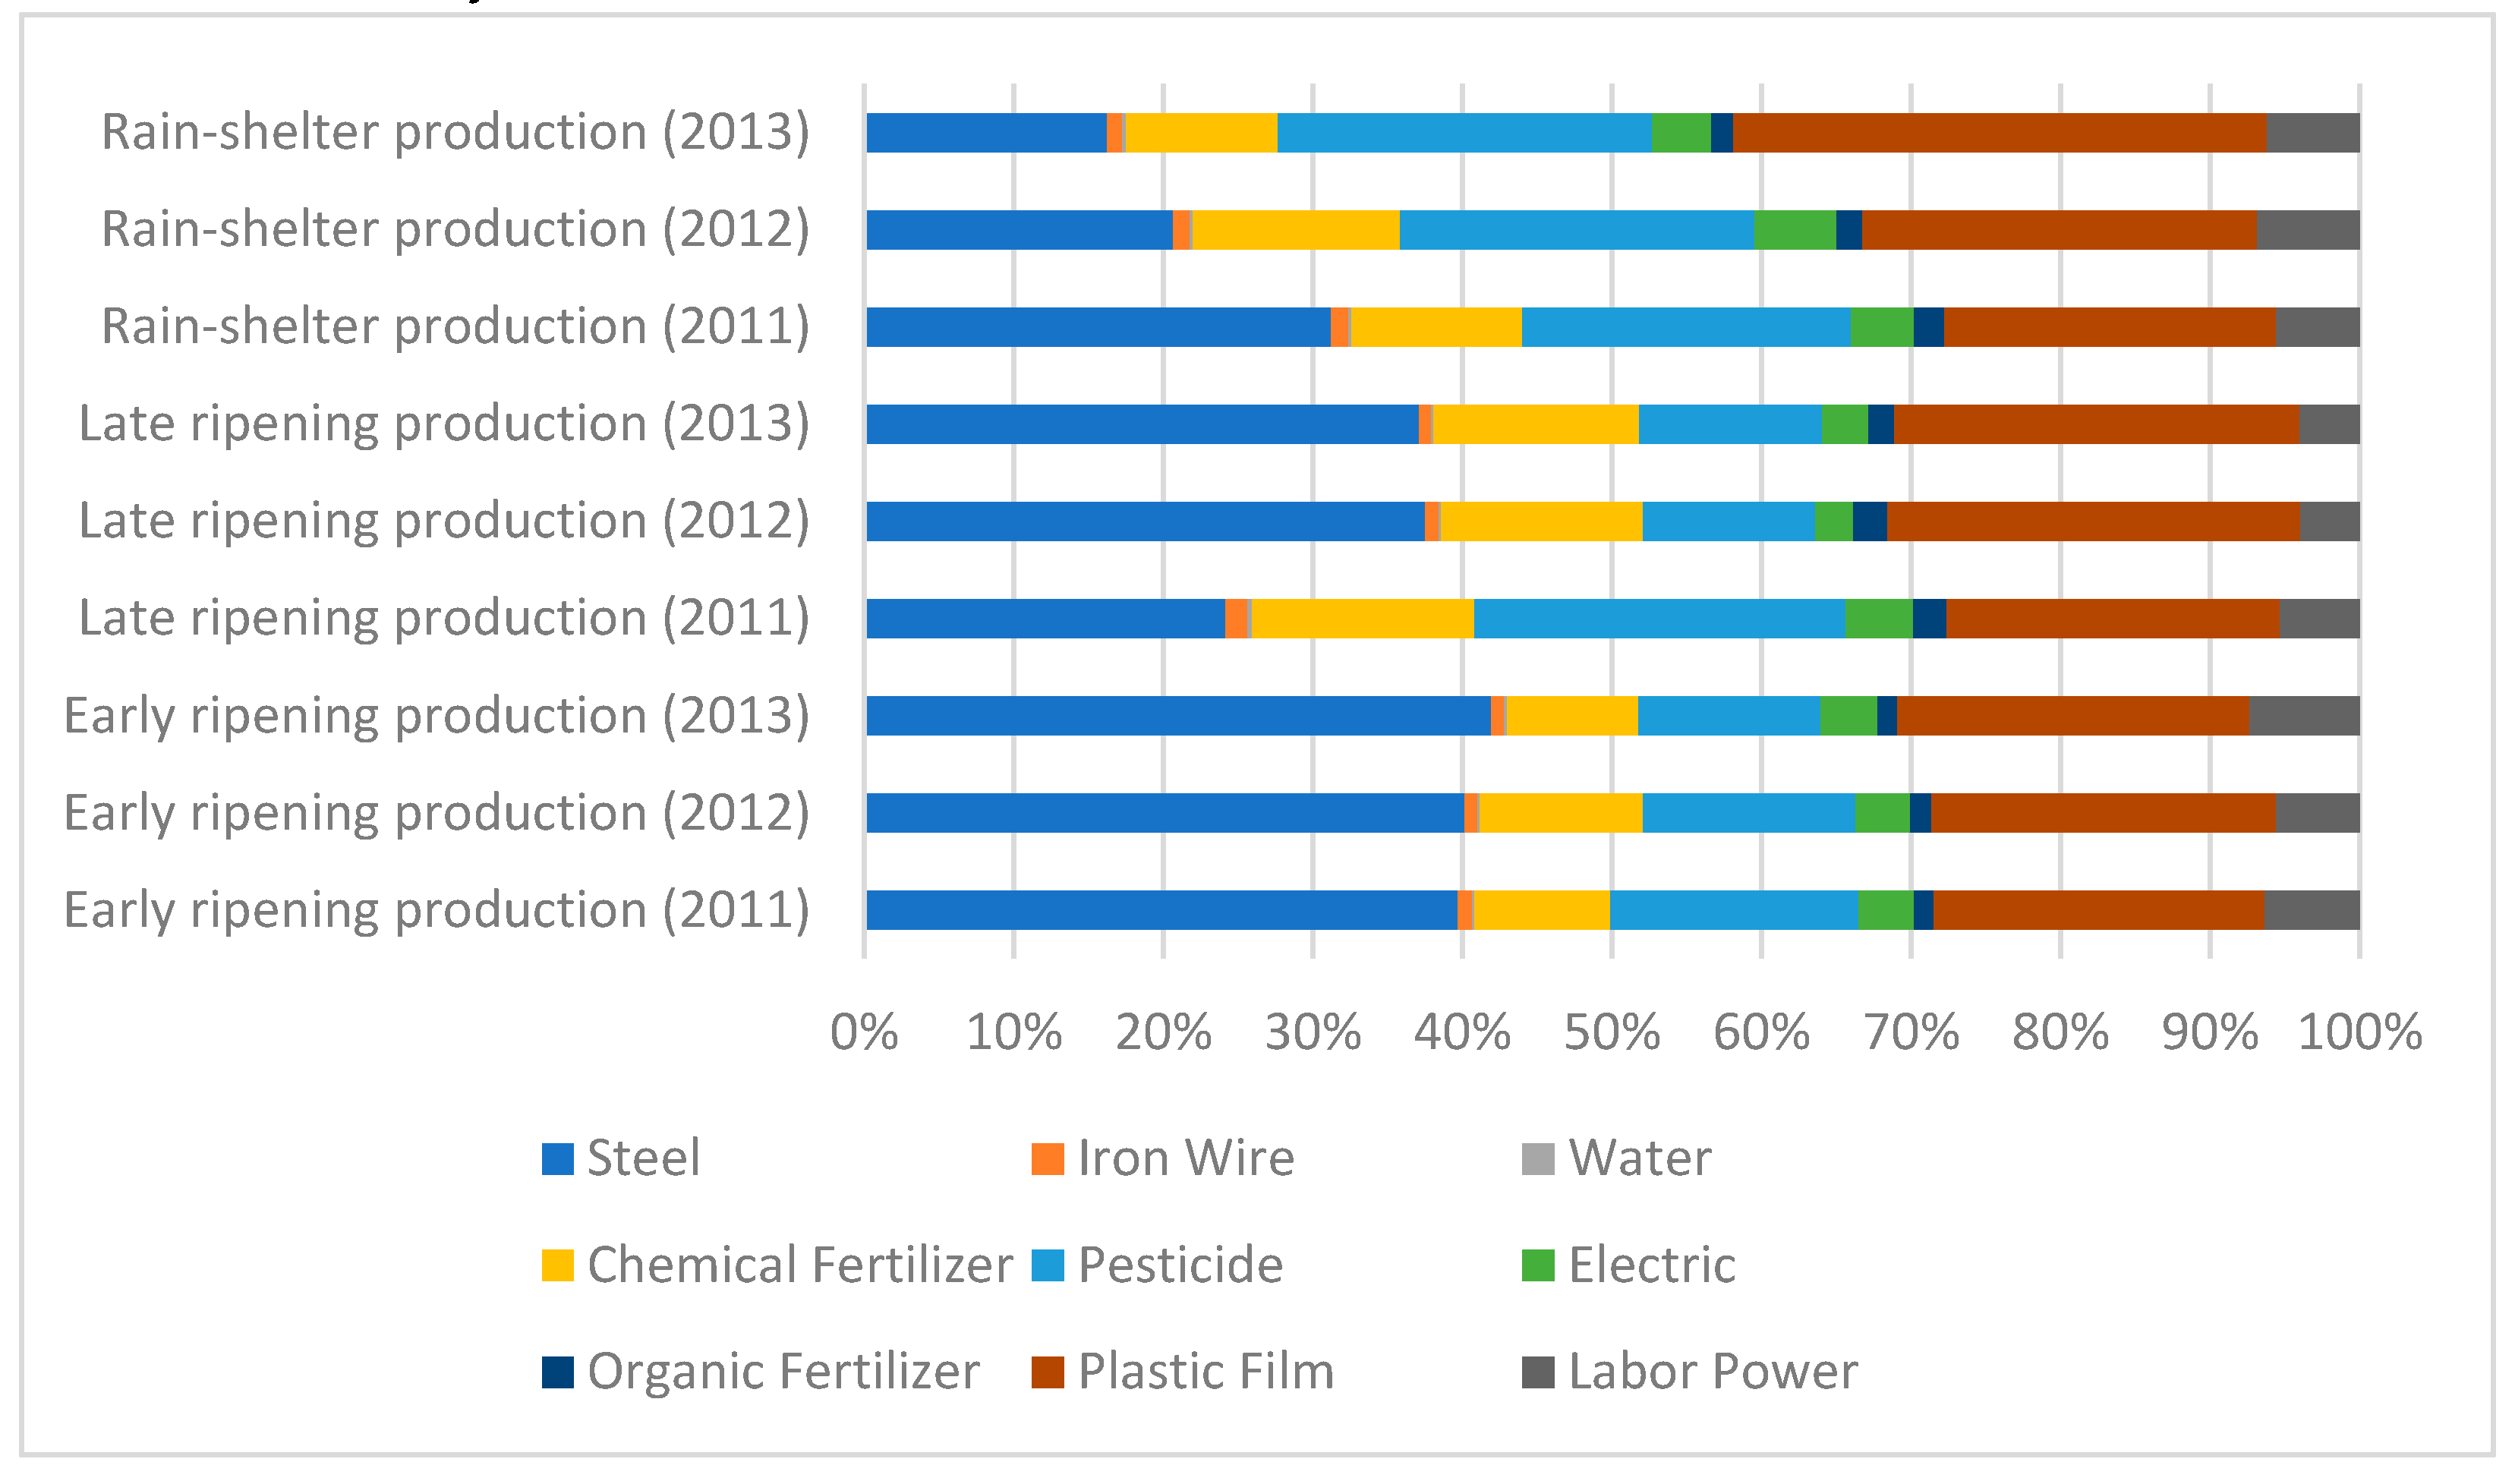
3.3.1. Differences in Early Ripening, Late Ripening, and Rain-Shelter Production Systems
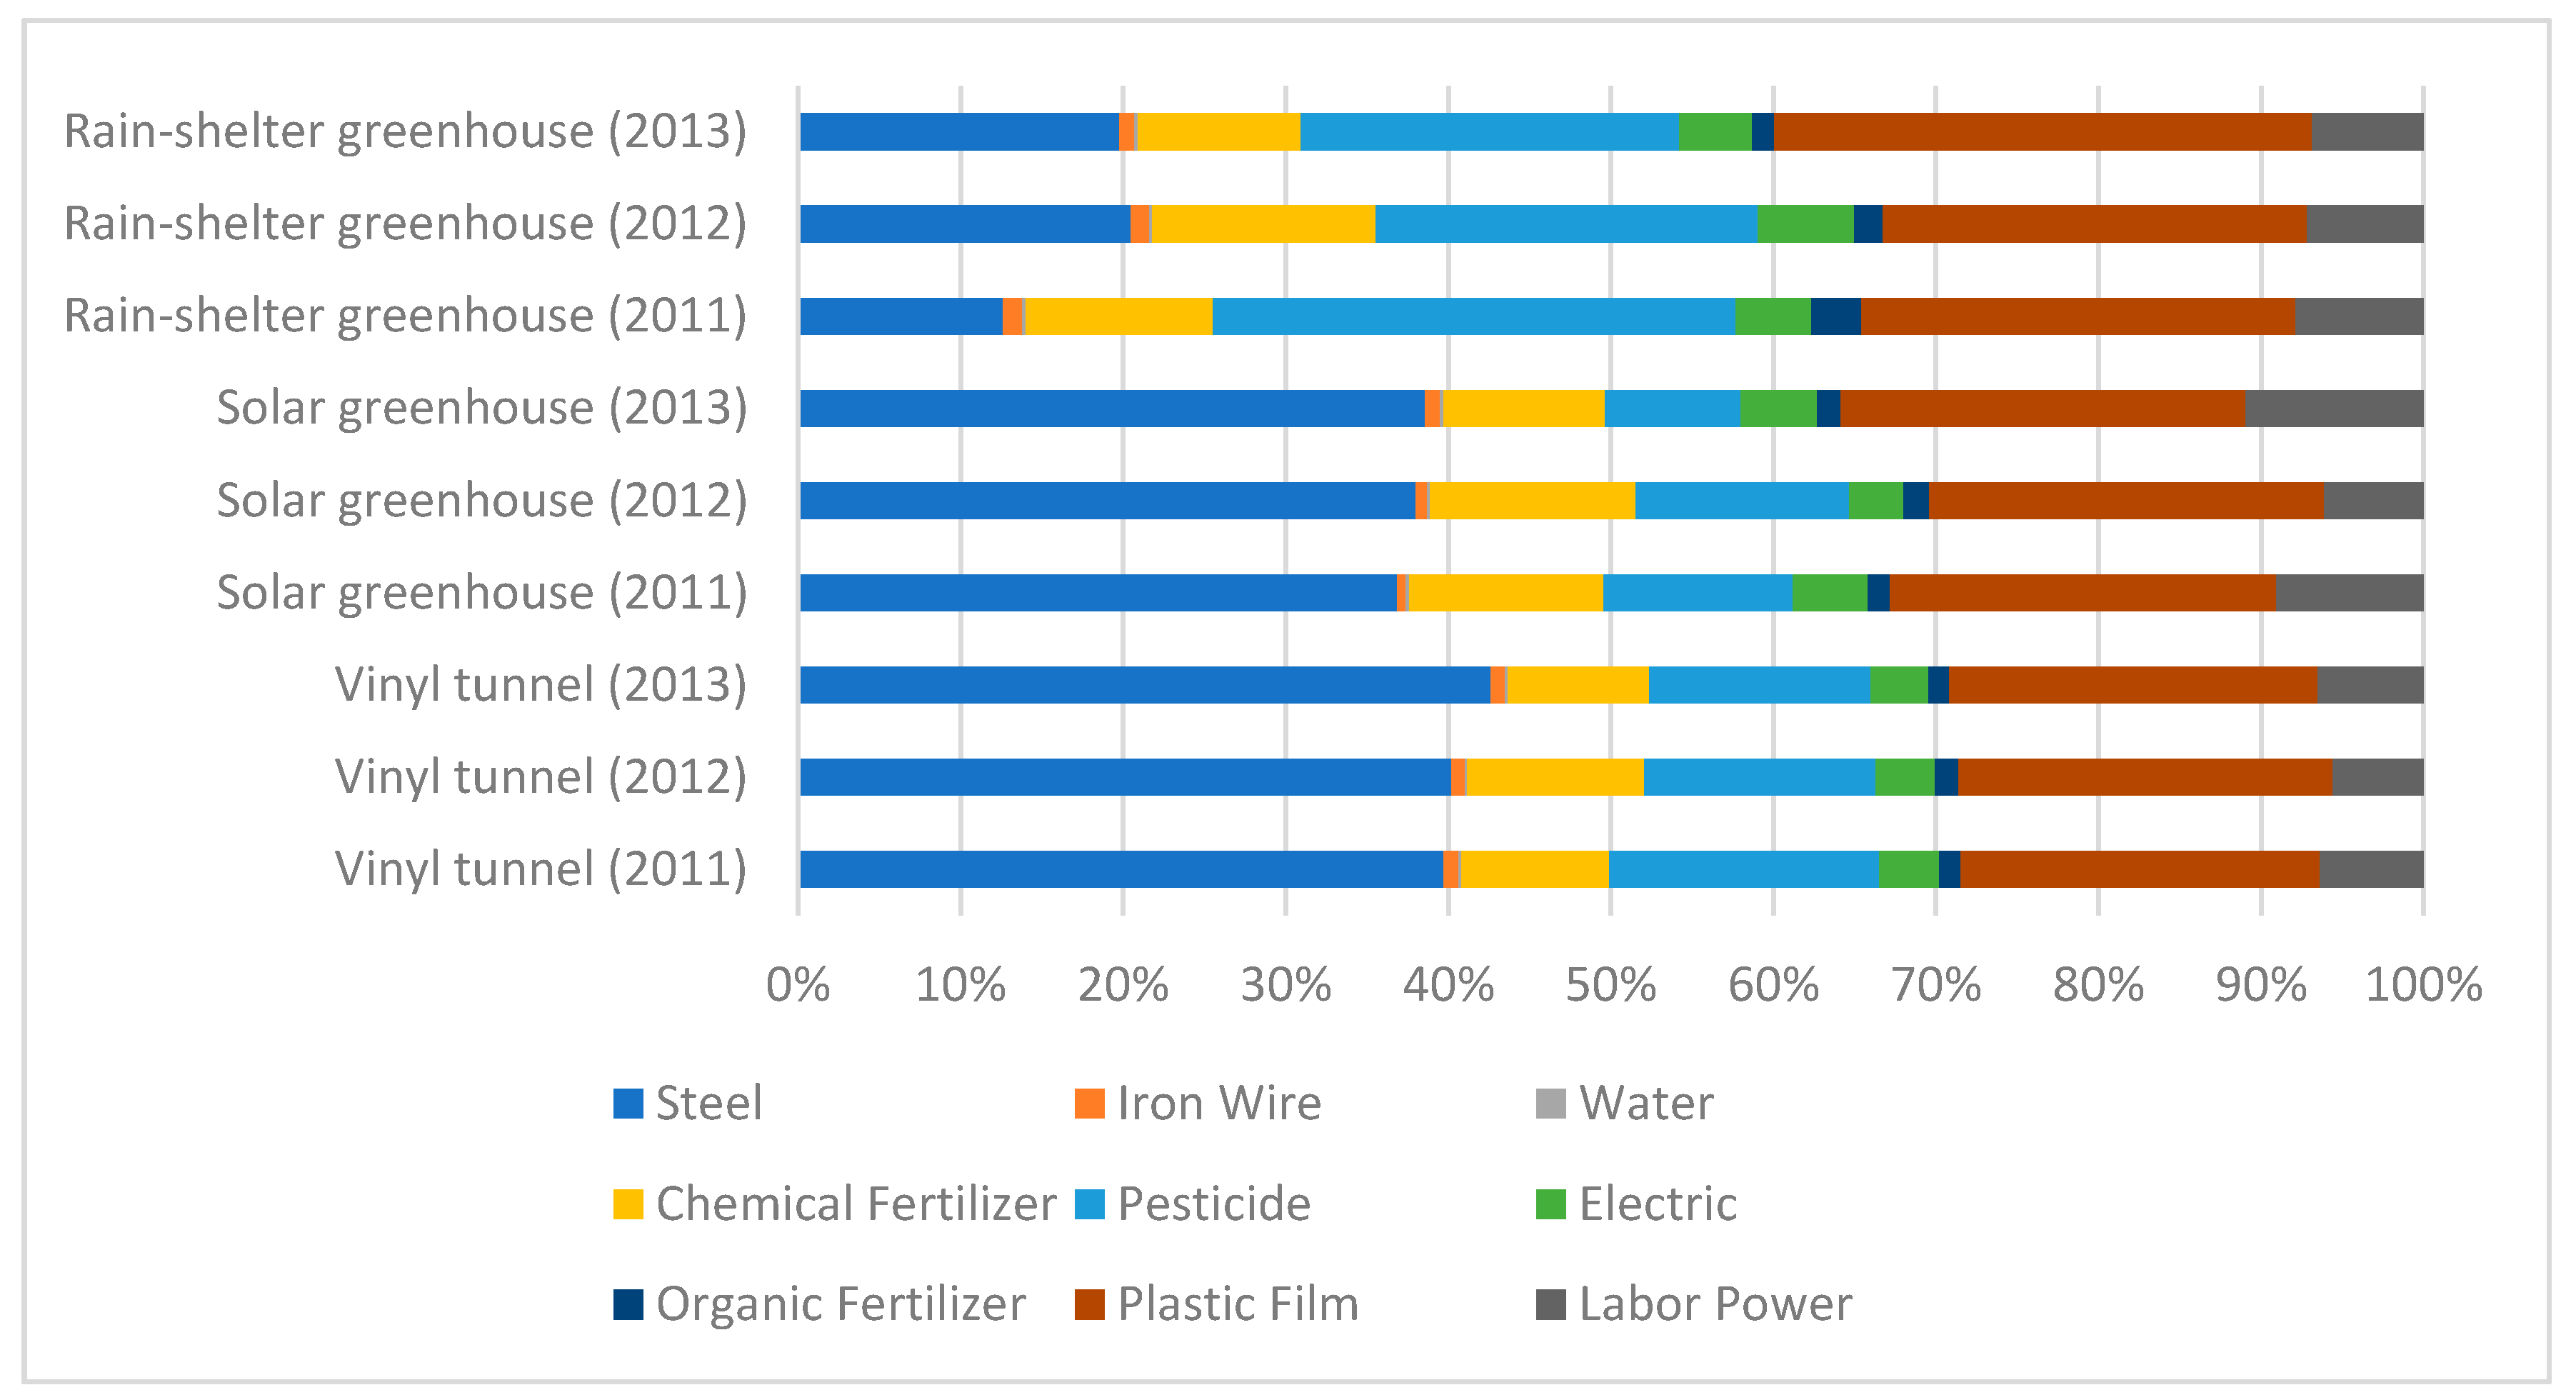
3.3.2. Differences in Vinyl Tunnel, Solar, and Rain-Shelter Cultivations
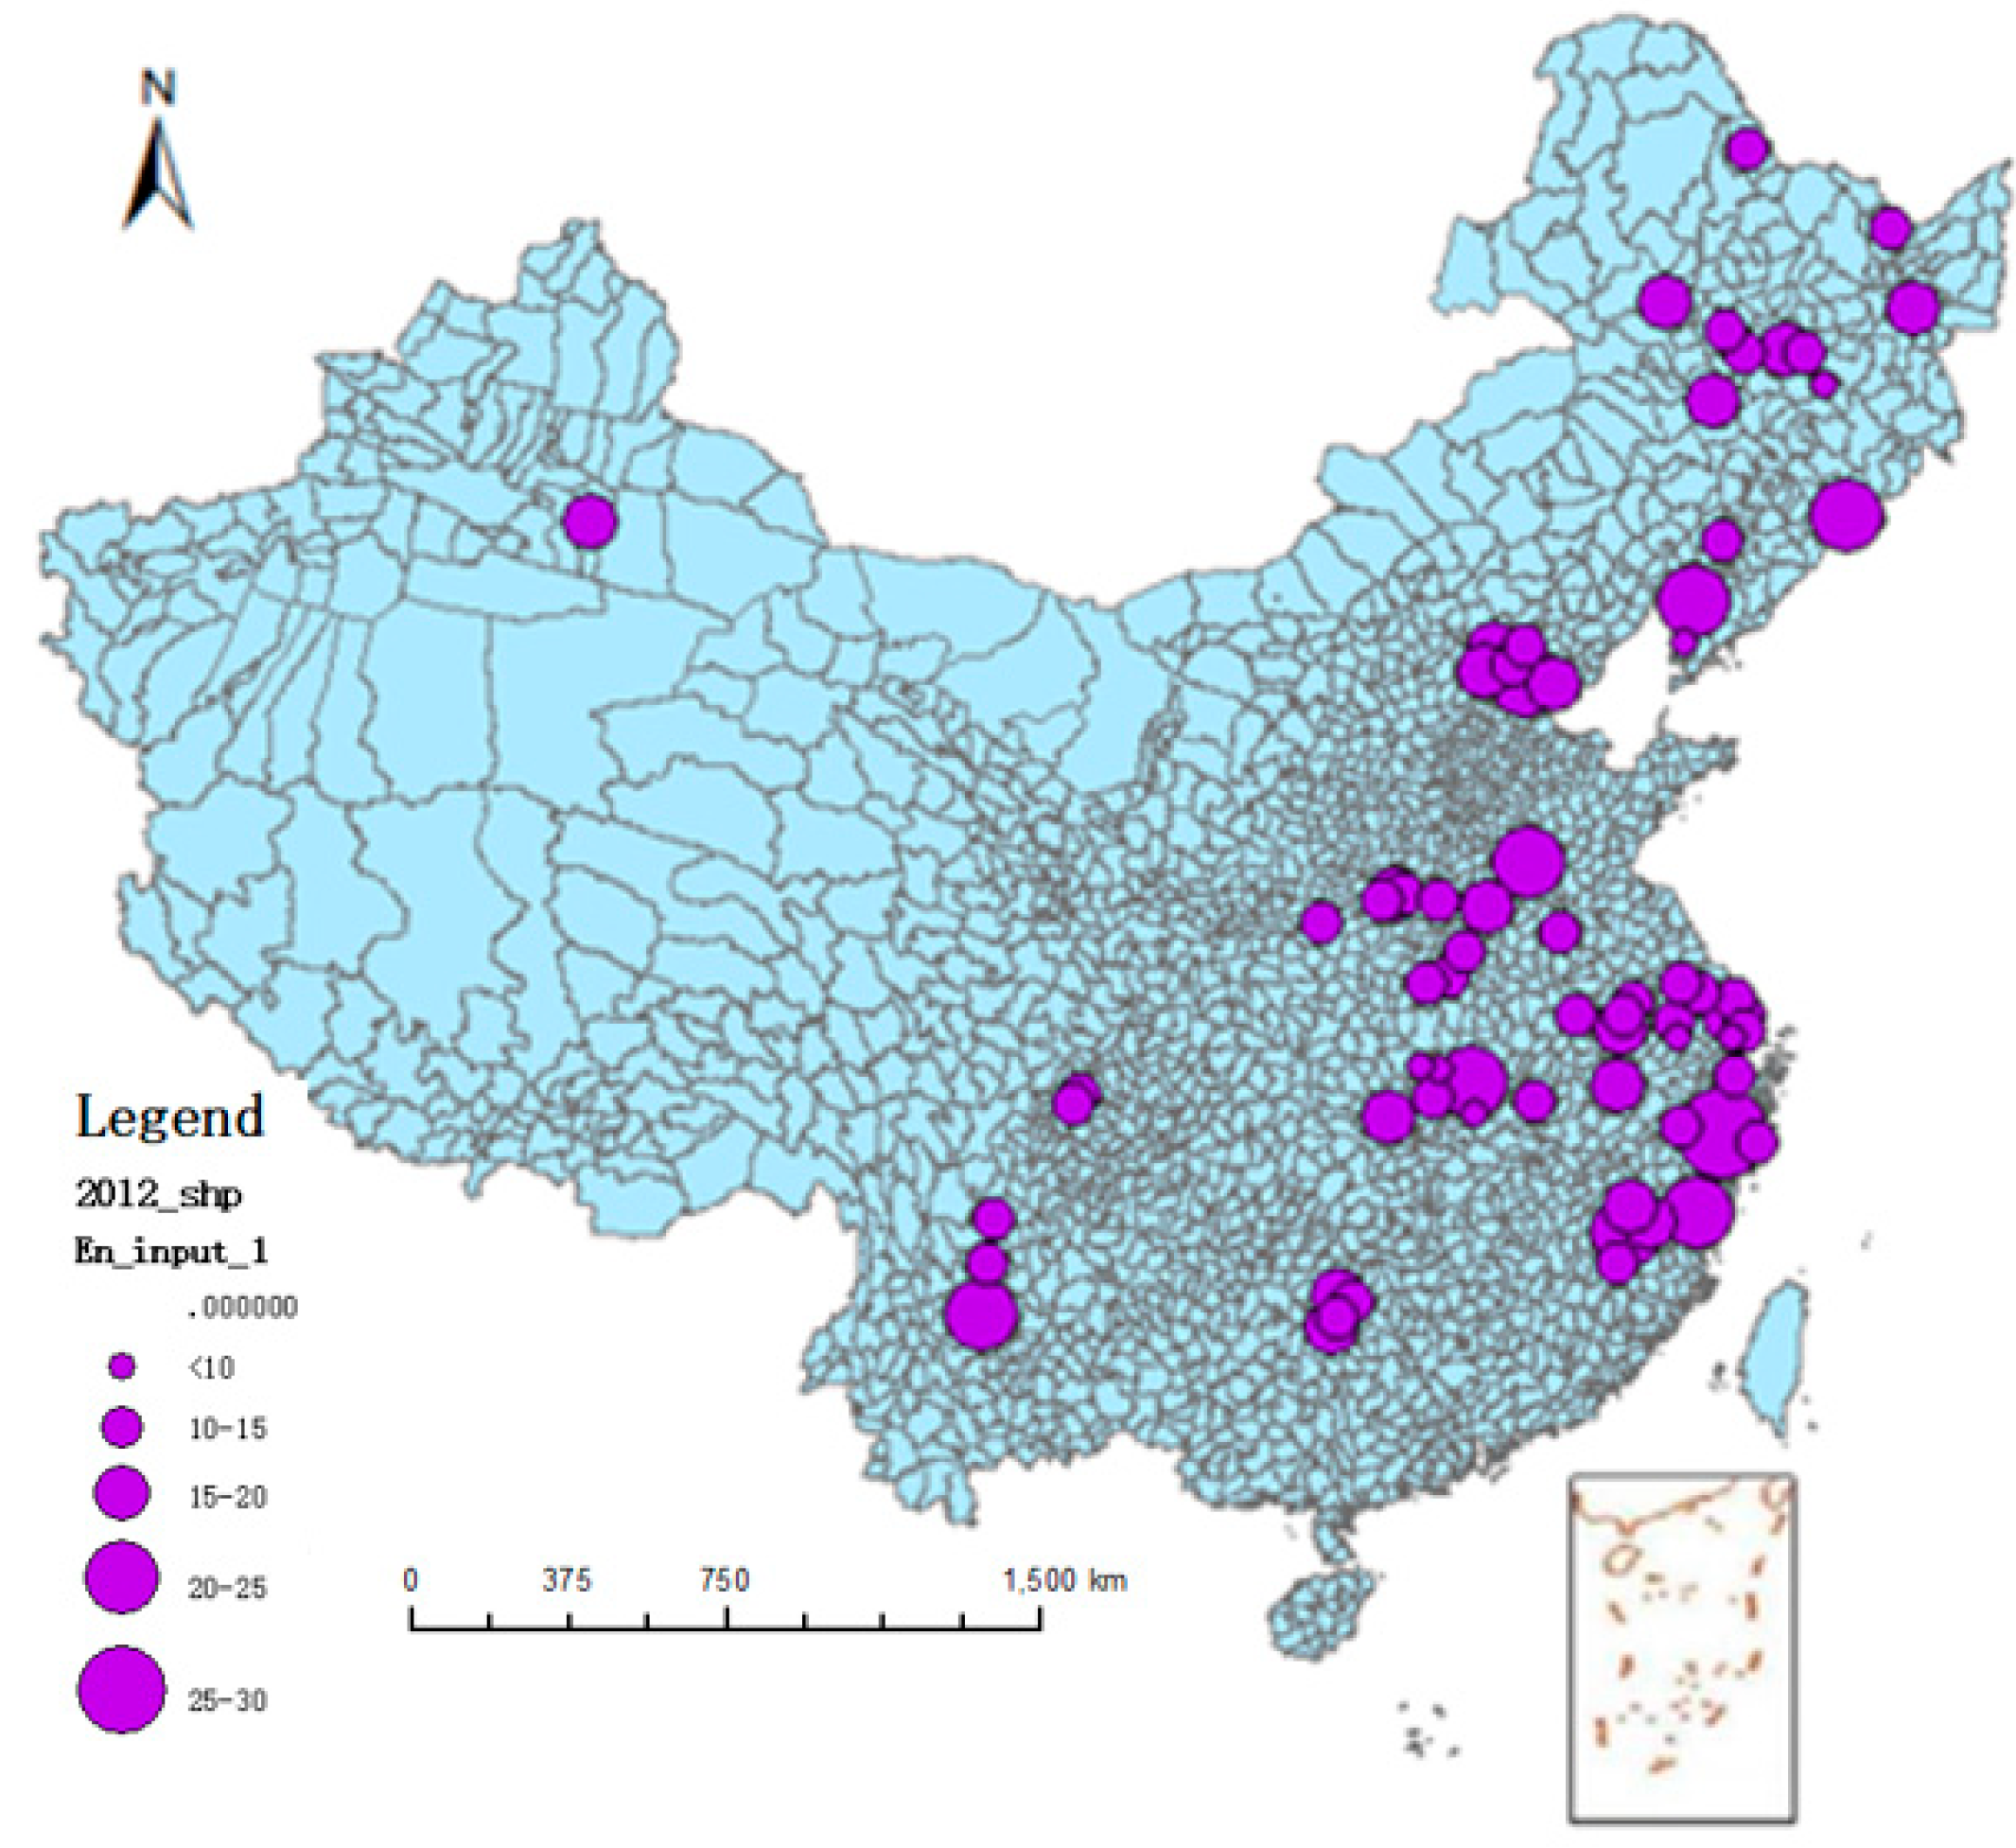
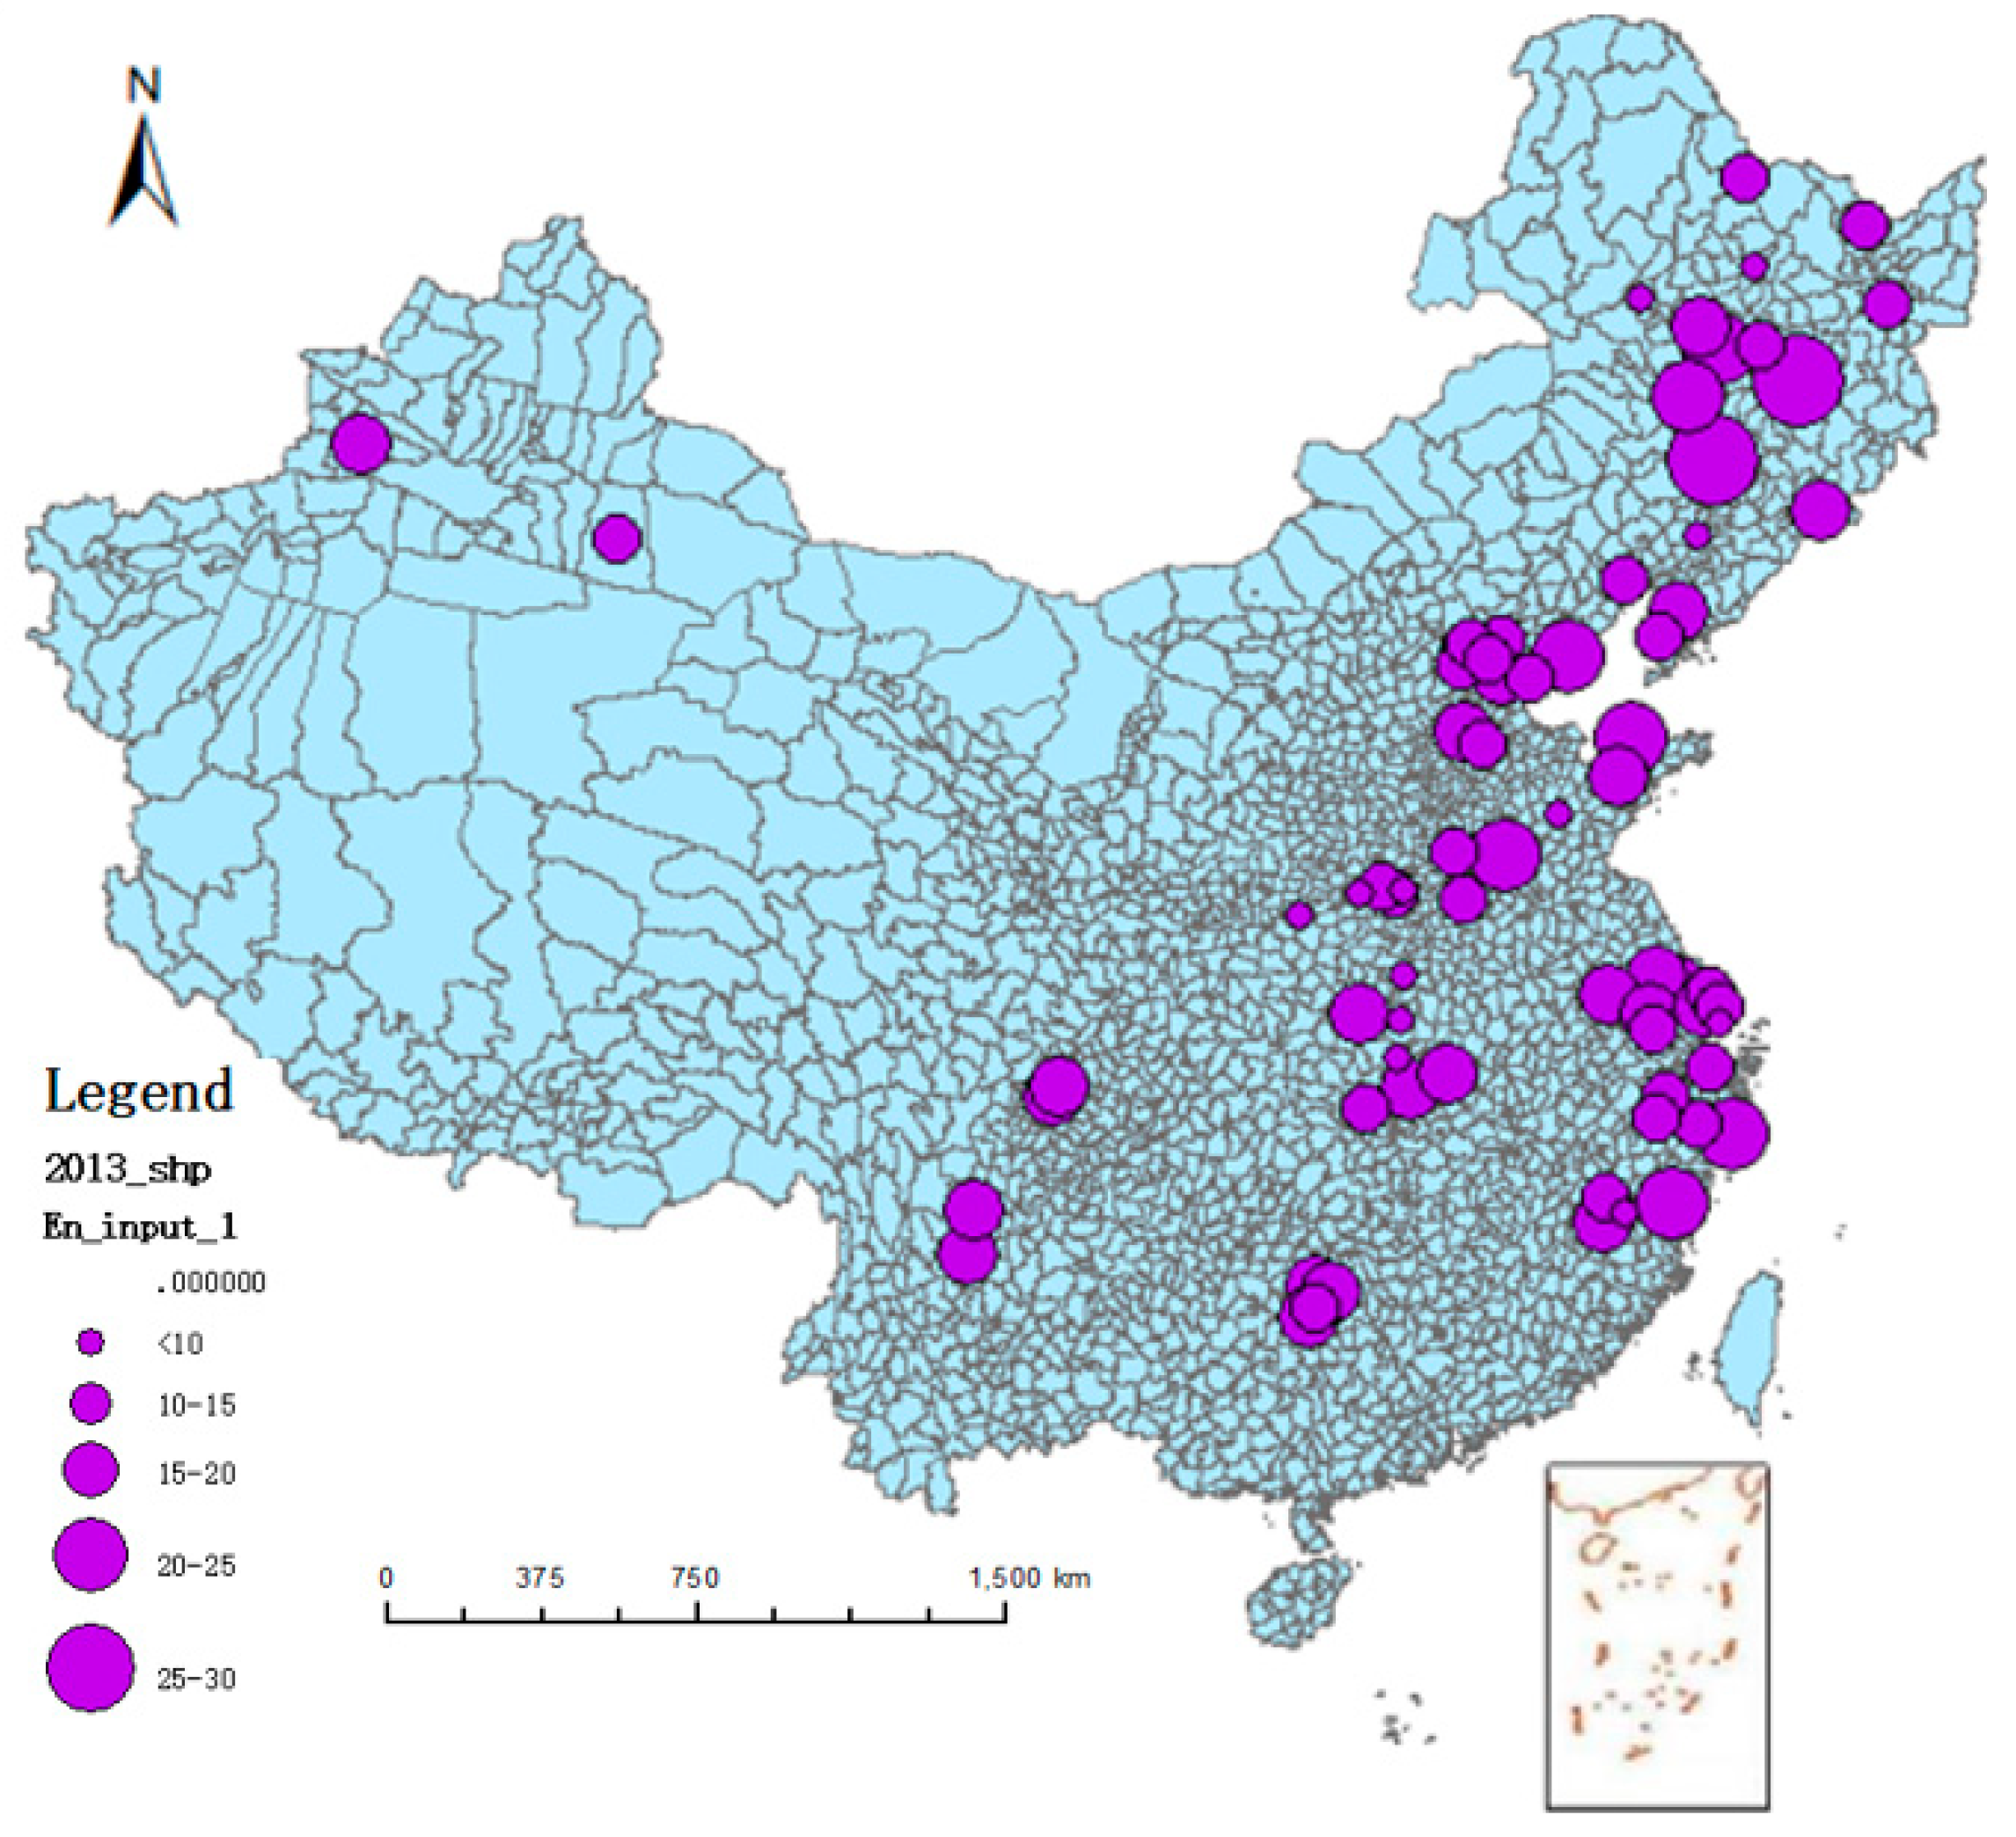
3.4. Spatial Variation of Energy Consumption
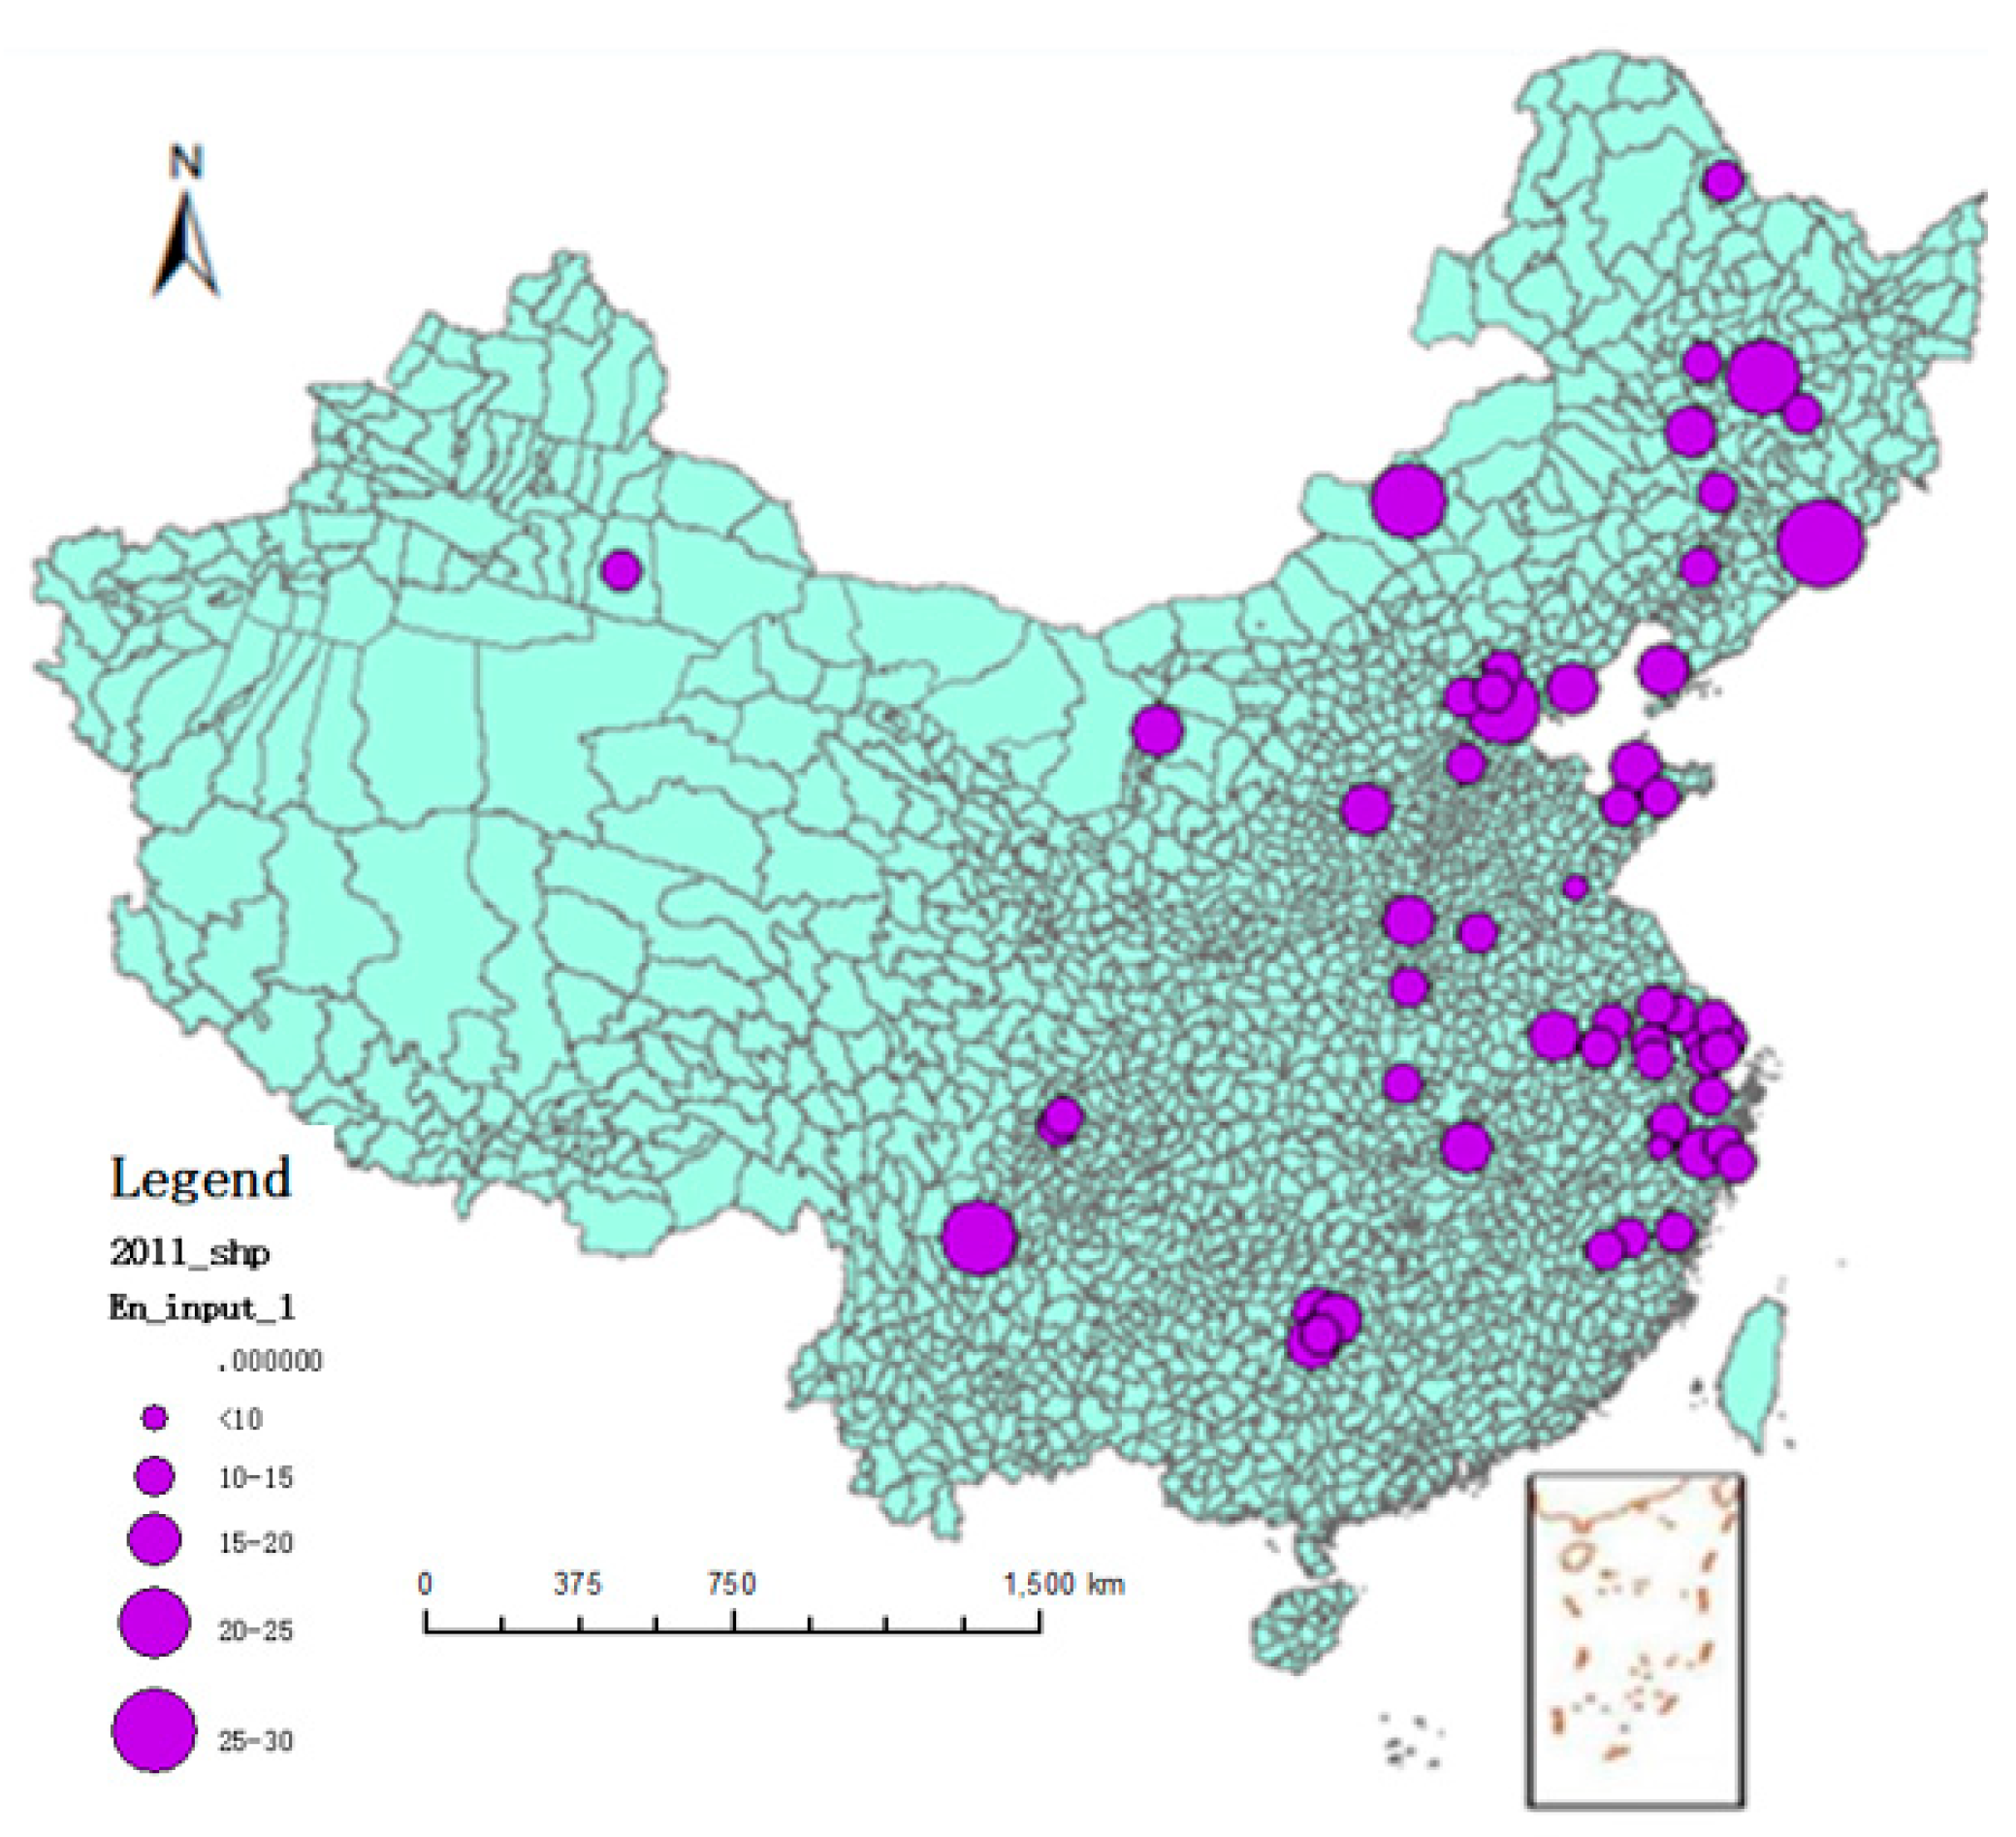
3.4.1. Spatial Distribution Characteristics of Energy Consumption
3.4.2. Global Spatial Correlation Analysis of Energy Consumption
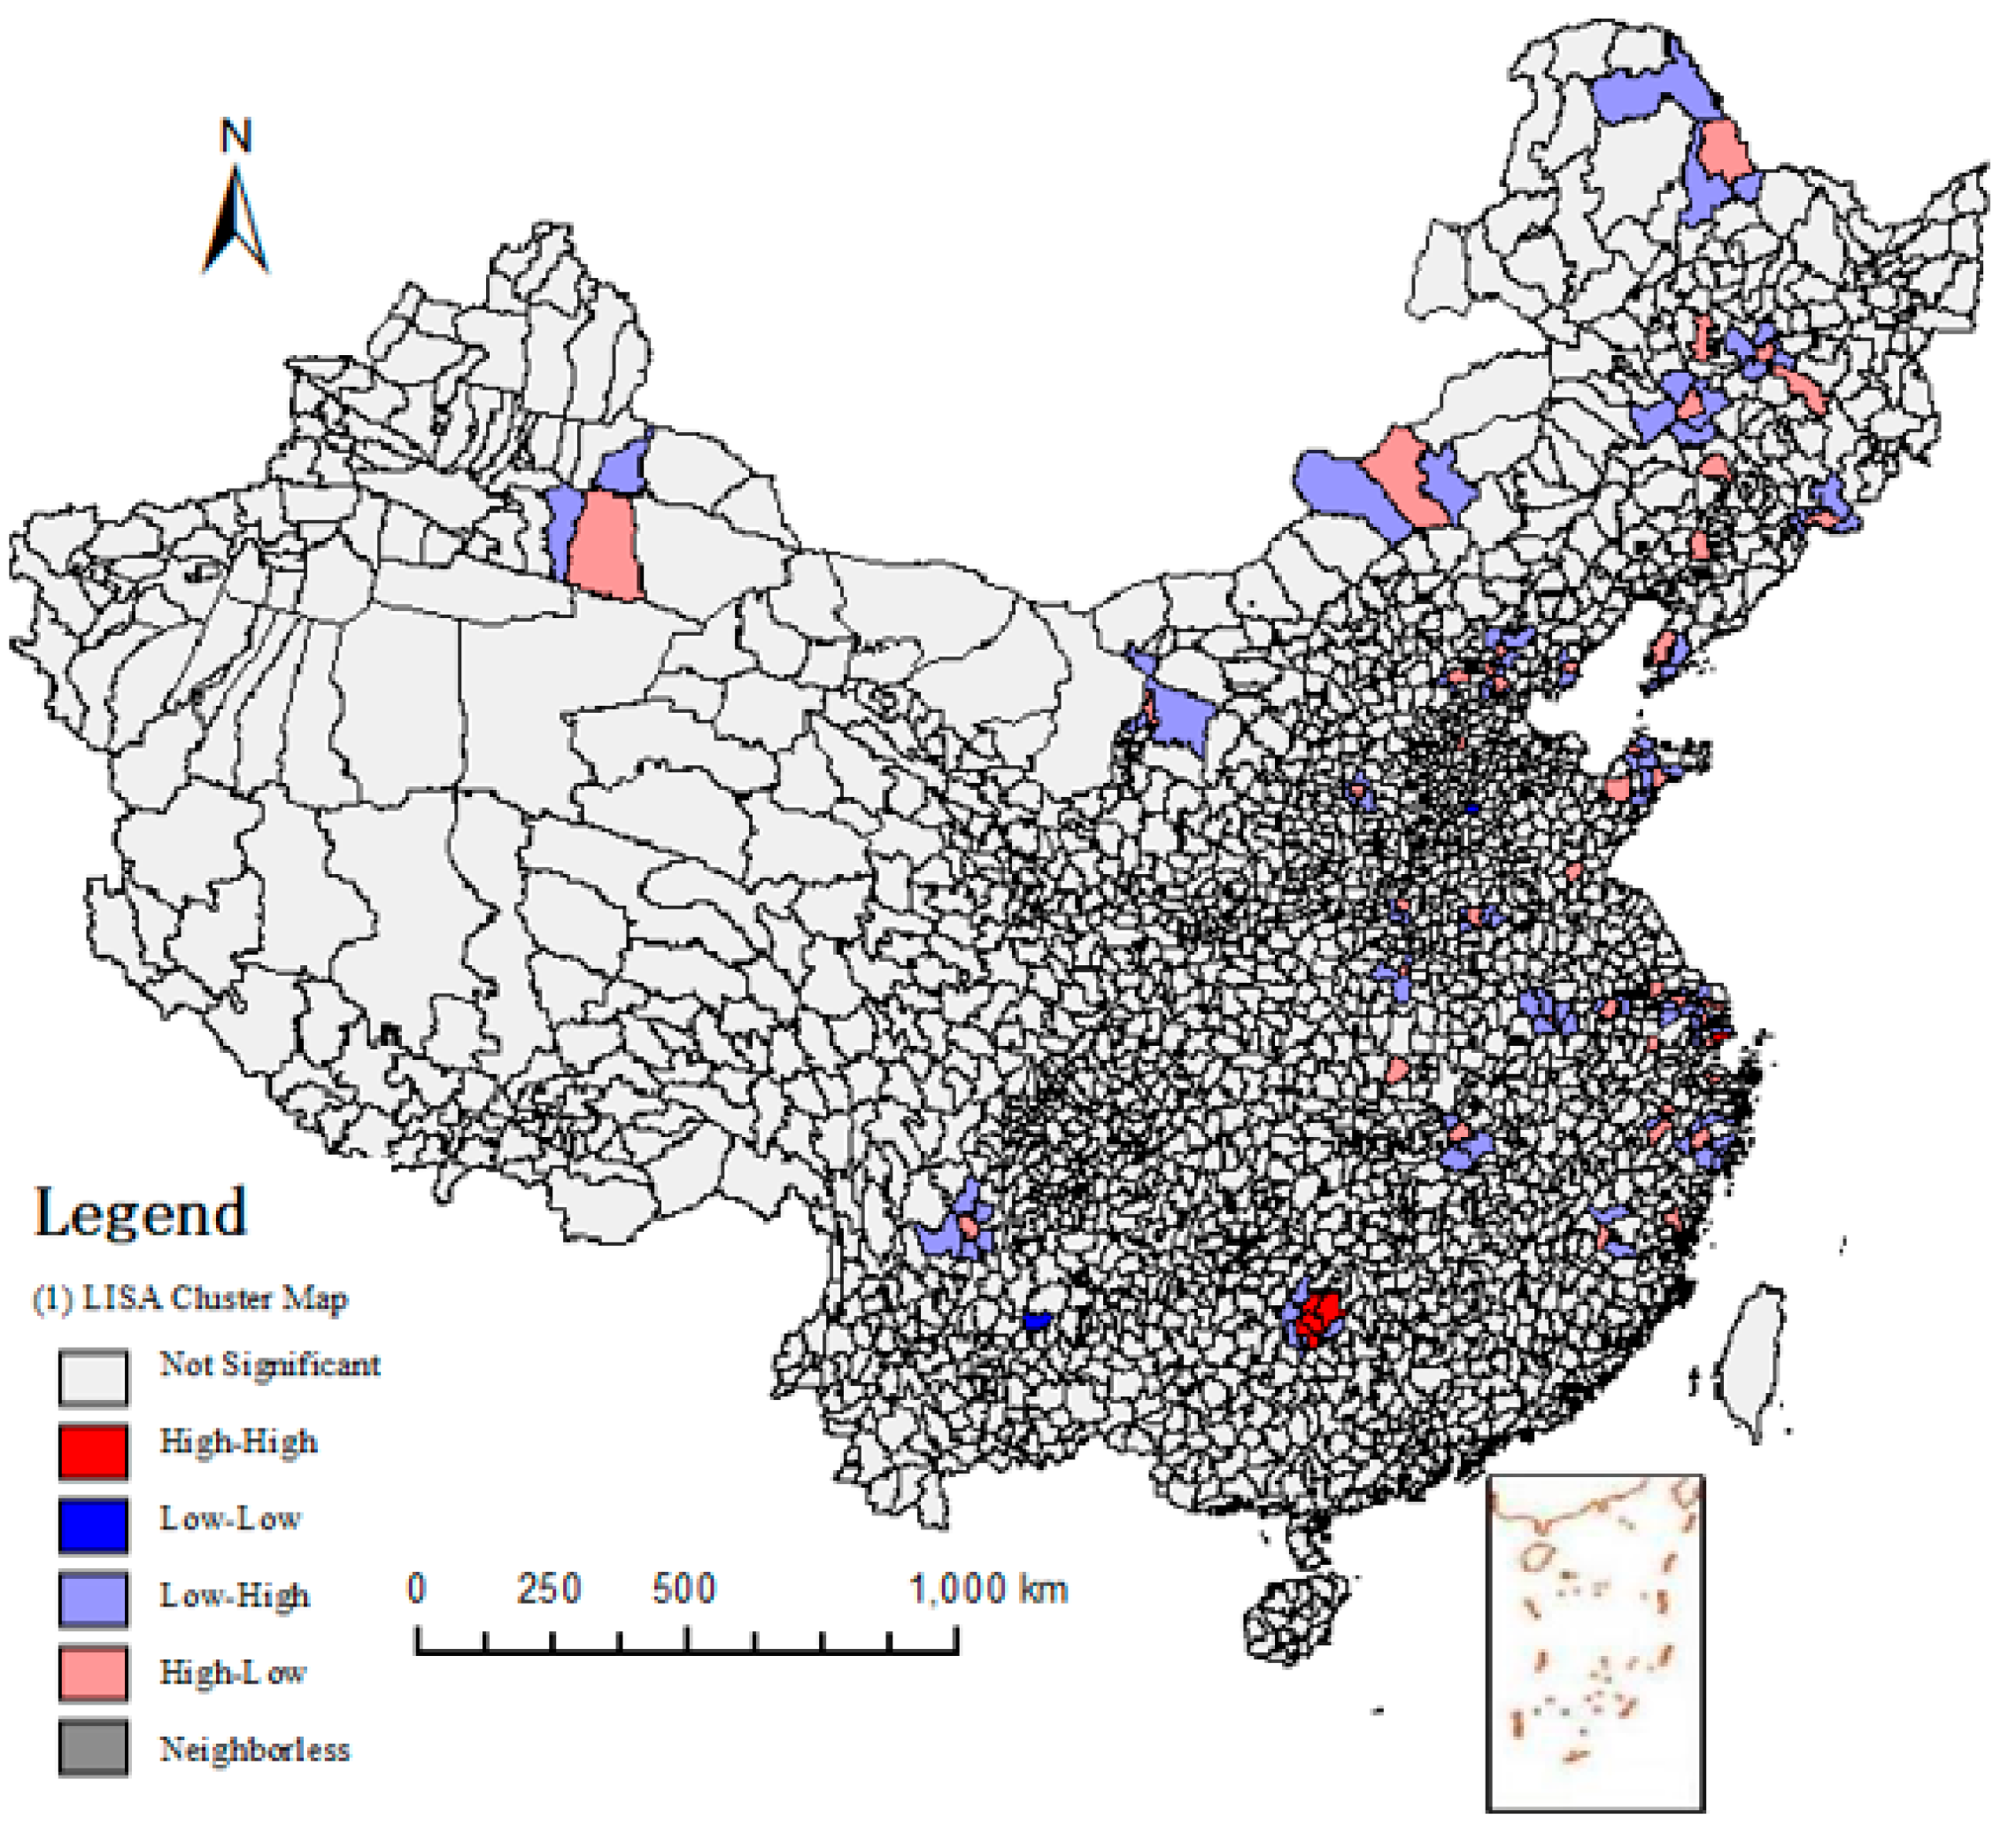
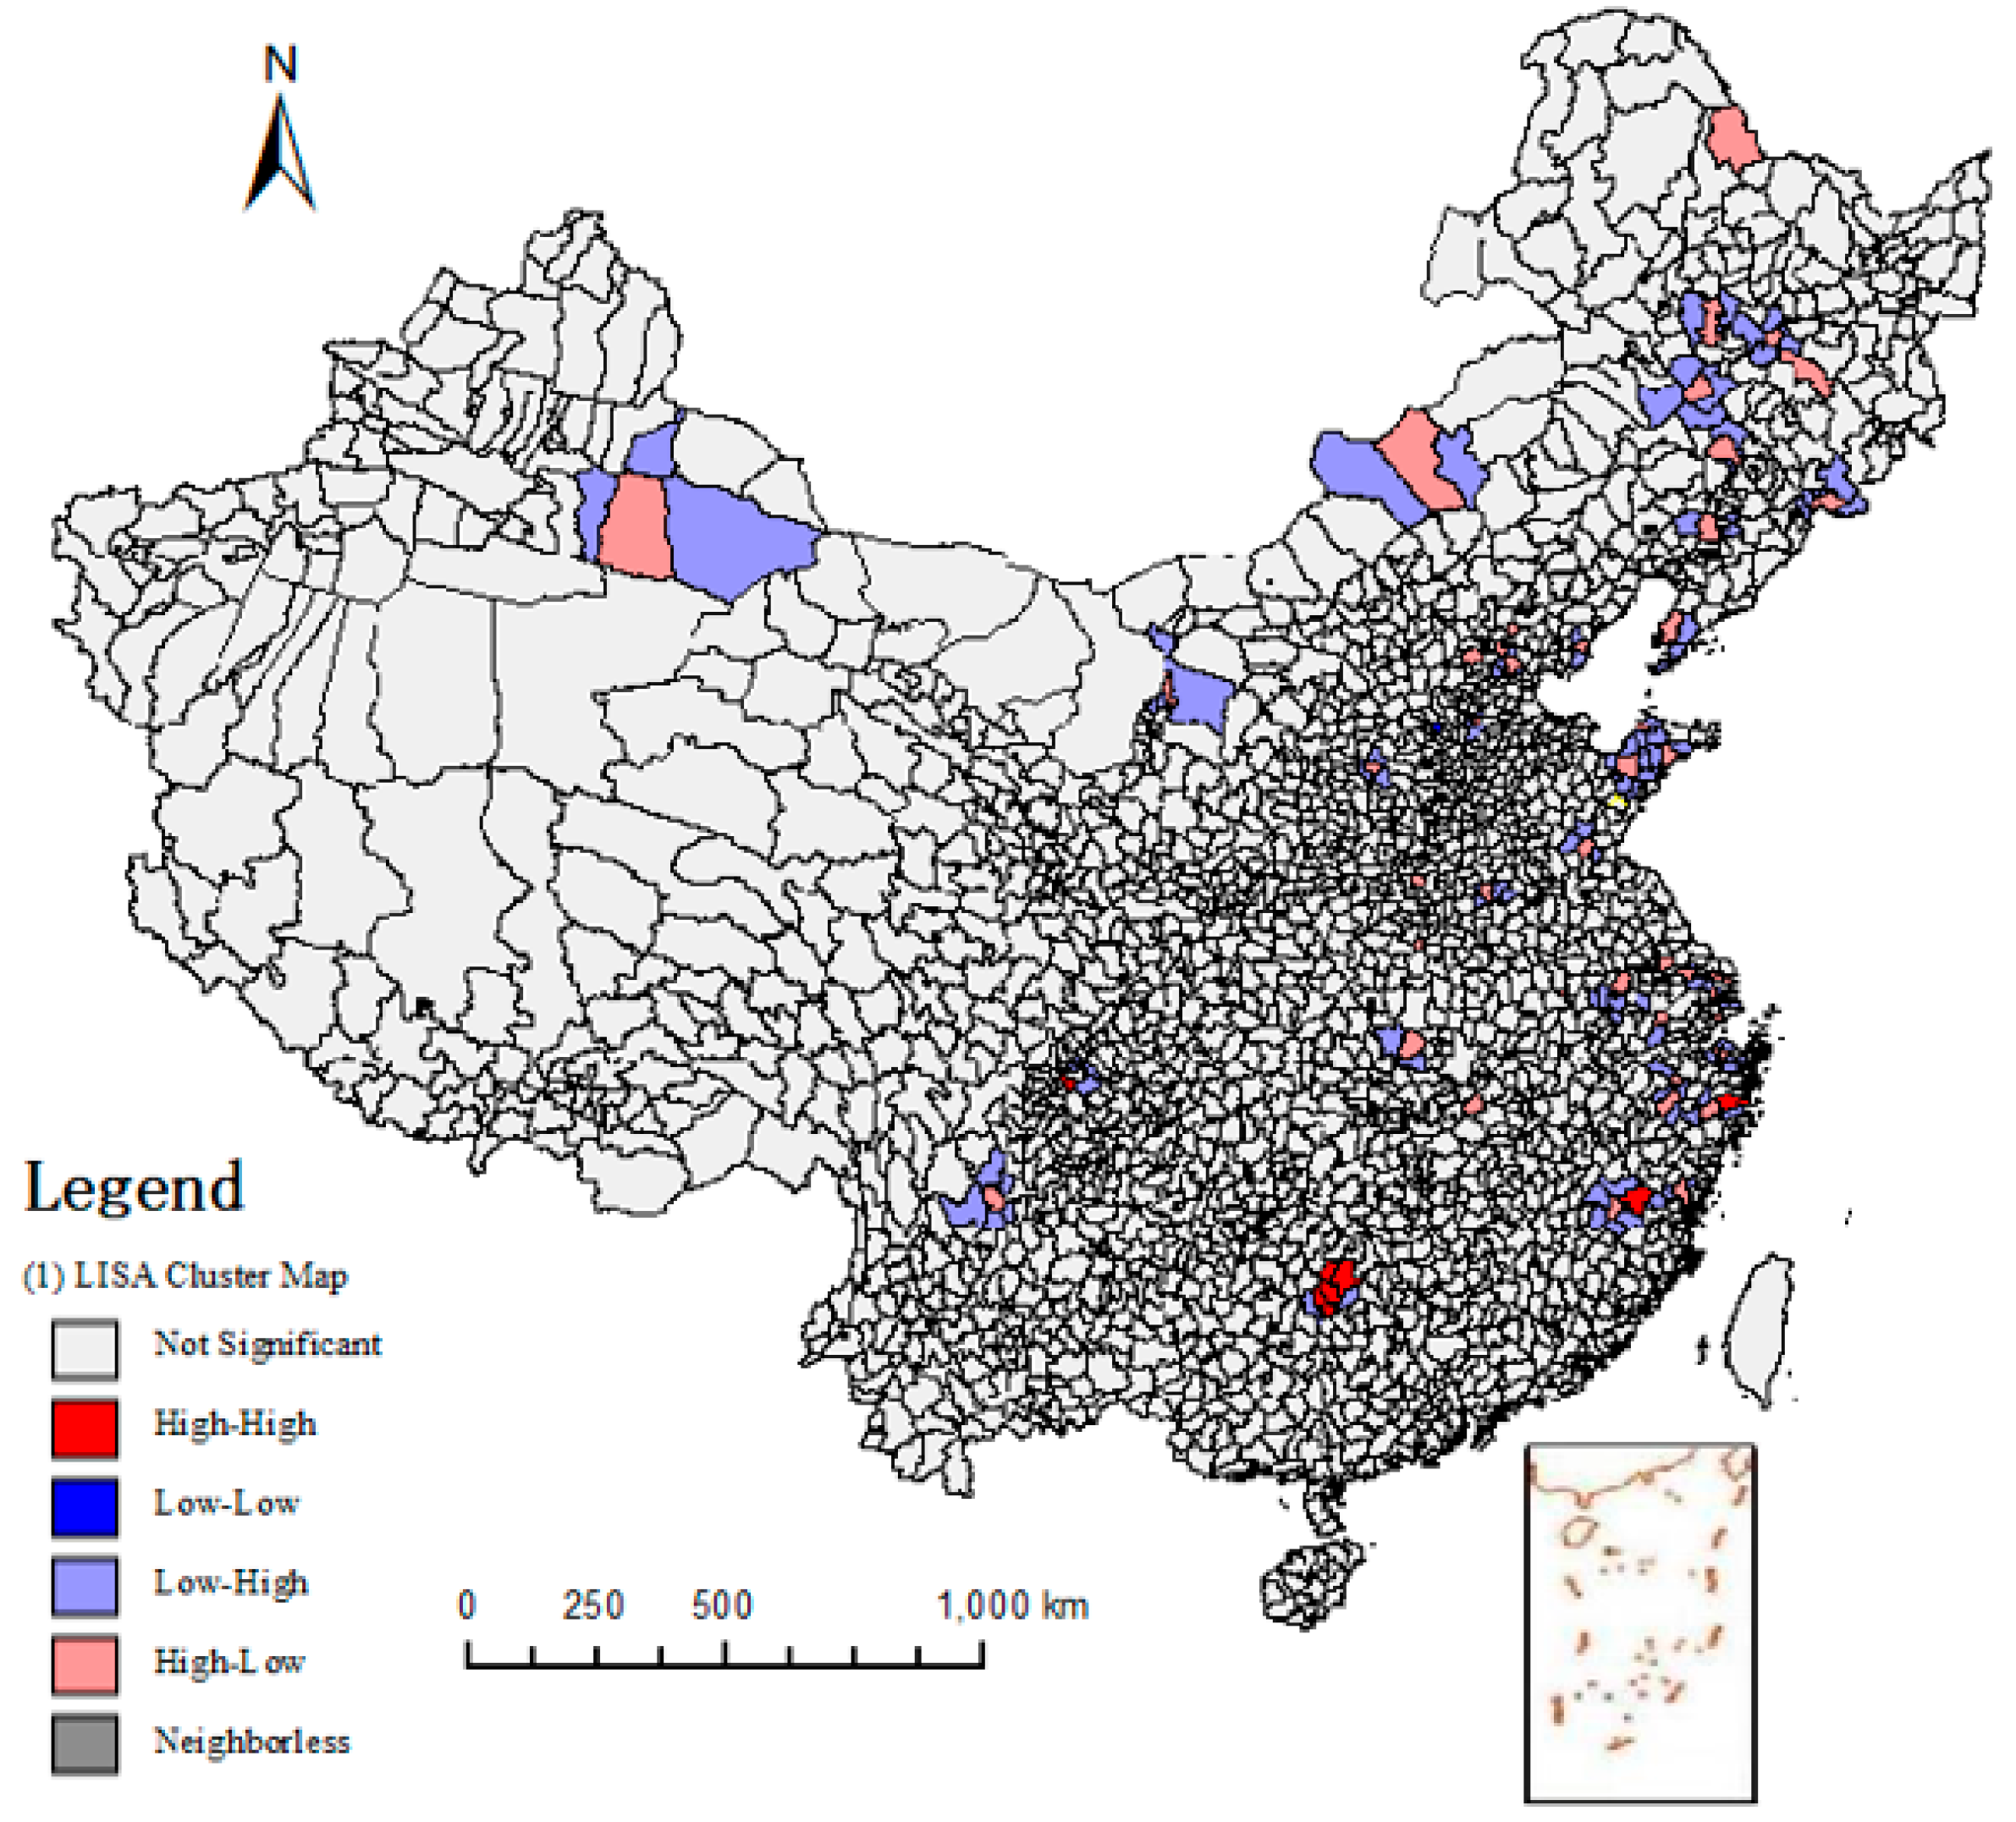
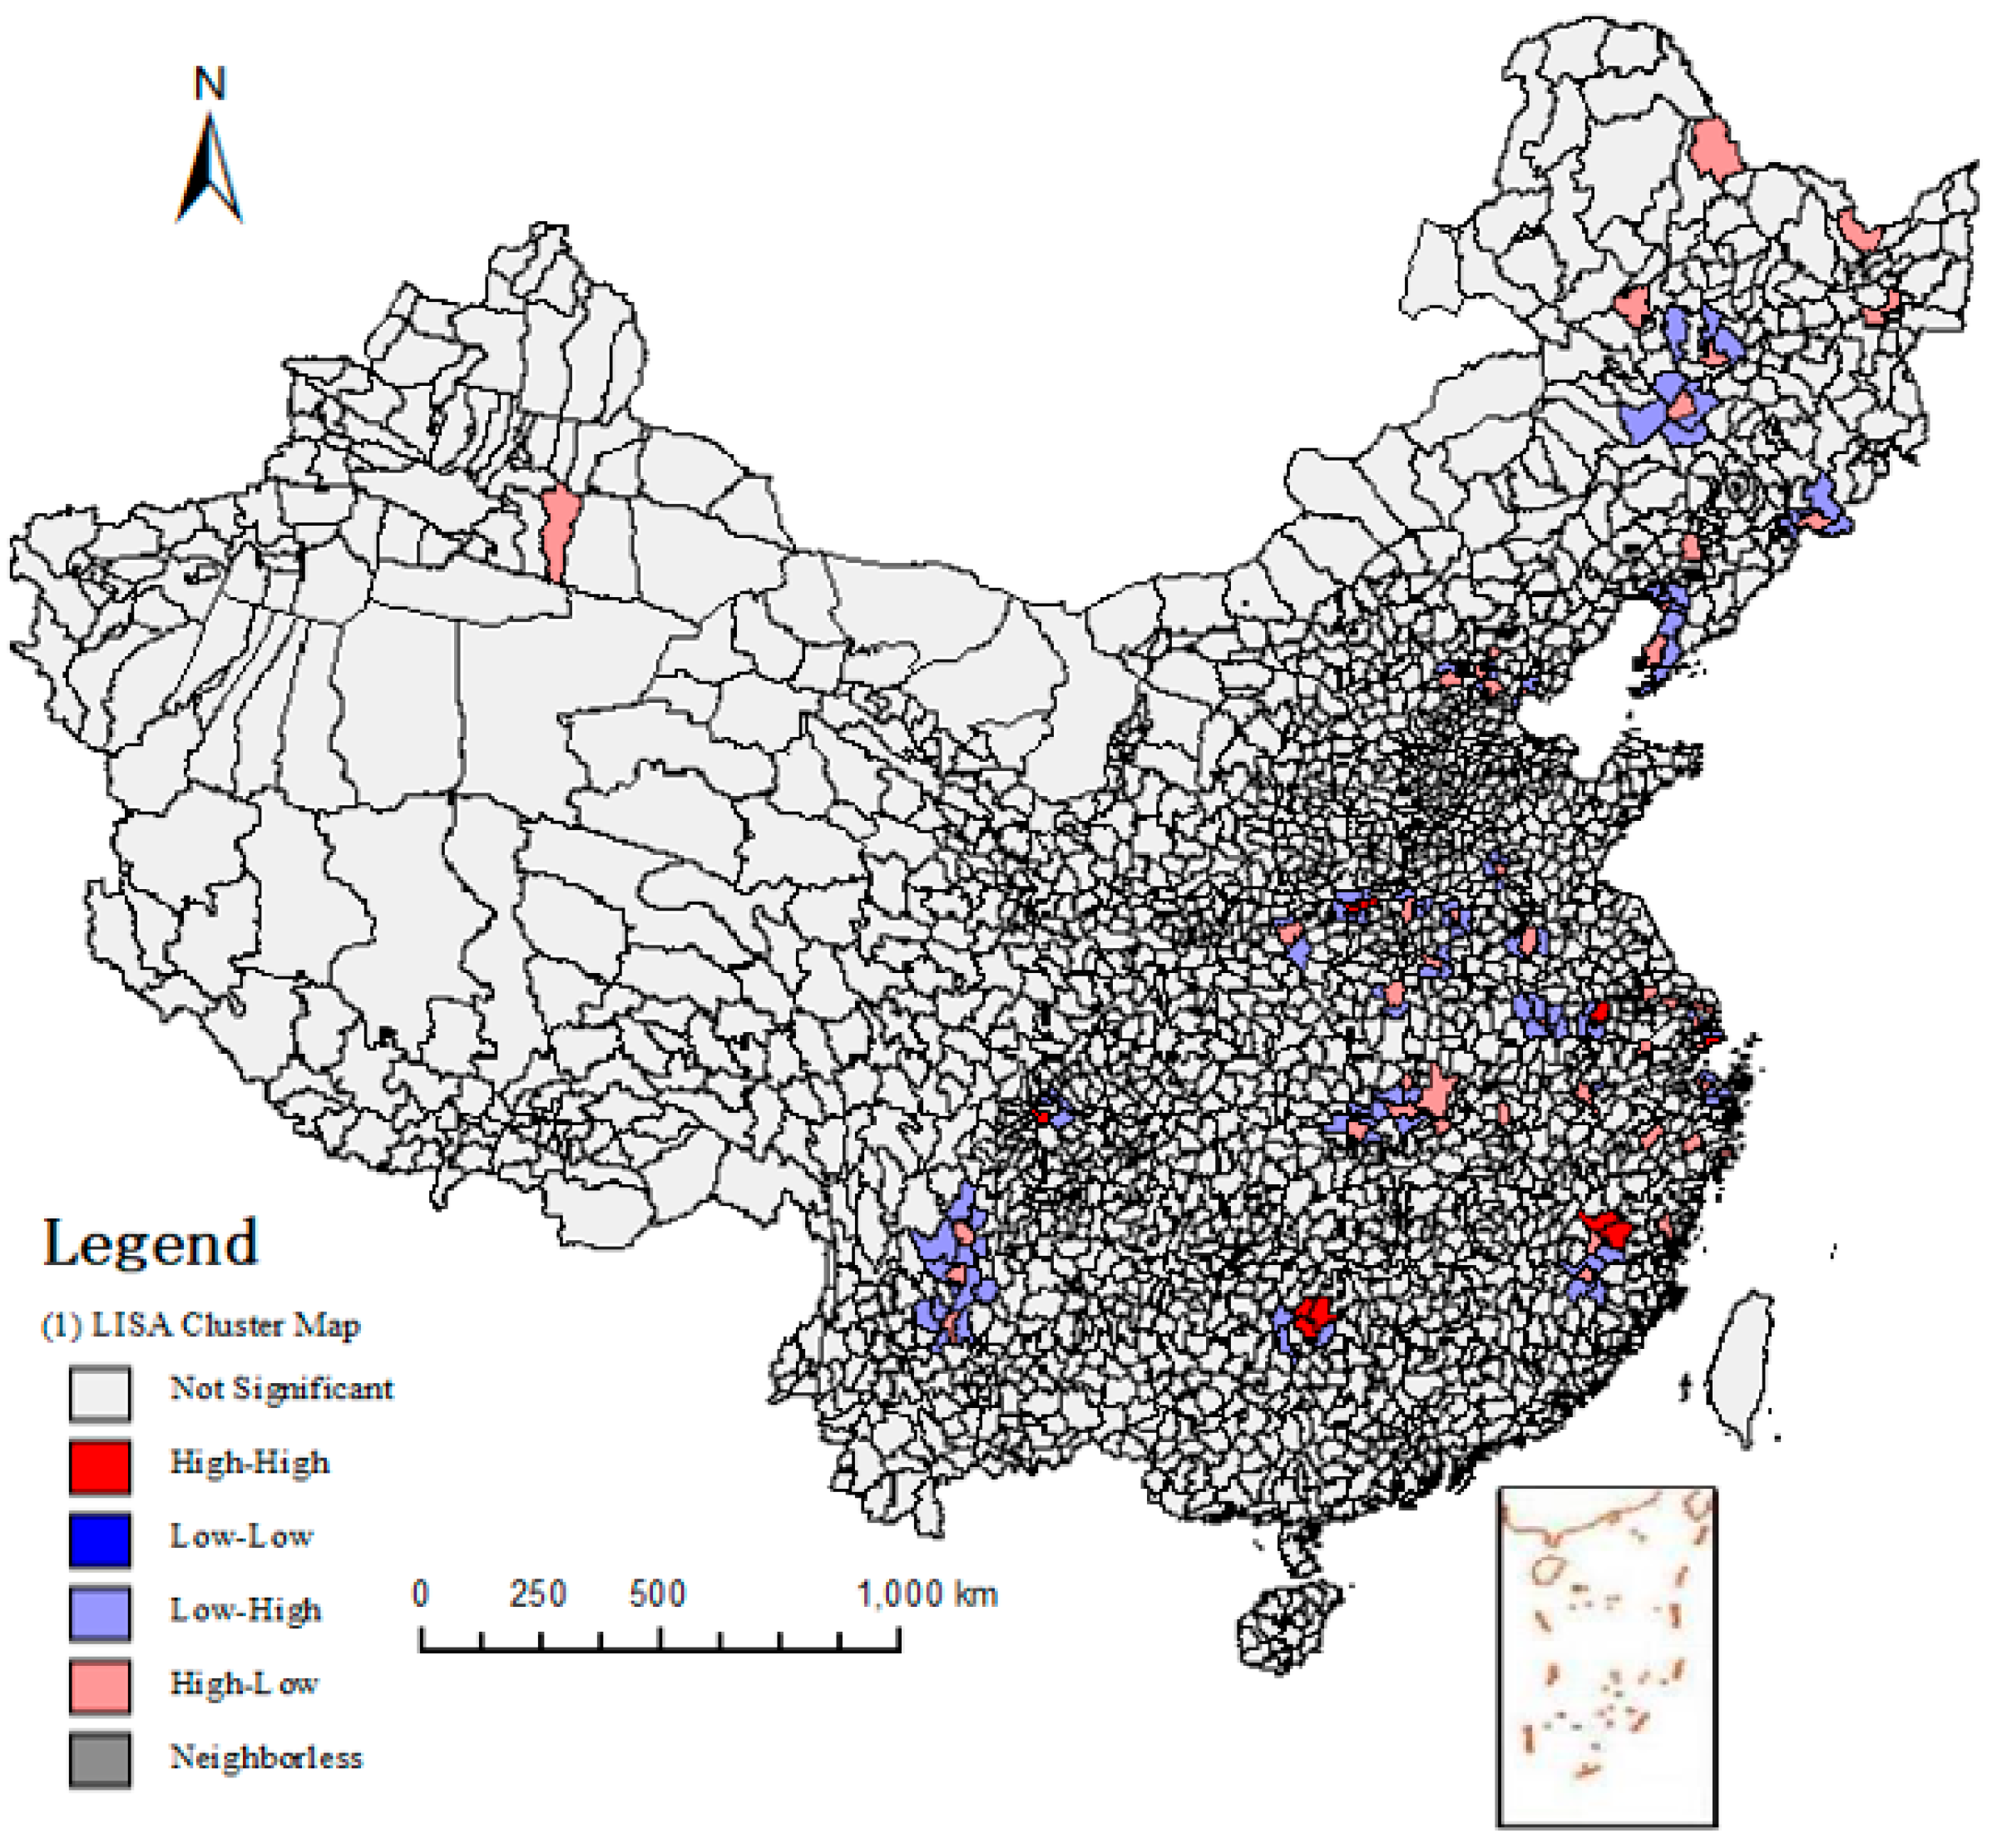
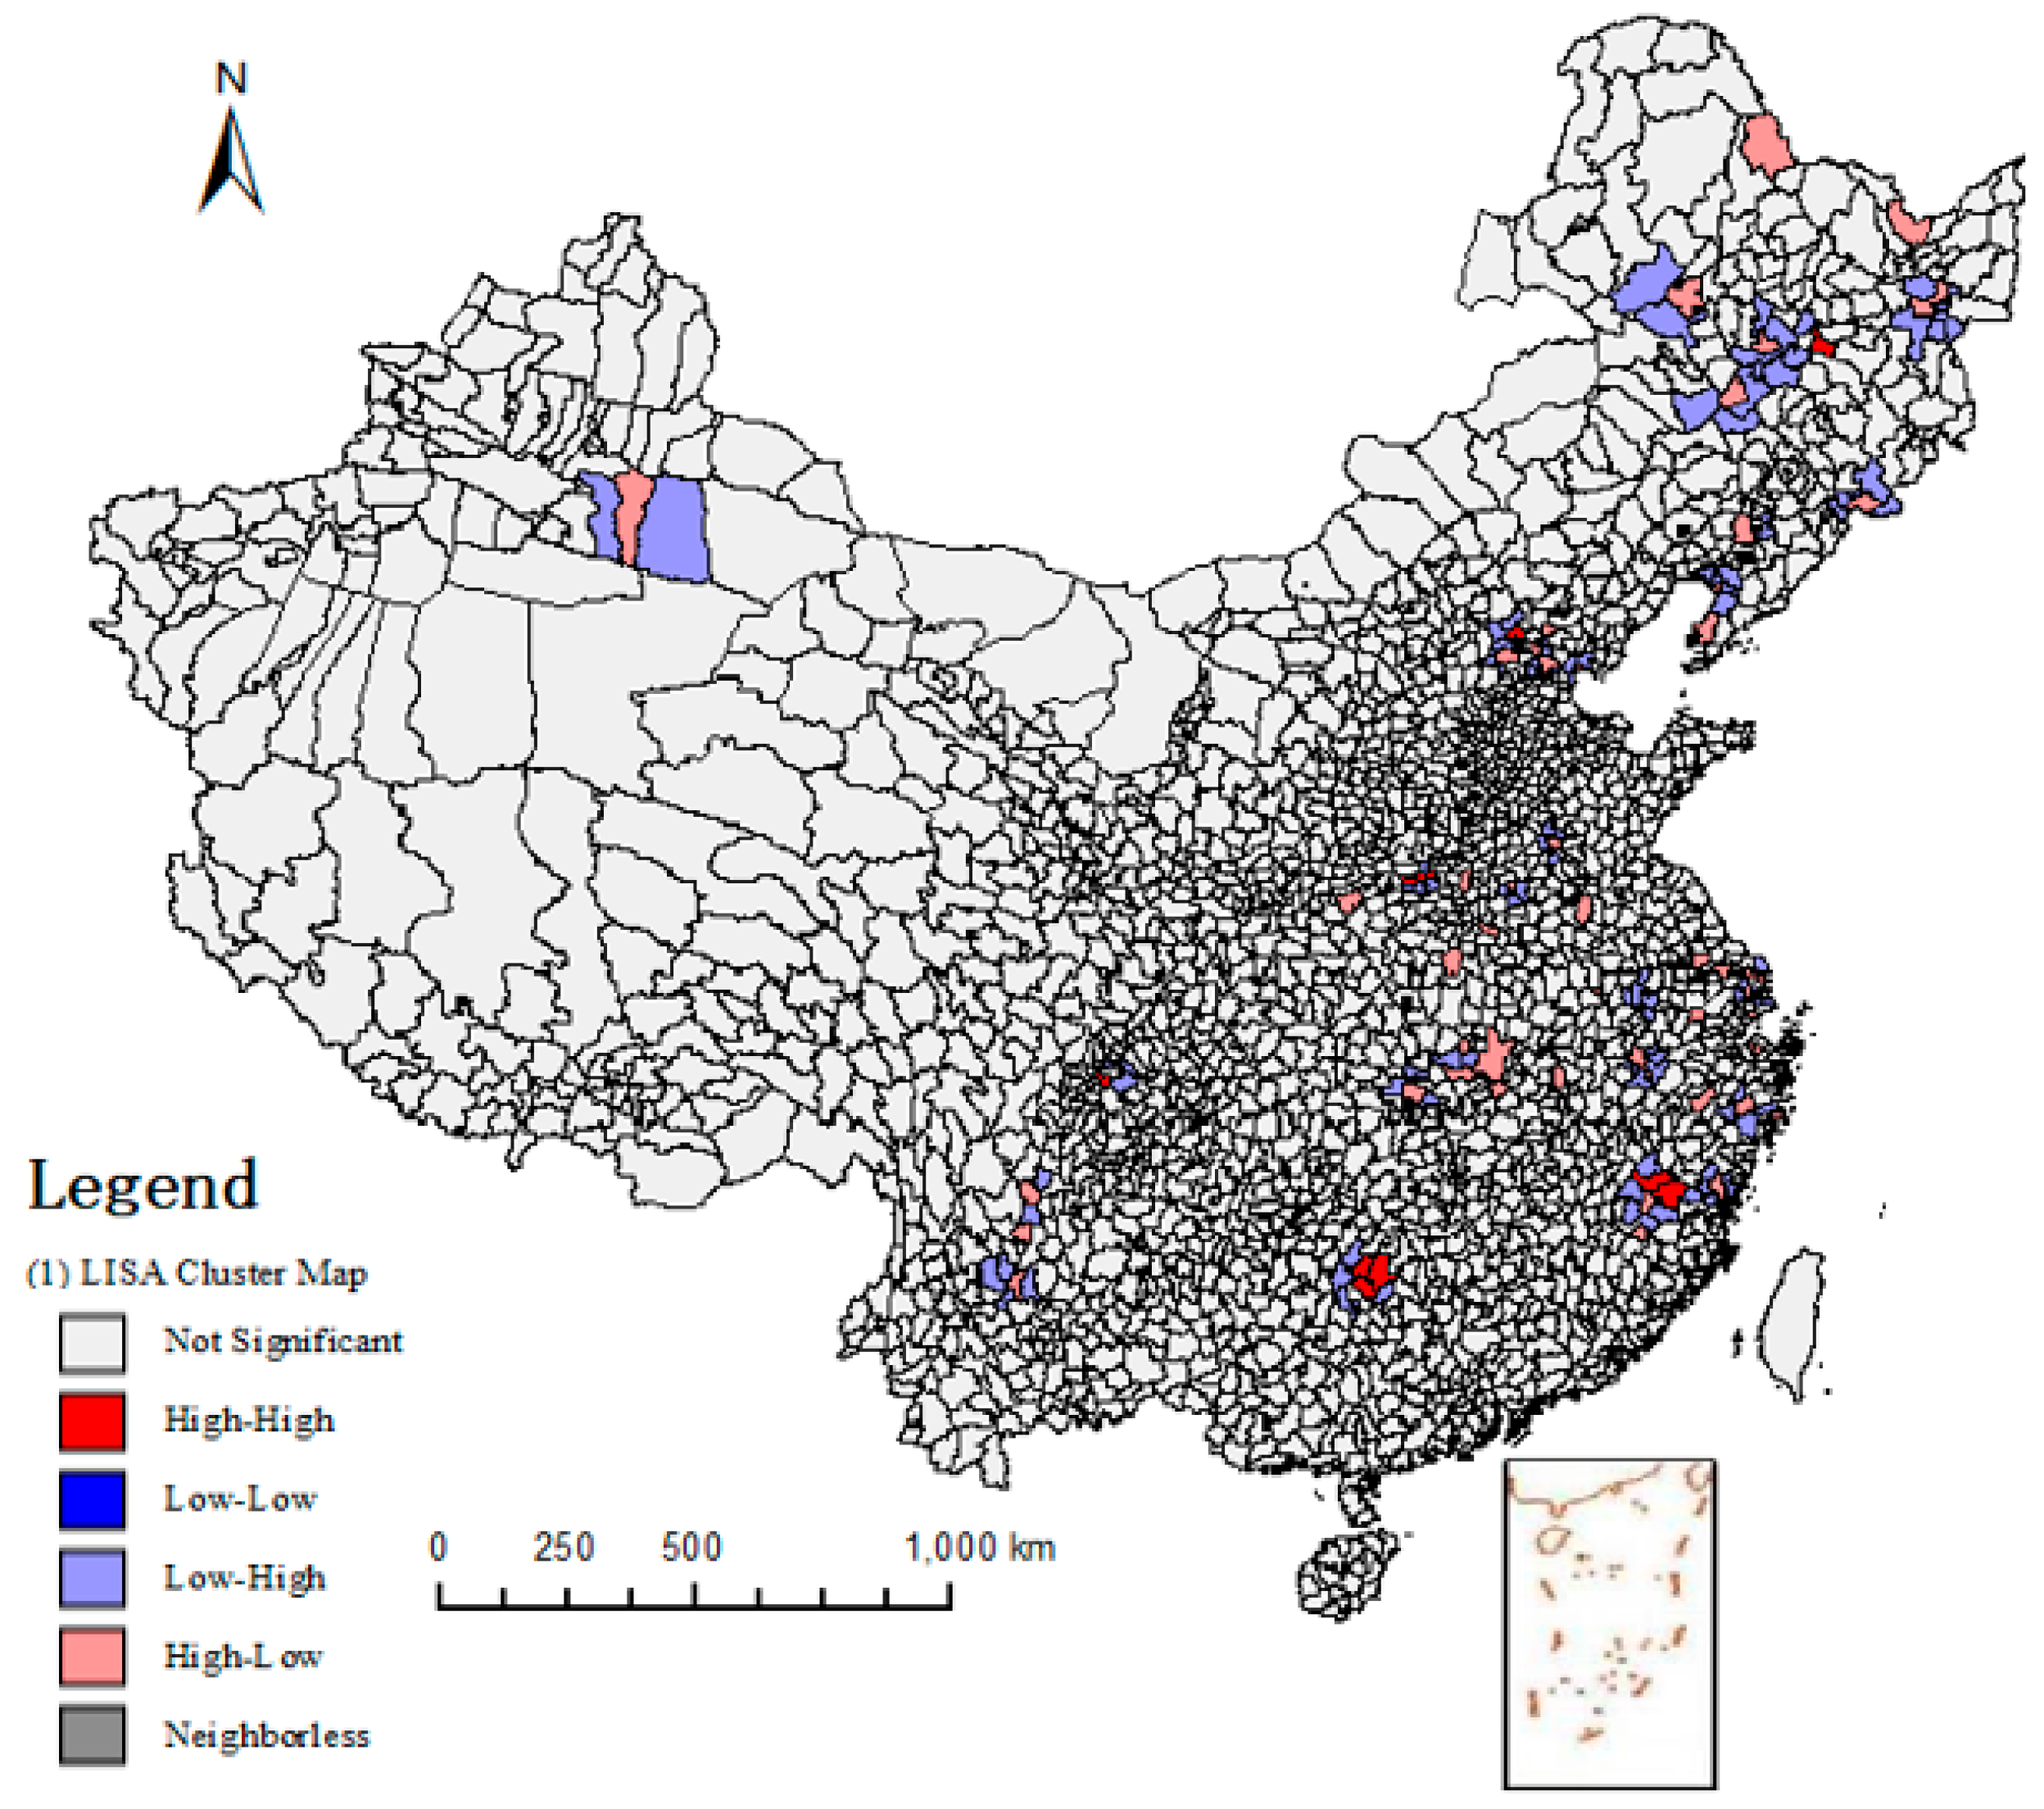
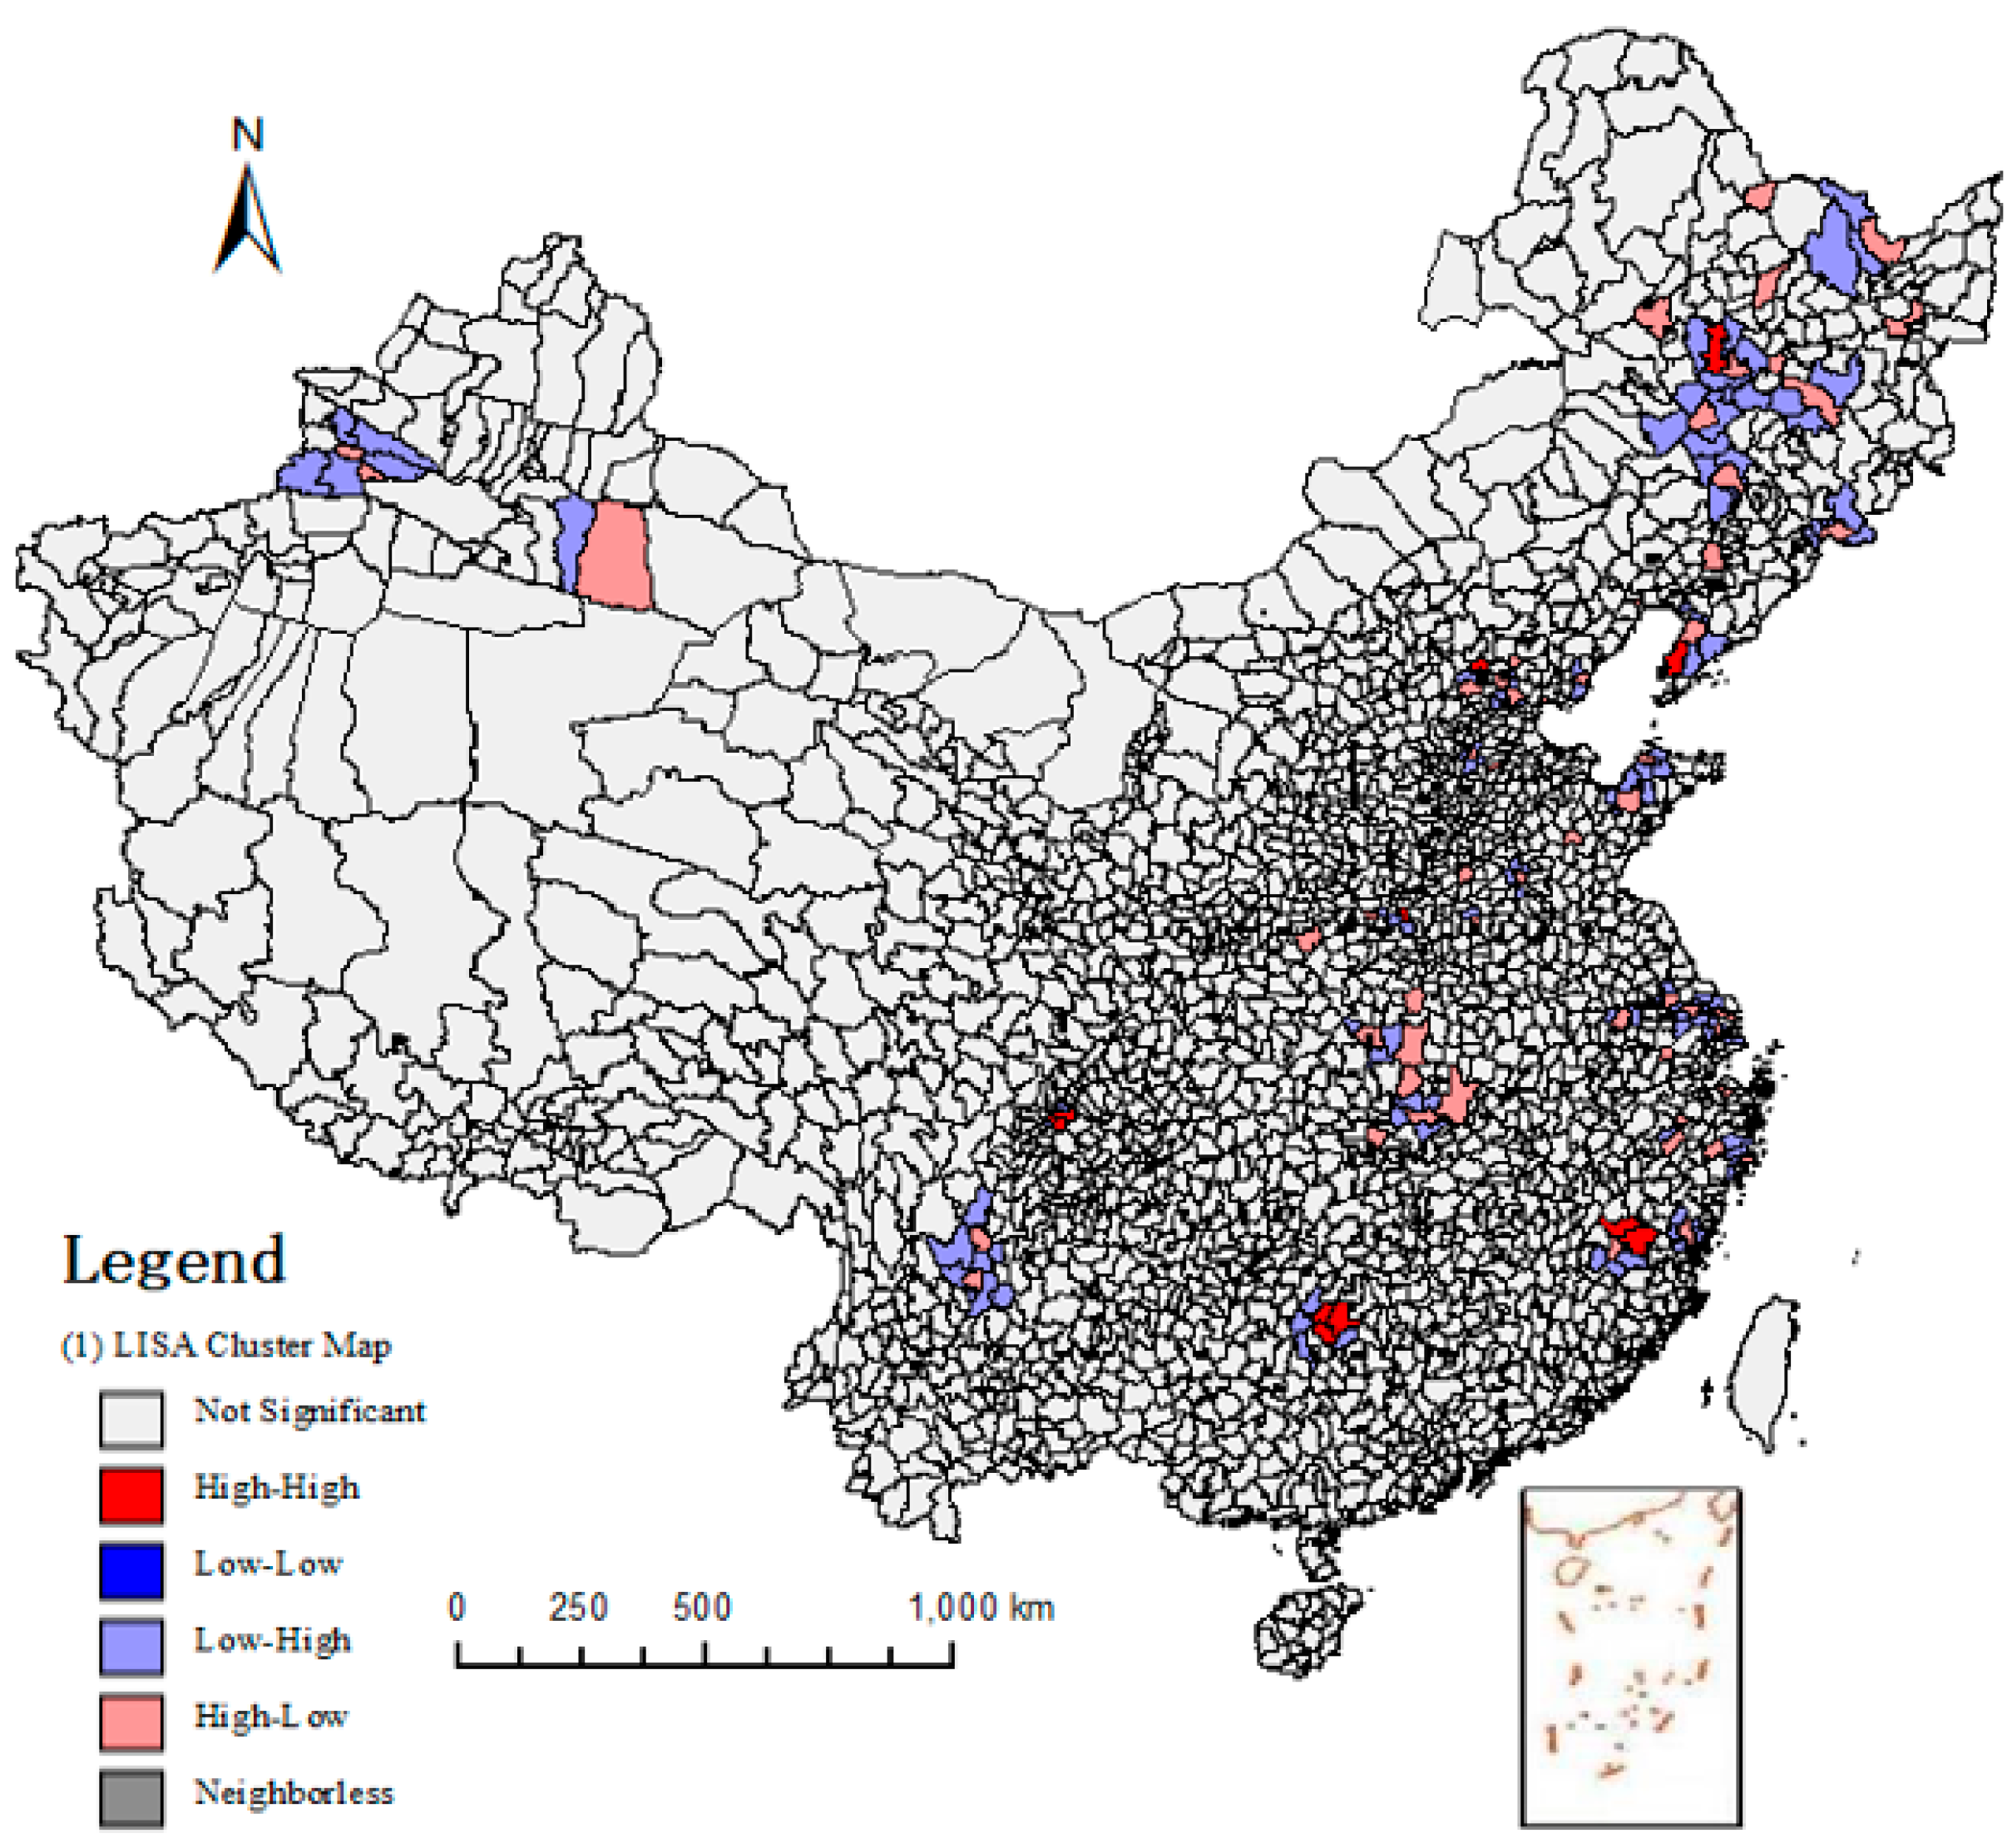
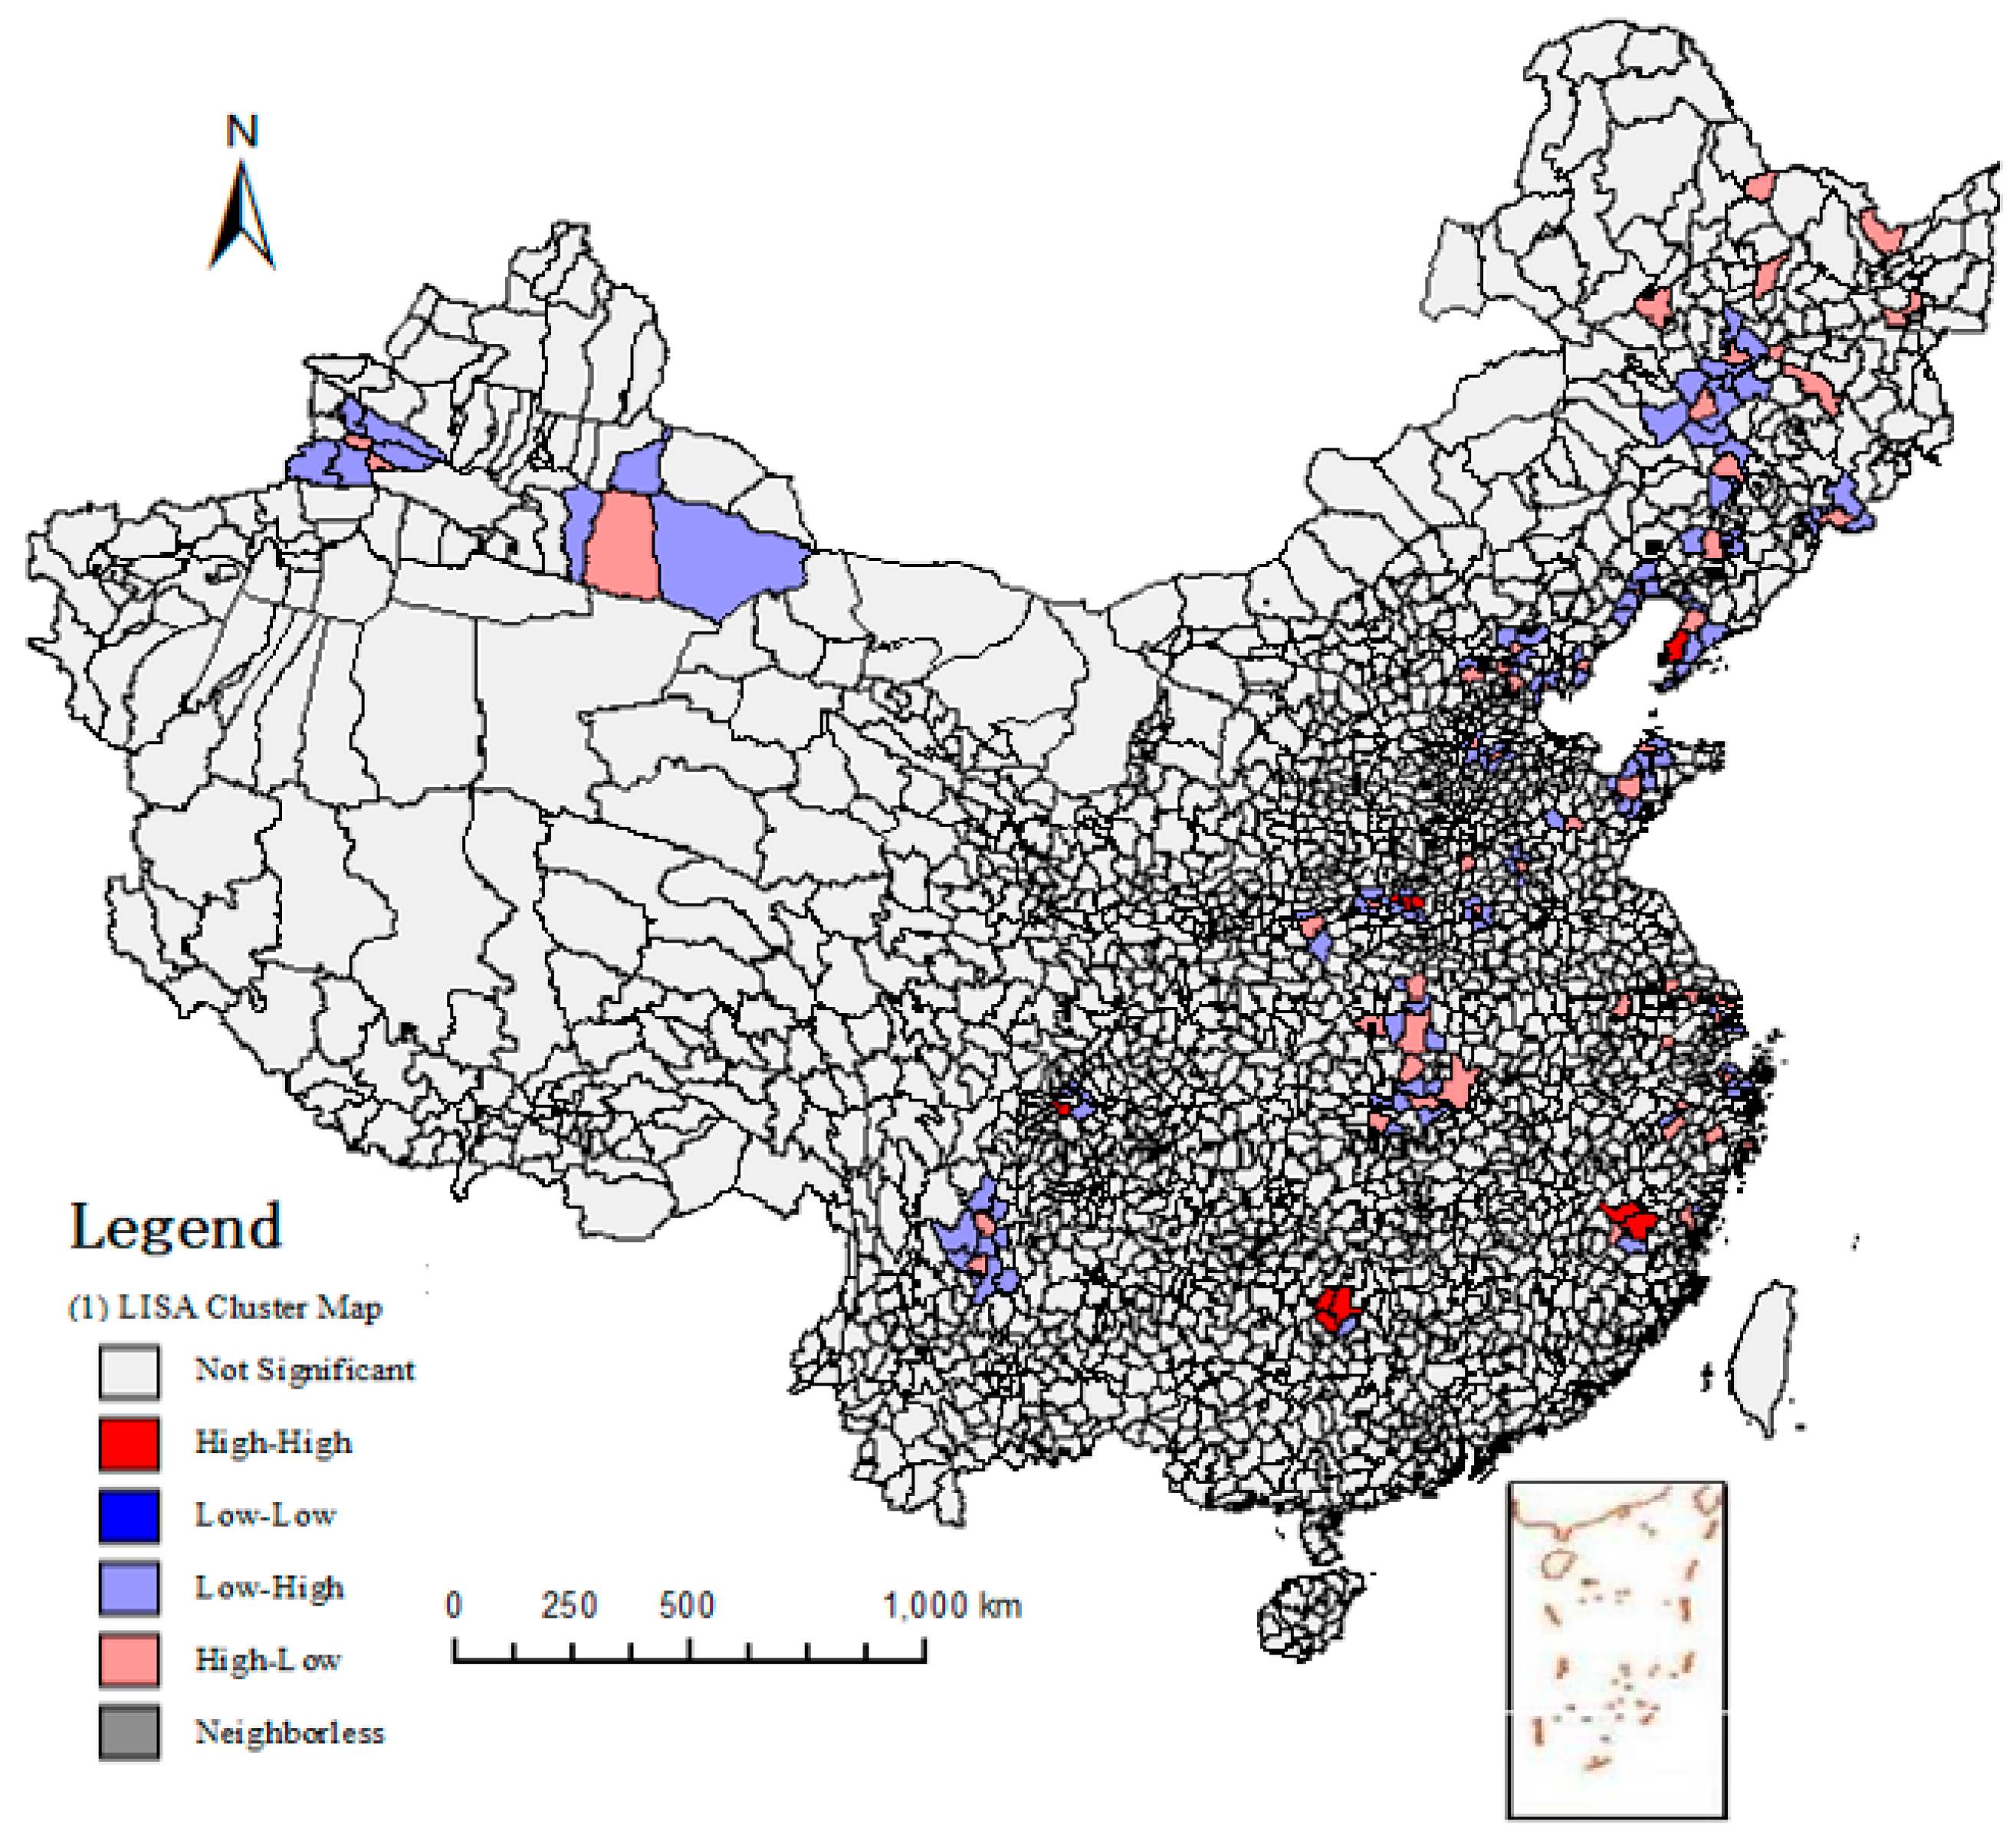
3.4.3. Local Spatial Autocorrelation Analysis of Energy Consumption
4. Conclusions
Author Contributions
Funding
Conflicts of Interest
References
- Heidari, M.D.; Omid, M.; Mohammadi, A. Measuring productive efficiency of horticultural greenhouses in Iran: A data envelopment analysis approach. Expert Syst. Appl. 2012, 39, 1040–1045. [Google Scholar] [CrossRef]
- Islam, F.; Shahbaz, M.; Ahmed, A.U.; Alam, M.M. Financial development and energy consumption nexus in Malaysia: A multivariate time series analysis. Econ. Model. 2013, 30, 435–441. [Google Scholar] [CrossRef]
- Feng, J. Evaluation on the Technical Benefits of the Protected Grape Cultivation; China Agricultural University: Beijing, China, 2013. [Google Scholar]
- Pishgar-Komleh, S.H.; Sefeedpari, P.; Rafiee, S. Energy and economic analysis of rice production under different farm levels in Guilan province of Iran. Energy 2011, 36, 5824–5831. [Google Scholar] [CrossRef]
- Khoshnevisan, B.; Rafiee, S.; Omid, M.; Mousazadeh, H. Applying data envelopment analysis approach to improve energy efficiency and reduce GHG (greenhouse gas) emission of wheat production. Energy 2013, 58, 588–593. [Google Scholar] [CrossRef]
- Mohammadi, A.; Rafiee, S.; Jafari, A.; Dalgaard, T.; Knudsen, M.T.; Keyhani, A.; Mousavi-Avval, S.H.; Hermansen, J.E. Potential greenhouse gas emission reductions in soybean farming: A combined use of Life Cycle Assessment and Data Envelopment Analysis. J. Clean. Prod. 2013, 54, 89–100. [Google Scholar] [CrossRef]
- Dong, X.; Gao, W.; Sui, P.; Yan, M. Energy analysis on typical peasants household system in the ecotone between agriculture and pasture in north china. J. Arid Land Resour. Environ. 2006, 4, 78–82. [Google Scholar] [CrossRef]
- Jia, J.W. On Cost-Benefit of Different Breeding Models of Beef Cattle in China; Inner Mongolia Agricultural University: Hohhot, China, 2010. [Google Scholar]
- Castellini, C.; Bastianoni, S.; Granai, C.; Bosco, A.D.; Brunetti, M. Sustainability of poultry production using the emergy approach: Comparison of conventional and organic rearing systems. Agric. Ecosyst. Environ. 2006, 114, 343–350. [Google Scholar] [CrossRef]
- Li, L.; Lu, H.; Ren, H.; Kang, W.; Chen, F. Emergy evaluations of three aquaculture systems on wetlands surrounding the Pearl River Estuary, China. Ecol. Indic. 2011, 11, 526–534. [Google Scholar] [CrossRef]
- Ren, J.S.; Stenton-Dozey, J.; Plew, D.R.; Fang, J.; Gall, M. An ecosystem model for optimising production in integrated multitrophic aquaculture systems. Ecol. Model. 2012, 246, 34–46. [Google Scholar] [CrossRef]
- Ozkan, B.; Fert, C.; Karadeniz, C.F. Energy and cost analysis for greenhouse and open-field grape production. Energy 2007, 32, 1500–1504. [Google Scholar] [CrossRef]
- Rajabi Hamedani, S.; Keyhani, A.; Alimardani, R. Energy use patterns and econometric models of grape production in Hamadan province of Iran. Energy 2011, 36, 6345–6351. [Google Scholar] [CrossRef]
- Khoshroo, A.; Mulwa, R.; Emrouznejad, A.; Arabi, B. A non-parametric Data Envelopment Analysis approach for improving energy efficiency of grape production. Energy 2013, 63, 189–194. [Google Scholar] [CrossRef]
- Salehi, M.; Ebrahimi, R.; Maleki, A.; Ghasemi Mobtaker, H. An assessment of energy modeling and input costs for greenhouse button mushroom production in Iran. J. Clean. Prod. 2014, 64, 377–383. [Google Scholar] [CrossRef]
- Xue, X.; Wu, H.; Zhang, X.; Dai, J.; Su, C. Measuring energy consumption efficiency of the construction industry: The case of China. J. Clean. Prod. 2014, 107, 509–515. [Google Scholar] [CrossRef]
- Rahman, S.; Rahman, M.S. Energy productivity and efficiency of maize accounting for the choice of growing season and environmental factors: An empirical analysis from Bangladesh. Energy 2013, 49, 329–336. [Google Scholar] [CrossRef]
- Mousavi-Avval, S.H.; Rafiee, S.; Mohammadi, A. Optimization of energy consumption and input costs for apple production in Iran using data envelopment analysis. Energy 2011, 36, 909–916. [Google Scholar] [CrossRef]
- Feng, J.; Wang, J.; Zhang, X.; Zhao, F.; Kanianska, R.; Tian, D. Design and Implementation of Emergy-Based Sustainability Decision Assessment System for Protected Grape Cultivation. Sustainability 2015, 7, 14002–14025. [Google Scholar] [CrossRef]
- Chen, Y.G. Reconstructing the mathematical process of spatial autocorrelation based on Moran’s statistics. Geogr. Res. 2009, 27, 90–98. [Google Scholar]
- Curran, P. Spatial autocorrelation: Odland, J. London: Sage, 1988. 88 pp. £14.95 hardback; £7.95 paperback. Appl. Geogr. 1988, 9, 138–139. [Google Scholar] [CrossRef]
- Moran, P.A.P. The interpretation of statistical maps. J. R. Stat. Soc. 1948, 10, 243–251. [Google Scholar]
- Melecky, L. Spatial autocorrelation method for local analysis of the EU. Procedia Econ. Financ. 2015, 23, 1102–1109. [Google Scholar] [CrossRef]
- Bolandnazar, E.; Keyhani, A.; Omid, M. Determination of efficient and inefficient greenhouse cucumber producers using Data Envelopment Analysis approach, a case study: Jiroft city in Iran. J. Clean. Prod. 2014, 79, 108–115. [Google Scholar] [CrossRef]
- Lu, H.; Bai, Y.; Ren, H.; Campbell, D.E. Integrated emergy, energy and economic evaluation of rice and vegetable production systems in alluvial paddy fields: Implications for agricultural policy in China. J. Environ. Manag. 2010, 91, 2727–2735. [Google Scholar] [CrossRef] [PubMed]
- Luo, S. Agricultural Ecology; China Agricultural Press: Beijing, China, 2011. [Google Scholar]
- Koctürk, O.M.; Engindeniz, S. Energy and cost analysis of sultana grape growing: A case study of Manisa, west Turkey. Afr. J. Agric. Res. 2009, 4, 938–943. [Google Scholar]
- Kizilaslan, H. Input–output energy analysis of cherries production in Tokat Province of Turkey. Appl. Energy 2009, 86, 1354–1358. [Google Scholar] [CrossRef]
- Rafiee, S.; Avval, S.H.M.; Mohammadi, A. Modeling and sensitivity analysis of energy inputs for apple production in Iran. Energy 2010, 35, 3301–3306. [Google Scholar] [CrossRef]
- Torki-Harchegani, M.; Ebrahimi, R.; Mahmoodi-Eshkaftaki, M. Almond production in Iran: An analysis of energy use efficiency (2008–2011). Renew. Sustain. Energy Rev. 2015, 41, 217–224. [Google Scholar] [CrossRef]
- Mohammadshirazi, A.; Akram, A.; Rafiee, S.; Avval, S.H.M.; Kalhor, E.B. An analysis of energy use and relation between energy inputs and yield in tangerine production. Renew. Sustain. Energy Rev. 2012, 16, 4515–4521. [Google Scholar] [CrossRef]
- Nabavi-Pelesaraei, A.; Abdi, R.; Rafiee, S.; Mobtaker, H.G. Optimization of energy required and greenhouse gas emissions analysis for orange producers using data envelopment analysis approach. J. Clean. Prod. 2014, 65, 311–317. [Google Scholar] [CrossRef]
- Nabavi-Pelesaraei, A.; Abdi, R.; Rafiee, S. Energy use pattern and sensitivity analysis of energy inputs and economical models for peanut production in Iran. Int. J. Agric. Crop Sci. 2013, 5, 2193–2202. [Google Scholar]
- Tabatabaie, S.M.H.; Rafiee, S.; Keyhani, A.; Ebrahimi, A. Energy and economic assessment of prune production in Tehran province of Iran. J. Clean. Prod. 2013, 39, 280–284. [Google Scholar] [CrossRef]
- Petre, M.; Teodorescu, A.; Giosanu, D.; Bejan, C. Enhanced cultivation of mushrooms on organic wastes from wine-making industry. J. Environ. Prot. Ecol. 2012, 13, 1488–1492. [Google Scholar]


| Classification Standard | Classified Sub-Pattern | Definition and Description |
|---|---|---|
| Greenhouse structures | Vinyl tunnel | The arched shed is made up of scaffolding and plastic film covering. There is no wall to the north, east, or west, which can make full use of solar energy on all sides. It is applied in China widely. |
| Solar greenhouse | Relies on the sun to maintain the temperature level in the greenhouse to meet the needs of grape growth. Building walls with bricks or adobe in the north, east, and west. It is usually used in the northern region. | |
| Rain-shelter greenhouses | It can be seen as a simpler vinyl tunnel, on the basis of open-field cultivation. A shed structure is added to the grape support, and a plastic film is placed on it to prevent the adverse effects of excessive rain on the growth of the grapes. It is mainly used in the southern region. | |
| Greenhouse Functions | Early ripening production | According to the effect of the covering material for temperature and humidity, the suitable conditions for the growth of the grape are created, so that it can geminate, grow, develop, and mature earlier than in conventional open-field cultivation. |
| Late ripening production | Using a variety of techniques to delay the maturity and harvesting time of grapes. | |
| Rain-shelter production | Using protection facilities to prevent excessive rain from affecting grape growth in yield and quality. |
| Energy Items | Energy Equivalent | 2011 | 2012 | 2013 | |||
|---|---|---|---|---|---|---|---|
| Mean | SD | Mean | SD | Mean | SD | ||
| Steel | 46,860.80 (Kj/Kg) [26] | 75,681.8 | 50,346.3 | 75,882.9 | 70,232.8 | 80,529.1 | 72,918.9 |
| Iron Wire | 15,815.52 (Kj/Kg) [26] | 1862.0 | 1173.9 | 1833.4 | 1165.3 | 1909.9 | 920.9 |
| Water | 1020 (Kj/m3) [26] | 371.0 | 111.5 | 336.2 | 73.9 | 406.2 | 101.2 |
| Chemical Fertilizer | 38,213.87 (Kj/Kg) [26] | 23,996.3 | 15,174.7 | 25,151.1 | 16,562.6 | 23,809.1 | 14,743.6 |
| Pesticide | 1,020,896.90 (Kj/Kg) [26] | 34,601.8 | 25,817.9 | 33,648.1 | 28,784.7 | 32,026.6 | 25,025.4 |
| Electric | 3598.24 (Kj/KWh) [26] | 8520.9 | 5255.3 | 8581.2 | 5618.9 | 8586.7 | 6026.7 |
| Organic Fertilizer | 300 (Kj/Kg) [27] | 3336.1 | 1678.7 | 3254.3 | 1855.5 | 3238.6 | 1732.4 |
| Plastic Film | 51,931.81 (Kj/Kg) [26] | 48,597.7 | 18,225.7 | 50,543.0 | 17,180.4 | 58,269.2 | 15,779.9 |
| Labor Power | 12,600 (Kj/d) [27] | 13,566.7 | 27,684.1 | 12,274.4 | 12,869.2 | 13,796.4 | 12,665.2 |
| Total Input | -- | 210,534.3 | 66,482.9 | 211,504.6 | 89,254.6 | 222,571.8 | 82,674.2 |
| Total Output | 2205.80 (Kj/Kg) [26] | 48,894.7 | 16,859.7 | 53,304.2 | 26,002.8 | 51,630.0 | 20,455.5 |
| Production System | Energy Input | Energy Output | Reference | |
|---|---|---|---|---|
| Country | Grape in China | 222,572 | 51,630 | -- |
| Grape in Turkey | 24,510 | 73,396 | [12] | |
| Grape in Iran | 45,303 | 181,066 | [14] | |
| Fruit | Cherry | 48,667 | 88,922 | [28] |
| Apple | 42,819 | 49,857 | [29] | |
| Almond | 62,483 | 140,200 | [30] | |
| Tangerine | 62,261 | 54,060 | [31] |
| Input Index | Statistical Parameter | 2011 | 2012 | 2013 | ||||||
|---|---|---|---|---|---|---|---|---|---|---|
| Early Ripening Production | Late Ripening Production | Rain-Shelter Production | Early Ripening Production | Late Ripening Production | Rain-Shelter Production | Early Ripening Production | Late Ripening Production | Rain-Shelter Production | ||
| Steel | SD | 55,392 | 28,023 | 56,411 | 60,796 | 38,008 | 80,824 | 91,219 | 33,318 | 47,496 |
| Variance | 0.005 | 0.00 | 0.00 | |||||||
| Iron Wire | SD | 1053 | 1530 | 1824 | 849 | 922 | 1692 | 1078 | 748 | 571 |
| Variance | 0.416 | 0.669 | 0.086 | |||||||
| Water | SD | 108 | 103 | 126 | 83 | 43 | 41 | 97 | 104 | 72 |
| Variance | 0.070 | 0.00 | 0.201 | |||||||
| Chemical Fertilizer | SD | 14,098 | 15,427 | 13,394 | 16,474 | 11,141 | 19,140 | 14,734 | 11,871 | 12,086 |
| Variance | 0.720 | 0.543 | 0.00 | |||||||
| Pesticide | SD | 23,310 | 15,745 | 31,409 | 31,315 | 16,096 | 29,188 | 21,781 | 25,019 | 39,204 |
| Variance | 0.410 | 0.021 | 0.494 | |||||||
| Electric | SD | 5813 | 3182 | 4385 | 5579 | 494 | 6858 | 5948 | 5175 | 4297 |
| Variance | 0.087 | 0.001 | 0.078 | |||||||
| Organic Fertilizer | SD | 1754 | 1126 | 2000 | 1904 | 1514 | 1625 | 1830 | 938 | 1814 |
| Variance | 0.197 | 0.00 | 0.00 | |||||||
| Plastic Film | SD | 17,239 | 10,835 | 18,255 | 16,248 | 19,055 | 15,840 | 17,291 | 6986 | 20,736 |
| Variance | 0.003 | 0.00 | 0.0032 | |||||||
| Labor Power | SD | 18,941 | 6192 | 7394 | 16,091 | 2388 | 7748 | 16,421 | 5736 | 7266 |
| Variance | 0.265 | 0.033 | 0.001 | |||||||
| Total Input | Mean | 221,742 | 176,184 | 177,870 | 224,567 | 206,735 | 160,381 | 234,866 | 237,953 | 171,528 |
| SD | 66,722 | 32,904 | 50,957 | 80,278 | 53,166 | 100,980 | 104,016 | 38,762 | 12,009 | |
| Variance | 0.001 | 0.00 | 0.001 | |||||||
| Total Output | Mean | 49,037 | 44,998 | 44,827 | 54,639 | 56,088 | 51,203 | 53,822 | 40,962 | 51,809 |
| SD | 16,291 | 2718 | 15,060 | 32,297 | 10,995 | 34,733 | 21,014 | 11,075 | 16,571 | |
| Variance | 0.329 | 0.641 | 0.000 | |||||||
| Input Index | Statistical Parameter | 2011 | 2012 | 2013 | ||||||
|---|---|---|---|---|---|---|---|---|---|---|
| Vinyl Tunnel | Solar Greenhouse | Rain-Shelter Greenhouse | Vinyl Tunnel | Solar Greenhouse | Rain-Shelter Greenhouse | Vinyl Tunnel | Solar Greenhouse | Rain-Shelter Greenhouse | ||
| Steel | SD | 56,859 | 24,558 | 57,660 | 71,158 | 45,822 | 65,329 | 97,289 | 46,489 | 50,324 |
| Variance | 0.00 | 0.00 | 0.00 | |||||||
| Iron Wire | SD | 1476 | 346 | 1042 | 1346 | 708 | 958 | 1109 | 898 | 725 |
| Variance | 0.041 | 0.325 | 0.08 | |||||||
| Water | SD | 114 | 81 | 142 | 79 | 69 | 39 | 97 | 104 | 85 |
| Variance | 0.067 | 0.00 | 0.611 | |||||||
| Chemical Fertilizer | SD | 14,047 | 13,414 | 5720 | 16,228 | 11,999 | 16,439 | 15,878 | 11,937 | 14,102 |
| Variance | 0.172 | 0.071 | 0.519 | |||||||
| Pesticide | SD | 21,638 | 18,731 | 35,462 | 31,215 | 15,939 | 29,656 | 23,329 | 11,454 | 34,916 |
| Variance | 0.013 | 0.355 | 0.002 | |||||||
| Electric | SD | 5122 | 7128 | 3363 | 4989 | 5143 | 6984 | 5621 | 6261 | 4680 |
| Variance | 0.273 | 0.191 | 0.731 | |||||||
| Organic Fertilizer | SD | 1706 | 918 | 2024 | 2008 | 1717 | 1477 | 1709 | 2411 | 2008 |
| Variance | 0.00 | 0.065 | 0.113 | |||||||
| Plastic Film | SD | 17,778 | 16,524 | 20,374 | 17,211 | 15,016 | 15,725 | 16,452 | 18,855 | 20,808 |
| Variance | 0.131 | 0.00 | 0.106 | |||||||
| Labor Power | SD | 18,544 | 31,488 | 9034 | 15,521 | 19,390 | 8374 | 16,599 | 12,919 | 8150 |
| Variance | 0.506 | 0.657 | 0.062 | |||||||
| Total Input | Mean | 222,893 | 176,184 | 177,870 | 224,567 | 206,735 | 160,381 | 234,866 | 237,953 | 171,528 |
| SD | 67,738 | 62,675 | 72,169 | 89,263 | 59,483 | 93,268 | 108,397 | 62,257 | 69,124 | |
| Variance | 0.00 | 0.00 | 0.001 | |||||||
| Total Output | Mean | 47,442 | 47,590 | 50,261 | 56,341 | 48,053 | 51,203 | 54,215 | 51,764 | 55,903 |
| SD | 15,430 | 21,640 | 14,217 | 30,529 | 18,199 | 17,714 | 20,347 | 25,109 | 16,091 | |
| Variance | 0.767 | 0.126 | 0.751 | |||||||
| 2011 | 2012 | 2013 | ||||
|---|---|---|---|---|---|---|
| Index | Energy input | Energy output | Energy input | Energy output | Energy input | Energy output |
| Global Moran’s I | 0.039 | 0.048 | 0.056 | 0.065 | 0.045 | 0.035 |
| P | 0.03 | <1% | <1% | <1% | <1% | <1% |
| Z | 2.904 | 3.587 | 4.177 | 4.810 | 3.331 | 2.601 |
© 2018 by the authors. Licensee MDPI, Basel, Switzerland. This article is an open access article distributed under the terms and conditions of the Creative Commons Attribution (CC BY) license (http://creativecommons.org/licenses/by/4.0/).
Share and Cite
Tian, D.; Zhang, M.; Wei, X.; Wang, J.; Mu, W.; Feng, J. GIS-Based Energy Consumption and Spatial Variation of Protected Grape Cultivation in China. Sustainability 2018, 10, 3248. https://doi.org/10.3390/su10093248
Tian D, Zhang M, Wei X, Wang J, Mu W, Feng J. GIS-Based Energy Consumption and Spatial Variation of Protected Grape Cultivation in China. Sustainability. 2018; 10(9):3248. https://doi.org/10.3390/su10093248
Chicago/Turabian StyleTian, Dong, Min Zhang, Xuejian Wei, Jing Wang, Weisong Mu, and Jianying Feng. 2018. "GIS-Based Energy Consumption and Spatial Variation of Protected Grape Cultivation in China" Sustainability 10, no. 9: 3248. https://doi.org/10.3390/su10093248
APA StyleTian, D., Zhang, M., Wei, X., Wang, J., Mu, W., & Feng, J. (2018). GIS-Based Energy Consumption and Spatial Variation of Protected Grape Cultivation in China. Sustainability, 10(9), 3248. https://doi.org/10.3390/su10093248