Precondition Cloud and Maximum Entropy Principle Coupling Model-Based Approach for the Comprehensive Assessment of Drought Risk

Abstract
1. Introduction
2. Methodologies
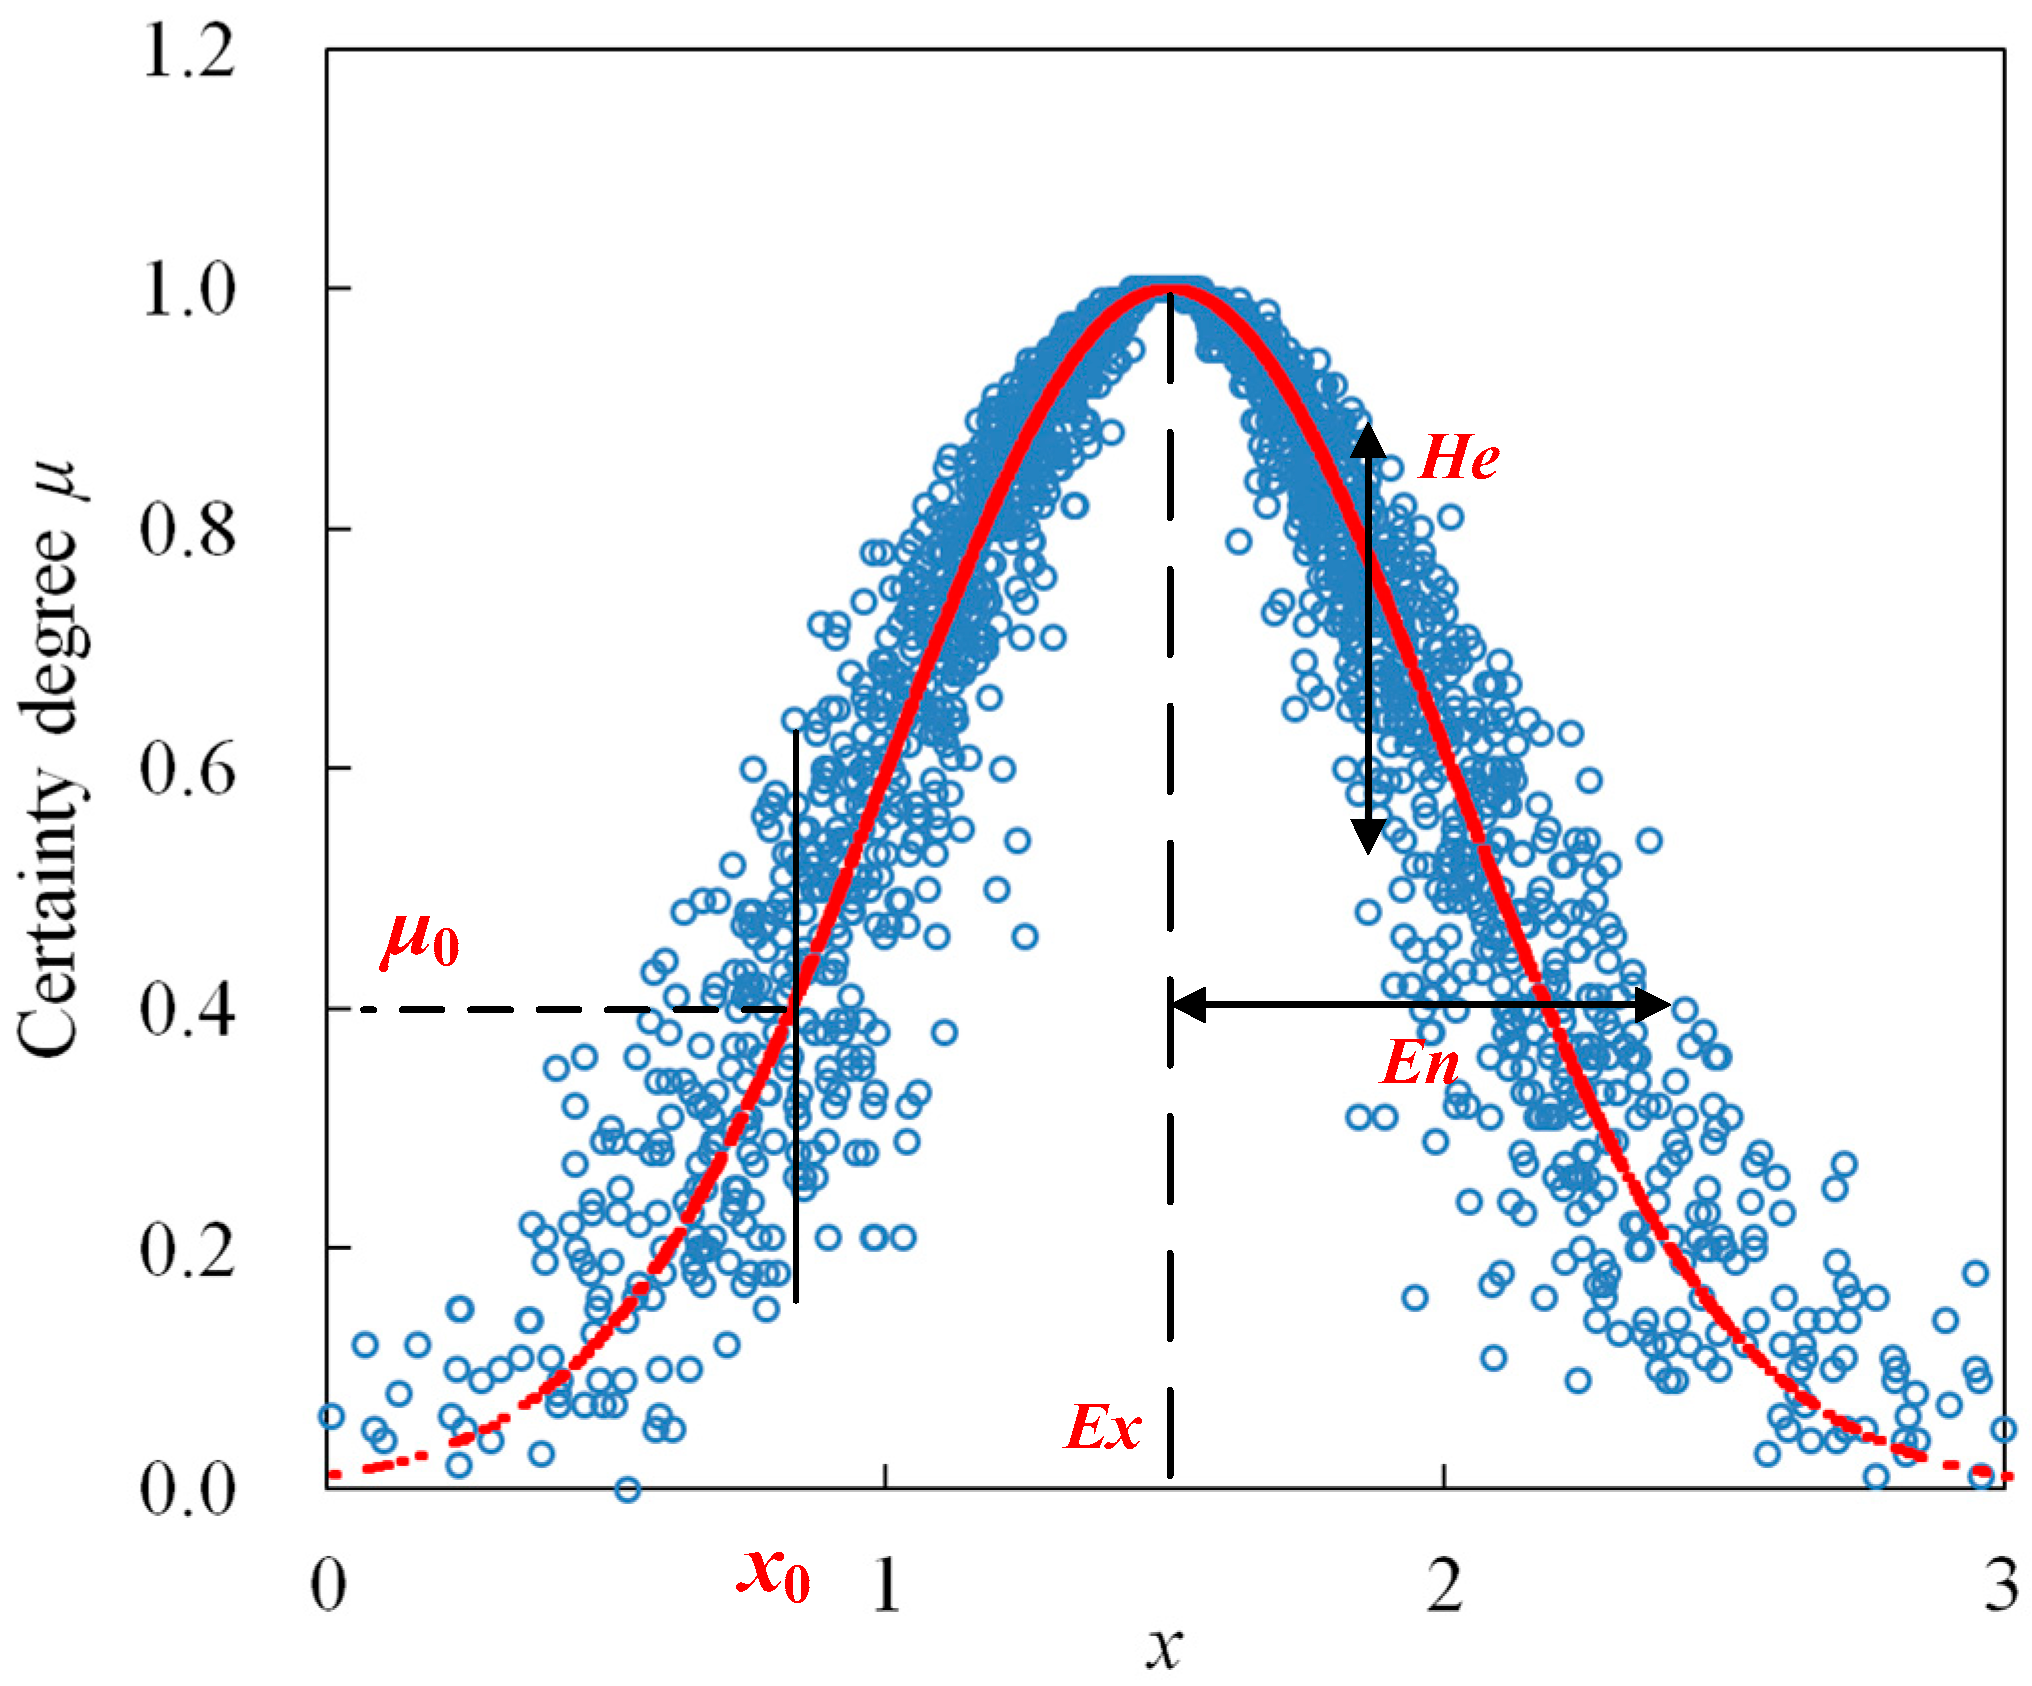
2.1. Precondition Cloud Generator Algorithm
- Step 1:
- generate two normally distributed random numbers EnP′ and EnR′ satisfying EnP′∊N(EnP, HeP) and EnR′∊N(EnR, HeR), respectively.
- Step 2:
- calculate the certainty degree μ0 of the given drought sample X0 = [P0, R0] belonging to specific drought risk level cloud C0 as follows
- Step 3:
- repeat Step 1 and Step 2 until generating Nc cloud drops, and then the final certainty degree can be obtained by the average of Nc cloud drops.
2.2. Principle of Maximum Entropy
2.3. Construction of the Precondition Cloud and Maximum Entropy Principle (PCMEP) Coupling Model for Drought Risk Assessment
- Step 1:
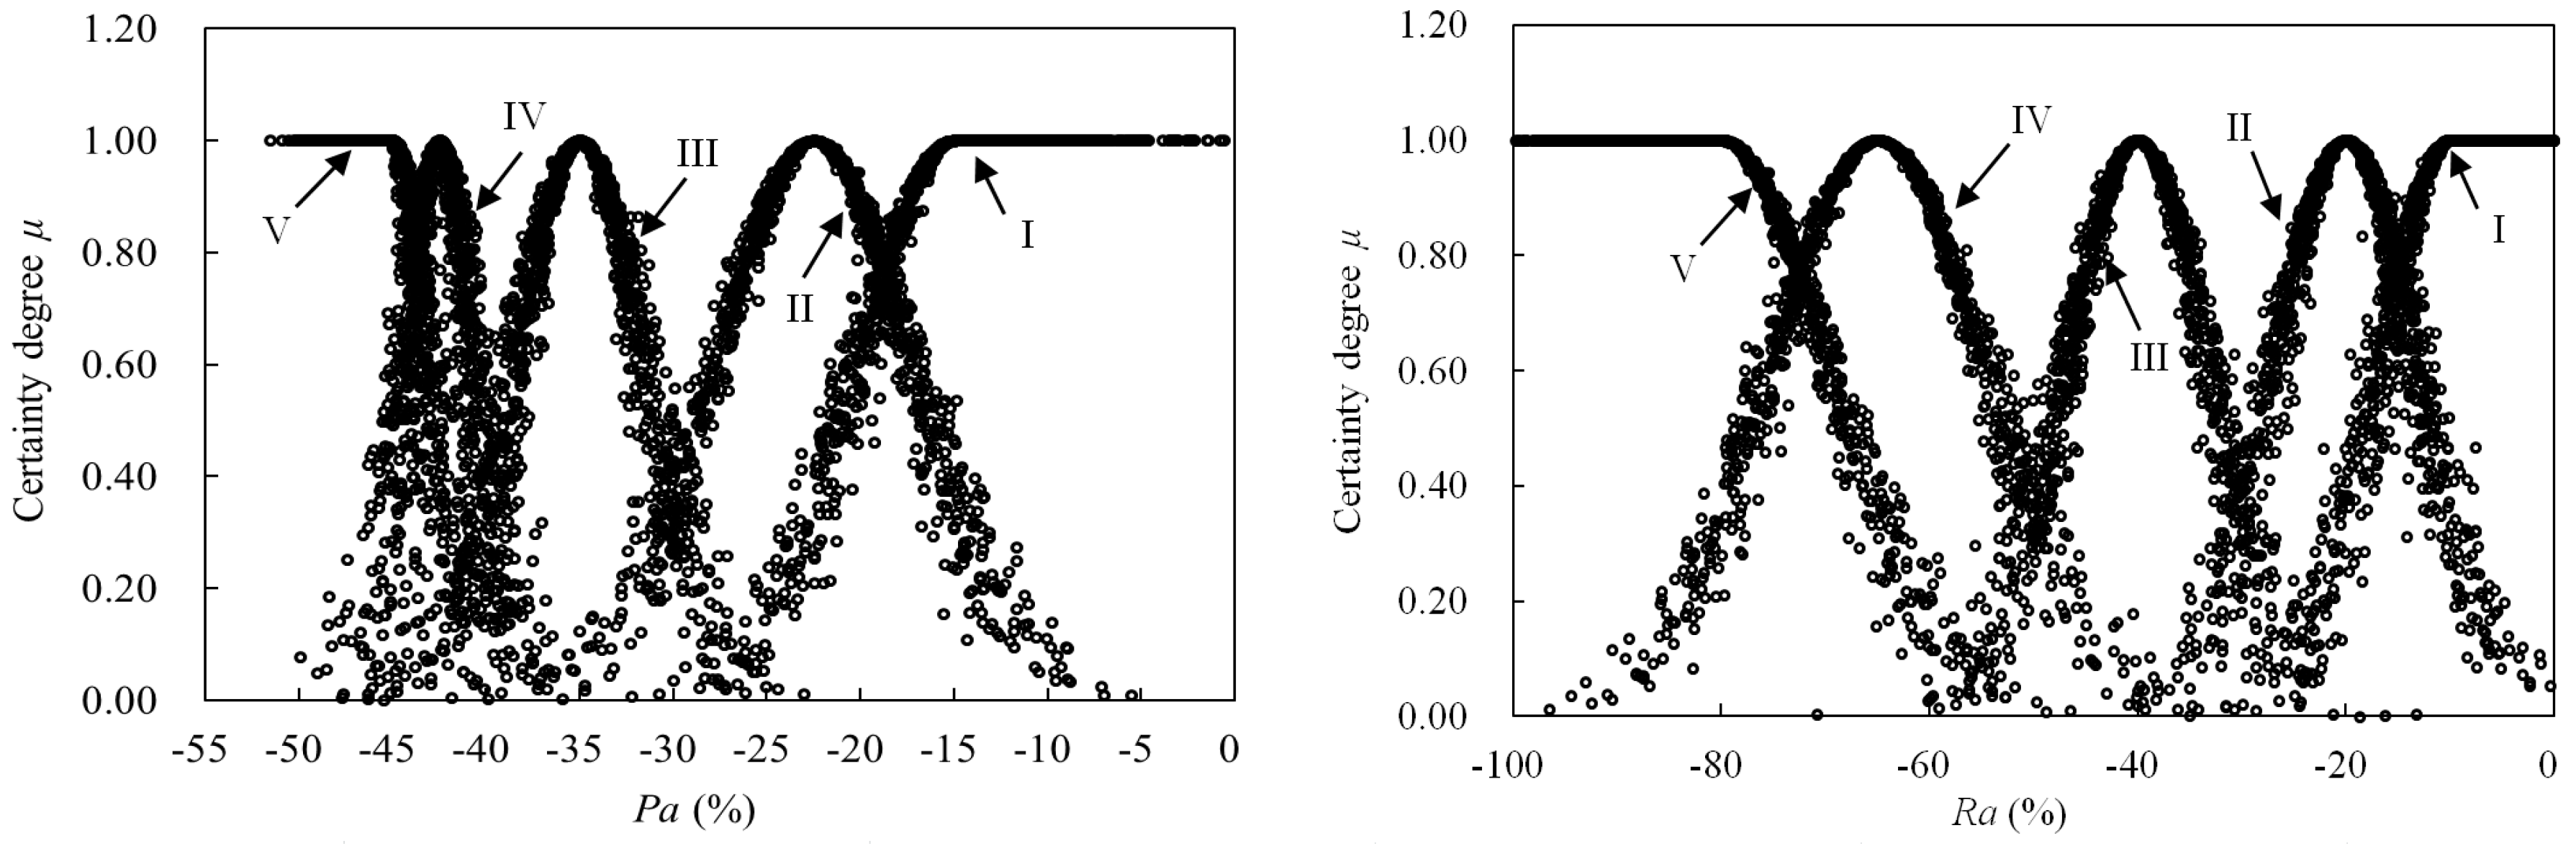
- Construction of assessment sample, indices, and standard data set for drought risk. Considering the availability and representativeness of the drought index data series, the anomaly percentage of precipitation P and streamflow R are employed to indicate the drought risk, then the cloud characteristics for each drought risk level can be obtained from the traditional interval standard, and finally the drought risk assessment sample set can be established and denoted as X = {(Pi, Ri)|i = 1 − M}, where M represents the number of drought samples.
- Step 2:
- Calculation of the certainty degree belonging to each drought risk level by the precondition cloud algorithm. If hypothesizing that uijk denotes the certainty degree of the ith drought sample and the jth cloud drop belonging to the kth drought risk level, then the final certainty degree matrix can be denoted as U = {uijk|i = 1 − M, j = 1 − N, k = 1 − K}, where N and K represent the number of cloud drops and drought risk levels, respectively.
- Step 3:
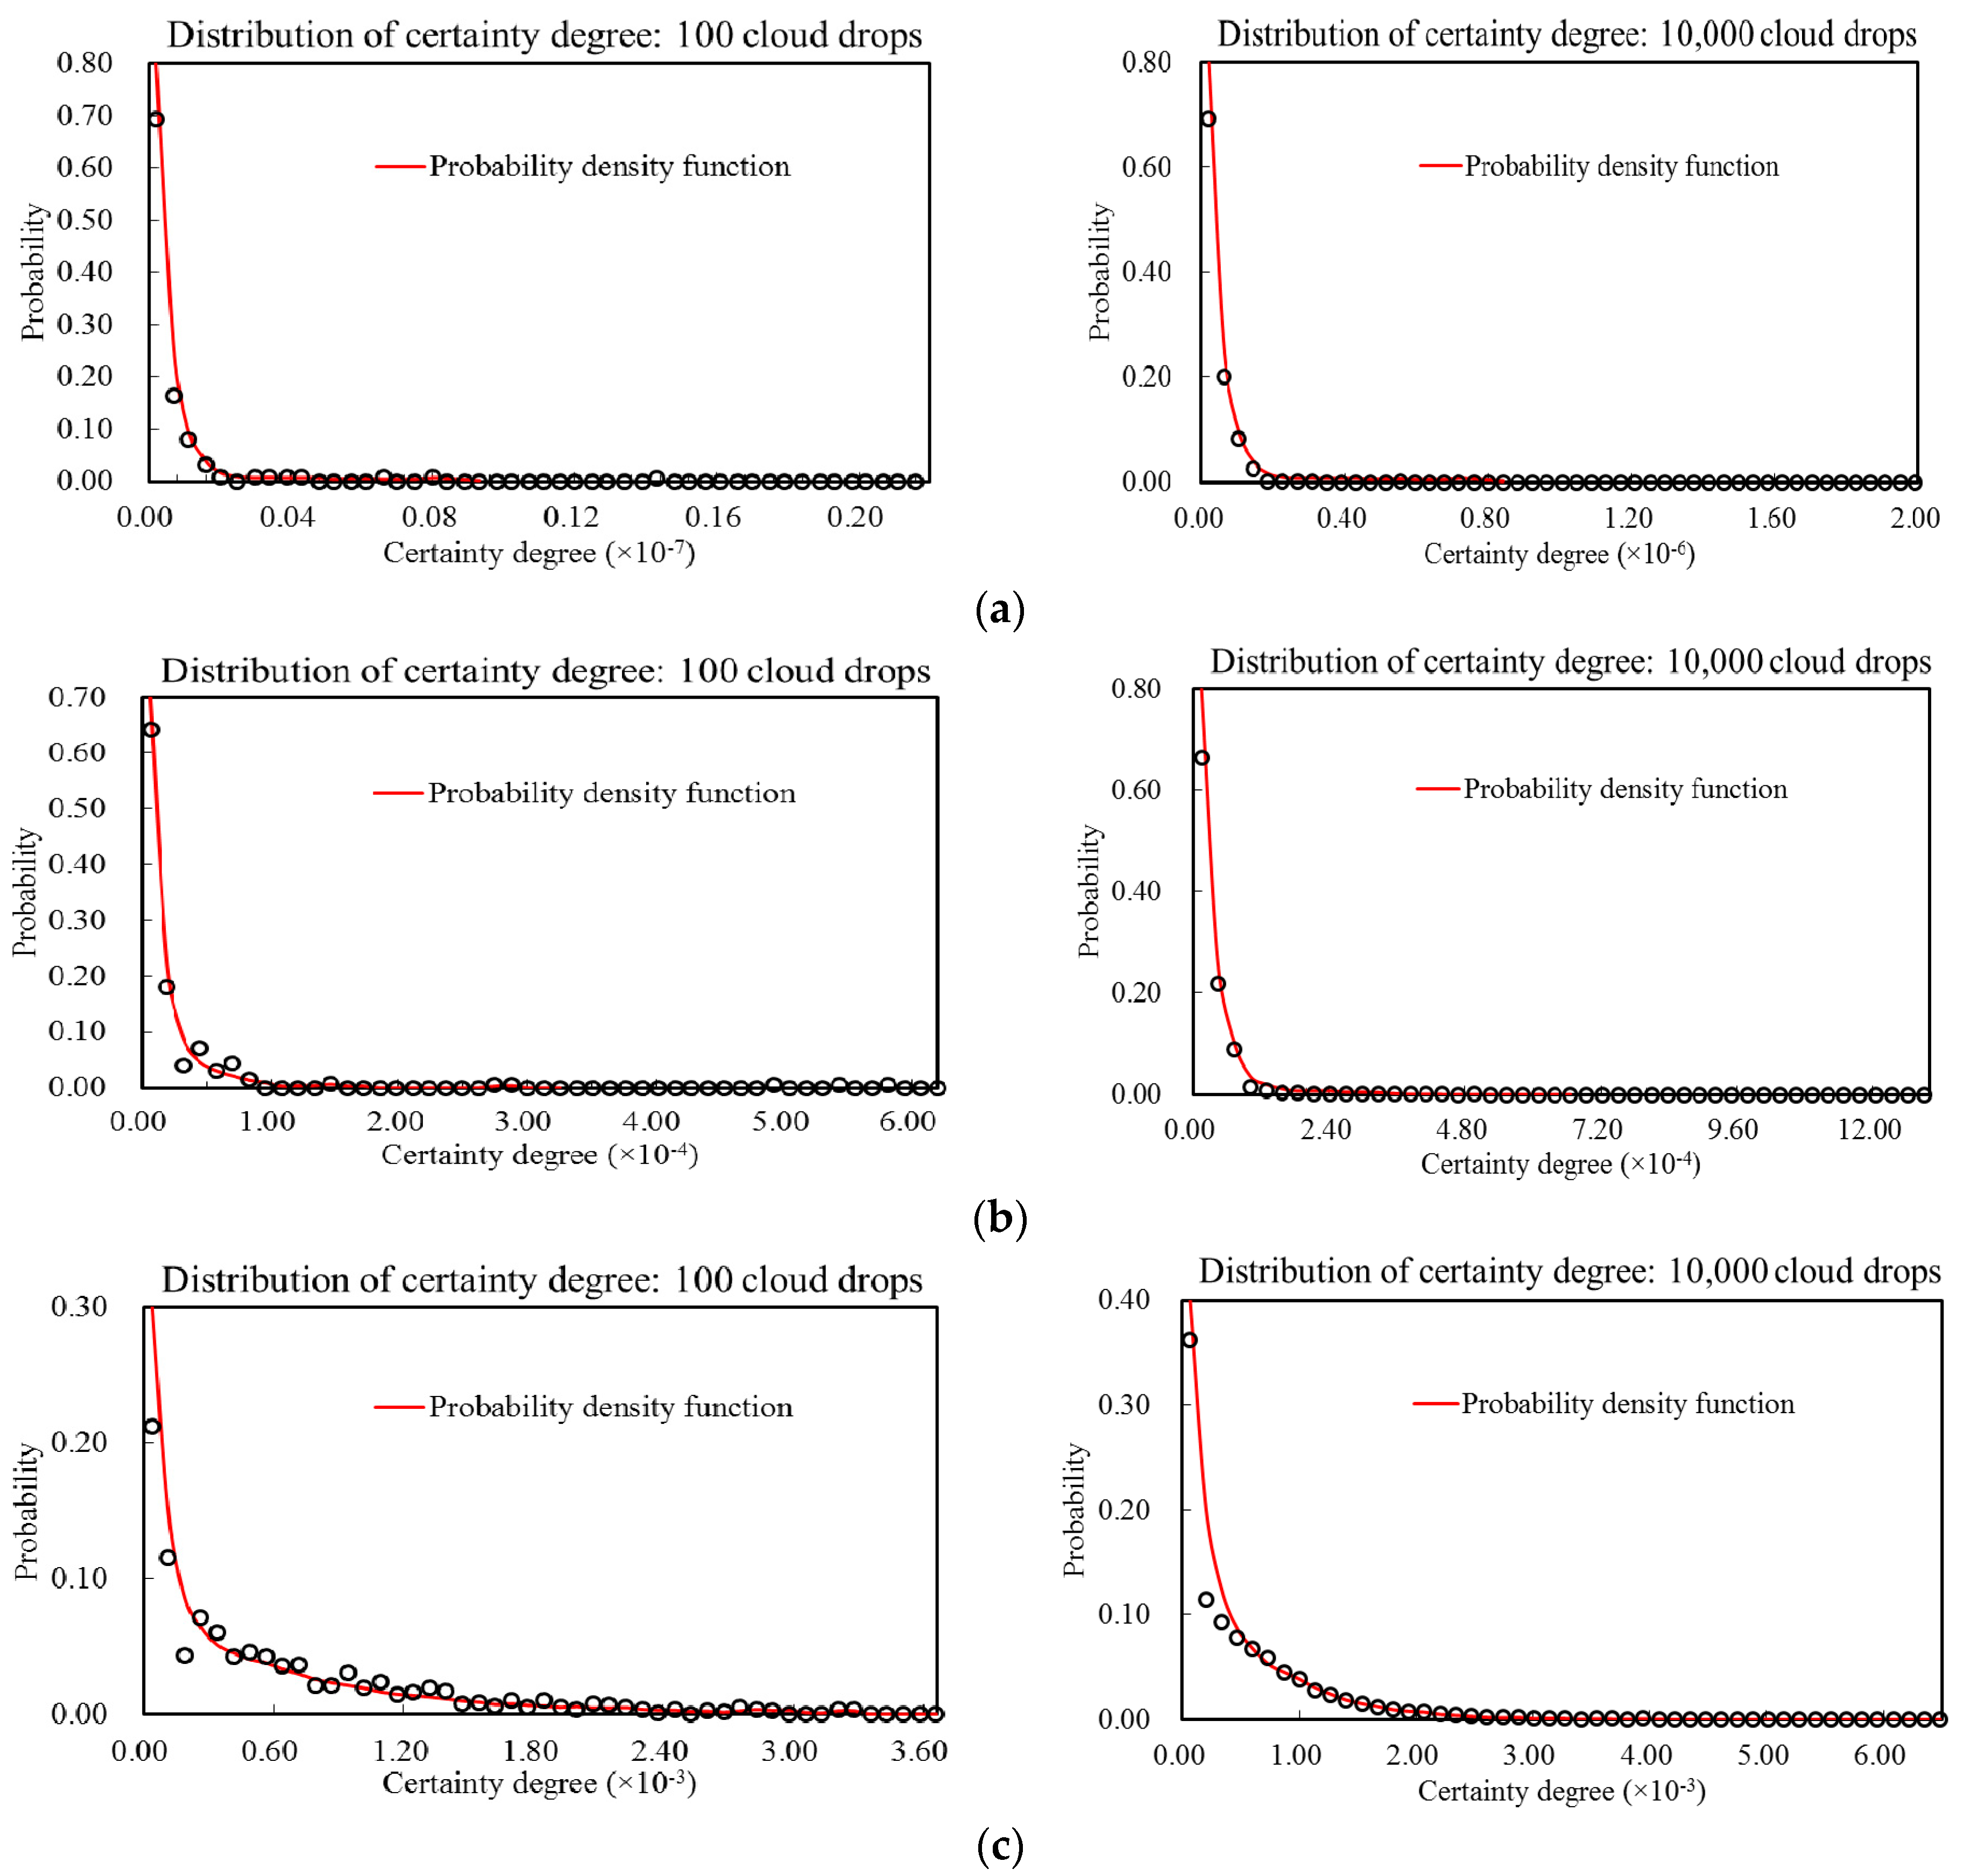
- Computation of the certainty degree component matrix V = {vik|i = 1 − M, k = 1 − K}. Supposing vik denotes the certainty degree component of the ith drought sample belonging to the kth drought risk level, then vik can be obtained based on the probability distribution of Nc cloud drops that follows a negative exponential distribution rather than a uniform distribution, as followswhere pij is determined by Equation (8) and represents the probability of the ith drought sample and the jth cloud drop.
- Step 4:
- Determination of the drought risk level for the drought sample set. If denoting di as the characteristic value of drought risk level for the ith drought sample, then it becomes
3. Case Study
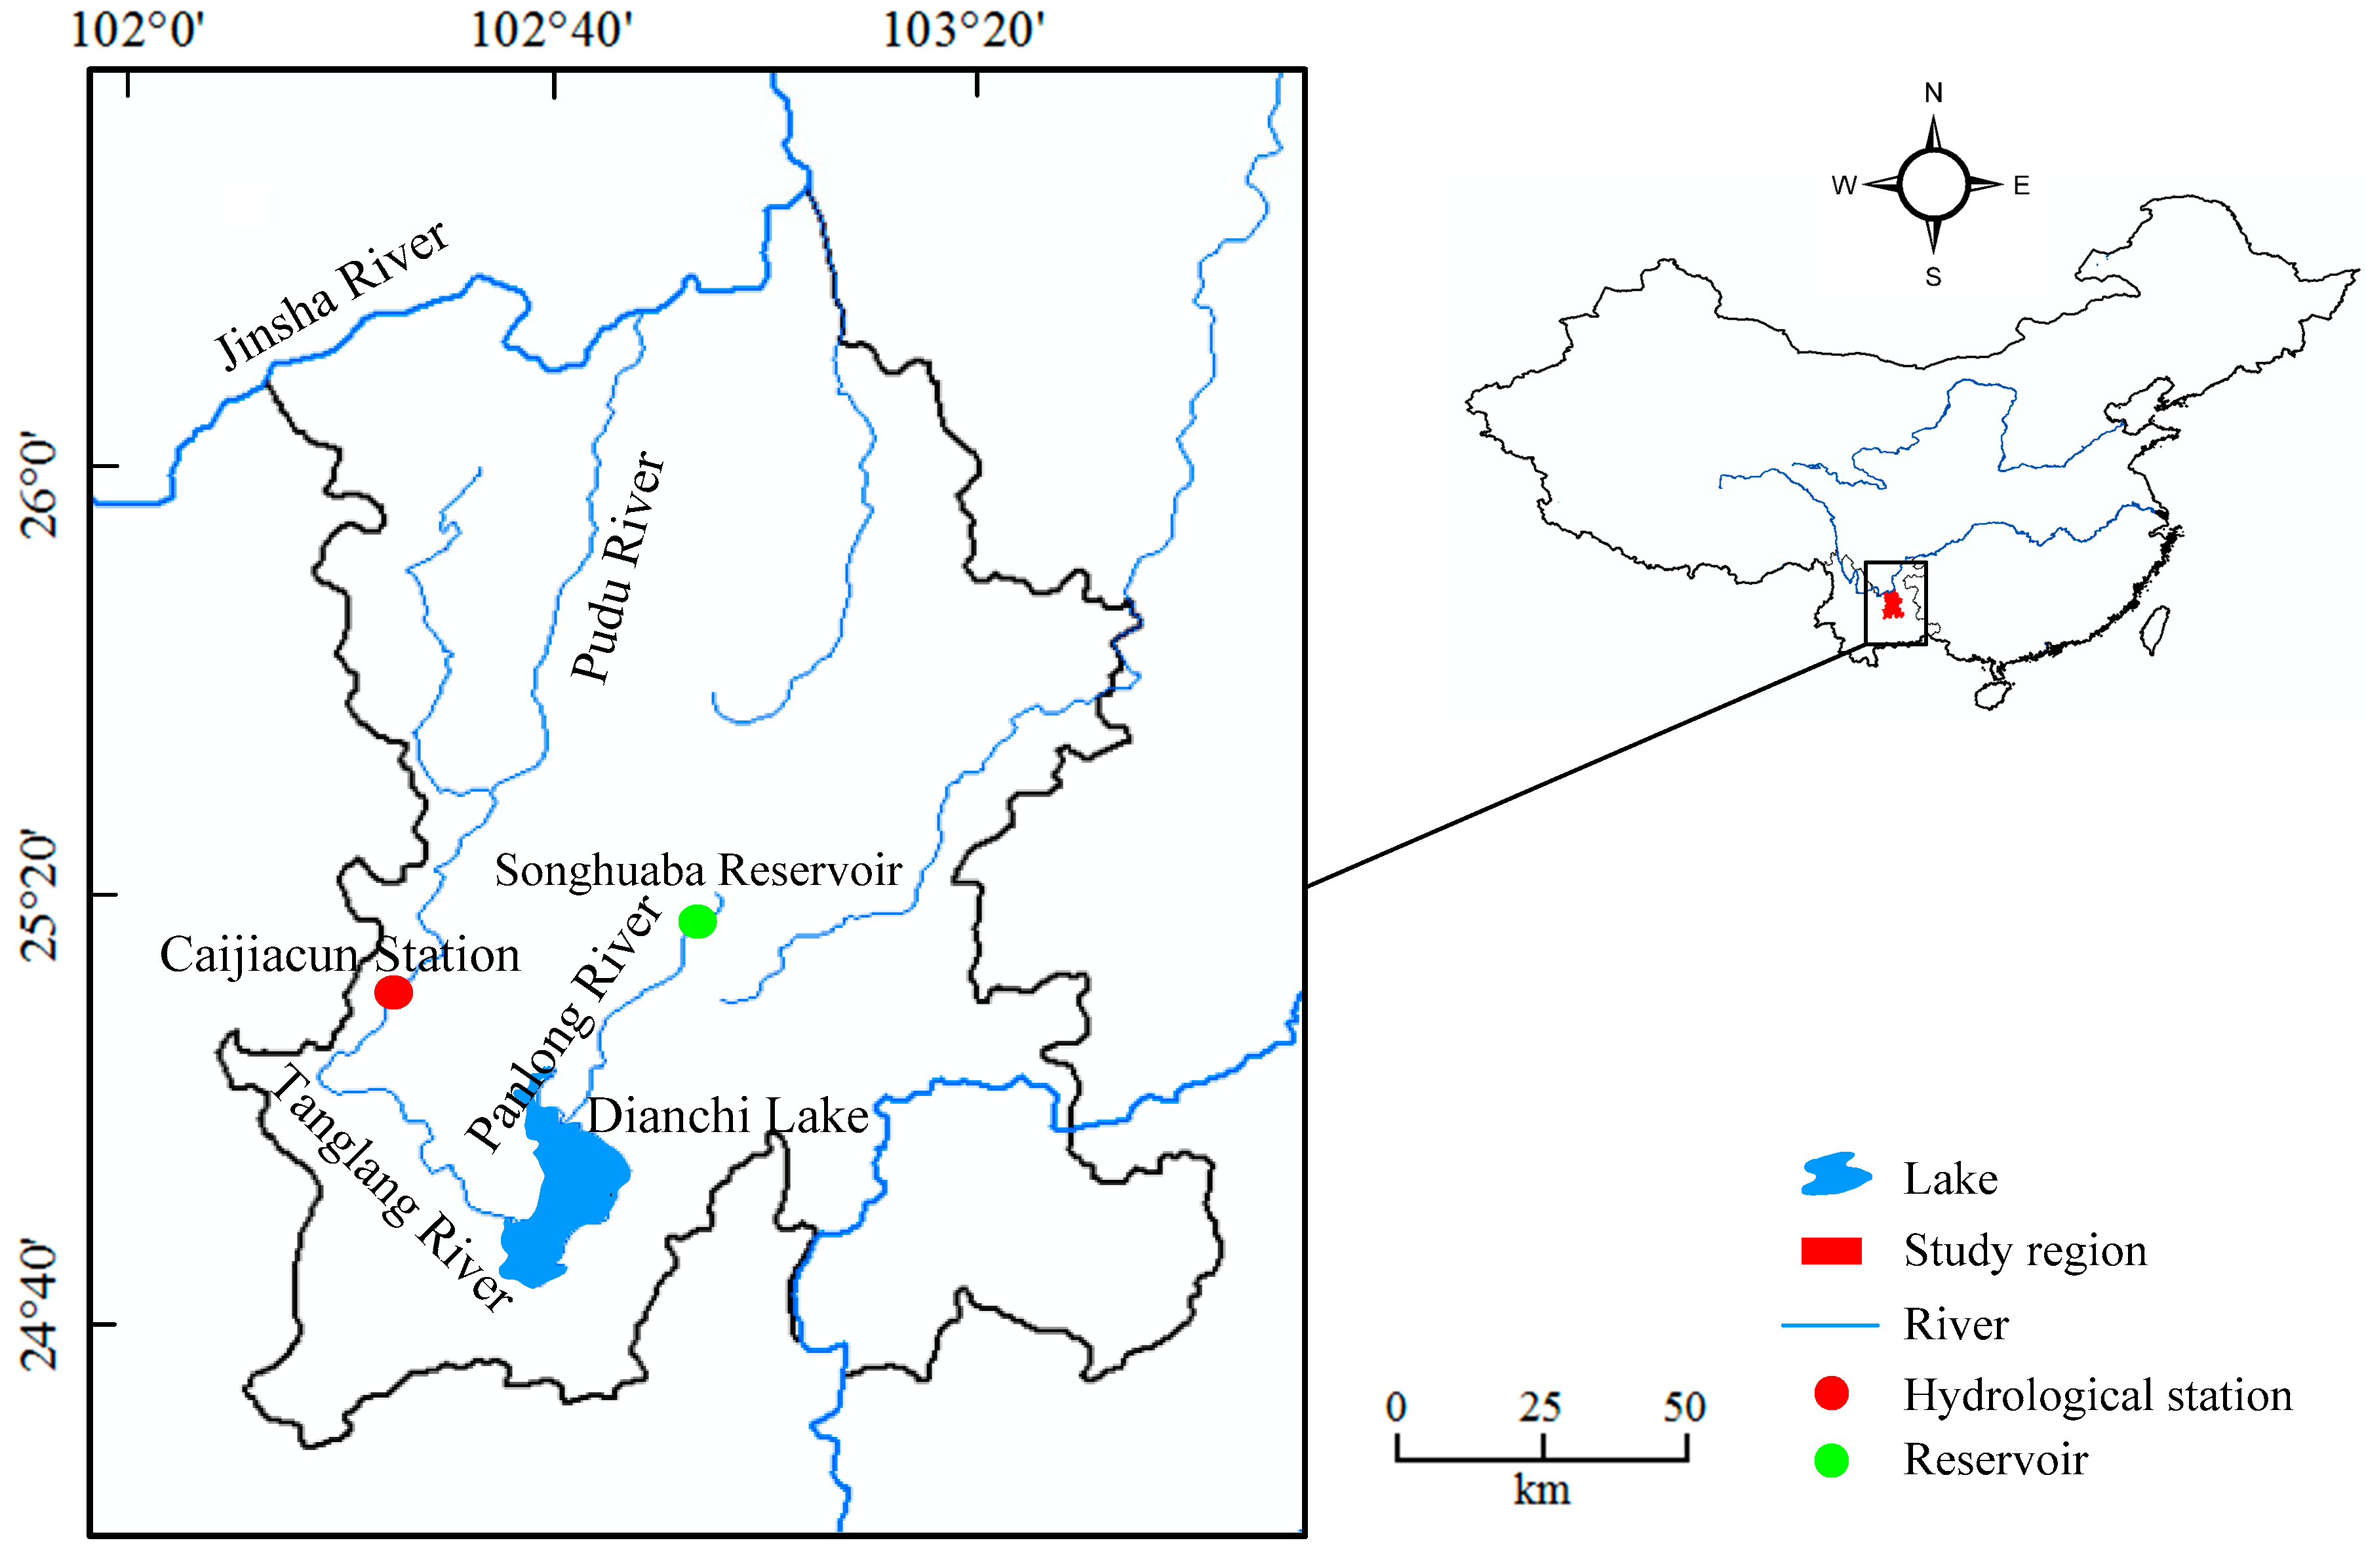
3.1. Data and Study Area
3.2. Drought Risk Assessment of Kunming City, 1956–2011, by PCMEP
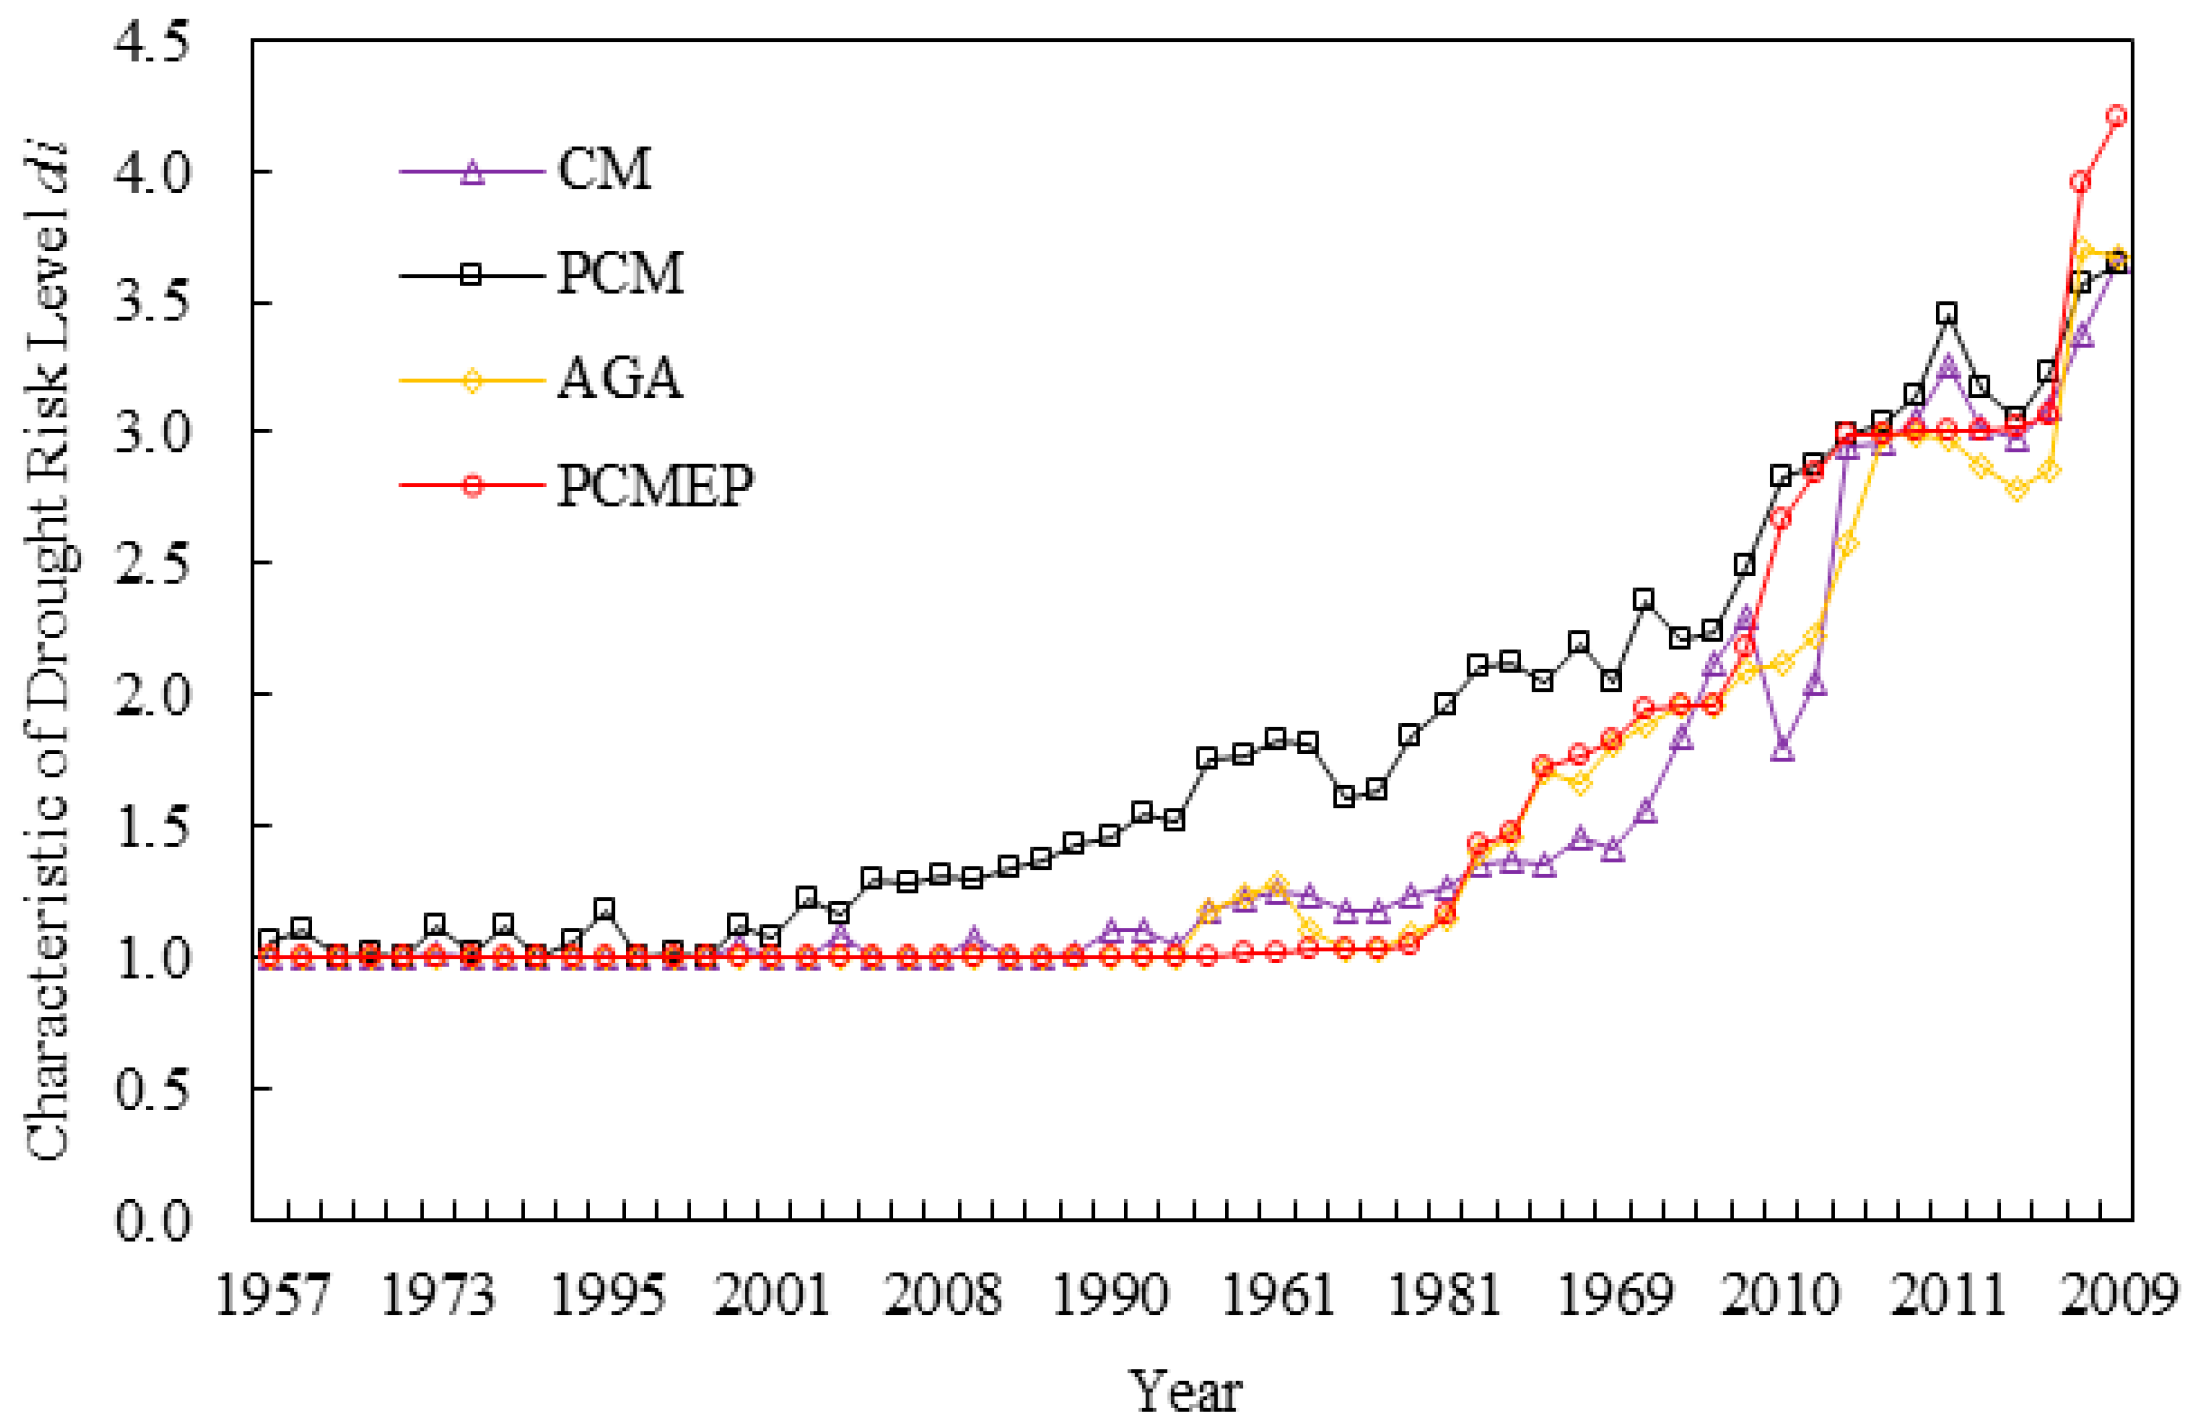
3.3. Result Analysis of Drought Risk Assessment in Kunming City, 1956–2011
3.4. Result Analysis of Drought Risk Assessment in Kunming City, 2009
4. Conclusions
- (1)
- The drought risk assessment result determined by PCMEP indicates that there are 38 years with level I, 7 years with level II, 9 years with level III, and 2 years with level IV, and the drought risk level in 2009 is the highest from 1956 to 2011 in Kunming city.
- (2)
- Meanwhile, the varying trend of the drought risk calculation result by PCMEP for historical years agrees well with that of the observed precipitation and streamflow data series, which indicates that the PCMEP coupling approach can better capture the characteristics of different drought indices, and the assessment result is more sensitive and reliable.
- (3)
- Furthermore, as a result of the consideration of the probability distribution for cloud drops subjected to the principle of maximum entropy, the drought risk assessment result of PCMEP is more beneficial and advantageous for decision-makers to recognize an accurate drought level. All in all, although the physical mechanism of the conversion from the internal division standard of the drought level into cloud characteristics is not clear, the PCMEP model is still an effective drought risk assessment approach to reveal the fuzziness of drought risk systems. It can be further extended and applied in combination with the randomness of a drought risk system so as to characterize the drought features from a more comprehensive and systematic perspective in the future work.
Author Contributions
Funding
Conflicts of Interest
References
- Yuan, W.P.; Zhou, G.S. Theoratical study and research prospect on drought indices. Adv. Earth Sci. 2004, 19, 982–991. [Google Scholar]
- Mishra, K.; Singh, V.P. A review of drought concepts. J. Hydrol. 2010, 391, 202–216. [Google Scholar] [CrossRef]
- Wilhite, A.; Hayes, M.J.; Knutson, C.; Smith, K.H. Planning for drought: Moving from crisis to risk management. J. Am. Water Resourc. Assoc. 2000, 36, 697–710. [Google Scholar] [CrossRef]
- Mckee, T.B.; Doesken, N.J.; Kleist, J. The relationship of drought frequency and duration to time scales. In Proceedings of the 8th Conference on Applied Climatology, Anaheim, CA, USA, 17–22 January 1993; Volume 17, pp. 179–183. [Google Scholar]
- Sun, P.; Zhang, Q.; Bai, Y.G.; Zhang, J.H. Variable fuzzy algorithm-based risk evaluation of droughts over the Tarim River Basin. J. Nat. Disasters 2014, 23, 148–155. (In Chinese) [Google Scholar]
- Zhou, Y.L.; Lai, C.G.; Wang, Z.L.; Chen, X.H.; Zeng, Z.Y.; Chen, J.C.; Bai, X.Y. Quantitative Evaluation of the Impact of Climate Change and Human Activity on Runoff Change in the Dongjiang River Basin, China. Water 2018, 10, 571. [Google Scholar] [CrossRef]
- Zhou, Y.L.; Liu, L.; Zhou, P.; Jin, J.L.; Li, J.Q.; Wu, C.G. Identification of drought and frequency analysis of drought characteristics based on palmer drought severity index model. Trans. Chin. Soc. Agric. Eng. 2014, 30, 175–184. [Google Scholar]
- Palmer, W.C. Meteorologic Drought; Research Paper No. 45; US Department of Commerce, Weather Bureau: Silver Spring, MD, USA, 1965.
- Wang, Z.L.; Li, J.; Lai, C.G.; Zeng, Z.Y.; Zhong, R.D.; Chen, X.H.; Zhou, X.W.; Wang, M.Y. Does drought in China show a significant decreasing trend from 1961 to 2009. Sci. Total Environ. 2017, 579, 314–324. [Google Scholar] [CrossRef] [PubMed]
- Wang, Z.L.; Zhong, R.D.; Lai, C.G.; Zeng, Z.Y.; Lian, Y.Q.; Bai, X.Y. Climate change enhances the severity and variability of drought in the Pearl River Basin in South China in the 21st century. Agric. For. Meteorol. 2018, 249, 149–162. [Google Scholar] [CrossRef]
- Guo, A.J.; Chang, J.X.; Wang, Y.M.; Huang, Q.; Guo, Z.H. Maximum Entropy-Copula Method for Hydrological Risk Analysis under Uncertainty: A Case Study on the Loess Plateau, China. Entropy 2016, 19, 609. [Google Scholar] [CrossRef]
- Fan, Y.R.; Huang, W.W.; Huang, G.H.; Huang, K.; Li, Y.P.; Kong, X.M. Bivariate hydrologic risk analysis based on a coupled entropy-copula method for the Xiangxi River in the Three Gorges Reservoir area, China. Theor. Appl. Climatol. 2016, 125, 381–397. [Google Scholar] [CrossRef]
- Liu, D.F.; Wang, D.; Wu, J.C.; Wang, Y.K.; Wang, L.C.; Zou, X.Q.; Chen, Y.F.; Chen, X. A risk assessment method based on RBF artificial neural network-cloud model for urban water hazard. J. Intell. Fuzzy Syst. 2014, 27, 2409–2416. [Google Scholar]
- Li, D.Y.; Du, Y. Artificial Intelligence with Uncertainty; National Defence Industry Press: Beijing, China, 2005. (In Chinese) [Google Scholar]
- Chen, J.F.; Zhao, S.F.; Shao, Q.X.; Wang, H.M. Risk Assessment on drought disaster in China based on integrative cloud model. Res. J. Appl. Sci. Eng. Technol. 2012, 4, 1137–1146. [Google Scholar]
- Zhang, Q.W.; Zhang, Y.Z.; Zhong, M. A cloud model based approach for multi-hierarchy fuzzy comprehensive evaluation of reservoir-induced seismic risk. J. Hydraul. Eng. 2014, 45, 87–95. (In Chinese) [Google Scholar]
- Wang, D.; Ding, H.; Singh, V.P.; Shang, X.S.; Liu, D.F.; Wang, Y.K.; Zeng, X.K.; Wu, J.C.; Wang, L.C.; Zou, X.Q. A hybrid wavelet analysis-cloud model data-extending approach formeteorologic and hydrologic time series. J. Geophys. Res. Atmos. 2015, 120, 1038–1047. [Google Scholar]
- Wang, D.; Liu, D.F.; Ding, H.; Singh, V.P.; Wang, Y.K.; Zeng, X.K.; Wu, J.C.; Wang, L.C. A cloud model-based approach for water quality assessment. Environ. Res. 2016, 148, 24–35. [Google Scholar] [CrossRef] [PubMed]
- Wang, D.; Zeng, D.B.; Singh, V.P.; Xu, P.C.; Liu, D.F.; Wang, Y.K.; Zeng, X.K.; Wu, J.C.; Wang, L.C. A multidimension cloud model-based approach for water quality assessment. Environ. Res. 2016, 149, 113–121. [Google Scholar] [CrossRef] [PubMed]
- Fu, Q.; Meng, F.X.; Li, T.X.; Liu, D.; Gong, F.L.; Amgad, O.; Li, Y.T. Cloud model-based analysis of regional sustainable water resource utilization schemes. Int. J. Agric. Biol. Eng. 2016, 9, 67–75. [Google Scholar]
- Shannon, C.E. A mathematical theory of communications. Bell Syst. Tech. J. 1948, 27, 379–423. [Google Scholar] [CrossRef]
- Karmeshu, J. Entropy Measures, Maximum Entropy Principle and Emerging Applications; Springer: New York, NY, USA, 2003. [Google Scholar]
- Feng, S.Y. Information entropy and the principle of maximun entropy. Water Conserv. Hydropower Technol. 1995, 22, 24–29. [Google Scholar]
- Jin, J.L.; Ding, J. Water Resources Systems Engineering; Sichuan Science and Technology Publishing House: Chengdu, China, 2002. (In Chinese) [Google Scholar]
- Yang, J.; Chang, J.X.; Wang, Y.M.; Li, Y.Y.; Hu, H.; Chen, Y.T.; Huang, Q.; Yao, J. Comprehensive drought characteristics analysis based on a nonlinear multivariate drought index. J. Hydrol. 2018, 557, 651–667. [Google Scholar] [CrossRef]
- Huang, S.Z.; Hou, B.B.; Chang, J.X.; Huang, Q.; Chen, Y.T. Spatial-temporal change in precipitation patterns based on the cloud model across the Wei River Basin, China. Theor. Appl. Climatol. 2015, 120, 391–401. [Google Scholar] [CrossRef]
- Fischer, T.; Gemmer, M.; Su, B.; Scholten, T. Hydrological long-term dry and wet periods in the Xijiang River basin, South China. Hydrol. Earth Syst. Sci. 2013, 17, 135–148. [Google Scholar] [CrossRef]
- Zhou, Y.L.; Zhou, P.; Jin, J.L.; Li, J. Establishment of hydrological drought index based on sources of regional water supply and its application to drought frequency analysis for Kunming. J. Hydraul. Eng. 2014, 45, 1075–1083. (In Chinese) [Google Scholar]
- China Meteorological Administration. Classification of Meteorological Drought, GB/T20481-2006; China Meteorological Administration: Beijing, China, 2006. (In Chinese)


| Drought Index | I | II | III | IV | V |
|---|---|---|---|---|---|
| Anomaly Percentage of Precipitation (Pa) | −15 < Pa | −30 < Pa ≤ −15 | −40 < Pa ≤ −30 | −45 < Pa ≤ −40 | Pa ≤ −45 |
| Anomaly Percentage of Streamflow (Ra) | −10 < Ra | −30 < Ra ≤ −10 | −50 < Ra ≤ −30 | −80 < Ra ≤ −50 | Ra ≤ −80 |
| Levels | Pa | Ra | ||||
|---|---|---|---|---|---|---|
| Ex | En | He | Ex | En | He | |
| I | −15.00 | 5.20 | 0.01 | −10.00 | 6.93 | 0.01 |
| II | −22.50 | 5.20 | 0.01 | −20.00 | 6.93 | 0.01 |
| III | −35.00 | 3.47 | 0.01 | −40.00 | 6.93 | 0.01 |
| IV | −42.50 | 1.73 | 0.01 | −65.00 | 10.40 | 0.01 |
| V | −45.00 | 1.73 | 0.01 | −80.00 | 10.40 | 0.01 |
| Year | Certainty Degree Component | Drought Risk Level Characteristics di | Drought Risk Levels | ||||||||||
|---|---|---|---|---|---|---|---|---|---|---|---|---|---|
| I | II | III | IV | V | PCMEP | AGA | PCM | CM | PCMEP | AGA | PCM | CM | |
| 1956 | 0.9993 | 0.0007 | 0.0000 | 0.0000 | 0.0000 | 1.0007 | 1.0009 | 1.5512 | 1.1002 | I | I | II | I |
| 1957 | 1.0000 | 0.0000 | 0.0000 | 0.0000 | 0.0000 | 1.0000 | 1.0000 | 1.0657 | 1.0000 | I | I | I | I |
| 1958 | 0.9668 | 0.0332 | 0.0000 | 0.0000 | 0.0000 | 1.0332 | 1.0351 | 1.6086 | 1.1812 | I | I | II | I |
| 1959 | 0.5317 | 0.4683 | 0.0000 | 0.0000 | 0.0000 | 1.4683 | 1.4534 | 2.1213 | 1.3764 | I | I | II | I |
| 1960 | 0.0000 | 0.0001 | 0.4882 | 0.6187 | 0.0031 | 3.9500 | 2.2011 | 3.5677 | 3.3698 | IV | II | IV | III |
| 1961 | 0.9761 | 0.0239 | 0.0000 | 0.0000 | 0.0000 | 1.0239 | 1.2897 | 1.8325 | 1.2584 | I | I | II | I |
| 1962 | 0.9992 | 0.0008 | 0.0000 | 0.0000 | 0.0000 | 1.0008 | 1.0009 | 1.5230 | 1.0410 | I | I | II | I |
| 1963 | 0.0002 | 0.1585 | 0.8381 | 0.0033 | 0.0000 | 2.8445 | 2.2253 | 2.8793 | 2.0469 | III | II | III | II |
| 1964 | 0.9737 | 0.0263 | 0.0000 | 0.0000 | 0.0000 | 1.0263 | 1.1043 | 1.8198 | 1.2320 | I | I | II | I |
| 1965 | 1.0000 | 0.0000 | 0.0000 | 0.0000 | 0.0000 | 1.0000 | 1.0000 | 1.1020 | 1.0000 | I | I | I | I |
| 1966 | 1.0000 | 0.0000 | 0.0000 | 0.0000 | 0.0000 | 1.0000 | 1.0000 | 1.0052 | 1.0000 | I | I | I | I |
| 1967 | 0.2746 | 0.7253 | 0.0000 | 0.0000 | 0.0000 | 1.7254 | 1.7139 | 2.0508 | 1.3546 | II | II | II | I |
| 1968 | 1.0000 | 0.0000 | 0.0000 | 0.0000 | 0.0000 | 1.0000 | 1.0000 | 1.0244 | 1.0000 | I | I | I | I |
| 1969 | 0.1679 | 0.8321 | 0.0001 | 0.0000 | 0.0000 | 1.8322 | 1.8196 | 2.0464 | 1.4142 | II | II | II | I |
| 1970 | 1.0000 | 0.0000 | 0.0000 | 0.0000 | 0.0000 | 1.0000 | 1.0000 | 1.2222 | 1.0000 | I | I | I | I |
| 1971 | 1.0000 | 0.0000 | 0.0000 | 0.0000 | 0.0000 | 1.0000 | 1.0000 | 1.0094 | 1.0000 | I | I | I | I |
| 1972 | 0.9470 | 0.0530 | 0.0000 | 0.0000 | 0.0000 | 1.0530 | 1.0839 | 1.8381 | 1.2430 | I | I | II | I |
| 1973 | 1.0000 | 0.0000 | 0.0000 | 0.0000 | 0.0000 | 1.0000 | 1.0000 | 1.1280 | 1.0120 | I | I | I | I |
| 1974 | 1.0000 | 0.0000 | 0.0000 | 0.0000 | 0.0000 | 1.0000 | 1.0000 | 1.0240 | 1.0000 | I | I | I | I |
| 1975 | 0.2274 | 0.7725 | 0.0001 | 0.0000 | 0.0000 | 1.7727 | 1.6648 | 2.1923 | 1.4541 | II | II | II | I |
| 1976 | 1.0000 | 0.0000 | 0.0000 | 0.0000 | 0.0000 | 1.0000 | 1.0000 | 1.1717 | 1.0896 | I | I | I | I |
| 1977 | 0.0051 | 0.8083 | 0.1866 | 0.0000 | 0.0000 | 2.1815 | 2.0901 | 2.4942 | 2.2963 | II | II | II | II |
| 1978 | 1.0000 | 0.0000 | 0.0000 | 0.0000 | 0.0000 | 1.0000 | 1.0000 | 1.2832 | 1.0006 | I | I | I | I |
| 1979 | 1.0000 | 0.0000 | 0.0000 | 0.0000 | 0.0000 | 1.0000 | 1.0000 | 1.3440 | 1.0032 | I | I | I | I |
| 1980 | 0.0606 | 0.9364 | 0.0031 | 0.0000 | 0.0000 | 1.9425 | 1.8819 | 2.3590 | 1.5577 | II | II | II | II |
| 1981 | 0.8319 | 0.1681 | 0.0000 | 0.0000 | 0.0000 | 1.1681 | 1.1536 | 1.9614 | 1.2711 | I | I | II | I |
| 1982 | 0.0000 | 0.0032 | 0.9956 | 0.0012 | 0.0000 | 2.9980 | 2.5808 | 2.9886 | 2.9413 | III | III | III | III |
| 1983 | 1.0000 | 0.0000 | 0.0000 | 0.0000 | 0.0000 | 1.0000 | 1.0000 | 1.1234 | 1.0057 | I | I | I | I |
| 1984 | 0.0430 | 0.9563 | 0.0007 | 0.0000 | 0.0000 | 1.9576 | 1.9557 | 2.2080 | 1.8471 | II | II | II | II |
| 1985 | 0.9917 | 0.0083 | 0.0000 | 0.0000 | 0.0000 | 1.0083 | 1.1852 | 1.7590 | 1.1729 | I | I | II | I |
| 1986 | 1.0000 | 0.0000 | 0.0000 | 0.0000 | 0.0000 | 1.0000 | 1.0000 | 1.0091 | 1.0000 | I | I | I | I |
| 1987 | 0.0000 | 0.0002 | 0.9993 | 0.0005 | 0.0000 | 3.0003 | 2.9898 | 3.1373 | 3.0560 | III | III | III | III |
| 1988 | 0.0000 | 0.0002 | 0.9373 | 0.0572 | 0.0053 | 3.0676 | 2.8540 | 3.2212 | 3.0913 | III | III | III | III |
| 1989 | 0.0000 | 0.0011 | 0.9748 | 0.0233 | 0.0007 | 3.0236 | 2.7849 | 3.0502 | 2.9807 | III | III | III | III |
| 1990 | 0.9996 | 0.0004 | 0.0000 | 0.0000 | 0.0000 | 1.0004 | 1.0003 | 1.4557 | 1.1071 | I | I | I | I |
| 1991 | 1.0000 | 0.0000 | 0.0000 | 0.0000 | 0.0000 | 1.0000 | 1.0000 | 1.3010 | 1.0767 | I | I | I | I |
| 1992 | 0.0000 | 0.0016 | 0.9983 | 0.0001 | 0.0000 | 2.9985 | 2.9978 | 3.0321 | 2.9583 | III | III | III | III |
| 1993 | 0.0000 | 0.0006 | 0.9911 | 0.0077 | 0.0006 | 3.0083 | 2.8755 | 3.1627 | 3.0284 | III | III | III | III |
| 1994 | 1.0000 | 0.0000 | 0.0000 | 0.0000 | 0.0000 | 1.0000 | 1.0000 | 1.0660 | 1.0000 | I | I | I | I |
| 1995 | 1.0000 | 0.0000 | 0.0000 | 0.0000 | 0.0000 | 1.0000 | 1.0000 | 1.1729 | 1.0001 | I | I | I | I |
| 1996 | 0.9620 | 0.0380 | 0.0000 | 0.0000 | 0.0000 | 1.0380 | 1.0374 | 1.6376 | 1.1760 | I | I | II | I |
| 1997 | 1.0000 | 0.0000 | 0.0000 | 0.0000 | 0.0000 | 1.0000 | 1.0000 | 1.0093 | 1.0000 | I | I | I | I |
| 1998 | 1.0000 | 0.0000 | 0.0000 | 0.0000 | 0.0000 | 1.0000 | 1.0000 | 1.0151 | 1.0000 | I | I | I | I |
| 1999 | 1.0000 | 0.0000 | 0.0000 | 0.0000 | 0.0000 | 1.0000 | 1.0000 | 1.0017 | 1.0000 | I | I | I | I |
| 2000 | 1.0000 | 0.0000 | 0.0000 | 0.0000 | 0.0000 | 1.0000 | 1.0000 | 1.1185 | 1.0401 | I | I | I | I |
| 2001 | 1.0000 | 0.0000 | 0.0000 | 0.0000 | 0.0000 | 1.0000 | 1.0000 | 1.0790 | 1.0000 | I | I | I | I |
| 2002 | 1.0000 | 0.0000 | 0.0000 | 0.0000 | 0.0000 | 1.0000 | 1.0000 | 1.2917 | 1.0033 | I | I | I | I |
| 2003 | 0.0363 | 0.9606 | 0.0031 | 0.0000 | 0.0000 | 1.9668 | 1.9602 | 2.2427 | 2.1218 | II | II | II | II |
| 2004 | 0.9884 | 0.0116 | 0.0000 | 0.0000 | 0.0000 | 1.0116 | 1.2318 | 1.7656 | 1.2164 | I | I | II | I |
| 2005 | 1.0000 | 0.0000 | 0.0000 | 0.0000 | 0.0000 | 1.0000 | 1.0000 | 1.3727 | 1.0041 | I | I | I | I |
| 2006 | 0.5643 | 0.4357 | 0.0000 | 0.0000 | 0.0000 | 1.4357 | 1.4073 | 2.1096 | 1.3524 | I | I | II | I |
| 2007 | 0.9999 | 0.0001 | 0.0000 | 0.0000 | 0.0000 | 1.0001 | 1.0001 | 1.4306 | 1.0130 | I | I | I | I |
| 2008 | 1.0000 | 0.0000 | 0.0000 | 0.0000 | 0.0000 | 1.0000 | 1.0000 | 1.3146 | 1.0008 | I | I | I | I |
| 2009 | 0.0000 | 0.0000 | 0.0267 | 0.7417 | 0.2316 | 4.2049 | 3.6700 | 3.6456 | 3.6555 | IV | IV | IV | IV |
| 2010 | 0.0021 | 0.3307 | 0.6673 | 0.0000 | 0.0000 | 2.6652 | 2.1227 | 2.8288 | 1.7955 | III | II | III | II |
| 2011 | 0.0000 | 0.0000 | 0.9977 | 0.0023 | 0.0000 | 3.0023 | 2.9760 | 3.4568 | 3.2522 | III | III | III | III |
| Drought Index | PCMEP | AGA | PCM | CM |
|---|---|---|---|---|
| Anomaly Percentage of Precipitation | −0.8121 | −0.7512 | −0.7414 | −0.7572 |
| Anomaly Percentage of Streamflow | −0.8003 | −0.6877 | −0.6559 | −0.6516 |
| Drought Risk Level | I | II | III | IV | V | ||
|---|---|---|---|---|---|---|---|
| Certainty Degree Component | PCMEP | 0.0000 | 0.0002 | 0.4182 | 0.6646 | 0.0070 | |
| AGA | 0.0000 | 0.0002 | 0.3900 | 0.6176 | 0.0070 | ||
| PCM | 0.0000 | 0.0001 | 0.4150 | 0.5940 | 0.0062 | ||
| CM | 0.0000 | 0.0037 | 0.4055 | 0.4269 | 0.1245 | ||
| Boxplot Parameters | PCMEP AGA PCM | Maximum | 0.0000 | 0.0120 | 0.9989 | 0.9997 | 0.4347 |
| Upper quartiles | 0.0000 | 0.0001 | 0.6296 | 0.8389 | 0.0071 | ||
| Median | 0.0000 | 0.0000 | 0.4342 | 0.5629 | 0.0035 | ||
| Lower quartiles | 0.0000 | 0.0000 | 0.1515 | 0.3625 | 0.0009 | ||
| Minimum | 0.0000 | 0.0000 | 0.0000 | 0.0000 | 0.0000 | ||
| CM | Maximum | 0.0012 | 0.0255 | 0.8684 | 0.5373 | 0.4364 | |
| Upper quartiles | 0.0000 | 0.0048 | 0.4733 | 0.4659 | 0.2536 | ||
| Median | 0.0000 | 0.0028 | 0.4131 | 0.4009 | 0.1932 | ||
| Lower quartiles | 0.0000 | 0.0017 | 0.3712 | 0.3695 | 0.0572 | ||
| Minimum | 0.0000 | 0.0001 | 0.3236 | 0.0259 | 0.0001 | ||
© 2018 by the authors. Licensee MDPI, Basel, Switzerland. This article is an open access article distributed under the terms and conditions of the Creative Commons Attribution (CC BY) license (http://creativecommons.org/licenses/by/4.0/).
Share and Cite
Bai, X.; Wang, Y.; Jin, J.; Qi, X.; Wu, C. Precondition Cloud and Maximum Entropy Principle Coupling Model-Based Approach for the Comprehensive Assessment of Drought Risk. Sustainability 2018, 10, 3236. https://doi.org/10.3390/su10093236
Bai X, Wang Y, Jin J, Qi X, Wu C. Precondition Cloud and Maximum Entropy Principle Coupling Model-Based Approach for the Comprehensive Assessment of Drought Risk. Sustainability. 2018; 10(9):3236. https://doi.org/10.3390/su10093236
Chicago/Turabian StyleBai, Xia, Yimin Wang, Juliang Jin, Xiaoming Qi, and Chengguo Wu. 2018. "Precondition Cloud and Maximum Entropy Principle Coupling Model-Based Approach for the Comprehensive Assessment of Drought Risk" Sustainability 10, no. 9: 3236. https://doi.org/10.3390/su10093236
APA StyleBai, X., Wang, Y., Jin, J., Qi, X., & Wu, C. (2018). Precondition Cloud and Maximum Entropy Principle Coupling Model-Based Approach for the Comprehensive Assessment of Drought Risk. Sustainability, 10(9), 3236. https://doi.org/10.3390/su10093236