Article

Banding of Fertilizer Improves Phosphorus Acquisition and Yield of Zero Tillage Maize by Concentrating Phosphorus in Surface Soil

1
School of Veterinary and Life Sciences, Murdoch University, 6150 Murdoch, WA, Australia
2
Soil Science Division, Bangladesh Agricultural Research Institute, 1701 Gazipur, Bangladesh
3
Grains Industry, Department of Agriculture and Food, Government of Western Australia, 6151 Kensington, WA, Australia
4
Global Centre for Environmental Remediation (GCER), University of Newcastle, 2308 Callaghan, NSW, Australia
5
Irrigation & Water Management Division, Bangladesh Rice Research Institute, 1701 Gazipur, Bangladesh
6
Tuber Crops Research Centre, Bangladesh Agricultural Research Institute, 1701 Gazipur, Bangladesh
*
Author to whom correspondence should be addressed.
Sustainability 2018, 10(9), 3234; https://doi.org/10.3390/su10093234
Submission received: 10 July 2018 / Revised: 5 September 2018 / Accepted: 7 September 2018 / Published: 10 September 2018
(This article belongs to the Section Sustainable Agriculture)

Abstract

:
Zero tillage increases stratification of immobile nutrients such as P. However, it is unclear whether near-surface stratification of soil P eases or hampers P uptake by maize (Zea mays L.) which needs an optimum P supply at/before six–leaf–stage to achieve potential grain yield. The aim of the three-year study was to determine whether P stratification, under zero tillage, impaired yield of maize and which P placement methods could improve P uptake on an Aeric Albaquept soil subgroup. Phosphorus fertilizer was placed by: (a) broadcasting before final tillage and sowing of seeds; (b) surface banding beside the row; and (c) deep banding beside the row (both the band placements were done at three–four leaf stage) Phosphorus treatments were repeated for 3 years along with three tillage practices viz.: (a) zero tillage (ZT); (b) conventional tillage (12 cm; CT); and (c) deep tillage (25 cm; DT). In the third year, all the tillage practices gave similar yield of Bangladesh Agricultural Research Institute (BARI) hybrid maize–5, but the highest grain yield was obtained by surface band P placement. After three years of tillage and P placements, the root mass density (RMD) at 0–6 cm depth increased significantly from 1.40 mg cm−3 in DT under deep band placement to 1.98 mg cm−3 in ZT under surface band placement, but not at the other depths. The combination of ZT practices, with broadcast or surface band placement methods, produced the highest available, and total P, content in soil at 0–6 cm depth after harvesting of maize. Accordingly, a significant increase in P uptake by maize was also found with surface banding of P alone and also in combination with ZT. Organic carbon, and total N, also increased significantly at depths of 0–6 cm after three years in ZT treatments with P placed in bands. By contrast, CT and DT practices, under all placement methods, resulted in an even distribution of P up to 24 cm depth. Phosphorus application, by surface banding at the three–four leaf stage, led to increased P uptake at early growth and silking stages, which resulted in highest yield regardless of tillage type through increased extractable P in the soil. Even though ZT increased P stratification near the soil surface, and it increased plant available water content (PAWC) and RMD in the 0–6 cm depth, as did surface banding, it did not improve maize grain yield. Further research is needed to understanding the contrasting maize grain yield responses to P stratification.

1. Introduction

The adoption of zero tillage (ZT) and minimum tillage has increased in recent years in South Asia [1,2]. However, there are mixed reports about the outcome from zero tillage for maize grain yield. Zugec [3] reported that the highest and the most stable maize grain yields were obtained with conventional tillage (CT). A 14% maize yield decline was found in ZT after 20–years in a field experiment in a cool region [4]. Grain yield decrease for ZT has also been reported in other cooler regions [5]. While yield decline was reported in the cool and temperate region, in sub-tropical and humid and sub-humid regions, the state of affairs are different under no-tillage (NT)/ZT with increased yield and economics relative to conventional practices [6,7,8,9]. The NT and planting in raised beds with residue retention, judicious crop rotation, and nutrient management are getting increasingly adopted in recent years in equalising the production cost [6,9,10]. Four-year average maize yields were equal for NT, chisel plough, and moldboard plough systems [11]. Whereas, for maize as well as for the rice–maize system, permanent beds and strip tillage provided yield similar to conventional tillage [2]. Though farmers have been using P fertilizer for several decades [12], many Asian soils are deficient in plant-available P due in part to fertilizer P fixation and sorption reactions by the soil [13,14]. Due to the low soil P availability and the rapidly rising cost of P fertilizers there is a need to examine agronomic practices [15] like tillage type and fertilizer management techniques that can increase P fertilizer use efficiency.
A high P content in maize plants before the 6–leaf stage is critical for crops to achieve potential grain yield [16]. The maize (Zea mays L.) root system extends to the middle of the inter-row space by the 6-leaf stage but before that stage P acquisition may be limited by positional unavailability of soil and fertilizer P. Phosphorus in available form is vital during the early growth stages of plants [17] especially when the diffusion of P to plant roots is reduced by cold soil temperatures [18] such as those occurring in the winter (rabi season; November to March/April) when most of maize is grown in most of the maize growing areas of south Asia [19]. During approximately the first six weeks after planting, P that is banded close to the maize rows is more likely to be available for maize–plant uptake than the same amount of P broadcast over the entire soil surface [18,20,21,22].
Zero- and minimum tillage (in comparison with CT) generally increase SOM close to the soil surface and hence may stratify soil P while the limited mixing of drilled P fertiliser will also stratify P close to the soil surface [23,24,25]. The greater content of organic matter in the surface soil caused the higher p values in the soil layer under ZT/minimum disturbance practice. The reduced mixing of P in soils with high organic matter allows the greater soluble P concentrations by occupying the P-fixation sites and thereby increasing the plant-available P in surface soil [26]. Zero-till practices also increased the labile P fraction in the upper layer of non-cracking clay soil [27,28]. In addition, soil P responds to placement methods [29,30] through changes in the P pools (organic and inorganic) in the soil [24,28,31,32,33,34]. Even through ZT and P application methods may determine P distribution in the root zone of maize, few studies have assessed crop response in the medium term to these treatments that may increase P stratification [35,36].
Roots adapt to low P availability [37] by root hair elongation and proliferation [38,39] and modification of root architecture to maximize P acquisition efficiency [40,41,42]. So, most of the studies were done in tilled soils. How the root growth and P uptake will be affected by stratification in ZT soil has not been explored fully. Indeed, high phosphorus availability stimulates the lateral root branching density for maize in the P-enriched soil [43,44]. Zhu et al. [45] and Zhu et al. [46] in their study found that maize genotypes which have shallower seminal roots had higher growth in low P soils in the field and glasshouse. Shallow basal roots are very important for topsoil foraging and P acquisition efficiency in annual crops. Reymond et al. [47] and Lynch et al. [48] found in their studies that low P favours lateral root growth by reducing primary root elongation and increasing lateral root elongation and density. Shallower root systems acquired more P than deep ones in topsoil with stratified P, by concentrating root foraging in the topsoil [49]. Given the importance of early supply of available P to maize, we hypothesized that banded P placements would increase yield, and P availability relative to broadcast P application especially under ZT.
This experiment was undertaken with the following objectives to determine:
  • The effects of P placement and tillage methods on the stratification of available and total P over a 3-year period;
  • The P placement methods that optimize P uptake and yield by maize with zero tillage; and
  • The effects of tillage practices on RMD, SOM, total N, and soil physical properties.

2. Materials and Methods

2.1. Climate

During the three growing seasons of 2009–2010, 2010–2011 and 2011–2012, irrigation was applied as required to supplement 278, 234 mm and 175 mm of rainfall, respectively. The lowest minimum temperature was in January (11 °C) in 2011–2012 (Figure 1). A cool, dry winter prevailed from November to March in the growing area when the minimum and maximum temperature was in the lowest range. The daily mean soil temperature at 4–5 cm depth fluctuated widely among seasons from a maximum of 34 °C in August (hot summer season), to a minimum of 15 °C in January (cool winter season). During the winter season, soil temperature commonly ranges from 19–15 °C in this region [50].

2.2. Description of Experimental Site

A three-year experiment was conducted at the Bangladesh Agricultural Research Institute (BARI), Bangladesh during 2009–2010 to 2011–2012. The study area was located in the agro-ecological zone (AEZ) 28 (Modhupur Tract) at 24°23′ N and 90°08′ E and about 34 km north of Dhaka city. The Grey Terrace Soil is classified as an Aeric Albaquept [51]. The soils are poorly drained, clay loam overlying deeply weathered Modhupur or Piedmont clay. The field is 7.5 m above sea level [51].

2.3. Properties of the Initial Soil

Properties of the initial soil are given in Table 1.

2.4. Treatments and Design

Phosphorus fertilizer (triple superphosphate—[Ca(H2PO4)2·H2O]) was applied following three methods: (a) broadcast according to farmers’ practice during final land preparation; (b) surface banding (application at 2–3 cm depth and 3–5 cm from both sides of the row); and (c) deep band (application at 6–8 cm below the surface 4–6 cm from both sides of the row) (both the band placements were done at three–four leaf stage to minimize sorption of fertilizer P by soil clay particles before plant roots accessed the fertilizer). Soils were irrigated immediately before banding application of P. Three tillage practices applied were: (a) zero tillage (ZT)–a single slit was opened by furrow opener and seeds were sown; (b) conventional tillage (CT)–ploughed by rotary tiller up to 10–12cm depth (two passes); and (c) deep tillage (DT)–tillage by chiseling up to 25 cm depth followed by rotary tillage (three passes). Treatments were arranged in split-plot design with three replications where tillage was assigned to the main plot and P placement methods in the sub-plot. The maize residue was retained at the rate of 30% of its biomass yield for each of the three years of experimentation (Table 2). The sub-plot size was 6 m × 5 m, the unit (replication) plot size was 6 m × 50 m. Maize seeds were sown maintaining 60 cm × 25 cm spacing in all plots.

2.5. Crop and Cropping Season

Maize cv. BARI hybrid maize 5crop duration was 140–145 days from germination to harvest in 3 years of experiment from 2009–2010 to 2011–2012 and can be cultivated in a wide range of edaphic and environmental conditions. In this experiment, maize was grown from late December (sowing) to late May (harvesting) in each of the years of the study.

2.6. Crop Harvesting and Data Collection

As soon as the sowing was done, three 3.6 m2 quadrats (2 m along the row × 1.8 m across the row) in each subplot were designated for data collection. At maturity, the crops were cut at the ground level by hand. Threshing, cleaning, and drying of grain were done separately for each plot to determine weights of grain and stover. Thirty percent (30%) of maize stover was retained in the experimental field every year on the ground but for conventional and deep tillage practices, the residues were incorporated into the soil. In 2009–2010, the maize crop was followed by chili (Lamba marich; Capsicum frutescens L.) and then the land remained fallow until the next maize crop. Chili crop was sown on 5 June 2010 and harvested on 30 October 2010. After harvesting, the whole amount of chili residue was retained in the plot. In 2010–2011 and 2011–2012, the maize crop was followed by mungbean (Vigna radiata L. Wilczek) cv. BARI Mung 5 and then the land remained fallow until the next maize crop. Mungbean crops were sown on 6 June 2011 and 8 June 2012 and harvested on 16 August 2011 and 17 August 2012, respectively. Similar to chili, the whole amount of mungbean residue was retained in the soil (Table 2). The same row spacing and tillage and fertilizer placement practices were followed for the chili and mungbean crops as for maize. Soil samples were collected from 0–6, 7–12, 13–18, 19–24, and 25–30 cm depth from each sub–plot before sowing and/or after harvesting of maize in every year.

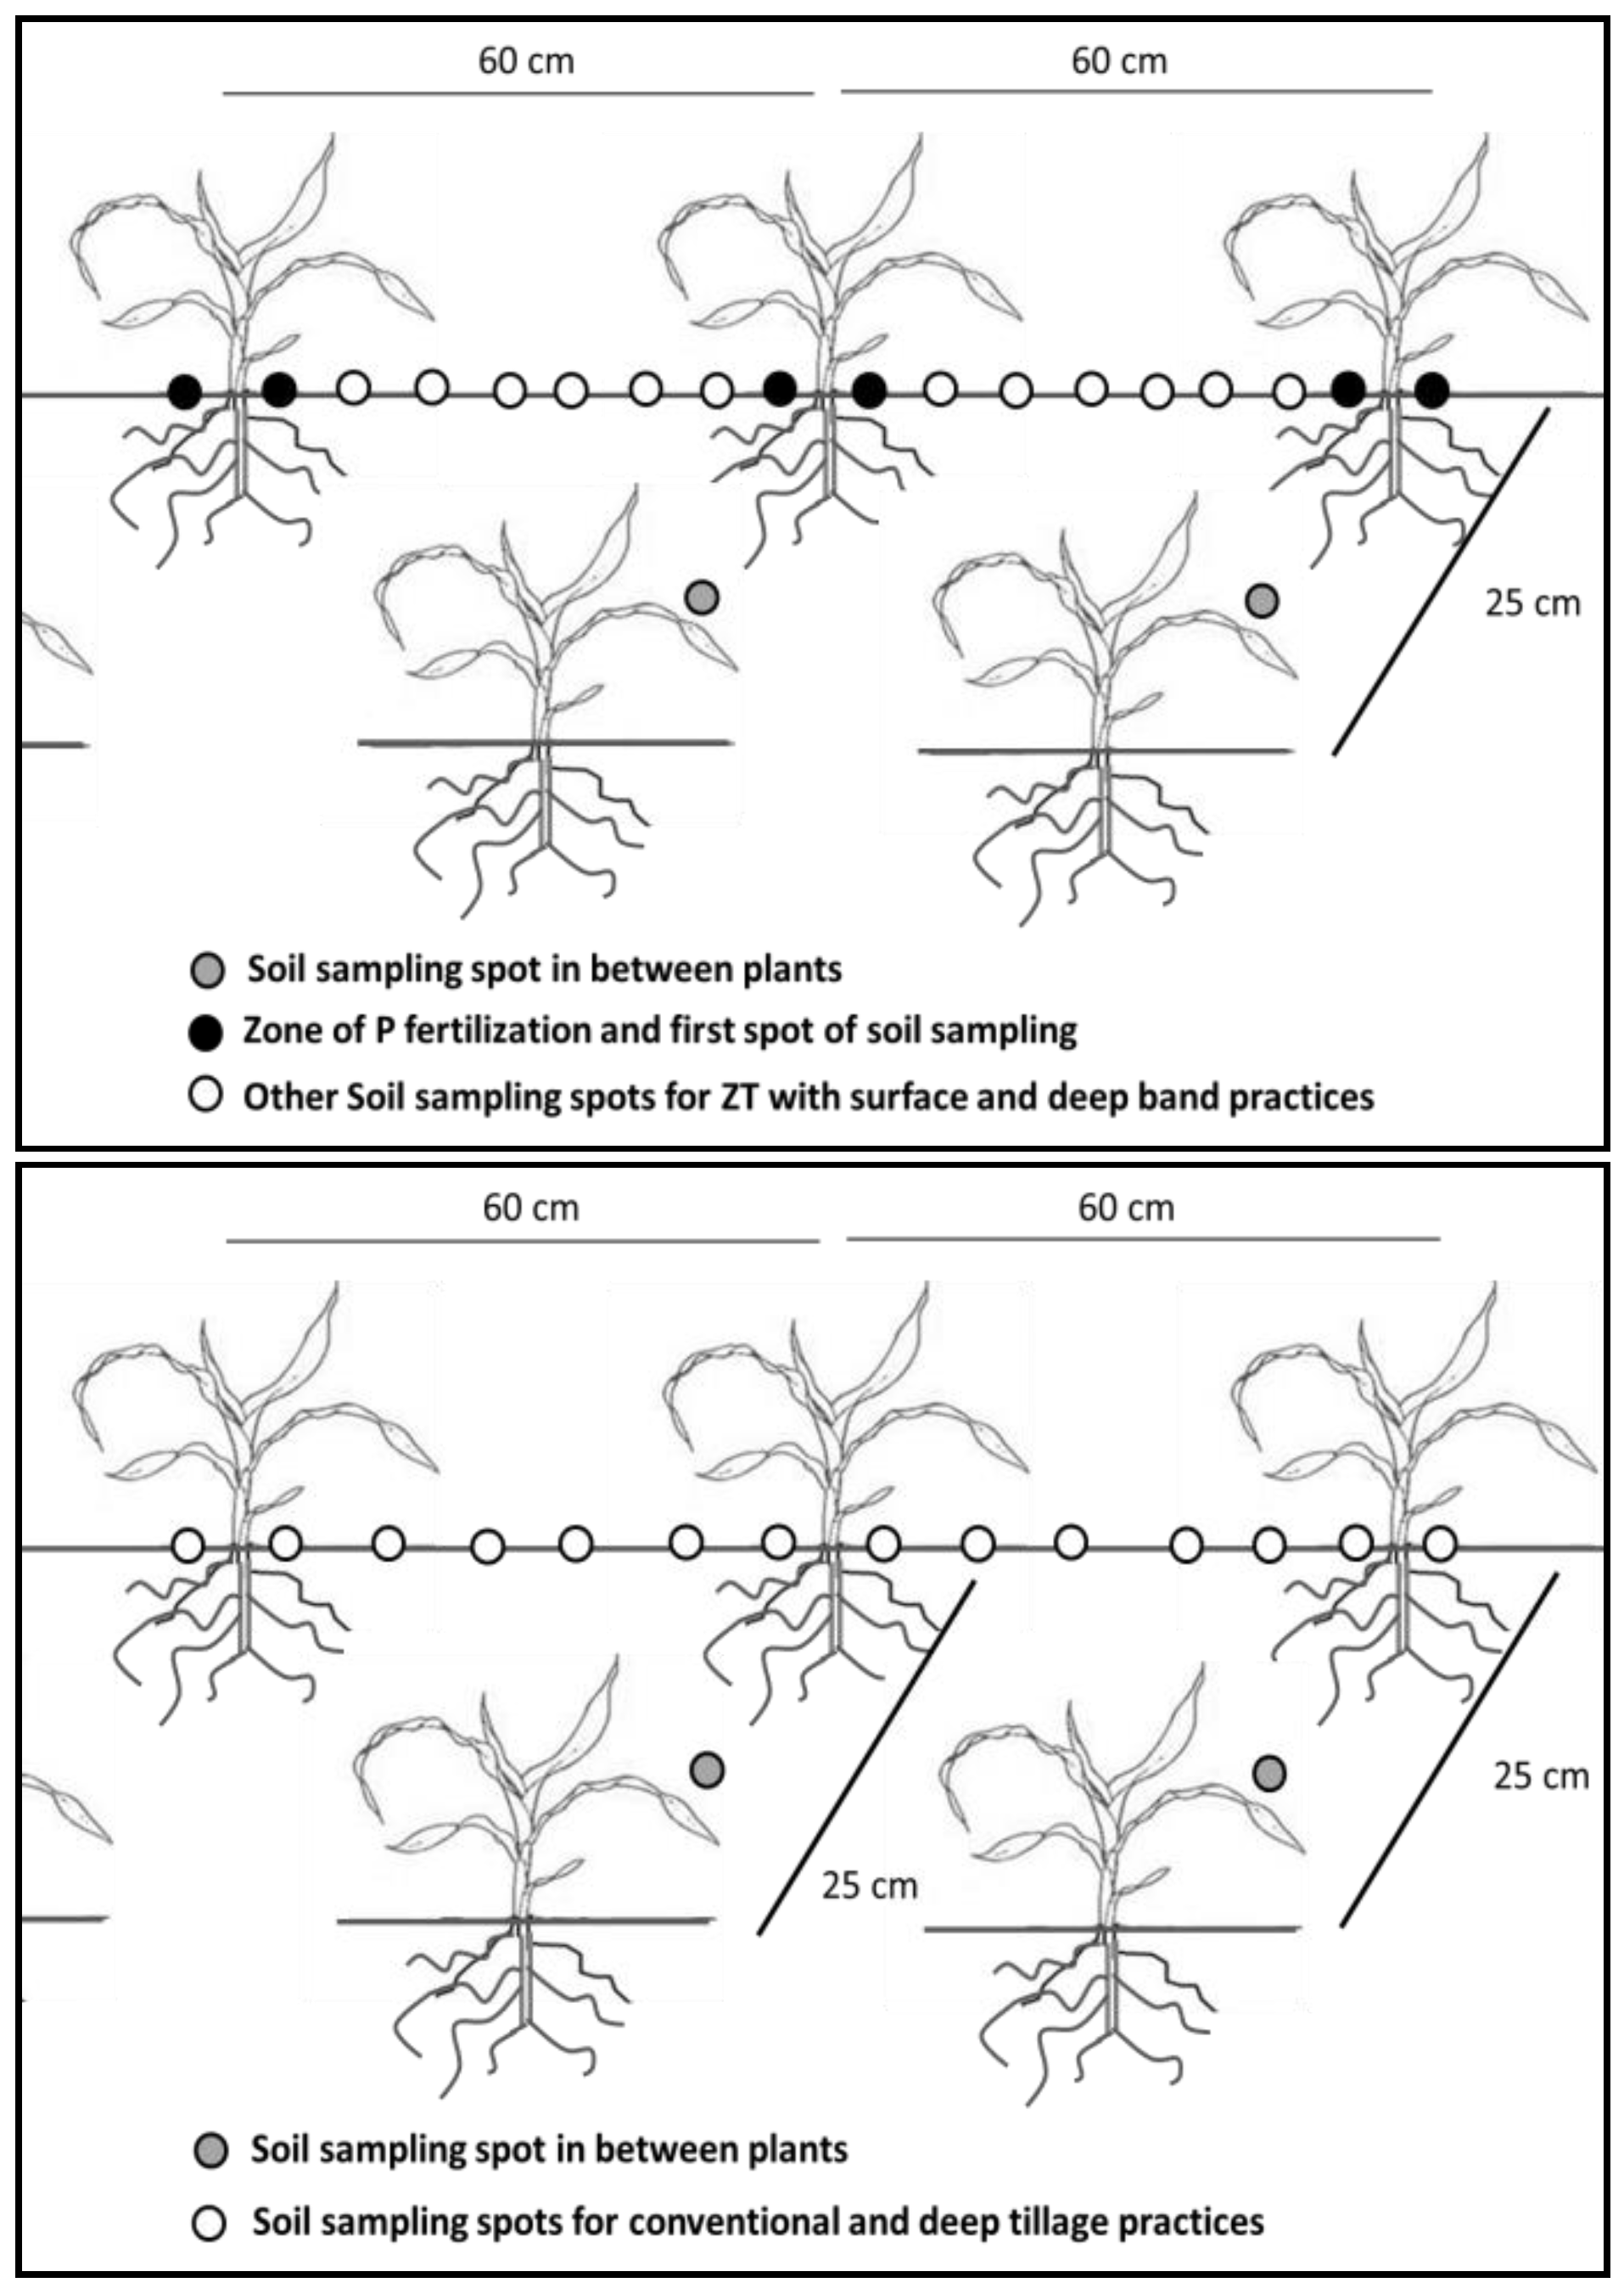
2.7. Collection of Soil Samples and Determination of Different Soil Properties

Soil samples were collected by a push type auger (5 cm diameter). For deep and conventional tillage practices, samples were collected at three different points. As spatial variability of soil nutrients concentration were affected by banding placements, samples were collected at four different points, one on the band and each others were 1 cm apart from their previous one. Then composite samples were prepared for analysis (Figure 2).
Soil samples were then analysed for SOM, total N and extractable P. The SOM was determined by wet oxidation [52] which was then converted to SOC by dividing a factor of 1.72, total N by a modified Kjeldahl method [53], extractable P by the Olsen method [54,55], and total P by using the Kjeldahl digestion method [56]. In the method of extractable P determination [53,54], 5 g soil (<2 mm) is extracted for 30 min with 100 cm3 0.5 NaHCO3 solution (pH adjusted to 8.5). After filtration the phosphate concentration of the solution is measured calorimetrically.
Particle size distribution of the initial soil was analysed by the hydrometer method [57] and the textural class was determined using the USDA texture triangle. The BD and particle density (PD) of the soil samples were determined by core sampler method and pycnometer method, respectively [58]. Moisture content was determined by gravimetric method [57]. The soil porosity was computed from the relationship between BD and PD [58]. Soil field capacity (FC) (−33 kPa) and permanent wilting point (PWP) (−1500 kPa) were measured using pressure plate apparatus, to calculate available water using Equation (1) [57]:
d = ( FC PWP 100 ) × BD × soil   depth .

2.8. Determination of N and P in Maize Shoot and Calculation of Uptake

Concentrations of N and P in the maize shoot at 35 and 70 days after emergence were determined by the Kjeldahl method [53] and the colorimetric method [59,60], respectively.
Total uptake of N/P was then calculated separately for both the stages of maize growth based on respective shoot dry matter content.

2.9. Land Preparation, Seed Sowing/Transplanting, Fertilizer Application and Intercultural Operations

The different field operations from sowing to harvesting of maize are given in Supplementary Material. The chemical fertilizers were applied at a rate of 255 kg N, 55 kg P, 100 kg K, 40 kg S, 1 kg B, and 5 t well-decomposed cow dung; The N was applied as urea, P as triple superphosphate (TSP), K as Murate of Potash (MoP), S as gupsum, and B as Boric acid. One third N and other nutrient containing fertilizers except phosphatic fertilizer were applied during final land preparation. Remaining N was applied in two equal splits at 30 and 55 days after sowing. Phosphatic fertilizer for broadcast method was applied during final land preparation. But, the phosphatic fertilizers for surface band and deep band were applied at the three–four leaf stage. Fertiliser application methods for chilli and mungbean crops grown after maize were the same except only 20 kg N ha−1 was applied to mungbean (during final land preparation) while chilli was fertilised at a rate of 100 kg N, 50 kg P, 50 kg K, and 20 kg Sha−1. Fertilisers were applied according to the application methods followed for maize.

2.10. Roots Analyses

The root mass density (RMD) was measured at maximum vegetative stage (anthesis period) for six soil depths (0–6, 7–12, 13–18, 19–24, 25–30, and 31–50 cm) with an auger sampler 15 cm in diameter [61]. The measurements were done on the plant, between rows as well as between plants. Six (three + three) samples per subplot were taken for RMD analysis. The roots were separated from soil by washing the samples through a submerged 250 μm sieve with running tap water and then the roots retained by and floating on the sieve were collected with tweezers [62].

2.11. P Budgeting

Phosphorus balance was calculated by subtracting all the P exported from soil and P added to soil in the form of mineral fertilizers and by residue return. Every year, the initial P status of soil was the base of the P budget estimation.

2.12. Statistical Analysis

The analyses of variance for crop yields and soil properties were performed following a two-way ANOVA model based on a split plot design and the mean values were compared by Least Significant Difference test at p < 0.05 [63]. All data were statistically analysed with SPSS (Statistical Package for the Social Sciences) software package version 21 (SPSS Inc., Chicago, IL, USA). Computation and preparation of graphs were done using Microsoft Excel 2010 Program. The model used for the split-plot design is the following:
Yijk = μ + αi + γk + (αγ)ik + βj + (αβ)ij + εijk
where, i = 1, …, a indexes the main plot levels, j = 1, …, b indexes the subplot levels, and k = 1, …, r indexes the blocks.

3. Results

3.1. Effect of Tillage Practices and P Placement Methods on Soil Physical Properties

Effects on Soil Bulk Density (BD), Plant Available Water Content (PAWC), and Porosity

The P placement methods had no effects on PAWC and porosity (p > 0.05) at all depth increments (Table 3). By contrast, ZT practices after three years increased PAWC and porosity at 0–6 cm depth (p > 0.05). The main reduction of BD was recorded in ZT at 0–6cm soil depth. The lowest BD (1.42 g cm−3) was recorded in ZT under broadcast and surface band P placement methods at 0–6 cm soil depth whereas the highest (1.55 g cm−3) was in DT under broadcast placement (Table 3). The BD under ZT increased with depth but not with CT or DT. After three years, ZT conserved more moisture than CT and DT at 0–6 cm soil depth (p < 0.05) but at 7–12 and 12–18 cm depths, there was no difference among tillage methods (Table 3).
Throughout the growing season, there was consistently higher soil water at 0–6 cm depth in ZT particularly with surface band placement of P treatment (p < 0.05) (Figure 3). Soil moisture declined to almost wilting point of maize before irrigation was re-applied. At the last sampling, there was no significant difference among the tillage treatments in soil water content due to heavy rainfall in the month of April and the first week of May 2012 (Figure 1) which amounted to 141 mm.

3.2. Root Mass Density of Maize

After three years, ZT with surface band placement of P treatment produced the maximum RMD (1.98 mg cm−3). By contrast, with broadcast and deep band P placement, there was no effect of tillage on RMD (Figure 4). In addition, for CT and DT there was no effect of P placement method on RMD. Below 7 cm depth, the RMD was not significantly affected by tillage and P placement treatments (Figure 4). Zero tillage with surface banding of P shared the highest percentage of root (47%) distributed in 0–6 cm depth of soil which was followed by ZT with broadcasting (41%) and ZT with deep banding (40%) of P fertilizer. The lowest amount of root distributed in 0–6 cm of soil was recorded with DT with deep band P placement method (31%).

3.3. Maize Yield

In the first year of maize (2009–2010), the highest yield was produced in CT (9.1 t ha−1). In 2010–2011, the yield was not significantly affected by tillage or P placement. In 2011–2012, the surface band P placement method gave higher yield (p < 0.05) than other placement methods (Figure 5). The cumulative yield of maize for the first two years of cropping (2009–2010 and 2010–2011) was highest (p < 0.05) (17.7 t ha−1) with surface banding and the lowest with the broadcast method (16.0 t ha−1). Similarly, the cumulative maize yield for the three years (2009–2010, 2010–2011, and 2011–2012) was highest (p < 0.05) with surface banding (26.9 t ha−1) and the lowest with the broadcast method (24.2 t ha−1). The surface band and deep band placement of P fertilizer gave statistically similar cumulative yield of maize. Tillage practices had neither effect on cumulative yield of maize for the first two years of cropping, nor on cumulative yield of maize over the three years of cropping. The yield of maize had increased by 12.4% in the final year of the current study than the first year yield under ZT and surface P banding (Figure 5).

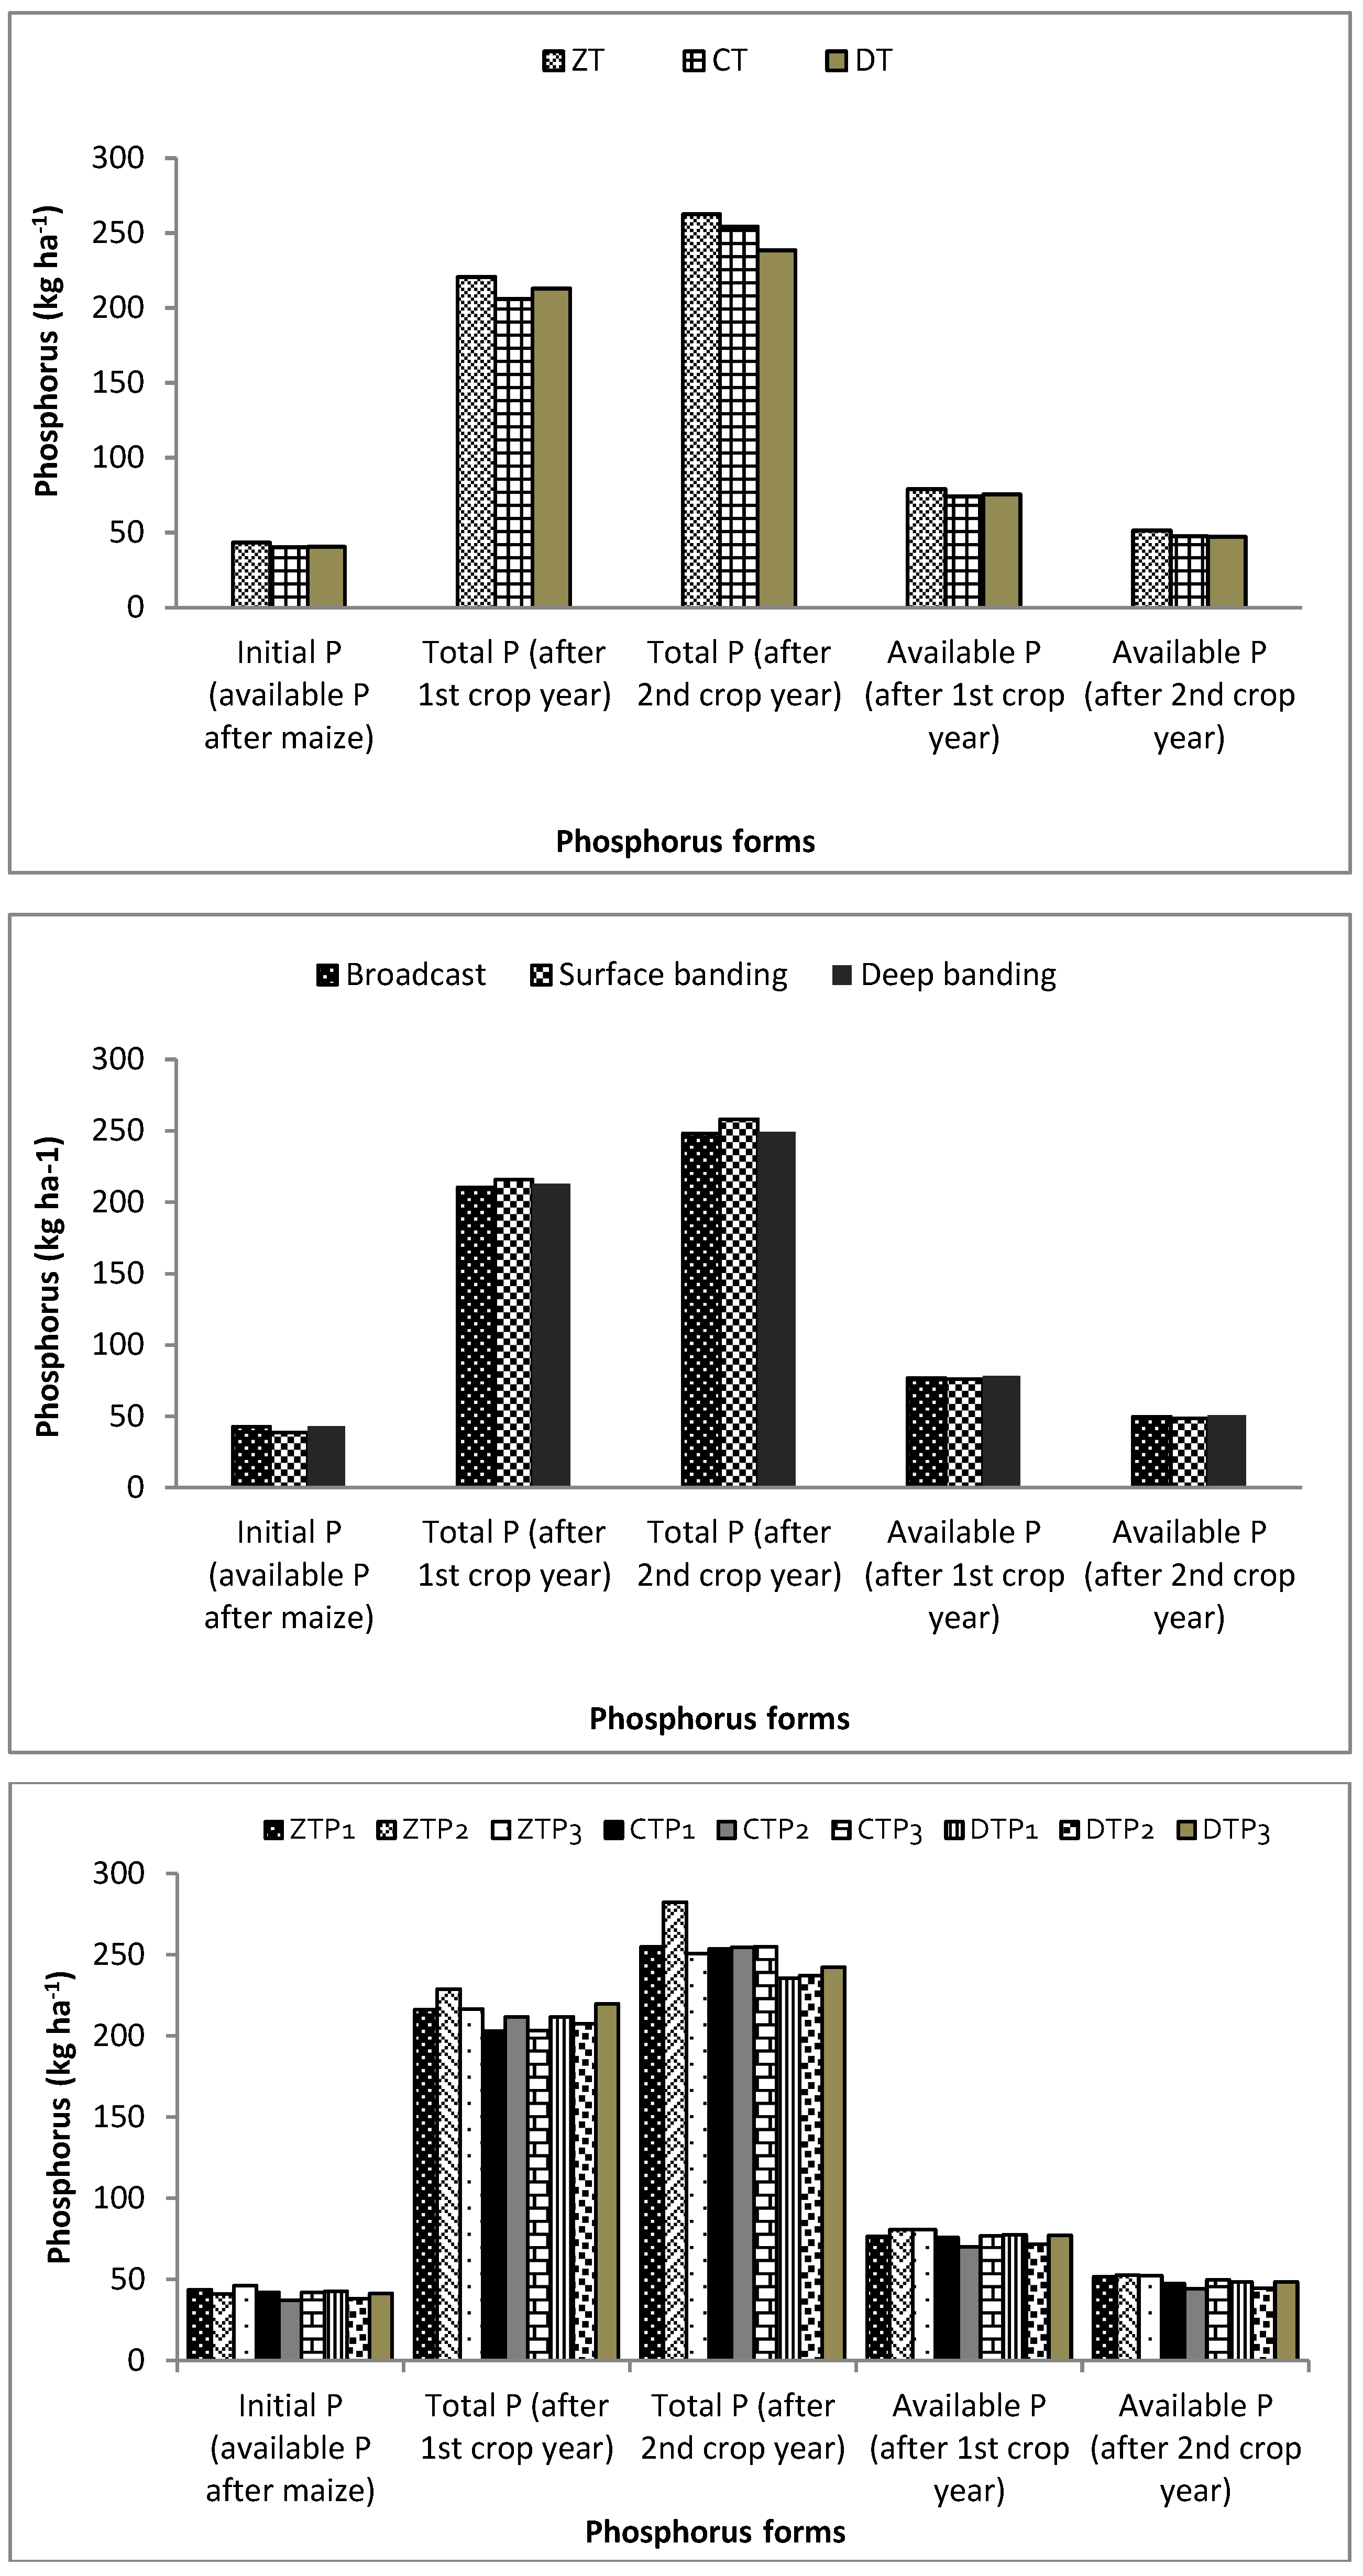
3.4. Available and Total Phosphorus in Soil

The ZT practices especially in combination with broadcast and surface band P placement methods showed the highest available and total P content in soil at 0–6 cm depth after harvesting of maize in 2012. The deep band placement under CT and DT showed the highest total P (230 mg kg−1 and 242 mg kg−1 at 7–12 and 13–18 cm depths, respectively), followed by deep band placement method under DT at the same depths (199 mg kg−1 and 230 mg kg−1 at 7–12 and 13–18 cm depths, respectively). The highest available P levels were also recorded in CT (13.5 and 12mg kg−1 at 7–12 and 13–18 cm depths, respectively) and DT (11.4 and 13mg kg−1 at 7–12 and 13–18 cm depths, respectively) under deep placement method. At 19–24 cm soil depth, available and total P tended to converge to the same value regardless of treatment combinations (Figure 6).

3.5. Organic C (OC) and Total N Status in Soil

Zero tillage with 30% straw retention after three years of maize cultivation resulted in the highest OC status (1.20%) and total N in soil at 0–6 cm depth (Table 4). Tillage practices did not influence SOC status and total N at other depths of soil.

3.6. Maize above Ground Biomass and N and P Uptake by Maize above Ground Biomass

At 35 DAE, ZT had 9.7 and 11.4% higher biomass than CT and DT, while surface banding had 6 and 10.4% higher biomass than CT and DT at 35 DAE. At the silking stage, the surface banding method had the highest biomass (8.2 t ha−1). The highest N uptake in shoot biomass at 35 DAE (11.6 kg ha−1) and 70 DAE (125 kg ha−1) were recorded at ZT under surface banding of Pin the third year (Table 5; p < 0.05). Maize shoots grown in soil under ZT and surface banding also had higher P uptake at 35 DAE and 70 DAE than other treatment combinations.

3.7. Apparent P Budget

Among the tillage practices, ZT practice was recorded with higher balance for both total and available forms than other practices, while surface band P placement method showed the higher total P and equal amount of available P in soil than other placement practices. Among the combinations, ZT with surface band P placement showed the highest P balance for total P and ZT with surface and deep band P placement methods showed similar status of P remain in soil. The ZT had 5% and 6.8% higher available P than DT and CT, respectively, after the first years of cropping, which were 7.4% and 8.5% after the second year cropping than CT and DT, respectively. After the first crop cycle, ZT with surface band P placement method had 4.3 (DT with deep band placement) to 12.8% (ZT with deep band placement) higher total P in soil relative to other practices. After the second crop cycle, ZT with surface band placement had 10.7 (CT with deep band placement) to 18.9% (DT with surface band placement) higher total P relative to other practices (Figure 7).

4. Discussion

Among the P placement methods, surface band application consistently increased yield and in the final year of study increased yield by 1.05 t ha−1 relative to broadcasting and deep band P applications. Deep placement and broadcast application of P were inferior methods of P supply to maize, but not different from one another. Although CT, in the first year of study, produced higher yield than ZT and DT regardless of P application methods, tillage effects were non-significant in the other years (Figure 5a–c and neither did it affect cumulative maize yield over the three years (data not shown). The other crops (chilli in 2009–2010 and mungbean in 2010–2011 and 2011–2012) also showed similar response as maize to P placement methods and tillage practices (data not shown) over the three years. Costa et al. [64] conducted an experiment on Rhodic Paleudult soil for 18 years using broadcast, row-and strip-applied P fertilizer placement (as triple superphosphate) under conventional, no-tillage and strip tillage techniques and reported that although no-tillage promoted numerous changes in soil and plant attributes when compared to CT, no differences were observed with regard to maize grain yield. On the contrary, Fernández and White [65] found that maize grain yields in Urbana, IL, USA in a four year experiment with a maize-soybean rotation under no-till/broadcast, no-till/deep band and strip-till/deep band were significantly affected by tillage and fertilizer placement application. Strip-till/deep band P placement produced 9.43 mg ha−1 yield that was 8% greater than no-till/broadcast and no-till/deep band.
Phosphorus placement effects on maize yield may be connected with P stratification and root growth as significantly higher amounts of available P and total P accumulated under surface band application in the top soil layers along with increased RMD. In addition, the PAWC in 0–6 cm was consistently higher with surface banding of P. Total P at 0–6 cm depth in surface band P placement was 28% and 18% higher than total P under broadcast and deep band application, respectively. In contrast, available P in surface band P placement method at 0–6 cm depth was 100% and 80% higher than available P in deep band and broadcast application, respectively (Figure 6a–f). Soils from 0–6 cm depth under ZT accumulated significantly higher total P by 18% and 10% and available P by 59% and 18% over CT and DT. The increase in maize yield under surface P application might, therefore, be associated with the combined effects of higher RMD (44% out of 4.65 mg cm−3 of roots) which with increased PAWC could enhance uptake of P (from 21% compared to ZT with P broadcasted up to 60% compared to CT with deep banding) and N from available pool in soil. da Costa and Crusciol, [66] and Adee et al. [67] also found nutrient stratification in their experiment on P placement in surface soils under corn crop. They found that the low soil disturbance associated with NT can result in higher nutrient concentration near the soil surface (stratification), especially for immobile nutrients such as P. However, P stratification is not always reported with NT and shallow P placement [68]. Jones et al. [69] conducted an experiment with >30 year CT (CTCT), 10 year NT (NTNT), CT converted to NT in 2005 (CTNT), and NT converted to CT in 2005 (NTCT) at the Central Agricultural Research Center, Moccasin (self-mulching clay) where P fertilizer (either MAP or TSP) was applied with the seed in all years of the study at 1.9 cm to 2.5 cm deep. The study reported that vertical P stratification patterns were not altered by tillage and neither was there a definite pattern of P stratification. Again, results from the study of Hansel et al. [70,71] showed that the strip tillage with deep band P placement treatment contributed to enhance soybean root growth at deeper soil layers, nutrient uptake, and improved overall resilience to induced drought.
Where standing crop residues are retained or residues returned as mulch to the soil, an increase in P availability may occur by decreasing the adsorption of P to mineral surfaces [72] which complements biologically mediated release of organically-bound P to improve crop P status. In the present study, minimum disturbance of soil in ZT with 30% residue retention and residues retained on the soil surface from other crops at full rates appeared to boost P stratification and extractable P status of the 0–6 cm soils. Surface band application at three–four leaf stage simultaneously helped maize plants to absorb P from the surface soil quite readily at the time when this crop is prone to show P deficiency symptoms [73]. Stratification may be expressed very close to the soil surface (0 to 2.5 cm layer; [74] up to 5 cm [75], or 10 cm deep [76]. Such differences are likely related to the P redistribution in the soil profile related to the degree of soil disturbance, in addition to the depth of P fertilizer placement, to the P sorption capacity and the accumulation of soil organic matter close to the soil surface under ZT. With the increase in post soil P in their total and available forms under ZT and surface band P placement method, the apparent P balance increased or remained same with the ZT and surface banding, though increased removal by crops (Figure 7). The ZT and surface banding of P with more positive P balance (apparent) showed greater efficiency of use of P added via fertilizers (14–23.5% than other placement with ZT practices), that is, less P fixed in soil over cropping years. At 35 DAE in the third year of study, the uptake by maize under ZT and surface banding were higher from 21% (ZT with P broadcasted) up to 60% (CT with deep banding), while the uptake increase were 16.2 to 52.4% higher than other studies (Table 5).
An increase (p < 0.05) in root length density has also been found but only in the upper 0–6 cm soil layer with surface band P placement. Broadcasting increased P at 0–6 cm depth as did surface banding, but RMD was not stimulated by broadcast application because the P was dispersed across the surface rather than concentrated like surface banding [35,77]. However, the RMD at 0–6 cm depth in surface band P application occupied 44% out of 4.65 mg cm−3 of roots while deep band P application had 32% of root distributed in surface soil (Figure 4). The build-up of available and total P and total N at 0–6 cm depth of soil (Table 3 and Figure 5) appears to have caused lateral expansion of maize roots in the top soil with surface banding and ZT [37,40]. The minimum soil disturbance coupled with retention of biomass at the rate of 30% favoured OM build-up, lowered BD and thereby might also have stimulated root growth (Figure 3). The RMD declined with depth, which was associated with the increased soil BD [51,78] and decreased level of P both in available and total forms [37]. Taylor [79] found maize roots tend to accumulate in the surface layer due to higher BD in the deeper soil profile.
While ZT, like surface banding, increased surface P levels (0–6 cm depth), but it did not stimulate maize yield even though the initial soil P level (9 mg kg−1) was below the critical level for crops in the study area [80]. Implementing reduced tillage or ZT will often produce different yield responses in a transitional period than in the medium term [81,82,83]. In the first year, CT was superior in yield performance but even after three years ZT was not different to other tillage types and neither did it interact with P placement in terms of maize yield. Continued ZT may have significant effect on yield since, as other results showed, it had increased surface soil stratification of P and SOM as well as PAWC and RMD. Moreover, in the third year, surface banding combined with ZT resulted in significantly higher shoot N and P uptake at 30 DAS and at silking. Moreover, the present results suggest that at marginal soil P levels, the stratification of P under surface banding would increase maize yield due to the combined effects of higher RMD, PAWC, and uptake of P and N. At 35 DAS and at 70 DAS, maize crop could, therefore, uptake enough P from soil available P accumulated near the surface soil and from applied P by banding on the surface at four-leaf stage. However, further research is needed to determine why similar responses in soils and maize crop P uptake and root growth under ZT were not reflected also in higher yield.
After three years of maize cultivation with 30% residue retained in the field from the previous maize stover, retention of all residues from chili cultivated once and mungbean cultivated twice (all equal to 28–32 t of residues), OC in ZT under all placement methods increased while OC in other tillage treatments remained almost the same (Table 4). The percent OC increase in ZT under surface band P application was 0.42% (from initial 0.78% to 1.20%) at 0–6 cm depth. The total N status after three years of tillage practices with 30% residue retention and P placement methods was almost doubled in ZT under all placement applications. Increased SOC content in soil surface horizon with ZT compared to that of CT can be attributed to less soil disturbance and slower decomposition of unincorporated crop residue [84,85,86]. Beare et al. [87] reported that buried residues decomposed at 3.4 times the rate of residues left on the soil. ZT showed significantly (p ≤ 0.05) higher concentrations of available N in the surface soil (Table 4). We, therefore, found tillage-induced changes in soil total N are directly related to changes in SOC [88] which together with PAWC and RMD in ZT under surface banding of P may have contributed to the higher N and P uptake at vegetative and silking stages. The higher uptake of N and P at both the stages of maize grown under surface banding of P with ZT and surface banding alone (Table 5) eventually helped plants translocate and assimilate N and P from shoots to yield of maize [89]. More to the point, as root distribution followed P distribution and moisture state of soils among the placement applications, the yield response was significantly higher with surface banding of P (Figure 5).
After three years, the decrease in BD under ZT and broadcast and surface band P application methods was from 1.58 to 1.42 g cm−3 (10%) at 0–6 cm soil depth (p < 0.05). The reason for lower BD in ZT under broadcasting and surface band P application may be attributed to higher OC accumulation in plots due to decreased disturbance of soil compared to deep placement methods which caused some additional disturbance of soil during deep banding. Zhang et al. [90], Acquaah [91], Dao et al. [92], and Balesdent et al. [93] found that soil disturbance by tillage and other cultural disturbance for crop cultivation can accelerate the decomposition of OM, increasing its rate of mineralization which accordingly increases BD of soil. özpınar and Çay [85] also correlated the lower BD at 0–20 cm with residue retention, minimum disturbance of soil and accordingly, enrichment of OC in soil.
Soil moisture at ZT under surface band P placement method was improved and was 6% higher than DT and CT under deep band P placement method over the entire season of maize growing (Figure 4). The soil moisture content was increased by 4–4% in ZT under surface band relative to DT under broadcast methods (Figure 3). Increasing SOM with ZT under surface band P application and continuous less-disturbed retention of maize residue as mulch might help conserve soil moisture [94]. Again, soil in a ZT system was found to contain more moisture than a comparable tilled soil [95,96,97] because retained crop residue on soil surface in ZT saved soil moisture from evaporation losses more efficiently [98,99] or due to carry-over of the residual soil moisture (20%) from the preceding period [100]. The higher soil water under ZT and surface band P placement, however, directly influenced root growth and P uptake by maize, as higher soil moisture content enhances P diffusion through the soil to the root surface [101].
In the surface soil of dry areas and in sandy soils, stratification of immobile nutrients close to the soil surface under ZT practices and shallow nutrient placement could render nutrients unavailable due to moisture scarcity. Hence, in such soils deficiency of P for crop growth is likely if there is low extractable P in the subsoil or root growth is constrained by physical or chemical constraints. Deep banding of less-mobile nutrients may be useful in those [89,102,103]. While in the present study, we did not find any significant benefit for crop growth, root distribution, and yield of maize following deep banding of P under minimum disturbance of soil, further research should be conducted in other soils and climates to see how ZT under surface banding of P improves P acquisition by crops and increase yield of crops. It would also be worthwhile to determine how modifying root activities [104] under ZT practice and surface banding P placement alters uptake of other nutrients. The increasing adoption of conservation agriculture (CA) by the growers in rice-based cropping systems increase the need to manage crop availability of the less mobile nutrients (P and K) due to reduced mixing of fertilisers in the root zone, reduced mineralisation of OM, and greater nutrient stratification close to the soil surface.

5. Conclusions

The surface band placement of P at four-leaf stage, regardless of tillage treatments, significantly increased maize yield relative to broadcast and deep band placements. Zero tillage practice (ZT) showed improvements in PAWC, SOM, and total N while BD, soil moisture, RMD at 0–6 cm soil depth, total and available P and P uptake were improved due to the interaction effect of ZT and surface band P placement methods. The higher root density values mainly in the surface layer (0–6 cm) in response to elevated P concentrations and PAWC under surface banding P application resulted in the significantly higher P uptake and maize yield compared to other methods. Increased PAWC, decreased BD and increased porosity with ZT, and the highest total N and OM content recorded in ZT under broadcast were reflected in higher RMD but not reflected in maize yield. Further research is needed to understand why the improved P uptake under ZT, as well as increases in PAWC and RMD at 0–6 cm depth, were not reflected in increase maize yield while similar response in soil properties and roots under surface band placement did improved yield.

Supplementary Materials

The following are available online at https://www.mdpi.com/2071-1050/10/9/3234/s1, Table S1: Summary of the crop management activities up to harvesting of the maize.

Author Contributions

M.K.A. and R.W.B. conceived and designed the research framework and performed the model development; M.I.H., N.S., M.J.A., A.T.M.A.I.M., and M.H.R., S.P. collected and analyzed the data; M.K.A., R.W.B., N.C.S., M.J.A., S.P. and P.L.C.P. wrote the paper.

Funding

The research work was done with the funding support of Ministry of Agriculture, Peoples’ Republic of Bangladesh.

Acknowledgments

The authors wish to acknowledge financial support of the Ministry of Agriculture, Peoples’ Republic of Bangladesh through Bangladesh Agricultural Research Institute (BARI) for field and laboratory research. Appreciation is also due to officers and staffs of Soil Science Division labs who provided necessary support to complete analytical work.

Conflicts of Interest

The manuscript authors hereby profess that there are no conflicts of interest for any reasons, such as personal, institutional, and financial relationships, academic competition, or intellectual passion. Gender issues were also avoided in publishing this manuscript.

Abbreviations

AEZagro-ecological zone
ANOVAAnalysis of Variance
BARCBangladesh Agricultural Research Council
BARIBangladesh Agricultural Research Institute
DAEDays after emergence
DASDays after sowing
ECEmulsifiable concentrate
ICARDAInternational Center for Agricultural Research in the Dry Areas
NTNo-tillage
PAWCPlant available water content
RHRelative Humidity
RTReduced tillage
USDAUnited States Department of Agriculture

References

  1. Laxmi, V.; Erenstein, O.; Gupta, R.K. Impact of Zero Tillage in India’s Rice-Wheat Systems; CIMMYT: Mexico City, Mexico, 2007. [Google Scholar]
  2. Gathala, M.K.; Timsina, J.; Islam, S.; Rahman, M.; Hossain, I.; Harun-ar-Rashid, G.A.K.; Krupnik, T.J.; Tiwari, T.P.; McDonald, A. Conservation agriculture based tillage and crop establishment options can maintain farmers’ yields and increase profits in South Asia’s rice–maize systems: evidence from Bangladesh. Field Crop. Res. 2015, 172, 85–98. [Google Scholar] [CrossRef]
  3. Zugec, I. The effect of reduced soil tillage on maize (Zea mays L.) grain yield in Eastern Croatia (Yugoslavia). Soil Tillage Res. 2003, 7, 19–28. [Google Scholar] [CrossRef]
  4. West, T.D.; Griffith, D.R.; Steinhardt, G.C.; Kladivko, E.J.; Parsons, S.D. Effect of tillage and rotation on agronomic performance of corn and soybean: twenty years study on dark silty clay loam soil. J. Prod. Agric. 1996, 9, 241–248. [Google Scholar] [CrossRef]
  5. Canarache, A.; Dumitru, E. No–till and minimum tillage in Romania. In No–Till Farming Systems; Goddard, T., Zoebisch, M., Gan, Y., Ellis, W., Watson, A., Sombatpanit, S., Eds.; World Association of Soil and Water Conservation (WASWC): Bangkok, Thailand, 2008; pp. 331–345. [Google Scholar]
  6. Jat, M.L.; Gathala, M.K.; Ladha, J.K.; Saharawat, Y.S.; Jat, A.S.; Vipin Kumar Sharma, S.K.; Kumar, V.; Gupta, R.K. Evaluation of precision land leveling and double zero-till systems in the rice–wheat rotation: water use, productivity, profitability and soil physical properties. Soil Tillage Res. 2009, 105, 112–121. [Google Scholar] [CrossRef]
  7. Saharawat, Y.S.; Singh, B.; Malik, R.K.; Ladha, J.K.; Gathala, M.; Jat, M.L.; Kumar, V. Evaluation of alternative tillage and crop establishment methods in a rice–wheat rotation in North Western IGP. Field Crops Res. 2010, 116, 260–267. [Google Scholar] [CrossRef]
  8. Jat, M.L.; Gathala, M.K.; Saharawat, Y.S.; Terawal, J.P.; Gupta, R.; Singh, Y. Double no-till and permanent raised beds in maize-wheat rotation of north-western Indo-Gangetic plains of India: Effects on crop yields, water productivity, profitability and soil physical properties. Field Crops Res. 2013, 149, 291–299. [Google Scholar] [CrossRef]
  9. Saharawat, Y.S.; Ladha, J.K.; Pathak, H.; Gathala, M.; Chaudhary, N.; Jat, M.L. Simulation of resource-conserving technologies on productivity, income and greenhouse gas (GHG) emission in rice–wheat system. J. Soil Sci. Environ. Manag. 2012, 3, 9–22. [Google Scholar]
  10. Ladha, J.K.; Yadvinder-Singh; Erenstein, O.; Hardy, B. (Eds.) Integrated Crop and Resource Management in the Rice–Wheat Systems of South Asia; International Rice Research Institute: Los Banos, Philippines, 2009; p. 395. [Google Scholar]
  11. Hussain, I.; Olson, K.R.; Ebelhar, S.A. Impacts of tillage and no–till on production of maize and soybean on an eroded Illinois silt loam soil. Soil Tillage Res. 1999, 52, 37–49. [Google Scholar] [CrossRef]
  12. Ahmed, R. Structure, dynamics and related policy issues of fertilizer subsidy in Bangladesh. Amader Shomoy, 17 November 2007; 3. [Google Scholar]
  13. Schröder, J.J.; Smit, A.L.; Cordell, D.; Rosemarin, A. Improved phosphorus use efficiency in agriculture: A key requirement for its sustainable use. Chemosphere 2011, 84, 822–831. [Google Scholar]
  14. Mallikarjuna, G.; Sudhir, K.; Srikanth, K.; Srinivasamurthy, C.A. Phosphorus fixation capacity and its relationship with the soil characteristics in laterite soils of Karnataka. J. Indian Soc. Soil Sci. 2003, 51, 23–25. [Google Scholar]
  15. Ma, W.; Ma, L.; Li, J.; Wang, F.; Sisák, I.; Zhang, F. Phosphorus flows and use efficiencies in production and consumption of wheat, rice, and maize in China. Chemosphere 2011, 84, 814–821. [Google Scholar] [CrossRef] [PubMed]
  16. Aldrich, S.R.; Walter, O.S.; Robert, G.H. Modern Corn Production, 3rd ed.; A & L Publications, Inc.: Champaign, IL, USA, 1986. [Google Scholar]
  17. Römer, W.; Schilling, G. Phosphorus requirements of the wheat plant in various stages of its life cycle. Plant Soil 1986, 91, 221–277. [Google Scholar] [CrossRef]
  18. Alley, M.M.; Martz, M.E.; Davis, P.H.; Hammons, J.L. Nitrogen and Phosphorus Fertilization of Corn; Virginia Cooperative Extension Publication; College of Agriculture and Life Sciences, Virginia Polytechnic Institute and State University: Blacksburg, VA, USA, 2009; pp. 1–5. [Google Scholar]
  19. Ali, M.Y.; Waddington, S.R.; Timsina, J.; Hodson, D.; Dixon, J. Maize–rice cropping systems in Bangladesh: Status and research needs. J. Agric. Sci. Technol. 2009, 3, 35–53. [Google Scholar]
  20. Barbieri, P.A.; Sainz Rozas, H.R.; Covacevich, F.; Echeverría, H.E. Phosphorus placement effects on phosphorous recovery efficiency and grain yield of wheat under no-tillage in the humid pampas of Argentina. Int. J. Agron. 2014, 12. [Google Scholar] [CrossRef]
  21. Nkebiwe, P.M.; Weinmann, M.; Bar-Tal, A.; Muller, T. Fertilizer placement to improve crop nutrient acquisition and yield: A review and meta-analysis. Field Crops Res. 2016, 196, 389–401. [Google Scholar] [CrossRef]
  22. Rosa, A.T.; Ruiz Diaz, D.A. Fertilizer placement and tillage interaction in corn and soybean production. Kans. Agric. Exp. Stn. Res. Rep. 2015, 13. [Google Scholar] [CrossRef]
  23. Heenan, D.P.; Chan, K.Y.; Knight, P.G. Long-term impact of rotation, tillage and stubble management on the loss of soil organic carbon and nitrogen from a Chromic Luvisol. Soil Tillage Res. 2004, 76, 59–68. [Google Scholar] [CrossRef]
  24. Bunemann, E.K.; Heenan, D.P.; Marschner, P.; McNeill, A.M. Long-term effects of crop rotation, stubble management and tillage on soil phosphorus dynamics. Aust. J. Soil Res. 2006, 44, 611–618. [Google Scholar] [CrossRef]
  25. Chivenge, P.P.; Murwira, H.H.; Giller, K.E.; Mapfumo, P.; Six, J. Long-term impact of reduced tillage and residue management on soil carbon stabilization: implications for conservation agriculture on contrasting soils. Soil Tillage Res. 2007, 94, 328–337. [Google Scholar] [CrossRef]
  26. Grove, J.H.; Ward, R.C.; Weil, R.R. Nutrient stratification in no-till soils. Leading Edge 2007, 6, 374–381. [Google Scholar]
  27. Selles, F.; Kochhann, R.A.; Denardin, J.E.; Zentner, R.P.; Faganello, A. Distribution of phosphorus fractions in a Brazilian Oxisol under different tillage systems. Soil Tillage Res. 1997, 44, 23–34. [Google Scholar] [CrossRef]
  28. Muukkonen, P.; Hartikainen, H.; Lahti, K.; Sarkela, A.; Puustinen, M.; Alakukku, L. Influence of no-tillage on the distribution and availability of phosphorus in Finnish clay soils. Agric. Ecosyst. Environ. 2007, 120, 299–306. [Google Scholar] [CrossRef]
  29. Wright, C.J.; Coleman, D.C. The effects of disturbance events on labile phosphorus fractions and total organic phosphorus in the southern Appalachians. Soil Sci. 1999, 164, 391–402. [Google Scholar] [CrossRef]
  30. Mallarino, A.P.; Bordoli, J.M.; Borges, R. Phosphorus and potassium placement effects on early growth and nutrient uptake of no-till corn and relationships with grain yield. Agron. J. 1999, 91, 37–45. [Google Scholar] [CrossRef]
  31. Vu, D.T.; Tang, C.; Armstrong, R.D. Tillage system affects phosphorus form and depth distribution in three contrasting Victorian soils. Aust. J. Soil Res. 2009, 47, 33–45. [Google Scholar] [CrossRef]
  32. Redel, Y.D.; Escudey, M.; Alvear, M.; Conrad, J.; Borie, F. Effects of tillage and crop rotation on chemical phosphorus forms and some related biological activities in a Chilean ultisol. Soil Use Manag. 2011, 27, 221–228. [Google Scholar] [CrossRef]
  33. Wang, J.B.; Chen, Z.H.; Chen, L.J.; Zhu, A.N.; Wu, N.J. Surface soil phosphorus and phosphatase activities affected by tillage and crop residue input amounts. Plant Soil Environ. 2011, 57, 251–257. [Google Scholar] [CrossRef] [Green Version]
  34. Andraski, T.W.; Bundy, L.G.; Kilian, K.C. Manure history and long-term tillage effects on soil properties and phosphorus losses in runoff. J. Environ. Qual. 2003, 32, 1782–1789. [Google Scholar] [CrossRef] [PubMed]
  35. Selles, F.; Grant, C.A.; Johnston, A.M. Conservation tillage effects on soil phosphorus distribution. Better Crops Int. 2002, 86, 4–6. [Google Scholar]
  36. Alam, M.K. Impact of Tillage Practices and Phosphorus Placement Methods on Soil Properties and Yield of Maize; A Report in Annual Research Report of Soil Science and Research Division; Bangladesh Agricultural Research Institute: Gazipur, Bangladesh, 2012; pp. 33–44. [Google Scholar]
  37. Lynch, J.P.; Ochoa, I.E.; Blair, M.W. QTL analysis of adventitious root formation in common bean under contrasting phosphorus availability. Crop Sci. 2006, 46, 1609–1621. [Google Scholar]
  38. Bates, T.R.; Lynch, J.P. Stimulation of root hair elongation in Arabidopsis thaliana by low phosphorus availability. Plant Cell Environ. 1996, 19, 529–538. [Google Scholar] [CrossRef]
  39. Ma, Z.; Bielenberg, D.G.; Brown, K.M.; Lynch, J.P. Regulation of root hair density by phosphorus availability in Arabidopsis thaliana. Plant Cell Environ. 2001, 24, 459–467. [Google Scholar] [CrossRef] [Green Version]
  40. Lynch, J.P.; Brown, K.M. Topsoil foraging: an architectural adaptation of plants to low phosphorus availability. Plant Soil 2001, 237, 225–237. [Google Scholar] [CrossRef]
  41. Lynch, J.P. Root architecture and nutrition acquisition. In ‘Nutrient acquisition by plants: An ecological perspective. Ecol. Stud. 2005, 181, 147–184. [Google Scholar]
  42. White, P.J.; Hammond, J.P. Phosphorus nutrition of terrestrial plants. In The Ecophysiology of Plant—Phosphorus Interactions; White, P.J., Hammond, J.P., Eds.; Springer: Dordrecht, The Netherlands, 2008; pp. 51–81. [Google Scholar]
  43. Schortemeyer, M.; Feil, B.; Stamp, P. Root morphology and nitrogen uptake of maize simultaneously supplied with ammonium and nitrate in a split-root system. Ann. Bot. 1993, 72, 107–115. [Google Scholar] [CrossRef]
  44. Postma, J.A.; Dathe, A.; Lynch, J. The optimal lateral root branching density for maize depends on nitrogen and phosphorus availability. Plant Physiol. 2014, 166, 590–602. [Google Scholar] [CrossRef] [PubMed]
  45. Zhu, J.; Kaeppler, S.M.; Lynch, J.P. Mapping of QTLs for lateral root branching and length in maize (Zea mays L.) under differential phosphorus supply. Theor. Appl. Genet. 2005, 111, 688–695. [Google Scholar] [CrossRef] [PubMed]
  46. Zhu, J.M.; Kaeppler, S.M.; Lynch, J.P. Topsoil foraging and phosphorus acquisition efficiency in maize (Zea mays L.). Func. Plant Biol. 2005, 32, 749–762. [Google Scholar] [CrossRef]
  47. Reymond, M.; Svistoonoff, S.; Loudet, O.; Nussaume, L.; Desnos, T. Identification of QTL controlling root growth response to phosphate starvation in Arabidopsis thaliana. Plant Cell Environ. 2006, 29, 115–125. [Google Scholar] [CrossRef] [PubMed] [Green Version]
  48. Lynch, J.; Brown, K. Whole plant adaptations to low phosphorus availability. In Plant–Environment Interactions, 3rd ed.; Huang, B., Ed.; Taylor and Francis: New York, NY, USA, 2006. [Google Scholar]
  49. Ge, Z.; Rubio, G.; Lynch, J.P. The importance of root gravitropism for inter-root competition and phosphorus acquisition efficiency: results from a geometric simulation model. Plant Soil 2000, 218, 159–171. [Google Scholar] [CrossRef] [PubMed]
  50. Hossen, M.S.; Mano, M.; Miyata, A.; Baten, M.A.; Hiyama, T. Seasonality of ecosystem respiration in a double-cropping paddy field in Bangladesh. Biogeosci. Discuss. 2011, 8, 8693–8721. [Google Scholar] [CrossRef]
  51. Alam, M.K.; Salahin, N.; Islam, M.M.; Hasanuzzaman, M. Effect of tillage practices on soil properties and crop productivity of wheat–mungbean–rice cropping system under subtropical climatic conditions. Sci. World J. 2014, 2014. [Google Scholar] [CrossRef] [PubMed]
  52. Jackson, M.L. Soil Chemical Analysis; Prentice Hall of India Pvt. Ltd.: New Delhi, India, 1973. [Google Scholar]
  53. Page, A.L.; Miller, R.H.; Kuny, D.R. Methods of Soil Analysis. Part 2, 2nd ed.; American Society of Agronomy: Madison, WI, USA; Soil Science Society of America: Madison, WI, USA, 1989; pp. 403–430. [Google Scholar]
  54. Olsen, S.R.; Cole, C.U.; Watanable, F.S.; Deun, L.A. Estimation of Available p in Soil Extraction with Sodium Bicarbonate; US Agricultural Circle: Washington, DC, USA, 1954; p. 929. [Google Scholar]
  55. Olsen, S.R.; Dean, L.D. Phosphorus. In Methods of Soil Analysis, Part 2; Black, C.A., Ed.; Number 9 in Agronomy Series; American Society of Agronomy: Madison, WI, USA, 1965; pp. 1035–1049. [Google Scholar]
  56. Taylor, M.D. Determination of total phosphorus in soil using simple Kjeldahl digestion. Commun. Soil Sci. Plant Anal. 2000, 31, 2665–2670. [Google Scholar] [CrossRef]
  57. Black, C.A. Method of Soil Analysis Part–I and II; American Society of Agronomy: Madison, WI, USA, 1965; p. 770. [Google Scholar]
  58. Karim, Z.; Rahman, S.M.; Ali, M.I.; Karim, A.J.M.S. Soil Bulk Density. A Manual for Determination of Soil Physical Parameters; Soils and Irrigation Division, BARC: Mumbai, India, 1988. [Google Scholar]
  59. Jones, J.B., Jr.; Case, V.W. Sampling, handling and analyzing plant tissue samples. In Soil Testing and Plant Analysis, 3rd ed.; Westermaan, W.S., Ed.; SSSA Book Series; Soil Science Society of America: Madison, WI, USA, 1990; pp. 389–427. [Google Scholar]
  60. Watson, M.E.; Issac, R.A. Analytical instruments for soil and plant analysis. In Soil Testing and Plant Analysis, 3rd ed.; Westermaan, W.L., Ed.; SSSA Book Series 3; Soil Science Society of America: Madison, WI, USA, 1990; pp. 691–740. [Google Scholar]
  61. Schuurman, J.J.; Goodewaagen, M.A.J. Methods for the Examination of Root Systems and Roots, 2nd ed.; Centre of Agricultural Publishing and Documentation: Wageningen, The Netherlands, 1971. [Google Scholar]
  62. Barley, K.P. The configuration of the root system in relation to nutrient uptake. Adv. Agron. 1970, 22, 159–201. [Google Scholar]
  63. Steel, R.G.D.; Torrie, J.H. Principles and Procedures of Statistics; McGraw-Hill Book Company, Inc.: New York, NY, USA, 1960. [Google Scholar]
  64. Costa, S.E.V.G.A.; Souza, E.D.; Anghinoni, I.; Flores, J.P.C.; Vieira, F.C.B.; Martins, A.P.; Ferreira, E.V.O. Patterns in phosphorus and corn root distribution and yield in long–term tillage systems with fertilizer application. Soil Tillage Res. 2010, 109, 41–49. [Google Scholar] [CrossRef]
  65. Fernández, F.G.; White, C. No–till and strip–till corn production with broadcast and subsurface–band phosphorus and potassium. Agron. J. 2012, 104, 996–1005. [Google Scholar] [CrossRef]
  66. Da Costa, C.H.M.; Crusciol, C.A.C. Long-term effects of lime and phosphogypsum application on tropical no-till soybean–oat–sorghum rotation and soil chemical properties. Eur. J. Agron. 2016, 74, 119–132. [Google Scholar] [CrossRef]
  67. Adee, E.; Hansel, F.D.; Ruiz Diaz, D.A.; Janssen, K. Corn response as affected by planting distance from the center of strip-till fertilized rows. Front. Plant Sci. 2016, 7, 1232–1241. [Google Scholar] [CrossRef] [PubMed]
  68. Buah, S.; Polito, T.A.; Killorn, R. No-tillage corn response to placement of fertilizer nitrogen, phosphorus, and potassium. Commun. Soil Sci. Plant Anal. 2000, 31, 3121–3133. [Google Scholar] [CrossRef]
  69. Jones, C.; Chen, C.; Allison, E.; Neill, K. Tillage effects on phosphorus availability. In Proceedings of the Western Nutrient Management Conference, Salt Lake City, UT, USA, 8–9 March 2007; Volume 7, p. 13. [Google Scholar]
  70. Hansel, F.D.; Ruiz Diaz, D.A.; Amado, T.J.C.; Rosso, L.H.M. Deep banding increases phosphorus removal by soybean grown under no-tillage production systems. Agron. J. 2017, 109, 1091–1098. [Google Scholar] [CrossRef]
  71. Hansel, F.D.; Telmo, J.C.; Amado, D.A.; Diaz, R.; Rosso, L.H.M.; Nicoloso, F.T.; Schorr, M. Phosphorus fertilizer placement and tillage affect soybean root growth and drought tolerance. Agron. J. 2017, 109, 2936–2944. [Google Scholar] [CrossRef]
  72. Ohno, T.; Erich, M.S. Inhibitory effects of crop residue-derived organic ligands on phosphate adsorption kinetics. J. Environ. Qual. 1997, 26, 889–895. [Google Scholar] [CrossRef]
  73. Selles, F.; McConkey, B.G.; Campbell, C.A. Distribution and forms of P under cultivator– and Minimum–tillage for continuous– and fallow–wheat cropping systems in the semi–arid Canadian prairies. Soil Tillage Res. 1999, 41, 147–159. [Google Scholar]
  74. Eltz, F.L.F.; Peixoto, R.T.G.; Jaster, F. Effects of soil tillage systems in an Oxisol physical and chemical characteristics. Rev. Bras. Cienc. Solo 1989, 12, 259–267. [Google Scholar]
  75. Cowie, B.A.; Hastie, M.; Hunt, S.B.; Asghar, M.; Lack, D.W. Surface Soil Nutrient Distribution Following Minimum Tillage and Traditional Tillage Management. Available online: www.regional.org.au/au/asa/1996/contributed/160cowie.htm (accessed on 2 August 2014).
  76. Howard, D.D.; Essington, E.E.; Tyler, D.D. Vertical phosphorus and potassium stratification in no-till cotton soil. Agron. J. 1999, 91, 266–269. [Google Scholar] [CrossRef]
  77. Fernández, F.G.; Schaefer, D. Assessment of soil phosphorus and potassium following RTK-guided broadcast and deep-band placement in strip-till and no-till. Soil Sci. Soc. Am. J. 2012, 76, 1090–1099. [Google Scholar] [CrossRef]
  78. Parker, M.M.; van Lear, D.H. Soil heterogeneity and root distribution of mature loblolly pine stands in Piedmont soils. Soil Sci. Soc. Am. J. 1996, 60, 1920–1925. [Google Scholar] [CrossRef]
  79. Taylor, H.M. Managing root systems for efficient water use: An overview. In Limitations to Efficient Water Use in Crop Production; Taylor, H.M., Jordan, W.R., Sinclair, T.R., Eds.; American Society of Agronomy, Inc.: Madison, MI, USA; Crop Science Society of America, Inc.: Madison, MI, USA; Soil Science Society of America, Inc.: Madison, MI, USA, 1983; pp. 87–113. [Google Scholar]
  80. FRG Fertilizer Recommendation Guide; Bangladesh Agricultural Research Council (BARC): Dhaka, Bangladesh, 2012; p. 274.
  81. FAO. FAO Conservation of Natural Resources for Sustainable Agriculture: Training Modules; FAO Land and Water Digital Media Series CD-ROM 27; FAO: Rome, Italy, 2004. [Google Scholar]
  82. Rusinamhodzi, L.; Corbeels, M.; van Wijk, M.; Rufino, M.C.; Nyamangara, J.; Giller, K.E. A meta-analysis of long-term effects of conservation agriculture on maize grain yield under rain-fed conditions. Agron. Sustain. Dev. 2011, 31, 657–763. [Google Scholar] [CrossRef] [Green Version]
  83. Smith, R.G.; Barbercheck, M.E.; Mortensen, D.A.; Hyde, J.; Hulting, A.G. Yield and net returns during the transition to organic feed grain production. Agron. J. 2011, 103, 51–59. [Google Scholar] [CrossRef]
  84. Hulugalle, N.R.; McCorkell, B.E.; Weaver, T.B.; Finlay, L.A.; Gleeson, J. Soil properties in furrows of an irrigated Vertisol sown with continuous cotton (Gossypium hirsutum L.). Soil Tillage Res. 2007, 97, 162–171. [Google Scholar] [CrossRef]
  85. Ӧzpınar, S.; Çay, A. Effects of minimum and conventional tillage systems on soil properties and yield of winter wheat (Triticum aestivum L.) in clay–loam in the Canakkale Region. Turk. J. Agric. For. 2005, 29, 9–18. [Google Scholar]
  86. Gwenzi, W.; Gotosa, J.; Chakanetsa, S.; Mutema, Z. Effects of tillage systems on soil organic carbon dynamics, structural stability and crop yields in irrigated wheat (Triticum aestivum L.)–cotton (Gosspium hirsutum L.) rotation in semi–arid Zimbabwe. Nutr. Cycl. Agroecosyst. 2009, 83, 211–221. [Google Scholar] [CrossRef]
  87. Beare, M.H.; Pohland, B.R.; Wright, D.H.; Coleman, D.C. Residue placement and fungicide effects on fungal communities in conventional and no–tillage soils. Soil Sci. Soc. Am. J. 1993, 57, 392–399. [Google Scholar] [CrossRef]
  88. Thomas, G.A.; Dalal, R.C.; Standley, J. No–till effects on organic matter, pH, cation exchange capacity and nutrient distribution in a luvisol in the semi–arid subtropics. Soil Tillage Res. 2007, 94, 295–304. [Google Scholar] [CrossRef]
  89. Costa, S.E.V.G.A.; Souza, E.D.; Anghinoni, I.; Flores, J.P.C.; Cao, E.G.; Holzschuh, M.J. Phosphorus and root distribution and corn growth related to longterm tillage systems and fertilizer placement. Rev. Bras. Cienc. Solo 2009, 33, 1237–1247. [Google Scholar] [CrossRef]
  90. Zhang, Z.; Qiang, H.; McHugh, A.D.; He, J.; Li, H.; Wang, Q.; Lu, Z. Effect of conservation farming practices on soil organic matter and stratification in a mono-cropping system of Northern China. Soil Tillage Res. 2016, 156, 173–181. [Google Scholar] [CrossRef]
  91. Acquaah, G. Principles of Crop Production: Theory, Techniques, and Technology; Pearson Education, Inc.: Upper Saddle River, NJ, USA, 2002. [Google Scholar]
  92. Dao, T.H.; Stiegler, J.H.; Banks, J.C.; Boerngen, L.B.; Adams, B. Post-contrast use effects on soil carbon and nitrogen in conservation reserve grasslands. Agron. J. 2002, 94, 146–152. [Google Scholar] [CrossRef]
  93. Balesdent, J.; Chenu, C.; Balabane, M. Relationship of soil organic matter dynamics to physical protection and tillage. Soil Tillage Res. 2000, 53, 215–230. [Google Scholar] [CrossRef] [Green Version]
  94. Hudson, B.D. Soil organic matter and available water capacity. J. Soil Water Conserv. 1994, 49, 189–194. [Google Scholar]
  95. Doran, J.W.; Elliott, E.T.; Paustain, K. Soil microbial activity, nitrogen cycling, and long–term changes in organic carbon pools as related to fallow tillage management. Soil Tillage Res. 1998, 49, 3–18. [Google Scholar] [CrossRef]
  96. Fernández–Ugalde, A.J. Water infiltration and soil structure related to organic matter and its stratification with depth. Soil Tillage Res. 2002, 66, 197–205. [Google Scholar]
  97. Fernández, U.O.; Virto, I.; Bescansa, P.; Imaz, M.J.; Enrique, A.; Karlen, D.L. No–tillage improvement of soil physical quality in calcareous, degradation–prone, semiarid soils. Soil Tillage Res. 2009, 106, 29–35. [Google Scholar] [CrossRef]
  98. Taser, O.F.; Metinoglu, F. Physical and mechanical properties of a clayey soil as affected by tillage systems for wheat growth. Acta Agric. Scand. Sect. B–Soil Plant 2005, 55, 186–191. [Google Scholar] [CrossRef]
  99. Muńoz, A.; Lopez–Pineiro, A.; Ramirez, M. Soil quality attributes of conservation management regimes in a semi–arid region of South Western Spain. Soil Tillage Res. 2007, 95, 255–265. [Google Scholar] [CrossRef]
  100. De Vita, P.; Di Paolo, E.; vm Fecondo, G.; Di Fonzo, N.; Pisante, M. No–tillage and conventional tillage effects on durum wheat yield, grain quality and soil moisture content in Southern Italy. Soil Tillage Res. 2007, 92, 69–78. [Google Scholar] [CrossRef]
  101. Olsen, S.R.; Kemper, W.D.; Sshalik, J.C.V. Self-diffusion coefficient of phosphorus in soil measured by transient and steady-state methods. Soil Sci. Soc. Am. Proc. 1965, 29, 154–158. [Google Scholar] [CrossRef]
  102. Randall, G.W.; Vetsch, J.A.; Murrell, T.S. Corn response to phosphorus placement under various tillage practices. Better Crops 2001, 85, 12–15. [Google Scholar]
  103. Borges, R.; Mallarino, B.B. Deep banding phosphorus and potassium fertilizer for corn managed with ridge tillage. Soil Sci. Soc. Am. J. 2001, 65, 376–384. [Google Scholar] [CrossRef]
  104. Deubel, A.; Hofmann, B.; Orzessek, D. Long-term effects of tillage on stratification and plant availability of phosphate and potassium in a loess chernozem. Soil Tillage Res. 2011, 117, 85–92. [Google Scholar] [CrossRef]
Figure 1. Rainfall distribution (mm) and temperature (minimum and maximum, °C) of the experimental site over the three years of the study with their corresponding sowing ( Sustainability 10 03234 i001) and harvesting dates ( Sustainability 10 03234 i002).
Sustainability 10 03234 g001aSustainability 10 03234 g001b
Figure 2. Soil sampling spots for plots under tillage and P placement practices.
Sustainability 10 03234 g002
Figure 3. Effects of tillage practices and phosphorus placement methods on soil moisture in 2011–2012. Notes: ZT = Zero Tillage, CT = Conventional Tillage, and DT = Deep Tillage, whereas P1 = Broadcast, P2 = Surface band and P3 = Deep band. LSD0.05 under different treatment combinations are 2.35* (29 Dec 2011), 1.45* (9 Jan 2012), 2.73ns (19 Jan 2012), 3.75ns (29 Jan 2012), 1.37* (8 Feb 2012), 0.78* (18 Feb 2012), 1.15*(9 Mar 2012), 0.73* (19 Mar 2012), 0.42* (29 Mar 2012), 0.99* (9 Apr 2012), 0.56 (19 Apr), 0.61 (28 Apr), 0.48 (12 May) Apr, 0.96* (25 May 2012). * indicates significant at p < 0.05. ns indicates non-significant at p = 0.05.
Sustainability 10 03234 g003
Figure 4. Root mass density of maize after three years of tillage practices and P placement methods. Notes: Bars containing the same letter above them are not significantly different at the 5% level. ZT = Zero Tillage, CT = Conventional Tillage, and DT = Deep Tillage, whereas P1 = Broadcast, P2 = Surface band and P3 = Deep band. LSD0.05 for tillage practices are 0.45*, 0.12ns, 0.20ns, 0.05ns, 0.04ns, and 0.02nsand LSD0.05 for placement methods are 0.30ns, 0.23ns, 0.05*, 0.02*, 0.02ns, and 0.02nsfor 0–6, 7–12, 13–18, 19–24, 25–30, and 31–50 cm depth of soil, respectively. LSD for interaction effects (Tillage × Placement) are 0.21*, 0.42ns, 0.16 ns, 0.11 ns, 0.08 ns, and 0.07 ns for 0–6, 7–12, 13–18, 19–24, 25–30, and 31–50 cm depth of soil, respectively.* indicates significant at p < 0.05. ns indicates non-significant at p = 0.05.
Sustainability 10 03234 g004aSustainability 10 03234 g004b
Figure 5. Effect of tillage practices and P placement methods on maize yield per hectare over three years of experimentation. Notes: Bars containing the same letter above them are not significantly different at the p < 0.05.The horizontal bars indicate standard deviations. The LSD0.05 values are 0.38*, 0.5ns, and 0.29* for 2009–2010; 1.66ns, 1.04ns, and 1.4ns for 2010–2011 and 2.24ns, 0.57*, and 1.31ns for the years 2011–2012, respectively. (Legend: ZT = Zero Tillage, CT = Conventional Tillage, and DT = Deep Tillage, whereas P1 = Broadcast, P2 = Surface band, and P3 = Deep band). * indicates significant at p < 0.05. ns indicates non-significant at p = 0.05.
Sustainability 10 03234 g005
Figure 6. Effects of tillage and P placement methods on available and total P in soil after three years of maize cultivation. Notes: Figure 6a, 6b, and 6c are available P influenced by tillage practices and placement methods while 6d, 6e, and 6f are total P by tillage practices and placement methods. Horizontal Bars indicate LSD (least significant difference). ZT = Zero Tillage, CT = Conventional Tillage, and DT = Deep Tillage, whereas P1 = Broadcast, P2 = Surface band and P3 = Deep band. (Standard errors (±) are 1.27, 0.66, 0.65, and 0.35 for available P and 8.8, 6.8, 4.7, and 4.7 for total P at 0–6, 7–12, 12–18, and 19–24 cm soil depth, respectively).
Sustainability 10 03234 g006
Figure 7. Apparent balance of total and available P at Grey Terrace soil of Gazipur, Bangladesh under maize-based cropping systems. Notes: Here, ZT = Zero Tillage; CT = Conventional Tillage; and DT = Deep Tillage, whereas P1 = Broadcast; P2 = Surface band; and P3 = Deep band.
Sustainability 10 03234 g007
Table 1. Properties of initial soil of the experimental site at Gazipur.
Initial Soil PropertiesValues
Particle size distributionSand (g kg−1)350
Silt (g kg−1)340
Clay (g kg−1)310
Soil pH7.3
Moisture content at FC (g kg−1)280
Bulk density (g cm−3)0–6 cm soil depth1.54
07–12 cm soil depth1.56
13–18 cm soil depth1.58
19–30 cm soil depth1.58
Soil porosity (%)0–6 cm soil depth38
07–12 cm soil depth37
13–18 cm soil depth37
19–30 cm soil depth36
Extractable P (mg kg−1)0–6 cm soil depth11
07–12 cm soil depth9
13–18 cm soil depth8
19–30 cm soil depth8
Soil organic matter (g kg−1)13.5
Total N (g kg−1)0.49
Notes: The critical level of P in the study area is 14 mg kg−1 (FRG 2012).
Table 2. Amount of maize residue retained in the field during each year. Retention was equivalent to 30% of the maize biomass.
TreatmentsResidue Retention (t ha−1)
MaizeChiliMungbean
2008–20092009–20102010–2011200920102011
ZTP12.782.942.982.77.237.64
ZTP23.342.553.433.17.798.23
ZTP32.742.772.902.77.427.83
CTP13.163.153.162.56.787.16
CTP23.423.383.332.76.837.20
CTP33.273.193.232.66.827.19
DTP13.233.073.032.65.966.30
DTP23.253.303.282.76.356.71
DTP33.193.203.162.76.376.73
SE (±)0.120.110.110.10.210.22
Notes: Legend: ZT = Zero Tillage, CT = Conventional Tillage and DT = Deep Tillage, whereas P1 = Broadcast, P2 = Surface band and P3 = Deep band.
Table 3. Bulk density, plant available water content (PAWC), and porosity of soil after three years of tillage practices and P placement methods at three depths.
Treatments/Parameters/DepthsBulk Density (g cm−3)PAWC (cm)Porosity (%)
0–6 cm7–12 cm13–18 cm0–6 cm7–12 cm13–18 cm0–6 cm7–12 cm13–18 cm
ZT1.431.501.541.701.431.3844.4141.9540.29
CT1.481.451.511.361.551.5239.5743.0539.93
DT1.491.471.481.061.401.4940.2042.5040.53
SE (±)0.030.020.010.010.060.042.80.450.41
P11.471.481.511.351.451.4540.9842.2839.71
P21.461.471.511.381.461.4641.6642.6340.36
P31.461.471.501.401.471.4741.5342.5940.68
SE (±)0.0040.010.0050.0060.010.010.290.220.24
ZTP11.421.511.551.701.421.3943.6941.8039.64
ZTP21.421.501.551.721.431.3845.1842.0640.47
ZTP31.441.481.531.691.431.3644.3542.0040.75
CTP11.481.461.511.361.531.4839.3442.9139.35
CTP21.481.451.511.331.551.5239.6843.1540.14
CTP31.471.451.501.401.561.5539.6943.0840.31
DTP11.501.481.480.991.391.4839.9142.1340.14
DTP21.481.471.471.101.411.4940.1342.6940.48
DTP31.481.471.481.101.411.5040.5542.6940.97
SE(±)0.0070.020.0080.060.140.150.610.660.65
CV (%)4.704.774.504.668.485.685.936.117.29
Error D.F.121212121212121212
Notes: Legend: ZT = Zero Tillage, CT = Conventional Tillage, and DT = Deep Tillage, whereas P1 = Broadcast, P2 = Surface band and P3 = Deep band. LSD for tillage × placement (BD at 0–6 cm depth − 0.01), for tillage (PAWC at 0–6 cm depth − 0.03 and porosity at 0–6 cm depth − 1.2).
Table 4. Organic carbon status and total N status of soil at different depth increments of soil after three years of tillage practices and P placement methods.
Parameters/YearsSoil Organic Matter Status (%)Total N Status (%)
Initial
(0–10 cm)
0–6 cm7–12 cm13–18 cmInitial
(0–6 cm)
0–6 cm7–12 cm13–18 cm
ZT0.781.150.840.800.0490.080.0610.04
CT0.780.910.980.820.0490.060.0610.045
DT0.780.850.830.850.0490.060.0550.053
SE (±)-0.020.030.03-0.010.0020.002
P10.770.970.900.830.0490.0690.0610.046
P20.780.990.880.830.0490.0680.0590.046
P30.780.950.870.810.0490.0680.0570.047
SE (±)-0.020.010.02-0.010.0010.001
ZTP10.781.140.870.810.0490.0850.0630.041
ZTP20.781.200.830.810.0490.0830.0600.040
ZTP30.771.090.840.790.0490.0830.0590.040
CTP10.780.920.970.840.0490.0630.0620.045
CTP20.770.930.990.810.0490.0630.0610.045
CTP30.790.880.960.800.0490.0640.0600.046
DTP10.780.860.860.840.0490.0580.0580.053
DTP20.780.840.830.860.0490.0590.0560.052
DTP30.790.840.810.840.0490.0570.0520.054
SE (±)0.070.050.050.0020.0020.001
CV (%)6.55.44.66.85.24.8
Error D.F.121212121212
Notes: Legend: ZT = Zero Tillage; CT = Conventional Tillage; and DT = Deep Tillage; whereas P1 = Broadcast; P2 = Surface band; and P3 = Deep band. LSD0.05 (tillage) at 0–6 cm depth for SOC and Total N are 0.12 and 0.01.
Table 5. Biomass yields, N and P uptake by maize shoot in the third year of tillage practices and P placements.
TreatmentsBiomass Yield (t ha−1)Uptake (kg ha−1)
35 DAESilking Stage35 DAESilking Stage
NPNP
ZT0.727.6910.221.07103.8312.79
CT0.657.948.470.9098.6912.09
DT0.647.748.820.90100.8111.93
SE (±)0.0050.440.050.025.10.5
P10.647.577.560.8989.7911.25
P20.718.2010.661.08114.3914.01
P30.677.599.300.9099.1511.54
SE (±)0.020.10.60.063.60.34
ZTP10.727.759.91.0106.312.9
ZTP20.747.8111.61.3124.515.4
ZTP30.667.809.10.988.710.1
CTP10.667.866.30.987.210.8
CTP20.688.1010.11.0108.213.2
CTP30.597.739.00.9103.812.3
DTP10.657.606.40.889.910.1
DTP20.697.9810.31.0104.513.4
DTP30.597.089.80.9106.012.3
SE (±)0.020.200.730.075.870.58
CV (%)6.045.826.45.46.94.8
Error D.F.121212121212
Notes: Legend: ZT = Zero Tillage; CT = Conventional Tillage; and DT = Deep Tillage; whereas P1 = Broadcast, P2 = Surface band and P3 = Deep band. LSD0.05 for biomass yield at 35 DAE was 0.02, 0.04, and 0.02 for tillage, P placement method and the interaction, respectively. LSD0.05 for biomass yield at silking stage DAE was 0.04, 0.22, and 0.39 for tillage, P placement method and the interaction, respectively. LSD0.05 for N uptake at 35 DAE was 0.03 and 1.58 for tillage and the interaction, respectively. LSD0.05 for P uptake at 35 DAE was 0.06, and 0.13 for P placement method and the tillage and placement method interaction, respectively. LSD0.05 for N and P uptake at silking stage was 8.01 and 13.8 for tillage and interaction and 0.74 and 1.28 for placement method and interaction, respectively.

