1. Introduction
In the new age of the information society, scientific progress has been manifested in all fields of activity. It represents, on the one hand, elements with a significant positive impact on the development of human society and, on the other hand, an increasingly debated issue regarding sustainable development. In this context, all the resources used and the output obtained as a result of scientific progress and the information society have to stay under the sign of conservation and regeneration, to ensure continuity for future generations. The trend of sustainable development of society has been emphasized in the last decade, but there has been little change in the interdependence of the socio-economic system with the ecological one [
1,
2]. The fact that these changes, which were expected following the implementation of specific sustainability strategies, were delayed resulted from multiple causes, including the way in which the results were measured. Thus, the indicators that have quantified sustainability should have been standardized, determined, and applied in an integrated manner as a complex system at local, regional, and national levels, taking into account specific environmental rules and regulations [
3,
4,
5].
In this context, the Organization for Economic Co-operation and Development (OECD) uses a complex, representative indicator for quantifying sustainability and ecological footprint. Widely applied by both governmental and non-Governmental organizations, the ecological footprint indicator (EF) is used to raise awareness and counteract anthropogenic pressure on the environment [
6].
Initially addressed by Wackernagel and Rees in 1996 [
7], as a simple indicator of a population’s sustainable consumption, the ecological footprint combines several factors into a single complex consumption indicator.
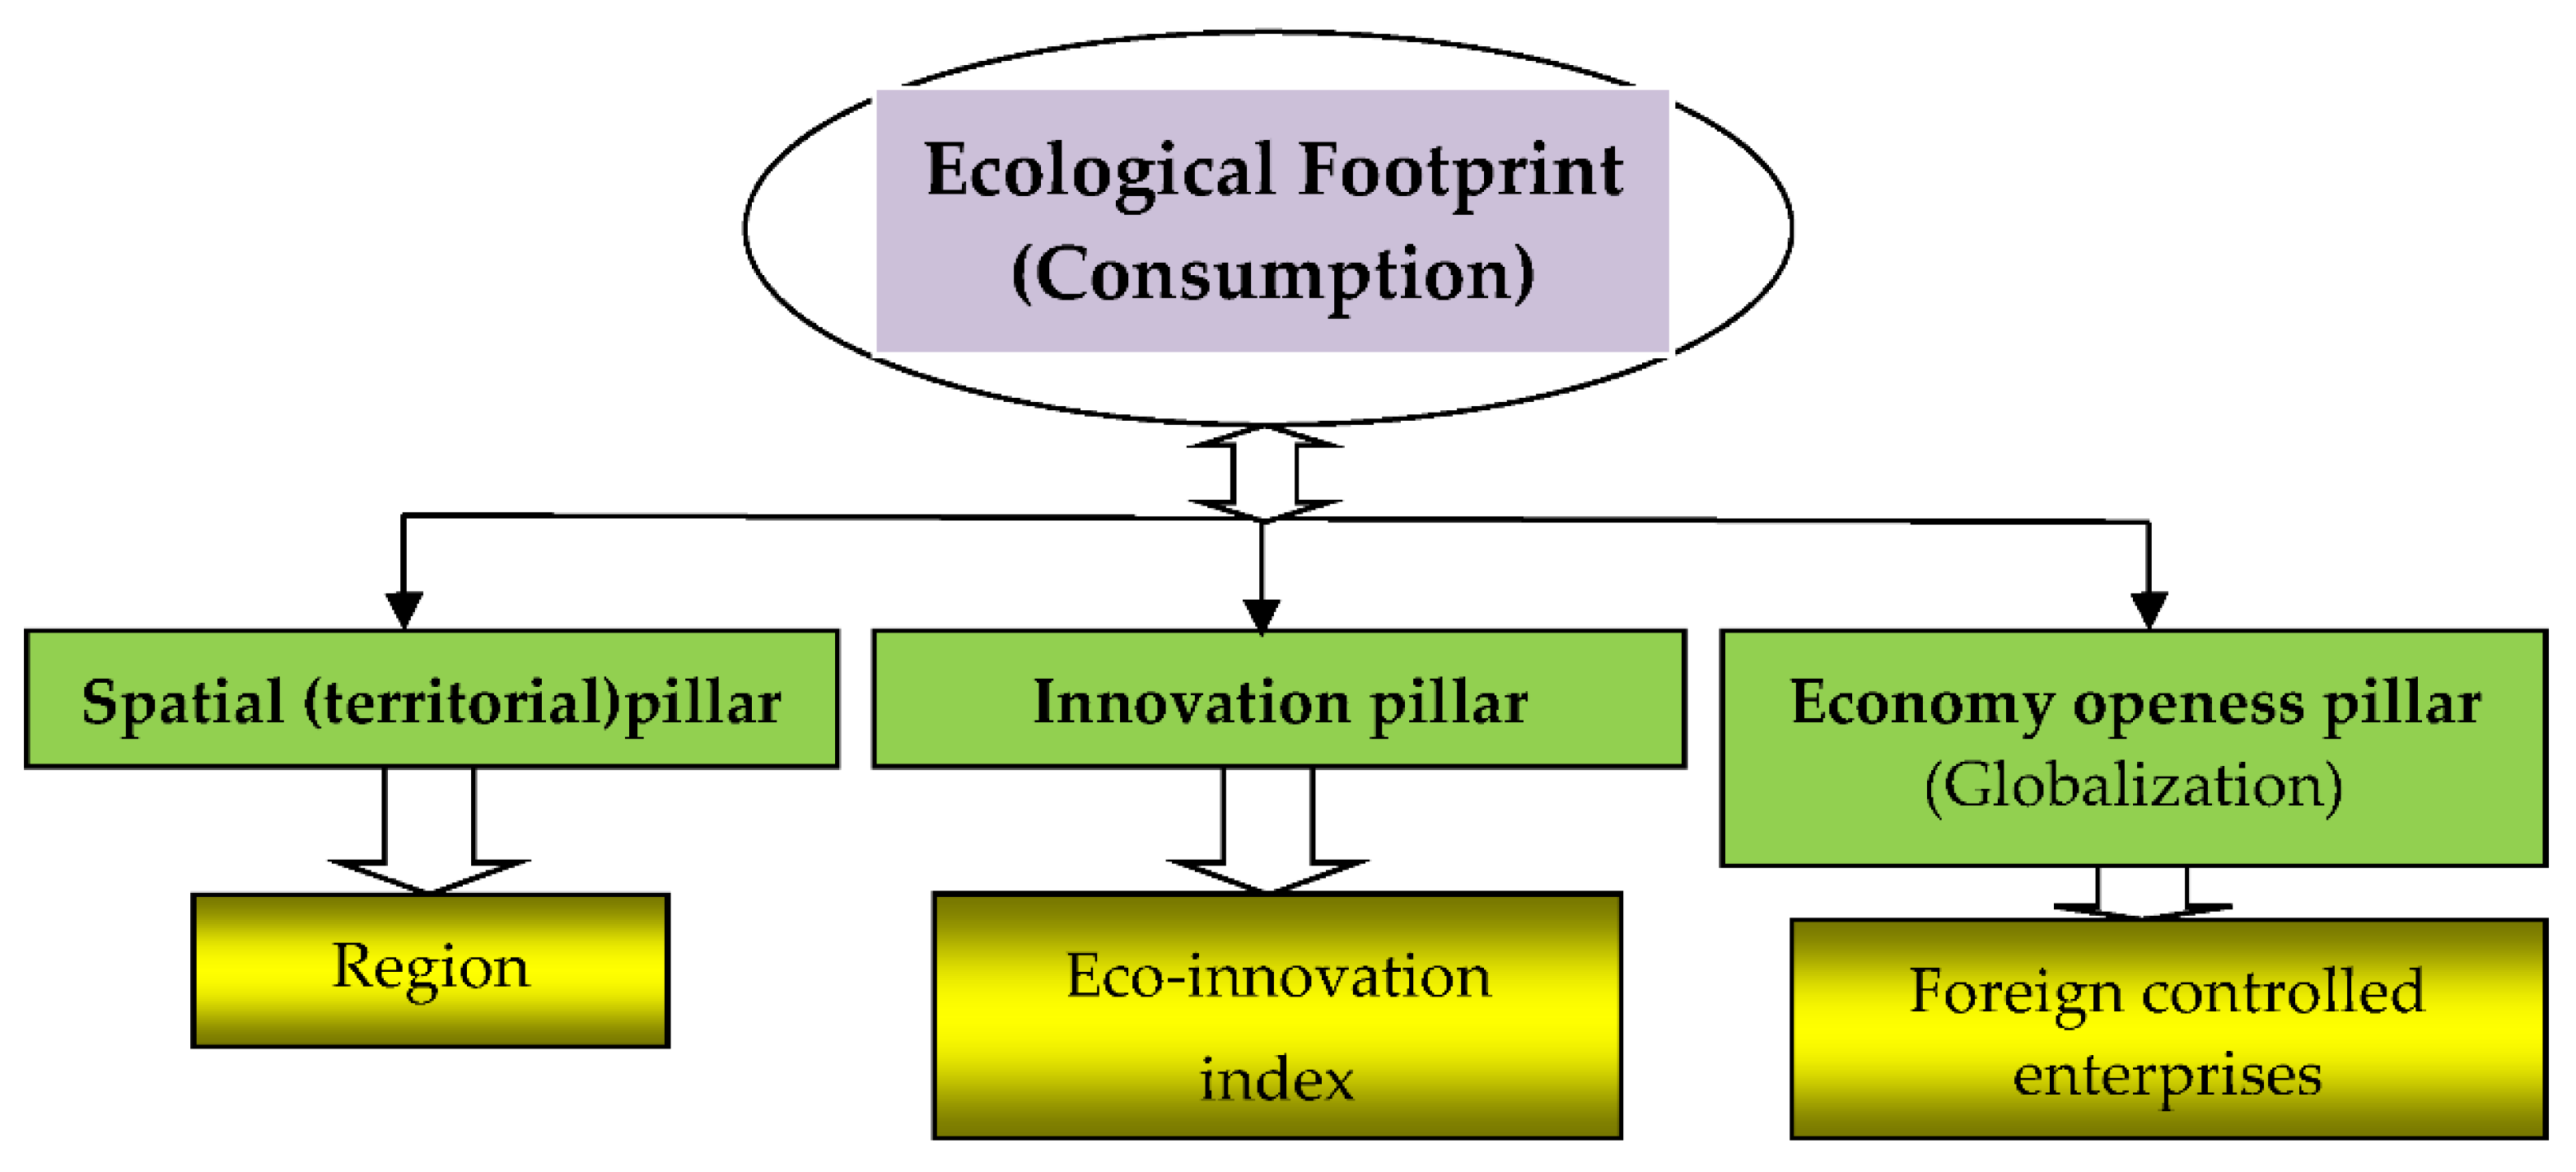
In this context, this paper presents the results of the analysis of the interdependence between the ecological footprint of consumption and three basic components, or three pillars: the spatial pillar (through the Region variable), the innovation pillar (through the Eco-Innovation Index), and the economy openness/freedom pillar (through the variable Employment in Foreign-Controlled Enterprises).
The article is logically organized in six sections. The Introduction is followed by a section (
Section 2) in which different points of view and ways of approaching the issue of ecological footprint in the context of innovation and globalization are analyzed by various specialists in the field and by other persons concerned about the issue, and these are included in a literature review.
Section 3 highlights the methodology and other details of the research conducted in order to identify the evolution prospects of the ecological footprint of consumption.
Section 4, presenting the main results, is divided into three parts: the first part presents some aspects of the previous evolution of ecological footprint in European countries; the second part presents the main determinants of the ecological footprint and the regression model linking these variables and identifies them, and the third part aims to present the future trends of this analyzed indicator. The conclusions and discussions presented in
Section 5 and
Section 6 reveal the significant direct impact of the factors on the variability in the ecological footprint (through the odds-ratios): the share of the employed population by foreign-controlled enterprises and the index of eco-innovation. At the same time, EU/non-EU membership has a significant impact on the ecological footprint, meaning that countries of category 0 (non-EU or recent EU Member States) are mostly assigned low ecological footprint scores.
The focus was on European countries because we considered that they share similar features, regional manifestations, and comparable patterns of behavior in terms of the variables introduced in the research. In this context, profiles of countries characterized by behavioral patterns of the variables to indicate the possibilities of changing the ecological footprint from a lower category to another have been made.
2. Literature Review
For many years, researchers have been concerned about whether the development of humanity has taken the right direction in light of scientific progress and the information society and whether economic growth has dissociated—to some extent—from increasing resource usage, which can generate harmful effects on the environment. Thus, the concept of sustainable development emerged. It was defined in 1987 as the “development that meets the needs of the present without compromising the ability of future generations to meet their own needs” [
8]. Once the optimism of the innumerable benefits of the industrial revolution began to dissipate following the development of research and innovation, the destructive effects of human activities upon the environment have been increasingly felt and global warming now signals the imminent approach of an environmental crisis. Man must use the instruments of progress, the scientific results obtained due to the new information society, and ensure developmental sustainability by reducing the pressure of negative effects on the environment.
Moreover, today, the economic development also detains a strong global component, as globalization, besides its beneficial effects on the economies of different countries, can provide useful tools for managing economic sustainability and the environment. Regarding the concerns for maintaining sustainable economic growth, researchers have developed statistical indicators for the purpose of measuring and monitoring sustainability. These indicators also include the ecological footprint, which quantifies the effect of human activities on the environment, a low ecological footprint having a positive impact on the environment as a result of reducing the negative pressure on human activities. In other words, the ecological footprint is a measure of the resources needed in order to produce everything that mankind consumes and to absorb generated waste, but it can also be seen from the perspective of the comparison of consumption and available resources, as an assessment of the dependency degree of human society from environmental resources [
9]. Furthermore, theoretically, globalization and the openness degree of an economy, or its freedom, draws a trace over the ecological impact, as resource consumption is not limited to local resources, and the products and services consumed by the inhabitants of a country come not only from the exploitation of local resources but also from the resources of other countries. Therefore, the analysis should also take into account the trade activities between countries under the conditions of globalization.
Six types of productive areas are distinguished in the ecological footprint measurement: cropland, grazing land, fishing grounds, built-up land, forest areas, and carbon requirement. Biocapacity refers to the potential, to the capacity of productive biological areas to generate the necessary resources and to absorb generated waste, particularly carbon emissions [
9]. When biocapacity is exceeded by the ecological footprint, there is an unsustainable effect (ecological deficit), and when the ecological footprint is lower than the biocapacity, we speak about a biocapacity reserve.
In this context, the complexity of the environmental footprint is justified by three basic characteristics [
10]:
the interdependent manifestation of six land-use types (cropland, grassland and pasture, fishing grounds, forests land, area required for built infrastructure, land for carbon sequestration);
the presentation of the ecological footprint as a comparable global indicator, as the measurement in global hectares (gha) takes into account ecological productivity;
this indicator is scientifically well defined, the components being rigorously delimited by the National Footprint Accounts (NFA) (Global Footprint Network);
National Footprint Accounts [
11] calculated the ecological footprint by assessing the area of biological production needed to absorb the carbon dioxide emissions of the population and generate all the resources consumed. One country consumption is determined by adding imports and eliminating exports from its national output. The results obtained by applying the relationship indicate the ecological impact of a country, as follows:
if a country’s footprint is lower than its bio-capacity, then it has an ecological reserve and is called an environmental creditor;
otherwise the country operates with an ecological deficit and is called ecological debtor.
The first approaches to the concept of ecological footprint, along with the ways to determine it, are noted in the literature in 1992, when Rees, W.E. and Wackernagel, M. began their research from the notion of “appropriated carrying capacity”. Throughout their studies on ecological footprint research, these authors developed and used the term “ecological footprint” [
12,
13]. Phil Testemale mentions the significant contribution of the two authors in the book “Our ecological Footprint: Reducing Human Impact on Earth”. Thus, the need to approach the ecological footprint is highlighted both from the perspective of resource use and of the carrying capacity of the planet, thus addressing the issue of survival in terms of sustainability [
14].
Over time, there have been developed many studies that analyze the ecological footprint, its methods of determination and its components, with an emphasis on sustainability. In this context, both aspects, the ecological footprint components and the policies to be developed and applied in order to reduce it in terms of sustainability, were approached [
7,
15,
16,
17,
18,
19].
Urbaniec (2015) provides a detailed and critical evaluation of the existing methods of measuring sustainable development, pointing out the weaknesses of the actual system [
20]. The study reveals the importance of adapting national systems of sustainability monitoring to the rules and concepts used by the European Union, and the importance of a strategy based on the implementation of such systems. Through a spatial econometric model, Ramirez analyzed the spatial relationship between the ecological footprint and forest coverage, aqueduct coverage, and literacy rate, combining environmental factors with socio-educational factors. The model highlighted a series of spatial autocorrelation schemes, showing that the ecological footprint of a region is not explained only by the elements of sustainable development in that region, but also by the value of the ecological footprint of the neighboring regions [
21]. Torras et al. measured the effect of socio-economic variables such as income, economic openness, and income inequality over sustainability expressed through the ecological footprint. Their results show that the degree of span of an economy influences sustainability in a positive way, while income inequality has a non-defining, ambiguous effect on the ecological impact [
22]. Wang et al. reconsiders the relationship between economic growth and environmental impact for the Ecological Footprint indicator. The results of the study show that the internal ecological footprint of consumption or production is significantly influenced by the income and biocapacity of neighboring countries; together, while the ecological footprint of consumption is more sensitive to internal income, the ecological footprint of production is more sensitive to the internal biocapacity of the studied regions [
23]. Jia et al. had identified and analyzed the major determinants of the ecological footprint for Henan Province (China), where the ecological deficit had deepened. Following the analysis, the main determinants have been identified: population, GDP/inh. and the share of the urban population. The model revealed the lack of a curvilinear relationship between economic development and ecological footprint for the analyzed region [
24].
In other specific research (Lazarus et al., Lenzen et al.), the influence of globalization on the environment has been analyzed by taking into account the relationship of trade between countries (as a measure of globalization) and ecological footprint or biocapacity loss. International trade—as a variable that reflects the level of economic freedom—is seen by the authors as a link through which the consumption of a country exerts a negative influence on the biodiversity of another country, leading to an increase in the ecological footprint. Dam et al. show that biocapacity per capita and the stringency level of environmental policies influence the net importer or net exporter status of ecological footprint. Thus, countries with high income and a more restrictive environmental policy are more likely to become net ecological footprint importers, while developing countries with more permissive environmental policies become—more likely—net exporters of ecological footprint [
25,
26,
27].
Rudolph and Figge’s study analyzes the implications of globalization for environmental pressures based on the ecological footprint. Thus, the variables included in the analysis are the ecological footprint and a multidimensional globalization index. The results show a complex relationship between the variables, which are economically, socially, and politically analyzed. Social globalization is significantly and negatively linked to the ecological pressure of consumption and production and positively correlated with imports and exports. In this way, the increased social connection can reduce environmental pressure and maintain sustainable development of national production and consumption. On the other hand, the increased social connection as a result of the globalization process can lead to the reduction of environmental pressure through trade between countries. A high level of social globalization seems to reduce the importance of the sustainable side of import and export. Regarding the effects of economic and political globalization upon the ecological footprint, it can be said that the results were not so clear. All the efforts of international environmental policy seem to have no relevant short-term effect on environmental pressures [
10,
28].
The importance of the spatial and regional component in the analysis of the ecological footprint production was also analyzed in the studies of Acar and Asici; Bagliani et al. Carson Acar and Asici emphasized the existence of a Kuznets Environmental Curve between per capita income, on the one hand, and the footprint of domestic production and import, on the other. The results show that the domestic environmental regulations of a country do not influence a country’s decision to import products with a harmful impact upon the environment, but they affect the domestic production structure of the country. Bagliani et al. analyzed the relationship between per capita income and environmental pressure, using different models (inverted-U function, linear function, power function), with the results indicating an inverse relationship between the variables included in the study. As per capita income increases, there is an attenuation in the growth rate of the ecological footprint. The analysis was based on a large sized sample, covering the period 1961–2001. The issue of the impact of economic growth on the environment is also debated in Carson’s study. He questions the hypothesis of the positive effect of income growth on the environment, since a causal relationship between income and environmental quality could not be demonstrated; however, good governance, the existence of effective legislative regulations, and technological progress are directly correlated with income, and the income increase can lead to a decrease in pollution [
29,
30,
31].
Park et al. used the logistic regression model to estimate underground water potential and to draw maps of it, based on a set of influence factors (topographic, hydrological, and geological) [
32]. Research conducted by Ittiravivongs A. referred to a number of socio-demographic and economic factors, which were included in a logistic regression model, in order to analyze their influence on people’s involvement in recycling activity. The results have revealed that the adequacy degree of the information about recycling and the location and duration of time of the current residence period directly influenced recycling behavior [
33]. Goswami et al. used the logit regression model to identify the factors that determine the energetic behavior of households, including marginal expenditure per capita, location, Internet access, the availability of a regular income, the household type, and the calorific value of fuel [
34]. Other usages of the logit regression models included: the estimation of the ecosystems’ carrying capacity [
35], sustainable fishing analysis and the forecasting of fish stocks [
36], the measurement and improvement of urban sustainability [
37], the changes in consumers’ behavior and in decisions to purchase different manufactured products, under the influence of concerns for climate change, and increasing pollution or the limited nature of resources [
38,
39,
40,
41,
42]. Komori et al. have applied an asymmetric logistic regression model on ecological data, with improved predictive power, and found that the annual fish catch amount “has a greater impact on stock status prediction” [
36]. Kim et al. [
39] have conducted a consumer survey on the impact of climate change on consumer behavior; the results—obtained by applying an ordinal logit regression model—showed that the preference for low-carbon products is significantly influenced by awareness and concern about quality of life, climate change, and environmental quality. The same issue was analyzed in a real purchase experiment on a sample of 104 buyers, by Aoki and Akai. The results show that consumers with greater environmental responsibility are willing to pay significantly higher amounts for low-carbon products [
40]. Several studies are dedicated to predicting the ecological footprint in overcrowded urban regions, taking into account stable consumption patterns, the promotion of environmental policies, and climate change softening [
43,
44,
45,
46,
47,
48,
49,
50]. Baabou et al., Galli et al. and Galli et al. are concerned with the ecological footprint and ecological deficit in the Mediterranean area [
51,
52,
53]. The researchers have analyzed the differences between the levels of the ecological footprint in several Mediterranean cities, explaining them through a range of socio-economic factors, such as cultural traditions, income, and infrastructure. The Mediterranean region exceeds 2.5 times its available natural resources but access to external resources is limited. Thus, the countries that are dependent on foreign trade are exposed to certain risks.
Other authors, like (Galli) or (Galli et al.) have contributed to improving and clarifying the calculating mode of the overall ecological Footprint indicator [
54,
55], or of some of its components, like the carbon component (Mancini et al., Walsh et al., van den Bergh & Verbruggen; Hertwich & Peters, Atici) [
56,
57,
58,
59,
60], the water component (Hoekstra & Chapagain, Galli, A. et al.) [
61,
62], or the land component (Weinzettel et al., Ewing, B. et al.) [
63,
64]. In studies by Nakajima & Ortega or Daily & Ehrlich, the concept of ecological Footprint and various methods of calculating it were used to evaluate the ecosystem carrying capacity of a region [
65,
66]. Isman et al., and Cuček et al. show how the ecological footprint can be used to make climate change mitigation policies more effective and to ensure long-term sustainability in urban agglomerations [
67,
68].
Recent specialized studies reveal a connection between the results of research-development-innovation activities and the social and environmental component of sustainable development, while others emphasize that innovation may have a positive or negative effect on environmental quality [
69]. Thus, Terziovski & Guerrero take into consideration the research-development-innovation capital as a component of human capital in assessing urban sustainability status [
70]. The study investigates the relationship between sustainable development and innovation performance, revealing a positive correlation between them. The research-development-innovation activity has positive results in the production of “green” products, which can reduce the ecological impact of the origin-region [
71]. However, these innovative techniques must be included in the activity of the organizations, so that they show a greater environmental responsibility by reducing the carbon footprint. Increasing environmental quality can also mean better resource productivity [
72]. Bel & Joseph 2018; Anderson et al., Calel & Dechelezprêtre, Haščič et al., Jaffe et al. highlight the role of technological progress, of innovation in energy consumption, and climate change mitigation, in order to effect and reduce the ecological footprint [
73,
74,
75,
76,
77]. Specifically, the studies reveal the way in which the innovation outcomes can be applied in creating climate change mitigation technologies in order to meet climate and energy targets imposed on EU countries by 2020 [
72]. Also, the EU has set up an Emissions Trading System (ETS), the effects of which are analyzed by Anderson et al., who study a pilot analysis launched in 2005 in Ireland. One of the aims was to encourage low-carbon technologies by imposing a price on CO
2 emissions. The study shows that ETS can result in stimulating the application of low-carbon technologies [
73].
3. Methodology and Data
Research links the ecological footprint, as an indicator of sustainability, to the components of sustainable development. In this context, the ecological footprint is a complex concept influenced by numerous factors. In order to capture this complexity, the analysis has covered, in addition to the ecological footprint, a set of seven other variables in the following six areas (
Figure 1) [
11]:
Economy openness/freedom: represented by the variable “Employment in foreign controlled enterprises” (% of total)
Research-development and innovation: represented by the variable “Eco-innovation index” (%, EU = 100)
Environmental sustainability: represented by the variables “Circular material use rate” (%) and “Exposure to air pollution by particulate matter” (µg/m3) (Particulates < 10 µm)
Education and training: represented by the variable “Employment with tertiary education” (% of total employment, 20–64 years)
Health: represented by the variable “Life expectancy at birth” (years)
Social exclusion: represented by the variable “At risk of poverty rate” (%).
The data for the seven independent variables were provided by the EUROSTAT database for a number of the 33 European countries related to the most recent year for which the ecological footprint was calculated (2014). The data for the dependent variable (ecological footprint) were provided by the National Footprint Accounts 2018 Edition, developed by the Global Footprint Network. The sample includes 264 observations, and 33 observations for each of the eight analyzed variables. Since the variables are expressed in different measurement units and their values significantly differ in terms of magnitude, they have been standardized.
Following the Principal Component Analysis application, two determinants have been retained that may have a significant influence on the change in the ecological footprint: eco-innovation index and employment in foreign-controlled enterprises. Besides the two identified factors, a spatial factor was also included in the analysis: the location of each country (region).
These factors belong to three pillars: Spatial pillar, Innovation pillar, and Economy openness (Globalization) pillar (
Figure 2). For the first pillar the regional variable was selected in order to analyze whether a country’s EU membership could explain the gradual level of the ecological footprint [
21,
22,
23,
29,
30,
31]. The second pillar was represented by the variable eco-innovation index, with the aim of reflecting the R & D and innovation component as an exponent of the information society [
70,
71,
72,
73,
74,
75,
76,
77]. For the third pillar, the variable employment in foreign controlled enterprises was selected as an indicator reflecting economic freedom (the openness degree of an economy). It was also used by EUROSTAT as an economic globalization indicator [
25,
26,
27,
28] (
Table 1).
The values of the explained variable ecological footprint of consumption (EF_C) were recodified on a 5 point ordinal scale: 1 (very low level, for values lower than 3.5); 2 (low level, for values between 3.5 and 4.4); 3 (moderate level, for values between 4.5 and 5.4); 4 (high level, for values between 5.5 and 6.4); 5 (very high level, for values at least equal to 6.5). The purpose of this transformation was to identify a country’s likelihood of moving from a lower to a higher category of the ecological footprint of consumption, depending on the changes in the selected factors.
The binary categorical explanatory variable REGION is classified into two groups (categories): non-EU-member or newer EU-member group (after 2004) (0 category) and older EU-member group (until 2004) (1 category).
Depending on the values of the second explanatory variable employment in foreign-controlled enterprises (FOREIGN_ENT), three groups of European countries were created: Group 1 (low level, less than 19%), Group 2 (moderate level, between 19% and 30%) and Group 3 (high level, more than 30%).
For the third explanatory variable the eco-innovation index (FOREIGN_ENT), the EUROSTAT classification of countries included in the study was used as follows: Category 1—“Catching up with Eco-Innovation” countries (for index values lower than 85%); Category 2—“Average Eco-Innovation performers” countries (for index values between 85% and 115%); Category 3—“Eco-Innovation leaders” countries (for index values higher than 115%) [
78].
Wackernagel, M. et al. observes that the assessment process of the ecological footprint is based on the following hypotheses [
79]:
possibility to track the consumption of human resources and waste generated;
measurement of consumed resources and waste generated through the necessary biologically productive area;
expression of each area in a standardized manner, through “global hectares”;
aggregate these measurement areas, to determine the aggregate demand of mankind;
measuring supply of nature ecological services using “global hectares”;
establishing the relationship between the supply and demand area.
Specialist studies have developed hypotheses that have highlighted the influence of factors in the process of reducing the ecological footprint. At the same time, the role of the sustainability has been redefined through the hypotheses formulated for the elaboration of a complex index showing the region’s sustainability between the environmental footprint and the environmental sustainability index [
80,
81].
The research-development-innovation factor is the most approached in the researchers’ hypotheses. The justification of the primary role lies in the design of products that significantly reduce energy consumption, carbon footprint, or climate change [
56,
57,
58,
59,
60,
61,
62,
63,
64,
65,
82].
The initial issue was to highlight the importance of the selected factors in the variation of the ecological footprint values and also to answer the question: can they produce a significant differentiation of the ecological footprint values? In this respect, given the conclusions of scientific studies performed by Lazarus et al., Lenzen et al., Rudolph & Figge, Terziovski & Guerrero, Bel & Joseph, Anderson et al., Calel & Dechelezprêtre, Haščič et al., Jaffe et al. and following the Principal Component Analysis applied in [
25,
26,
28,
70,
72,
74,
75,
76], the problem was transposed into three hypotheses to be tested:
Hypothesis 1 (
H1). The location of the countries included in the study determines a significant differentiation of the ecological footprint values.
Hypothesis 2 (
H2). The share of the employment in the foreign-controlled enterprises determines a significant differentiation of the ecological footprint values.
Hypothesis 3 (
H3). The eco-innovation level determines a significant differentiation of the ecological footprint values.
The testing of the three hypotheses was carried out by applying Kruskall Wallis and Mann-Whitney non-parametric statistical tests and by using the ranks assigned to each European country, according to the level of the ecological footprint.
For the quantitative description of the relationship between the ecological footprint (EF_C) and the three explanatory variables (region, eco-Innovation Index, and employment in foreign-controlled enterprises), the Proportional-Odds Cumulative Logistic regression model was applied.
Within the model a logit-type variable is created, corresponding to the ordinal dependent variable with
r response variants. The general relation of the model is presented as follows (Functions (1)–(5)):
where
Now, the model becomes:
or
The explanation of the symbols used:
= Ecological footprint—ordinal dependent variable, with scores denoted by j,
the total number of values on the ordinal scale (scores) of the dependent variable.
() = independent variables: employment in foreign controlled enterprises (FOREIGN_ENT), eco-innovation index (INNOVATION), and region (REGION)
—number of dependent variables (ecological footprint of consumption—EF_C).
, = intercept parameters or threshold values, different for each logit function, specific to the first r-1 (4) values on the ordinal scale of the dependent variable.
() represents the regression coefficients (the same for all logit functions) and expresses the contribution of factor in explaining the probability of producing the event defined by the ordinal values of the dependent variable.
the probability that the values of the dependent variable Y are at most equal to the score j;
, represents the odds-ratio.
After converting the logit values into probabilities, the model becomes (Function (6)):
In order to ensure a high accuracy and the reliability of the obtained results, following the application of the Cumulative odds ordinal logistic regression with the proportional odds, four assumptions have been verified:
The explained variable should be measured on an ordinal scale;
The explanatory variables should be continuous numerical variables, categorical or ordinal variables;
The absence of multicollinearity between the explanatory variables, a hypothesis that can be tested by applying the Variation Inflation Factor;
The existence of proportional odds, which tests whether the set of regression coefficients () is unique for all logit functions. In order to test this hypothesis, the Test of parallel lines is applied, starting with the null hypothesis that states the uniqueness of regression coefficients for all response categories of the explained variable (in other words, the null hypothesis states the adequacy of the proportional-odds regression model).
Further, we aimed at testing the existence of significant differences between the model with p explanatory variables and the logistic function, using the Godness-of-Fit test and Pearson and Deviance statistics.
The intensity of the association between the ecological Footprint and the other four explanatory variables is performed using similar indicators to the linear regression R Square indicator (Cox and Snell, Nagelkerke şi McFadden), showing the proportion in the total variance of the response variable that can be explained by the independent variables.
Testing the statistical significance of the model parameters is performed using the Wald test.
The model application methodology ends with generating odds-ratios and confidence intervals, corresponding to the chosen confidence level (usually 95%), in order to identify the perspective (predicted) behavior of the ecological footprint.
4. Results
The research began with the analysis of the ecological footprint evolution in European countries as a necessity of the further investigation of the future development prospects of the indicator.
4.1. The Evolution of Ecological Footprint in European Countries
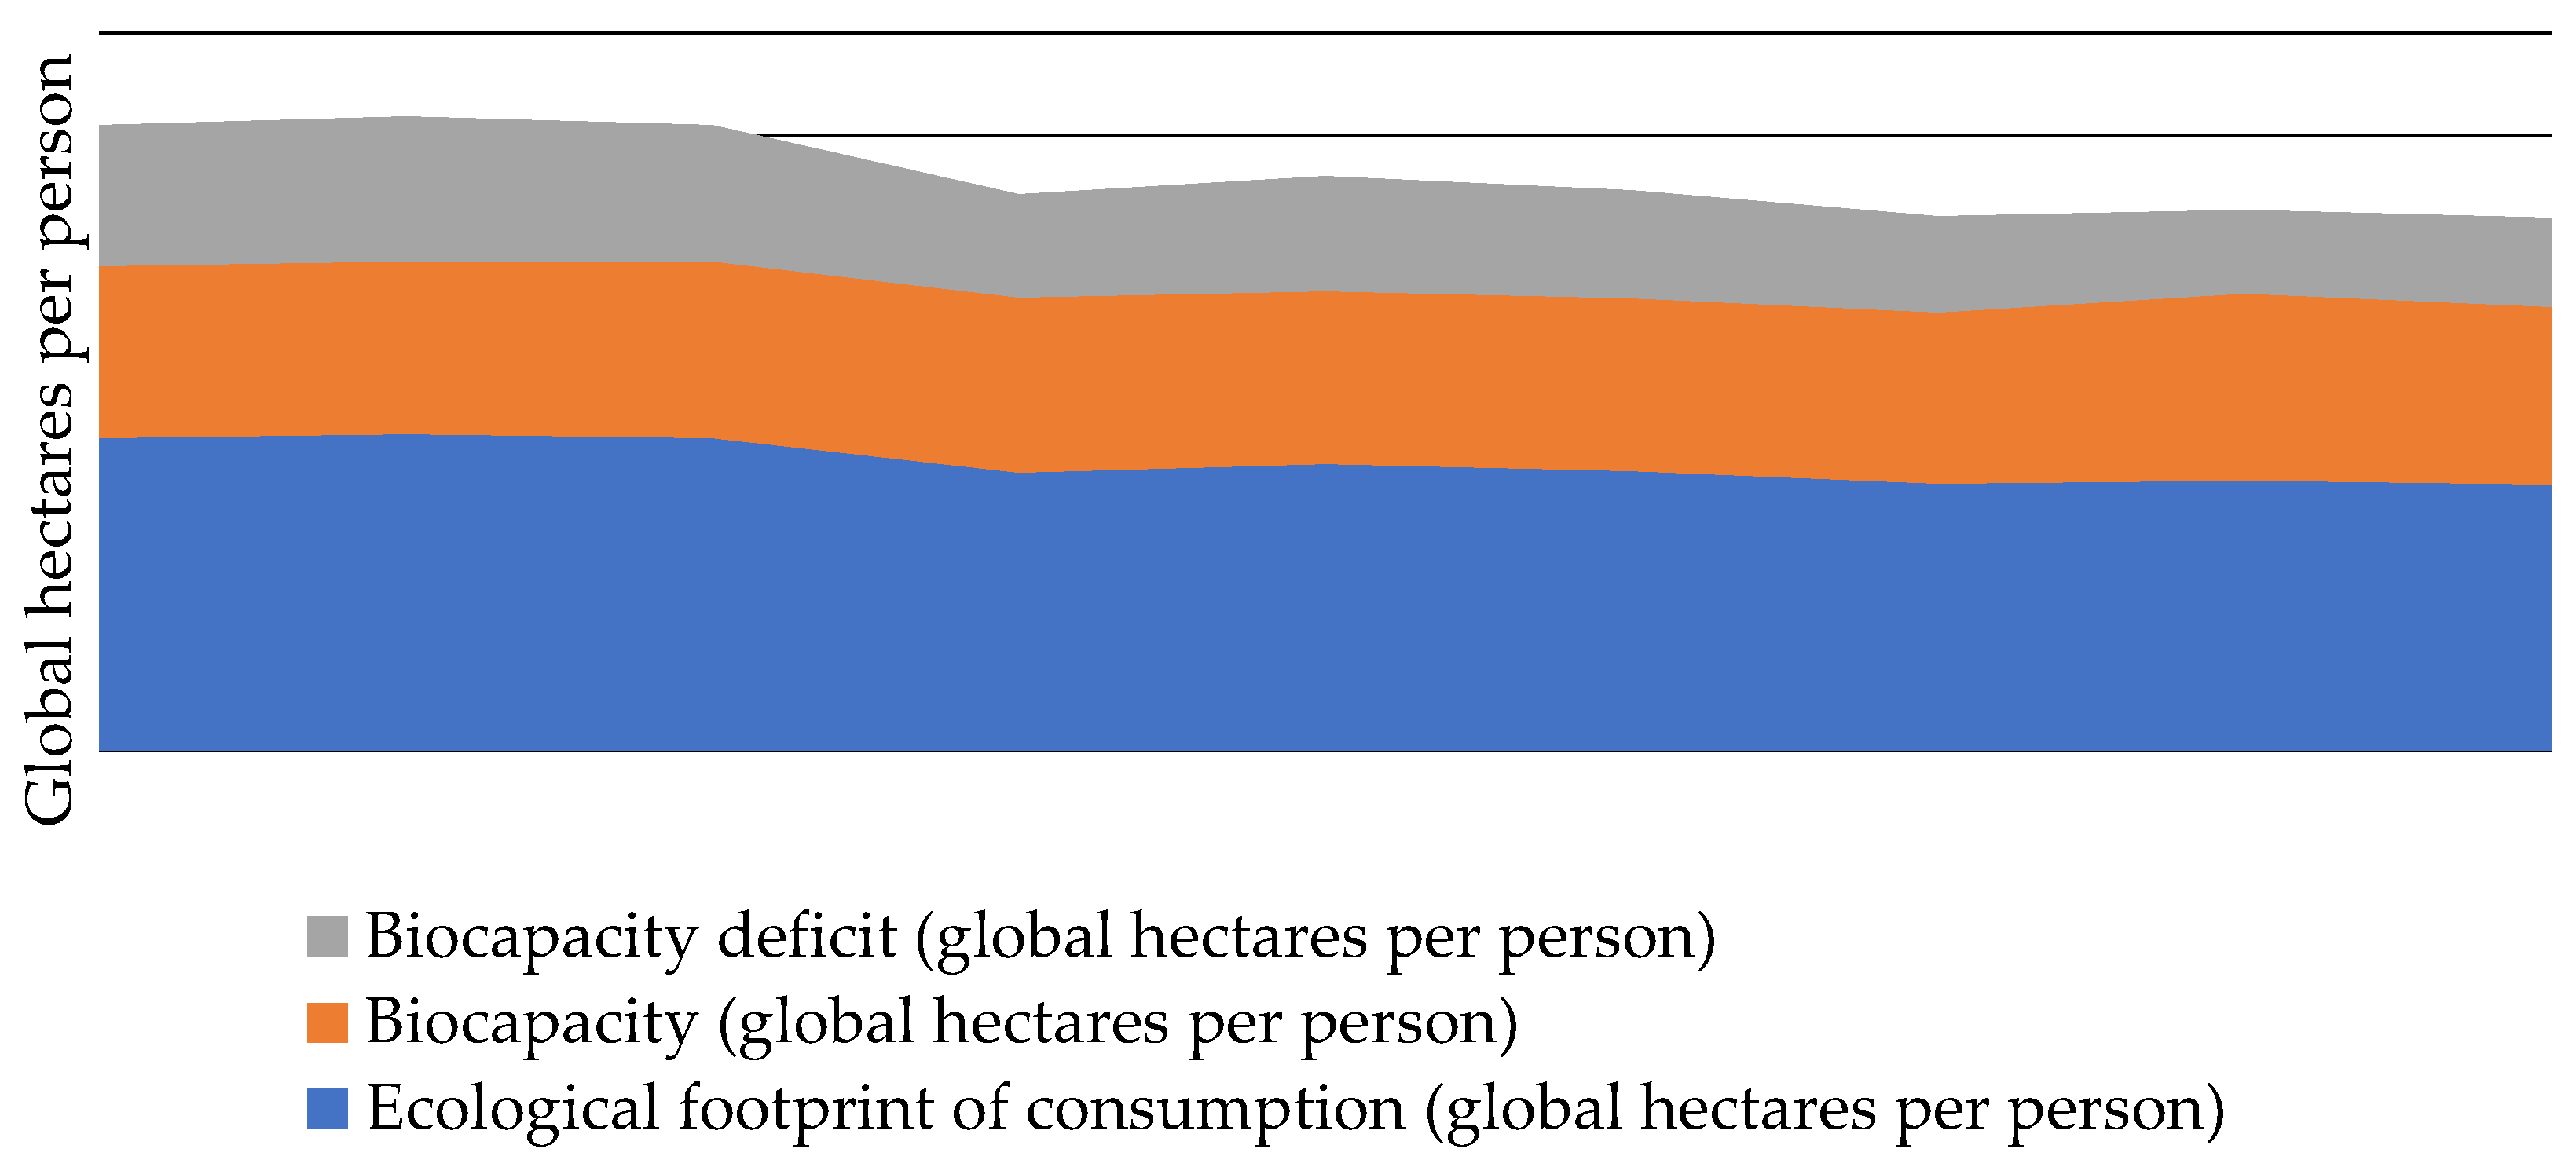
In Europe, the ecological footprint recorded a downward, sustainable trend over the last 9 years, while the biocapacity deficit—which remained negative over the whole period—declined (in absolute terms) from −2.7 global hectares per person (2006) to −1.7 global hectares per person in 2014, (
Figure 3).
At present, Europe’s ecological footprint is the second largest in the world, after that of North America. The regeneration capacity of the planet is unsustainably exceeded by high consumption, especially in conditions where the population in on an upward trend (
Figure 4).
Although there is a positive correlation between the level of ecological footprint and GDP per capita, in parallel with the sustainable evolution of the ecological footprint in Europe, in 2009 the financial-global crisis broke the upward trend of GDP per capita (which reached 26,300 Euros per capita in 2008). After 2008, the growth resumed, but more mitigated and more oscillating.
Taking into account the recodification of the explained variable ecological footprint of consumption on a 5 point-ordinal scale, a distribution of countries is presented as follows (
Table 2).
Luxembourg ranks among the top European countries with the highest ecological footprint (12.3 global hectares per capita), but also with the highest GDP per capita (80,600 Euros per inhabitant), followed by Denmark and Estonia (around 7 global hectares per person).
Referring to the classification of the EU countries by the binary variable REGION, the situation is presented as follows (
Table 3).
The lowest values of the ecological footprint are found in non-EU countries, characterized by a lower economic development level (Moldova—with 1.9 global hectares per person or Albania—2.1 global hectares per person). Among the EU countries included in the analysis, Romania experiences the lowest ecological footprint level (2.8 hectares globally per person), preceded by Bulgaria (with 3.2 hectares globally per person), both countries being characterized by a low level of economic development, in terms of GDP per inhabitant.
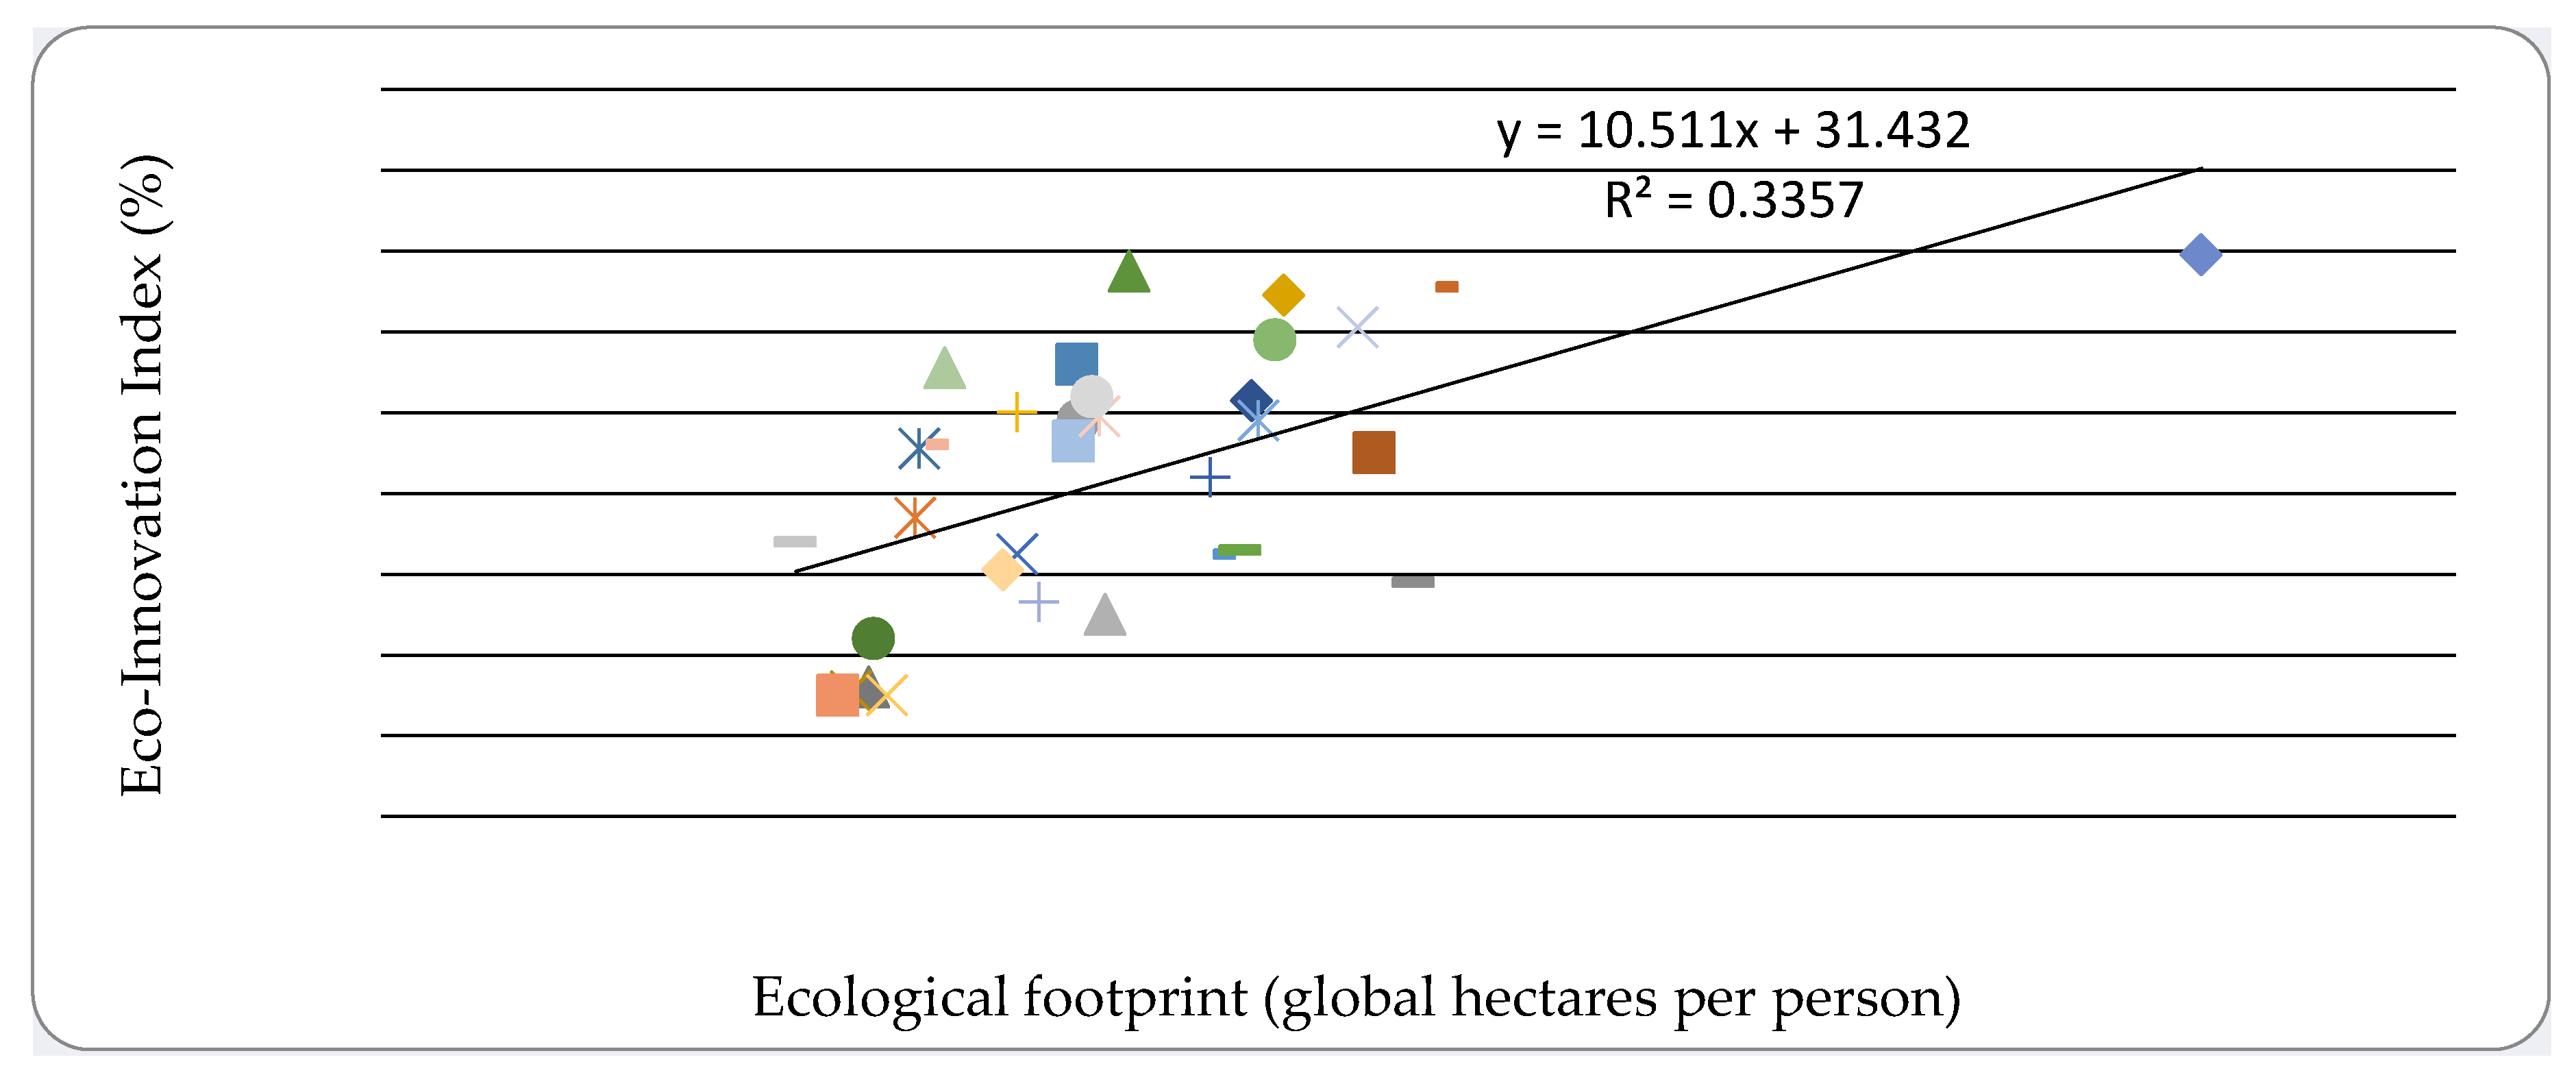
It can also be noted that there is a positive correlation between the ecological footprint and the eco-innovation level, quantified using the eco-innovation index (
Figure 5).
The distribution of the European countries by the categorical levels of the eco-innovation index is presented as follows (
Table 4).
Countries with a high level of eco-innovation (such as Luxembourg with 139% of the EU average, followed by Germany with 135% and Northern countries such as Denmark 131%, Finland 129%, or Sweden 121%) are also generally characterized by a high level of ecological footprint. This correlation can be explained, on the one hand, by the fact that the results of the innovation activity may lead to an amplification and an increase in production activity, which implies further an increase in the ecological footprint; however, on the other hand, it is possible that the decoupling between economic growth and the extensive increase in resource use has not fully occurred, decoupling that could have led to a reduction in the ecological footprint.
European countries included in the analysis were classified by the share of employment in foreign-controlled enterprises and into the following categories (
Table 5).
Analyzing the variability of the employment in foreign-controlled enterprises between European countries, one could observe that the minimum values are concentrated in South-European countries (Greece, Cyprus, Italy—below 10%), while Estonia and Luxembourg are the top countries, with indicator-values close to 40%. Romania ranks among the top five countries, with more than a quarter of the employees being employed in foreign-controlled enterprises.
4.2. Determinants of Ecological Footprint
The evolution of the ecological footprint previously presented is the benchmark that has enabled this research to be directed towards the discovery of future development trends.
The forecasting of future changes of the ecological footprint was performed based on the evolution of some of its determinants. In order to do this, a small number of important factors explaining to a higher extent the variability in the ecological footprint values were identified, by applying the Principal Component Analysis method. The Kaiser–Meyer–Olkin measure of sampling adequacy and the Bartlett’s Test of Ssphericity reveals the adequacy of the method’s application. (
Table 6).
Following the analysis of the Eigenvalues, two main components were extracted, explaining together 61.4% of the variation of the original data-set (
Table 7).
Communal values in the corresponding matrix reveal that an important part of the observed variables is explained by the main extracted components. Further, the application of the Factor Rotation Procedure allowed the identification of the two main components: 1st Component—consisting of the eco-innovation index and ecological footprint; 2nd Component—consisting of employment in foreign controlled enterprises (
Table 8).
Besides the two components of the ecological footprint previously identified, a third component has also been added: a spatial categorical component that refers to the EU membership.
The next stage of the research demonstrates that the three previously identified explanatory variables (FOREIGN_ENT, INNOVATION, and REGION) produce a significant differentiation of the ecological footprint of consumption.
The descriptive analysis of the European countries’ distribution by the ecological footprint of consumption reveals an overall average of 5 global hectares per capita, with a standard deviation of 1.78 global hectares per capita. The minimum value of the indicator (2.8 global hectares per capita) belongs to Romania, while the maximum value (12.3 global hectares per capita) belongs to Luxembourg. Compared to the previous year, the average value and the extreme values of the indicator increased, accompanied by an increase in the volume of economic activity; however, this was an unhealthy, unsustainable growth that was achieved through extensive use of resources that increased the harmful effects on the environment caused by human activities. The distribution is positively skewed, with low indicator values prevailing (below the EU average).
The application of the Mann–Whitney and Kruskall–Wallis tests emphasize that the three explanatory variables produced a significant differentiation of the ecological footprint of consumption, a conclusion that favors the analysis continuation of the dependency between the four variables, using a regression model.
The analysis of the cumulative probability distributions of the countries in the two regions, by the ecological footprint score, reveals that the cumulative probabilities have higher values for the countries in category 0, (non-EU member countries or newer EU member countries), compared to the countries in the 1st category (older EU member countries). In other words, we expect most of the European countries in category 0 to have a low ecological footprint, while most countries in category 1 have a high ecological footprint of consumption. One possible explanation for this could be that countries in category 0 are generally low-developed, low-income countries, where the production is less extended and therefore they are characterized by a lower ecological footprint.
The multinomial ordinal logistic regression model has the following form (obtained through the SPSS Polytomous Universal Model PLUM Procedure) (Equations (7) and (8)):
After converting the
logit values into probabilities, the model becomes (Equation (9)):
where
, represent the intercept parameters, different for each logit function (threshold values)
represent the regression coefficients (the same for all logit functions).
The information on the model parameters is presented in the following table (
Table 9).
The uniqueness of the three regression coefficients in all logit functions reveals the same effect of the independent variables on the variation of the ecological footprint, in all four logit functions, and also the existence of proportional odds; thus, the results obtained in the above table (
Table 9) are translated into the following form of econometric models (Equations (10)–(13)):
The validity of these models also involves testing the significance of the parameters.
Examining the results in
Table 9, it can be observed that all the model parameters are statistically significant (Wald test values are higher than the critical value, and all the significance levels are lower than the threshold of 0.05). All three Slope parameters of the three explanatory variables are statistically significant, indicating that the corresponding explanatory variables have significant effects on the variance of the dependent variable. The first two Slope parameters are positive, showing that the share of the employed population in foreign-controlled enterprises, on the one hand, and the eco-innovation index, on the other hand, exert a significant direct influence on the variation of the ecological footprint (through the odds-ratios). This type of influence can be explained by the fact that the foreign controlled companies—although in a smaller number—have a significant impact on the economy of the origin countries, given that they are generally larger than average and generate a substantial added value and an important share of employees—especially in some European countries (Luxembourg, Slovakia, Romania, Czech Republic, Estonia, Hungary, and Poland) [
78]. In this way, they also contribute to an increase in the ecological footprint. On the other hand, “Eco-innovation … promotes all forms of innovation that reduce environmental impacts and strengthens resilience to environmental pressures” [
83].
The real data on which our model was based revealed a direct, positive relationship between the eco-innovation index and the ecological footprint (weak positive coefficient), which can be explained by the fact that—despite the above definition—innovative economic activities have not achieved—to a satisfactory degree—an increased resource efficiency, so as to ensure sustainable development and reduce the negative impact on the environment. The third model parameter—corresponding to the REGION variable—is negative and statistically significant, indicating that countries in category 0 (the reference category: non-EU or newer EU countries) are predominantly assigned reduced scores for the ecological footprint, lower scores of the explained variable are more likely for the first category of countries. As the countries pass from one category to another—the likelihood of meeting the high ecological footprint scores decreases. This can be explained by the fact that most non-EU or recent EU countries are characterized by a lower level of economic development, support for a lower environmental footprint.
Estimated values of model coefficients show that 1% increase in the employment in foreign-controlled enterprises is expected to increase the log-odds of the ecological footprint moving to a higher category, on average, by 0.141 (while the other explanatory variables do not change).
Also, at each 1% increase in the Eco-innovation index, it is expected an average increase in the log-odds of the ecological footprint of moving to a higher category is 0.05 (when the other explanatory variables do not change). As countries pass from one category to another, the log-odds of the ecological footprint moving to a higher category is expected to decrease, on average, by 1.817.
For a much clearer emphasis on the interdependence between the ecological footprint and its determinants, there were further determined and interpreted the proportional odds ratios and their confidence intervals (
Table 10).
The results show that a 1% increase in the share of the employed population in foreign-controlled enterprises is expected to increase 1.152 times the odds of the ecological footprint to move from a lower to a higher score (minimum 1.04 times, and maximum 1.276 times—for 95% confidence level), if the other explanatory variables remain constant. At the same time, it is expected that a 1% increase in the eco-innovation index will lead to an average increase in the odds that the ecological footprint will go from a lower to a higher category of 1.52 times (at least 1.022 times and up to 1.182 times—for 95% confidence level), if the level of the other explanatory variables does not change. The odds of the ecological footprint moving from a lower to a higher score are, on average, 0.163 times lower for a non-EU member country or an older EU member country than for an old EU member country (minimum 0.031 times and maximum 0.847 times—for 95% confidence level).
4.3. Evolution Trends of Ecological Footprint in the Next Period
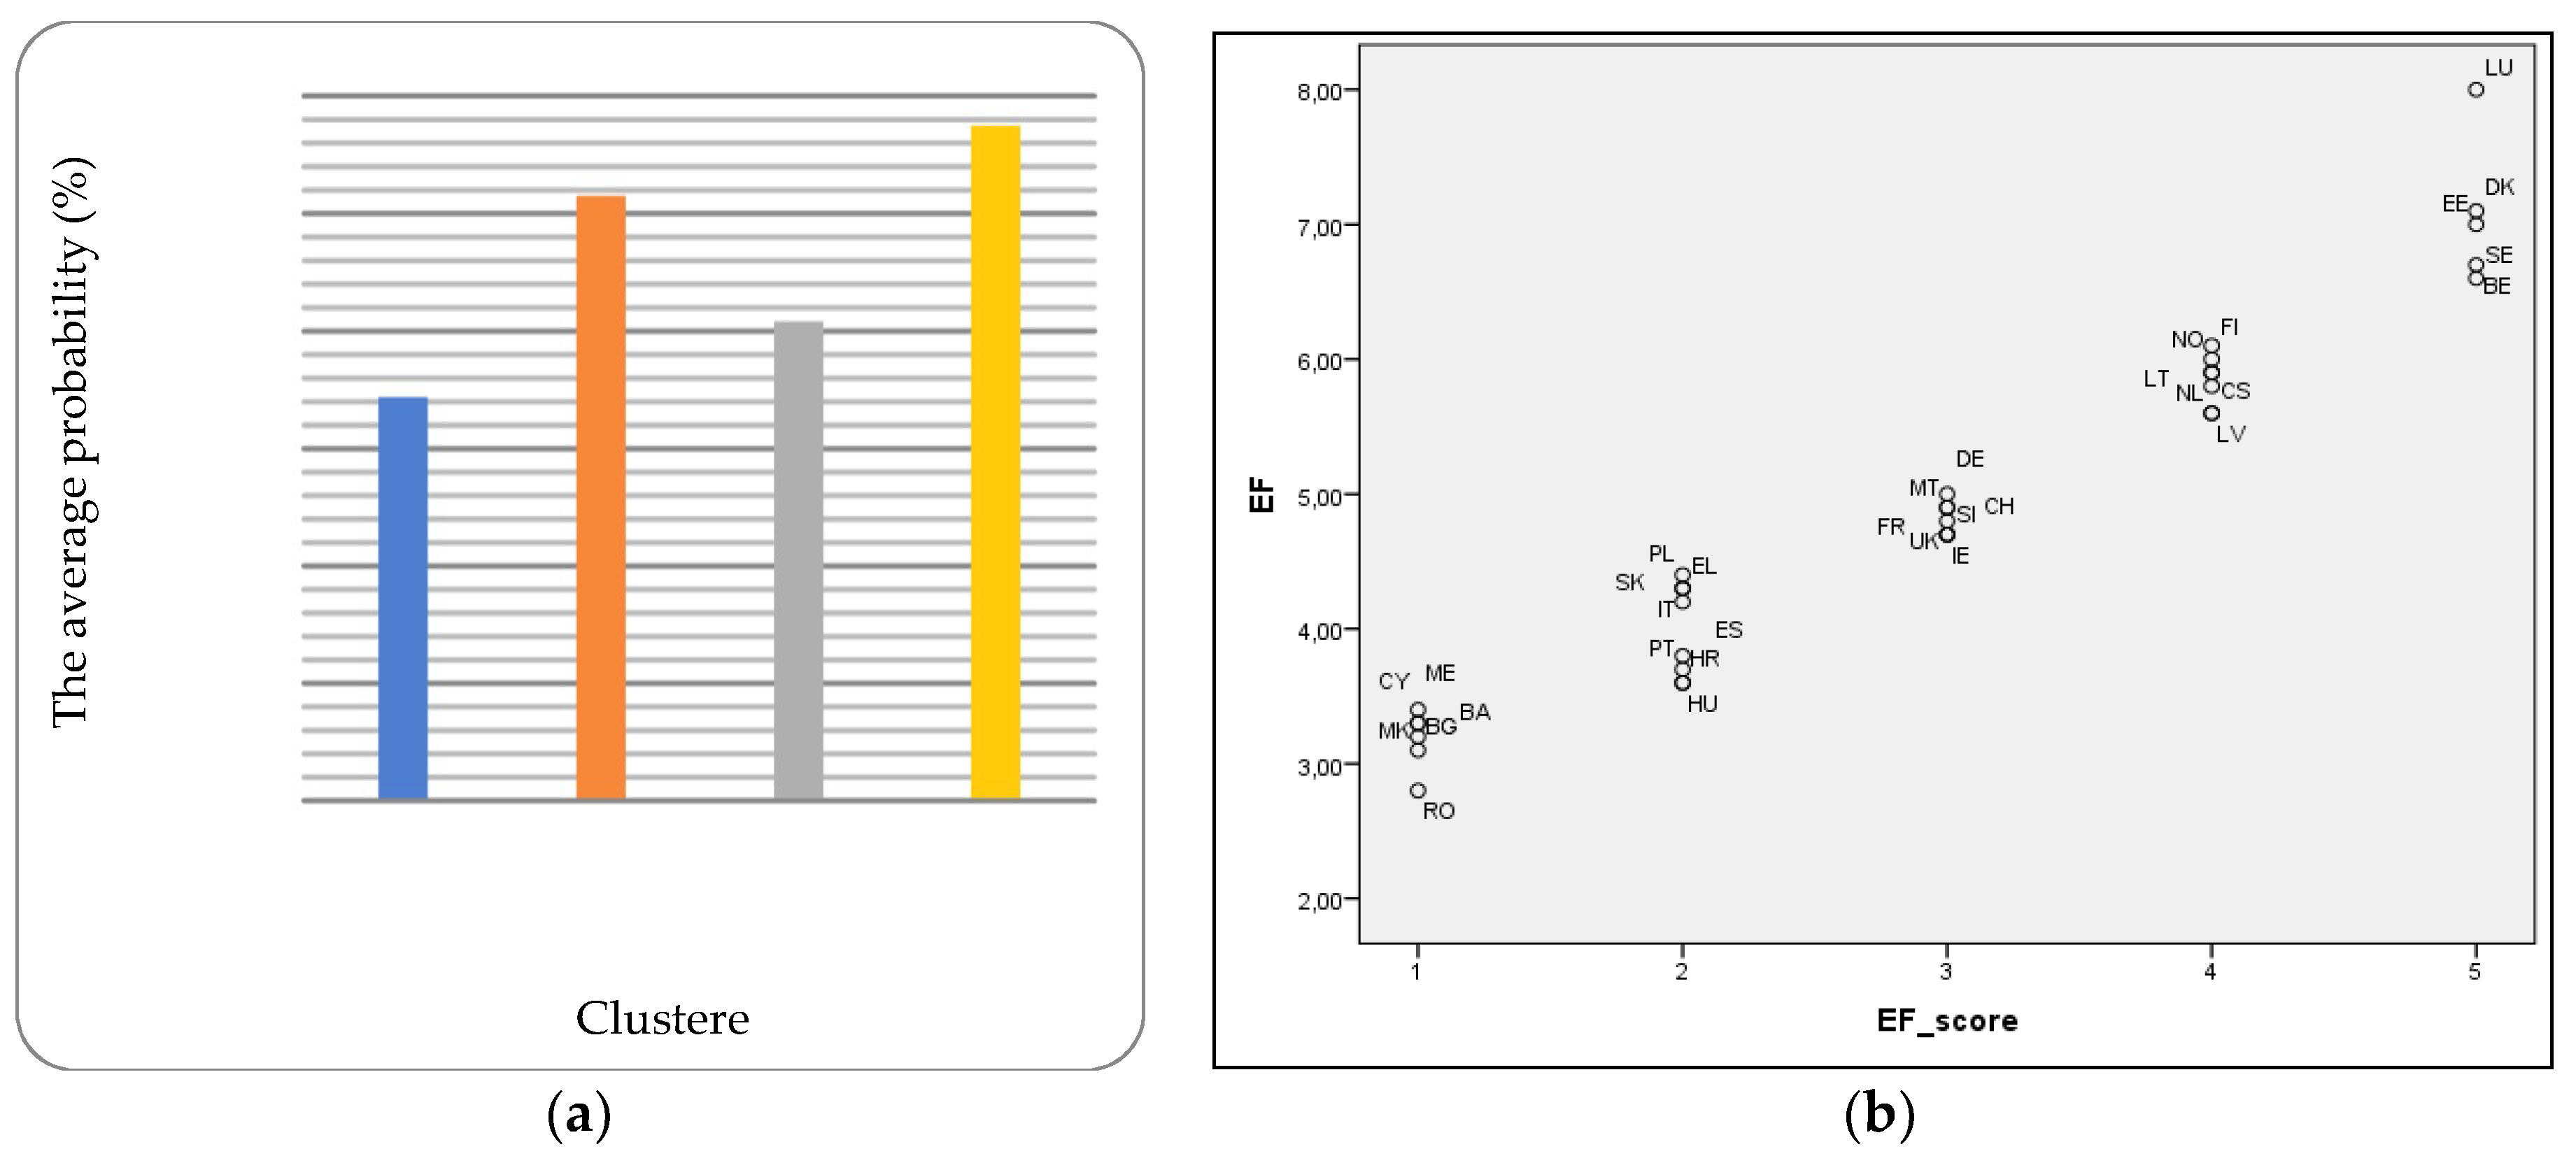
A much more detailed situation of the ecological footprint, in relation to the three factors was obtained by clustering the European countries included in the analysis, based on the four variables analyzed. The clustering results have allowed the creation of four country-profiles, for which the average probabilities of changing the ecological footprint was computed (
Table 11).
Profile 1 includes low-developed, low innovative-potential countries, for which—even if they have registered an increase in the GDP per capita—the indicator values remained at low levels, assigning them a low chance of increasing the ecological footprint from one category to another.
Profile 2 category consists of countries with slightly higher development potential of ecological footprint in the next time-period, due to higher chances of increasing the values of the two factors (eco-innovation and economy freedom). Although they have a fairly high level of eco-innovation, further steps still need to be taken towards increasing the efficiency of using non-renewable resources and towards increasing the renewable resources usage.
Profile 3 is characterized by developing countries that have experienced some positive developments in the eco-innovation index and the share of employed people in foreign-controlled enterprises, although their level has remained rather low. Under these circumstances, they have a significant potential to move to a higher category of environmental footprint, if they also record a significant increase in the GDP per capita over the next period.
The components of Profile 4 are countries with a high level of economic development and a high potential for increasing the ecological footprint under the impact of an upward trend in eco-innovation and economic openness. The likelihood of passing the ecological footprint into a higher category or of maintaining a high ecological footprint level could be even higher than the estimated one, but we appreciate that these countries have the potential for developing advanced technologies, allowing a more efficient and productive resource use that ensures a decoupling of economic growth from environment exploitation (
Figure 6).
As a conclusion, the behavior of the variables analyzed in the research was observed as a result of the clustering of the 33 European countries through average probabilities that indicated the changes in the environmental footprint from a lower category to the other.
5. Discussion
Based on the analysis performed, it can be estimated that a 1% increase in the share of the employed population in foreign-controlled enterprises is expected to increase 1.152 times the odds of the ecological footprint to move from a lower to a higher score (minimum 1.04 times, and maximum 1.276 times—for 95% confidence level), if the other explanatory variables remain constant. At the same time, it is expected that a 1% increase in the eco-innovation index will lead to an average increase in the odds that the ecological footprint will go from a lower to a higher category of 1.52 times (at least 1.022 times and up to 1.182 times—for 95% confidence level), if the level of the other explanatory variables does not change.
The first cluster (Profile 1 category) includes less economically developed countries, most of them being ex-socialist countries. They are characterized by weak innovative potential; therefore, the ecological footprint in these countries has lower chances of passing into a higher category. For countries in the second cluster (Profile 2 category) the development potential of the ecological footprint in the next time-period is more significant, powered by higher probabilities of increasing the values of the two factors included in the analysis (eco-innovation and economic openness). The third cluster (Profile 3) is also formed from the former socialist developing countries where there was a slightly higher level of employment in foreign-controlled enterprises (above the EU average), but a low level of eco-innovation. Both factors have experienced some positive developments, which is why we believe that they hold a significant potential to move into a higher category of ecological footprint, if they also record GDP per capita growth in the next period. In the fourth cluster (Profile 4), countries with a high level of economic development were included where the upward trend in eco-innovation and economic openness can provide a high potential for environmental footprint growth. The likelihood of crossing the ecological footprint in a higher category or maintaining it at a high level is quite significant, but, by making resources more efficient and productive, by developing advanced technologies, these countries can achieve sustainability in the evolution of the ecological footprint, thus ensuring a decoupling of economic growth from environment exploitation.
Given that among the EU member states, Romania has the lowest ecological footprint level, it is remarked at the country level that the eco-innovation index has decreased in the last three years, reaching a value of 65% of the EU average. At the same time, in Romania, the personnel employed in foreign-controlled companies have increased slightly in recent years, to a value slightly exceeding 27%. Based on the developed regression model and for the above-mentioned levels of the explanatory variables, it is estimated that Romania has a 72.89% chance of maintaining at a low ecological footprint.
A slightly higher probability of 75.42% was also estimated for Bulgaria, a result explained by the fact that it currently holds one of the lowest eco-innovation indices among the European countries (38% of the EU average) and a lower share of population employed in foreign-controlled enterprises than Romania’s (about 16%), thus having a low chance of increasing economic activity to an extent that would lead to a significant increase in the ecological footprint.
At the opposite pole, there are European countries with a high economic development level and a high ecological footprint level (category 5). They are also characterized by a high level of economy openness, reflected by a significant share of employees in foreign-controlled enterprises, and by an eco-innovation index that far exceeds the EU average. Among these countries there are Luxembourg, Sweden, Denmark, or Finland (with a share of 16–39% of employees in foreign-controlled enterprises and an eco-innovation index ranging from 120 to 144%). For countries in this category, there were estimated increased probabilities of maintaining a high or very high level of ecological footprint (between 62% and 68%). Some of these countries (such as Finland or Sweden)—although they are among the European leaders in eco-innovation—have a lower sub-component of the eco-innovation index: the resource efficiency component. It is expected, however, that these countries—belonging to the “eco-innovation leading” group—will have the necessary resources to improve this component, thus achieving a reduction in the ecological footprint in the future.
The direct influence of the first factor in the regression model (employment in foreign controlled enterprises—which expresses economic freedom) on the ecological footprint behavior is consistent with the research results of Lazarus et al., Lenzen et al. Other studies (like Rudolph and Figge) showed no significant influence of economic and political globalization policies on the ecological footprint behavior over the short term. Our results on the relationship between the eco-innovation and the ecological footprint are consistent with those of Terziovski & Guerrero, showing a positive impact of sustainable practices and innovation performance. However, the literature reveals both positive and negative environmental influences of the technology. One explanation of this fact might be related to the complexity of the “innovation” and “eco-innovation index” concepts. Due to this, it would be interesting to analyze in more detail the impact of the innovation activity on the behavior of the ecological footprint, by considering some sub-components of the eco-innovation index. In this way, the sub-components with a predominantly positive influence on the changes of the ecological footprint could be separated from those with a predominantly negative influence.
In compliance with our results, data provided by the Global Footprint Network also indicates significant differences between the level of ecological footprint in developed European (countries, which are mostly old EU members), and those from developing countries (countries that are either new EU members or non-EU members). Lenzen et al. have obtained similar conclusions, but for a larger panel of countries. However, this study is limited to European countries, eliminating countries for which there was a significant lack of statistical data.
In order not to deviate from the path of sustainable development, European countries should make an effort to evolve favorably, in the context of reducing the level of their ecological footprint, or at least maintaining it at the current level.
6. Conclusions
On the background of the research undertaken so far to capture the determinants of sustainability, the present study completes the ecological footprint analysis—as a measure of sustainability—by combining three influencing factors, less approached, especially in this type of association: the openness degree of an economy (reflected here by the indicator population employed in foreign-controlled enterprises), the research-innovation level, which can be considered an exponent of the information society (quantified here through the eco-innovation index) and a spatial factor referring to the access to the European Union area, a factor which also incorporates strategies and policies to ensure Europe’s sustainable development. In this way, the analysis predicts the behavior and changes in the behavior of the ecological footprint, under the impact of scientific progress, economic freedom, and globalization. The evolution over time of the selected indicators has been analyzed based on the data provided by EUROSTAT and the Global Footprint Network, through the National Footprint Accounts 2018 Edition, covering 33 European countries.
The novelty of the article also consists of the indicators chosen in the evaluation of the three determinants. The identification of the main pillars of the ecological footprint, carried out by applying the Principal Component Analysis, is followed by statistical testing of the existence of a significant link between these factors and ecological footprint. At the same time, the relationship between the four variables is modeled using a multinomial ordinal logistic regression model with cumulative probabilities, based on proportional odds (through the SPSS Polytomous Universal Model PLUM), which identifies a country’s probability of passing from a lower category to a higher category of the ecological footprint of consumption, depending on the changes in the selected influence factors. The application of the model revealed that the share of the employed population in foreign-controlled enterprises, on the one hand, and the eco-innovation index, on the other hand, exert a significant direct influence on the variation of the ecological footprint (through the odds ratios). As regards the EU membership/non-EU membership, the model reveals that countries in category 0 (non-EU or recent EU member countries) are predominantly associated with low scores of the ecological footprint.
A note of originality was also conferred by clustering the European countries included in the sample, which allowed for a more detailed and complex picture of the ecological footprint in relation to the three factors. Thus, four profiles of European countries were outlined, which were then characterized by the behavior of the four variables included in the study and the average probability of changing the ecological footprint from a lower category to a higher one was determined.
It is particularly important to have an environmental management system in compliance with international standards, so as to ensure the compatibility and comparability of environmental assessments. Implementing such a system can lead to increased environmental corporate responsibility and improved corporate performance [
84]. Thus, policy makers in developing countries (countries which, like Romania, are mainly net exporters of biodiversity) should create a more restrictive legislative framework, following the examples in developed countries, to protect their biodiversity, their own natural resources, and not sacrifice them for increasing the export of products.
Also, economic growth must be achieved in the context of orienting production and consumption towards green products, encouraging eco-friendly behavior, and the environmental responsibility of companies and individuals [
85,
86]. The innovative factor can help sustain economic development and reduce the ecological footprint by focusing research and innovation activities on increasing resource productivity, green investments aimed at obtaining advanced technologies to make more efficient use of non-renewable resources, and increasing the use of renewable energy [
87,
88]. By granting funds or tax incentives, the Government and other competent institutions can support research and development activity in order to obtain and apply the innovative results in greening the production process. The process of globalization and the expansion of economic freedom can favor a sustainable ecological footprint by adopting more restrictive policies in the European countries, targeting large polluters, trade between states, tax system, ecological competition, and environmental responsibility. In this respect, it would be helpful continuing the common policy application of the EU Member States in order to reduce the carbon footprint and to set and monitor national limits for greenhouse gas emissions.
The authors intend to continue their research on the ecological footprint behavior, by identifying other variables with significant impacts, in order to discover new ways of enrolling the evolution of the ecological footprint on a downward sustainable trend over the next horizon.
Thus, a decoupling of the economic growth from increasing resource exploitation can be ensured, in order to reduce the harmful effects of human activity on the environment and to maintain development sustainability.


