Article

Equilibrium Strategy-Based Optimization Method for Carbon Emission Quota Allocation in Conventional Power Plants

1
Business School, Sichuan University, Chengdu 610064, China
2
Tourism School, Sichuan University, Chengdu 610064, China
*
Author to whom correspondence should be addressed.
Sustainability 2018, 10(9), 3195; https://doi.org/10.3390/su10093195
Submission received: 28 July 2018 / Revised: 17 August 2018 / Accepted: 4 September 2018 / Published: 6 September 2018
(This article belongs to the Section Energy Sustainability)

Abstract

:
Carbon emissions have become significant obstacles to sustainable development. To control carbon emissions, rational carbon emissions quota allocation provides an effective way. As conventional power plants (CPP) are the major contributors to global carbon emissions, this study proposes an equilibrium strategy-based bi-level multi-objective model for carbon emissions quota allocation which fully considers the conflict between the authority and the CPPs, and the conflict between economic development and environmental protection. In addition, uncertainty theory is employed to represent the imprecise parameters in reality. The proposed model is then applied to Shenzhen to show the practicality and efficiency of the proposed model. An interactive algorithm is developed to calculate. Based on results, the proposed method can achieve carbon emissions reductions, cooperative authority-CPPs relationship and economic-environmental coordination. It also indicates that the authority would allocate greater quotas to lower carbon emissions power plants. These results demonstrate the proposed method could help seek optimal allocation policies.

1. Introduction

With the development of economy and urbanization, power consumption grows strongly. It was stated by BP Energy Outlook that that almost 70% of the increase in primary energy was used for power generation, with power demand growing three times more quickly than other energy [1]. According to BP Statistical Review of World Energy, electricity generation has increased from 20,046 TWh to 25,551 TWh in the past ten years, 38.1% and 23.2% of which were respectively generated by coal and gas [2]. Conventional coal fired power plants (CFPP) or gas fired power plants (GFPP) are still the predominant electricity generators and will be for decades to come around the world [3]. However, as two-thirds of the world’s electricity is generated by conventional power plants (CPP), the amount of carbon emissions is up to 33,444 million tonnes just in 2018 [2,4]. Carbon dioxide is an important greenhouse gas which resulted in global warming and sea level rise [5]. As it would take a long time to generate electricity mainly from renewable energy sources, addressing vast carbon emissions from CFPPs or GFPPs is extremely urgent [6].
Some research regarding reducing carbon emissions from CPPs proposed technical reduction measures or structure-adjustment reduction measures. Mao et al. enumerated carbon emission reduction measures in the power industry; for example, coal washing, carbon capture and storage/sequestration, substituting large-sized units for small-sized ones, circulating fluidized bed power generation technology, etc. [6]. Fisher et al. used direct oxygen input to burn the carbon-based fuel in a nitrogen deficient atmosphere created by flue gas recirculation and achieved the aim of less carbon emissions and a near elimination of nitrogen oxides in the flue exhaust [7]. Amitava et al. reported on an effective chemical solvent scrubbing method to remove carbon dioxide from the flue gases emitted from the power plants, which can minimize energy requirements, equipment size as well as corrosion [8]. Although these methods can effectively reduce carbon emissions, they are expensive and not suitable to implement at a large scale.
Policy schemes, such as command and control, carbon tax and emissions trading (ET) have been adopted to reduce carbon emissions in CPPs. Holbert et al. analyzed the use of satellite-based methods which included the global positioning system and low earth orbit satellites for the command and control of power systems, and proposed a multiagent supervisory-level power system stabilizer as a potential wide-area control structure [9]. Olsen et al. proposed bi-level method and weighted sum bisection method to determine the lowest emission tax rate that can reduce the anticipated emissions of the power sector below a prescribed, regulatory-defined target, and concluded that carbon tax increased the value proposition for investment in new cleaner generation, transmission, and energy efficiency [10]. Cong et al. studied the impact of introduction of ET on China’s power sector in a computable framework using an agent-based model and found that ET can provide China government and related decision-makers a quantity tool for designing carbon market [11]. Carbon tax is an immediate carbon price signal. However, the total carbon reduction is hard to control, and the rational tax rates are hard to determine [12]. Of these policy schemes, ET is a more suitable option as it is political feasibility and cost effectiveness that can provide economic incentives to meet the policy targets [13,14].
The researches of ET have always focused on carbon emissions quota allocation(CEQA). Ma et al. developed a bi-level programming model to optimally allocate carbon emission quotas to the corporations based on both fairness and efficiency principles, and then employed a zero sum gains data envelopment analysis model to evaluate the efficiency of the allocation [15]. Li et al. set the mixed quota allocation method which was most proper for all 30 provinces in China and considered survival and development, and indicated the proposed method could make 76% of province be in the status of normal operation [16]. Kim et al. assessed the impact of quotas and carbon prices on pulverised coal power plant and gas-fired power plant in the UK using long-term dispatch model and the integrated planning model, and draw some conclusions about the nature of over-compensation of freely distributed quotas [17]. Although these researches have provided some valuable insights, the realistic is more complex and further research is needed.
In CEQA problem, there always exists contradiction between the authority and CPPs due to different objectives. The authority allocates carbon emissions quota to every CPP based on its objectives of economic development and environmental protection. Under the carbon emissions quota, CFPPs and GFPPs makes its generation planning to pursue the largest economic profits. Equilibrium strategy has proved to be a powerful tool to deal with this problem. Zhang et al. designed a Pigovian tax-based equilibrium strategy for waste-load allocation for water quality management that fully considers the Stackelberg game between the environmental regulators and the river system dischargers [18]. Hassin et al. presented a equilibrium strategy model of parallel queues in front of two servers that provided the same service, and found cascade equilibrium strategies evened when the servers were identical with respect to service rate or inspection cost [19]. These researches have inspired the application of an equilibrium strategy method in CEQA problem to tackle the conflict between the authority and CPPs for carbon emissions reduction to ensure sustainable development. As equilibrium strategy is an abstract theory, bi-level programming method is used to accurately represent equilibrium strategy [20].
However, there are still two barriers have to be overcome when adopting equilibrium strategy in CEQA problem. First, the trade-off between economic development and environmental protection needs to be fully considered. Protecting the environment during promotion economic development is the requirement of sustainable development. Therefore, multi-objective programming method is employed to balance the trade-off between economy and environment. The second barrier is that the uncertainties in the decision making system are inherent. For instance, carbon emissions factor are difficult to measure exactly to unstable combustion environment. Therefore, uncertainty theory is applied in CEQA problem.
From the discussions above, for the purpose of carbon emissions reduction to ensure sustainable development, an equilibrium strategy-based bi-level multi-objective programming method under an uncertain environment is proposed to build the cooperative relationship between the authority and CPPs and balance the trade-off between economic development and environmental protection. The remainder of this paper is organized as follows. In the next section, details of the key problems are explained in preparation for the establishment of the mathematical model, the mathematical form for which is given in Section 3. In Section 4, a real world case study is then presented to demonstrate the effectiveness of the proposed model and solution approach. Then, in Section 5 the model results are analyzed and comprehensive discussions and policy implications provided. Conclusions and future research possibilities are given in the final section.

2. Key Problem Statement

To develop an equilibrium strategy-based bi-level multi-objective programming method to reduce carbon emissions, some background and descriptions are given.
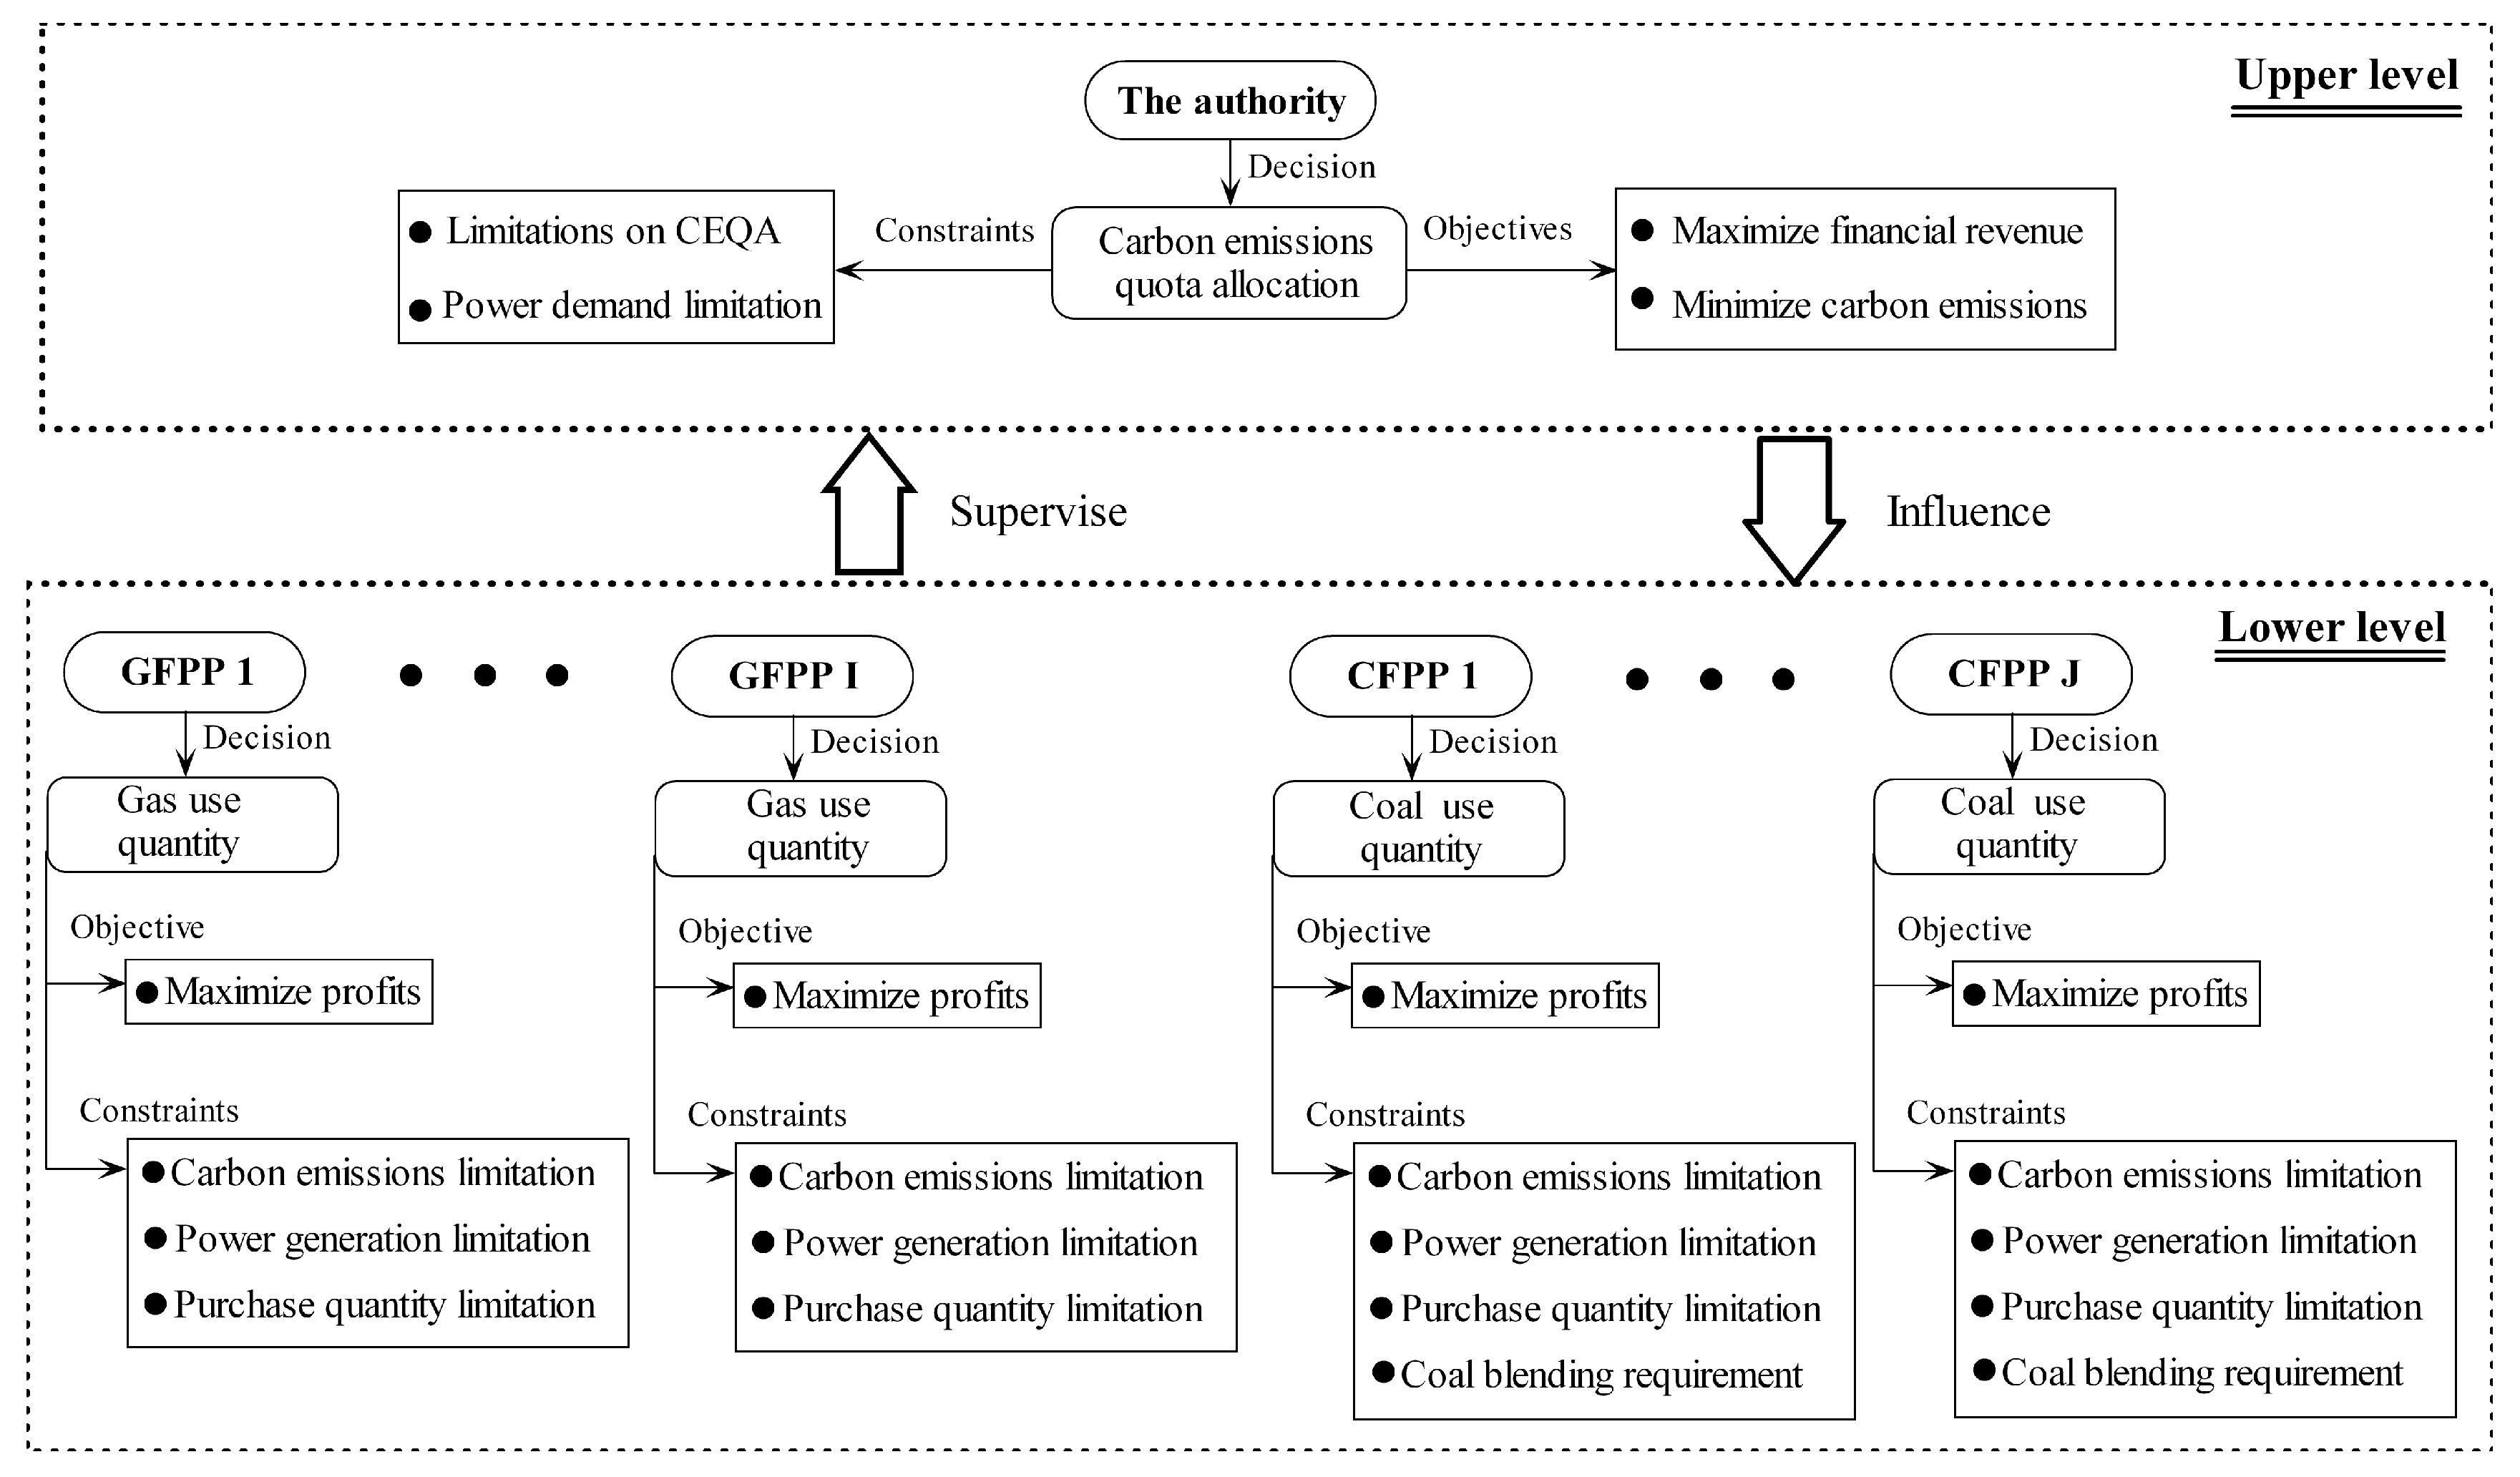
There are several decision makers involved in carbon emissions: the authority and CPPs. In the decision making system, the authority has the ability to make decisions first due to its higher position. Considering its own objectives, the authority makes an initial decision on CEQA and allocates carbon emissions to every CPP. Under the limited carbon emissions quota, CFPPs and GFPPs make their decisions on fuel use quantity and then give feedback to the authority. After the authority receives feedback from various CPPs, it has to reconsider the initial CEQA, makes an updated decision on CEQA and forwards the new scheme to the CPPs. The CFPPs and GFPPs again decide on fuel use quantity based on the new carbon emissions quota and feed back to the authority. From this interactive process, the authority finally decides on an optimal strategy under a termination condition, and the CPPs develop their own optimal coping strategy. As a result, the authority and CPPs finally reach an equilibrium that indicates the global satisfactory solution for the CEQA problem. During the process, the conflicts and cooperation coexist between the authority and CPPs. Therefore, a Stackelberg game is shaped; the authority plays the part of a leader while the CPPs act as the followers [21]. Bi-level programming, a hierarchal decision making structure, has the ability to describe Stackelberg game of different decision makers [22,23,24].
As rather serious environmental problems incurred in CFPPs and GFPPs, the element of environmental protection should be given due consideration and incorporated into CEQA problem. How to coordinate the relation between economic development and environmental protection has been an attraction [25,26]. In CEQA problem, the trade-off between economic development and environmental protection is difficult for the authority to balance. In this paper, financial revenue represents economic development as a result of with it the authority can ensure stable development for a long term, while carbon emissions represents environmental development since the amount of carbon emissions is one of important indicators to comprehensively assess the status of sustainable development. Therefore, multi-objective programming is adopted to assist the authority in making an optimal decision on CEQA for a harmonious development of economy and environment. From the perspective from CPPs, under the limited CEQA, reasonable arrangement of generation is necessary. With regard to GFPPs, they make an optimal strategy concerning fuel use quantity within some limitations in order to pursue largest economic profits. However, as for CFPPs, the situation is more complex and coal blending is usually their option. Coal blending which involves the blending of several kinds of coal to ensure the volatile matter content, heat rate, ash content, moisture content and sulfur content satisfy power generation utility requirements, is a cost-effective method [27]. Dai et al. established a simulation-based fuzzy possibilistic programming model which fully considered uncertainty reflection, pollutant dispersion modeling, and the management of coal blending and the related human health risks [28]. Shih et al. developed a multi-objective chance-constrained optimization model which involved uncertainty and variability in coal properties, and the effect of off-design coal characteristics on power plant performance and cost [29]. Therefore, coal blending method is employed in CFPPs for purpose of achieving maximum profit under limited CEQA.
As discussed above, the complicated decision-making relationship between the authority and CPPs for CEQA problem is shown graphically in Figure 1. The mathematical form for this equilibrium strategy-based bi-level multi-objective programming method is given in the next section.

3. Modelling

In this section, a bi-level programming for the CPPs CEQA problem is constructed. The mathematical description is given as follows.

3.1. Notations

3.1.1. Indices

iGFPP index, i δ = 1 , 2 , , I .
jCFPP index, j σ = 1 , 2 , , J .
kCoal index, k ψ = 1 , 2 , K .
wPollutant index, w ξ = 1 , 2 W .
rCoal quality index, r τ = 1 , 2 R .

3.1.2. Crisp Parameters

α Added-value tax that the authority levies on CPPs.
β Price of a unit carbon emission quota.
C E i g l , C E i g u Lower and upper bounds for CEQA in GFPP i.
C E j c l , C E j c u Lower and upper bounds for CEQA in CFPP j.
DPower demand in a region.
E D i g , E D j c Power needed to be generated by GFPP i, CFPP j respectively.
P g , P c Power price generated by GFPPs, CFPPs respectively.
Q i g Total quantity of gas that GFPP i can buy.
Q j k c Total quantity of coal k that CFPP j can buy.
C T j w Unit operating price of pollutant k in CFPP j.
η i w Emission reduction efficiency of pollutant k.
L C E The actual carbon emissions in the last production period.

3.1.3. Uncertain Parameters

T i Conversion parameters from a unit of gas to power in GFPP i.
T j k Conversion parameters from a unit of coal k to power in CFPP j.
N i g , N j c Conversion parameters from unit carbon emission to power in GFPP i and CFPP j.
C i g Unit procurement costs for gas in GFPP i.
C j k c Unit procurement costs for coal k in CFPP j.
C E F i g ,Actual carbon emission produced by a unit of gas in GFPP i.
C E F j k c Actual carbon emission produced by a unit of coal k in CFPP j.
E F k w The amount of pollutant w produced by coal k.
Z k r Coal quality r of coal k in CFPP j.
L R j r , U R j r Lower and upper bounds for coal quality r in CFPP j.

3.1.4. Policy Control Parameters

θ The authority’s attitude towards carbon emissions reduction.
π Attitude of the authority towards the historical data and the forecast data.

3.1.5. Decision Variables

m i g Carbon emissions quota that the authority allocates to GFPP i.
m j c Carbon emissions quota that the authority allocates to CFPP j.
X i Gas use quantity of GFPP i.
Y j k Coal k use quantity of CFPP j.

3.2. Uncertain Parameters Transformation

As uncertain parameters cannot be valued exactly and calculated directly, they need to be transformed into fixed value. Uncertain parameters can be estimated to be within a certain range, with the most likely value being in a relatively smaller range. For instance, T i is a trapezoidal fuzzy number, the certain range of which is from the minimum value r i 1 to the maximum value r i 4 , and the most likely value of which is between r i 2 and r i 3 . This trapezoidal fuzzy number can be written as T i = ( r i 1 , r i 2 , r i 3 , r i 4 ) , where r i 1 r i 2 r i 3 r i 4 . To value the exact value of trapezoidal fuzzy numbers, the expected value operator method proposed by Xu and Zhou is adopted as T i E [ T i ] = 1 λ 2 ( r i 1 + r i 2 ) + λ 2 ( r i 3 + r i 4 ) [30]. Therefore, all the uncertain parameters can used this method to be valued exactly.

3.3. Model for the Authority

3.3.1. Objective 1: Maximizing Financial Revenue

The authority imposes financial revenue on CPPs in the implementation of its duties and functions. Financial revenue is divided into two parts: added-value tax and carbon emissions quota fee. i = 1 I E [ T i ] X i + j = 1 J k = 1 K E [ T j k ] Y j k is the total electric power production, so α ( i = 1 I E [ T i ] X i + j = 1 J k = 1 K E [ T j k ] Y j k ) is added-value tax from all CPPs. i = 1 I m i g + j = 1 J m j c is the total carbon emissions quota, so β ( i = 1 I m i g + j = 1 J m j c ) is carbon emissions quota fee.
max F R = α ( i = 1 I E [ T i ] X i + j = 1 J k = 1 K E [ T j k ] Y j k ) + β ( i = 1 I m i g + j = 1 J m j c )

3.3.2. Objective 2: Minimizing Carbon Emissions

The authority also tries its best to reduce the amount of carbon emissions for sustainable development. That means i = 1 I m i g + j = 1 J m j c minimum. π ( 0 π 1 ), which comprehensively consider both historical data and forecast values, is introduced in this model to make the decision more scientific. Higher value of π represents the authority has more confidence in the historical data.
min T C = π ( i = 1 I m i g + j = 1 J m j c ) + ( 1 π ) ( i = 1 I E [ T i ] X i + j = 1 J k = 1 K E [ T j k ] Y j k )

3.3.3. Limitations on CEQA

As the authority imposes carbon emissions quota fee on CPPs, the authority cannot allocate a carbon emissions quota that a CPP cannot carry under full-load production. Therefore, m i g C E i g u , m j c C E j c u . Since all CPPs are also taxpayers, the authority has an obligation to ensure their basic operations. Therefore, C E i g l m i g , C E j c l m j c .
C E i g l m i g C E i g u , i δ
C E j c l m j c C E j c u , j σ

3.3.4. Power Demand Limitation

As electric power a necessity to ensure economic and social development, the authority has the responsibility to ensure that the total electric power production satisfies the needs of the society. i = 1 I E [ N i g ] m i g and j = 1 J E [ N j c ] m j c represent electric energy production respectively from GFPPs and CFPPs.
i = 1 I E [ N i g ] m i g + j = 1 J E [ N j c ] m j c D

3.4. Model for GFPPs

3.4.1. Objective: Maximizing Economic Profits

For market-based GFPPs, they put their own economic profits in the top place. The economic profits of GFPPs are divided into power sales, added-value tax payment, procurement cost and carbon emissions quota fee payment. P g represents power price from GFPPs. ( P g α ) E [ T i ] X i indicates power sales after-tax. E [ C i g ] X i represents procurement cost and β m i g is carbon emissions quota fee.
max E P i g = ( P g α ) E [ T i ] X i E [ C i g ] X i β m i g

3.4.2. Carbon Emissions Limitation

GFPPs are allocated a certain amount of carbon emissions quota by the authority. As the actual combustion process is unstable and flexible, C E F i g represents carbon emissions produced by a unit of gas. For GFPP i, its actual carbon emissions E [ C E F j k c ] Y j k cannot exceed the quota m j c as it is situated in a subordinate position during the decision making process.
E [ C E F i g ] X i m i g , i δ

3.4.3. Power Generation Limitation

As power is critical for social development, the supply of basic electric power is the GFPPs’ fundamental social responsibility. Therefore, the actual electric power production k = 1 K E [ T j k ] Y j k must surpass the demand.
E [ T i ] X i E D i g , i δ

3.4.4. Use Quantity Limitation

For each GFPP, the quantity of gas that can be used is limited and is less than the maximum available quantity Q i g .
0 X i Q i g , i δ

3.5. Model for CFPPs

3.5.1. Objective: Maximizing Economic Profits

With regard to CFPPs, their economic profits are divided into power sales, added-value tax payment, procurement cost, pollutants treatment cost and carbon emissions quota fee payment. As the power prices from CFPP and GFPP are different, P c represents power price from CFPPs. ( P c α ) k = 1 K E [ T j k ] Y j k indicates power sales after-tax. k = 1 K E [ C j k c ] Y j k represents procurement cost. k = 1 K w = 1 W C T j w η i w E [ E F k w ] Y j k is pollutants treatment cost and β m j c is carbon emissions quota fee.
max E P j c = ( P c α ) k = 1 K E [ T j k ] Y j k k = 1 K E [ C j k c ] Y j k k = 1 K w = 1 W C T j w η i w E [ E F k w ] Y j k β m j c

3.5.2. Carbon Emissions Limitation

CFPPs are also allocated a certain amount of carbon emissions quota m j c by the authority. m j c is the supreme carbon emissions that CFPP j can produce.
E [ C E F j k c ] Y j k m j c , j σ

3.5.3. Power Generation Limitation

To ensure the total electric power production satisfies the needs of the society, every CFPP should undertake a given mass of electric power production. For CFPP j, the actual generation k = 1 K E [ T j k ] Y j k must exceed the responsibility E D j c .
k = 1 K E [ T j k ] Y j k E D j c , j σ

3.5.4. Use Quantity Limitation

The CFPPs cannot purchase any coal K without limitations. There is a upper bound for coal use quantity Q j k c .
0 Y j k Q j k c , j σ , k ψ

3.5.5. Coal blending Requirement

To avoid serious consequences occurrence, the coal qualities Z k r have to meet some requirements when blending. The characteristics of the mixed coal must keep in the acceptable range of the boilers, from L R j r to U R j r . Five main characteristics are selected to describe the blended coal quality. r = 1 , 2 , 3 , 4 , 5 respectively represent volatile matter content, heat rate, ash content content, moisture content, and sulfur content.
E [ L R j r ] k = 1 K E [ Z k r ] Y j k k = 1 K Y j k E [ U R j r ] , j σ , r τ

3.6. Global Model

In CEQA decision making system, the authority and the CPPs have conflicts due to their different objectives. The authority first makes a decision to satisfy its objectives of maximizing financial revenue and minimizing carbon emissions in Equations (1) and (2) based on its constraints in Equations (3)–(5). Then, under the limited carbon emissions quota, the GFPPs make decisions on generation plans to pursue the largest economic profits under the limitations in Equations (7)–(9). Similarly, the CFPPs develop strategies to maximize economic profits in consideration of constraints in Equations (11)–(14). The CPPs’ decisions are fed back to the authority, following which the authority adjusts the initial decisions and reallocates an updated carbon emissions quota. The CPPs reconsider their own decisions based on the new CEQA. This is repeated until the global satisfactory solution is reached. Therefore, by integrating Equations (1)–(14), equilibrium strategy-based bi-level multi-objective programming model to reduce carbon emissions in CEQA is established as shown in Equation (15).
max F R = α ( i = 1 I E [ T i ] X i + j = 1 J k = 1 K E [ T j k ] Y j k ) + β ( i = 1 I m i g + j = 1 J m j c ) min T C = π ( i = 1 I m i g + j = 1 J m j c ) + ( 1 π ) ( i = 1 I E [ T i ] X i + j = 1 J k = 1 K E [ T j k ] Y j k ) s . t . C E i g l m i g C E i g u , i δ C E j c l m j c C E j c u , j σ i = 1 I E [ N i g ] m i g + j = 1 J E [ N j c ] m j c D max E P i g = ( P g α ) E [ T i ] X i E [ C i g ] X i β m i g s . t . E [ C E F i g ] X i m i g , i δ E [ T i ] X i E D i g , i δ 0 X i Q i g , i δ max E P j c = ( P c α ) k = 1 K E [ T j k ] Y j k k = 1 K E [ C j k c ] Y j k k = 1 K w = 1 W C T j w η i w E [ E F k w ] Y j k β m j c s . t . E [ C E F j k c ] Y j k m j c , j σ k = 1 K E [ T j k ] Y j k E D j c , j σ 0 Y j k Q j k c , j σ , k ψ E [ L R j r ] k = 1 K E [ Z k r ] Y j k k = 1 K Y j k E [ U R j r ] , j σ , r τ

4. Case Study

In this section, Shenzhen is taken as a practical application to demonstrate the practicality and effectiveness of the proposed model.

4.1. Case Description

Shenzhen, the first special economic zone in China, is located on the China’s southeastern coast, adjoining Hong Kong. It covers an area of 1953 km 2 and has a population of 10.63 million, with an 18.7 ten thousand CNY per capita in 2017 ranking the third all over China [31]. As one of the most developed region in China, Shenzhen has been actively developing CFPPs and GFPPs in order to deal with its electricity supply shortage. However, this results in the large amount of carbon emissions in Shenzhen. Therefore, it is necessary for Shenzhen to reduce carbon emissions while satisfying power demand required by economic development. To reduce the computational burden, only 2 CFPPs and 2 GFPPs in Jiangsu Province are chosen to use in the case study as shown in Figure 2: Mazu CFPP, Baochang CFPP, Yueliangwan GFPP and Dongbu GFPP. In CFPPs, three kinds of coal are burned for power generation: Shenhua coal, Datong coal and Indonesia coal.

4.2. Model Transformation and Solution Approach

Although Shenzhen is a developed region in China, economic development is still its prime target; however, for sustainable development, environmental protection cannot be ignored. Therefore, the authority develops the economy within the environmental carrying capacity; the authority may transform its objective of minimizing carbon emissions to a constraint which can be controlled in a acceptable range. Based on the study of Zeng et al. [32], let α be the authority’s attitude towards carbon emissions, as a result the proposed global model can be transformed as follows.
max F R = α ( i = 1 I E [ T i ] X i + j = 1 J k = 1 K E [ T j k ] Y j k ) + β ( i = 1 I m i g + j = 1 J m j c ) s . t . π ( i = 1 I m i g + j = 1 J m j c ) + ( 1 π ) ( i = 1 I E [ T i ] X i + j = 1 J k = 1 K E [ T j k ] Y j k ) θ L C E ( m i g , m j c , X i , Y j k ) S
where S is the feasible region of Equations (3)–(14).
It has been shown by many researches that bi-level model is an NP-hard problem and is difficult to calculate. The proposed bi-level model in this paper is complicated because the decision variables from both the authority and CPPs interact across the objectives and the constraints. To solve this complexity, an interactive algorithm is proposed. First, input all the constraints and values of the upper level and build a feasible region. Then find a initial value in the feasible region of the upper level model and transform this initial value m i g 1 and m j c 1 to the lower level. Considering the initial value given by the upper level and all the constraints of the lower level, the lower level model is transformed into a single level linear programming for X i or Y i k . Meanwhile, the lower level get the solution X i 1 and Y i k 1 to achieve maximum profit based on the mathematical toolbox inserted in Matlab. Then the solution of the lower level model is delivered to the upper level, at which time the upper level program is also transformed into a single level linear programming for m i g and m j c . The mathematical toolbox in Matlab is again used to determine the solution. Then this new m i g 2 and m j c 2 are delivered to the lower level and calculate the solution of the lower level model, and thus calculating X i 2 and Y i k 2 . The new X i 2 and Y i k 2 are input into the upper level again. After several times interaction, the global satisfactory solution that satisfies the upper level and the lower level is got. The step by step solution approach is as follows:
Step 1:
Establish a feasible region for the upper level model.
Step 2:
Randomly generate m i g 1 and m j c 1 in the feasible region.
Step 3:
Deliver m i g 1 and m j c 1 into the lower level model.
Step 4:
Calculate the satisfactory solution X i 1 or Y i k 1 for the lower level model.
Step 5:
Feed back X i 1 and Y i k 1 to the upper level.
Step 6:
Calculate the new satisfactory solution m i g 2 and m j c 2 for the upper level model.
Step 7:
Continue Step 3 and Step 6 until the termination condition is reached.
Step 8:
Calculate F R , T C , E P i g and E P j c .
In this interactive algorithm, the termination condition is m i g q m i g ( q 1 ) m i g ( q 1 ) 1 % and m i c q m i c ( q 1 ) m i c ( q 1 ) 1 % , where q represents the number of interactions. This indicates that in this paper, we assume that when the distance between each m i g and m j c in the two adjacent cycles is less than 1%.

4.3. Data Collection

The data used in the proposed model can be divided into two categories: the crisp data and the uncertain data. They are collected from Shenzhen’s bureau of statistics and official websites of each power plants. The crisp data are shown in Table 1 and Table 2. The basic information of each CPP, such as pollutants reduction measure and reduction efficiency, is shown in Table 1. Table 2 shows other parameters used in the proposed model. The uncertain data are shown in Table 3 and Table 4. Table 3 shows the uncertain parameter of CPPs in fuzzy form such as carbon to power parameter. In addition, Table 4 shows the uncertain parameters of coals in CFPPs. For example, coal characteristics, carbon emission factor and so on.
π is set as 0.5,which means that the authority has a neutral attitude towards the historical data and forecast data.

5. Results and Discussion

5.1. Results and Analyses

Based on the results in Table 5, some analyses and proposition are given.
Proposition 1.
The CEQA-based equilibrium strategy effectively reduces carbon emissions.
In this paper, an equilibrium strategy-based bi-level multi-objective programming method is built to deal with CEQA problem. From the results shown in Figure 3, it can be obviously seen that the lowest value of the authority’s attitude towards carbon emissions reductions is 0.7, which means that this CEQA-based equilibrium strategy has the potential to reduce carbon emissions by 30% compared with the last production period. Using this method, CEQA is the key factor that used by the authority to impact the CPPs’ decisions. The authority would allocated more quota to the CPPs that have relatively better emissions performance. To obtain a greater number of quota, the CPPs adjust their decisions to improve emissions performance even though this would increase unit production costs. Therefore, the total emission amount in the region reduces.
Proposition 2.
Stricter carbon emissions reductions targets lead to a large fall in both revenue and profits.
From Figure 4 we can see that when the authority has a stricter attitude towards carbon emissions reduction, the authority’s financial revenue and the CPPs’ economic profits both reduce. Take a example, when θ is set at 1, the authority’s financial revenue is 33.22, and the economic profits that Xuzhou CFPP, Yancheng CFPP, Nanjing GFPP and Yixing GFPP earn are respectively 52.15, 49.61, 13.88 and 10.46. When θ reduces to 0.9, the financial revenue reduces to 29.87, and the economic profits of the four CPPs are 45.13, 47.69, 11.99 and 9.02. Similar situation can be seen in other situations. Furthermore, carbon emissions reductions targets more significantly affect CFPPs than GFPPs.
Proposition 3.
GFPPs have an advantage over CFPPs in CEQA.
From Figure 5, all the carbon emissions quota reductions that different kinds of CPPs receive reduce when the authority’s attitude towards carbon emissions reduction is stricter. However, their decreased amounts are different. For example, when θ changes from 1 to 0.9, carbon emissions quotas that Mazu CFPP and Baochang CFPP respectively receive reduce by 4.93, 1.26, while Yueliangwan GFPP and Dongbu GFPP reduce by 0.75 and 0.65. Similar situation can be seen in other situations in Figure 6. Therefore, when the authority sets carbon emissions reduction targets, less change would happen in GFPPs carbon emissions quota compared with CFPPs, as burning gas produces less carbon emissions than coal.

5.2. Management Recommendations

Based on what has been discussed and analyzed above, some management recommendations are proposed
(1)
A CEQA competition mechanism is required.
Rational carbon emissions quota allocation is important. High carbon emissions quota would make the CPPs unnecessary expenditure and would not achieve carbon emissions reductions, while under low carbon emissions quota the CPPs cannot earn economic profits and their relationship with the authority would go worse. In this paper, CEQA-based equilibrium strategy is adopted to establish a CEQA competition mechanism. In this mechanism, the authority allocates a certain amount of carbon emissions quota to each CPP, and would prefer more carbon emissions quota to the CPP that shows better carbon emissions reductions performance. CPPs also try their best to make production schemes to improve carbon emissions quota. Therefore, this CEQA-based equilibrium strategy cannot only motivate the CPPs to conduct cleaner production but also achieve carbon emissions reductions in a region.
(2)
A flexible attitude towards carbon emissions reductions is recommended.
In the propose mechanism, the authority can select its carbon emissions reductions targets based on the economic development level. Therefore, the authority would take the actual situation into consideration and choose a desired carbon emissions reduction scheme. As discussed in Propositions 1 and 2, stricter carbon emissions reductions attitude can result in carbon emissions reductions and financial revenue loss. Therefore, when the economy is badly in need of development, the authority should have a more relaxed attitude towards carbon emissions reductions and motivate the economy to vigorously develop. After a period when the economy is relatively better, a strict attitude is suggest. In the next period the attitude should be updated until the strictest attitude is achieved.

6. Conclusions and Future Study

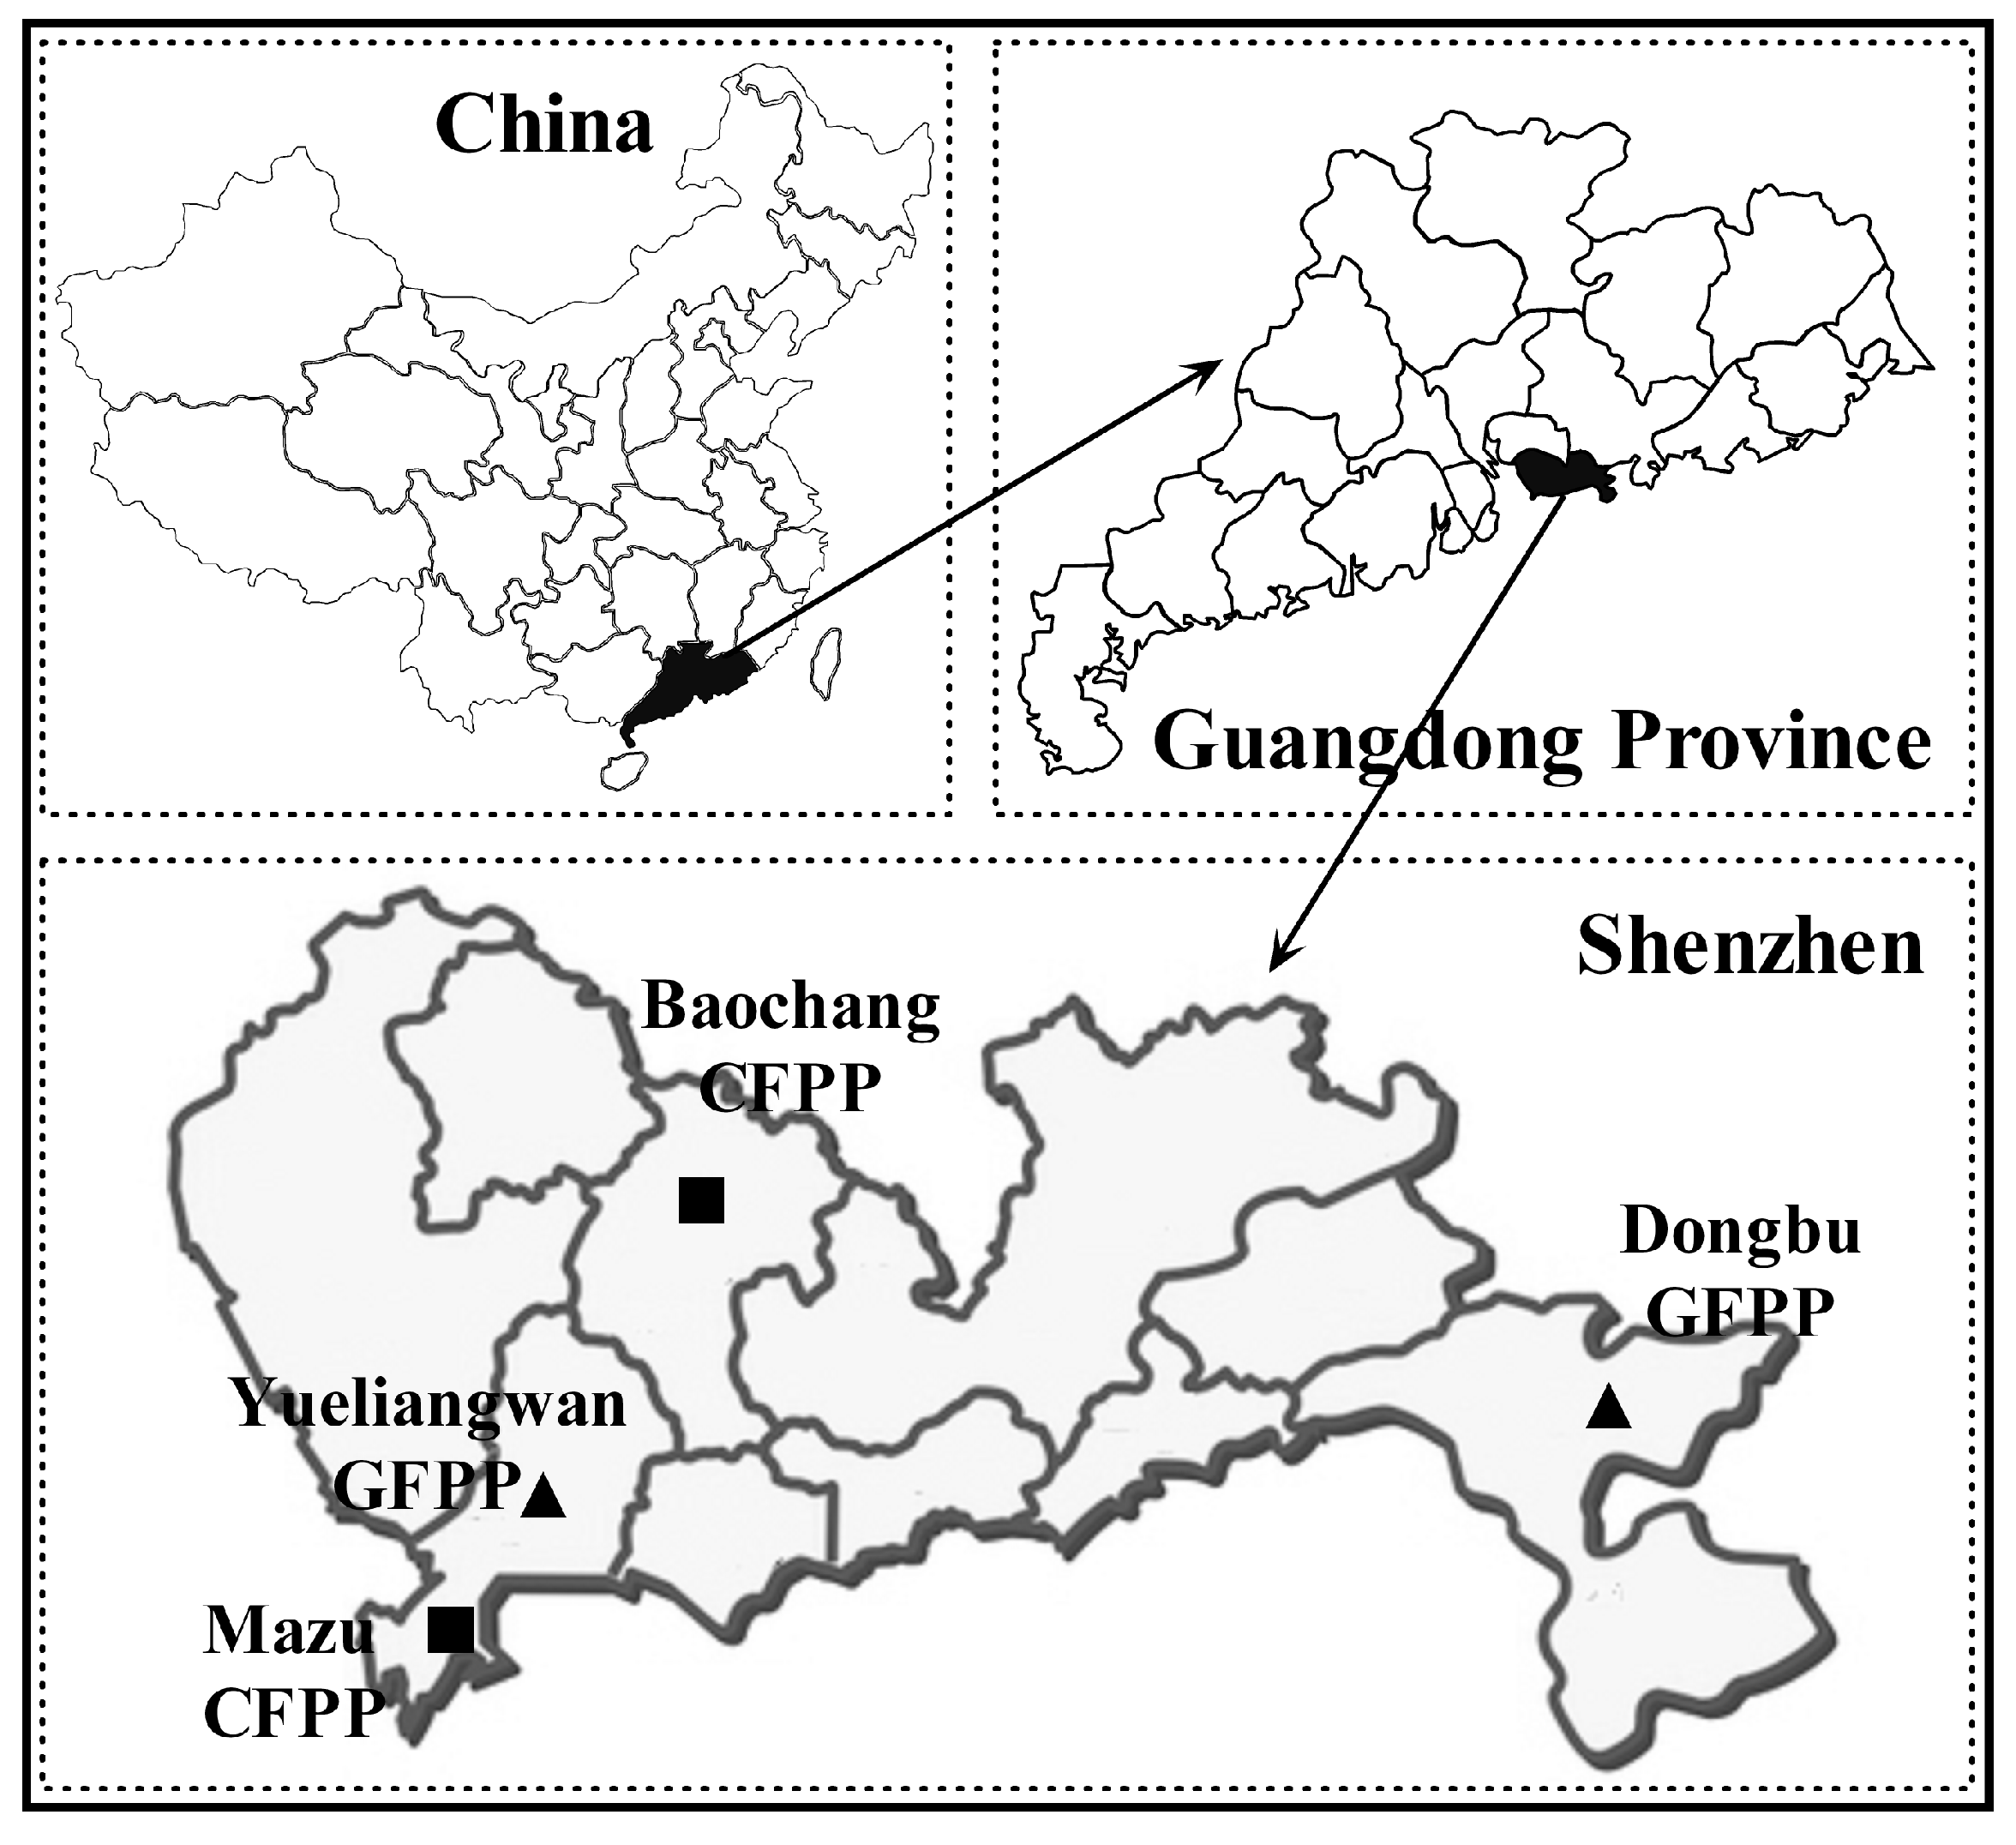
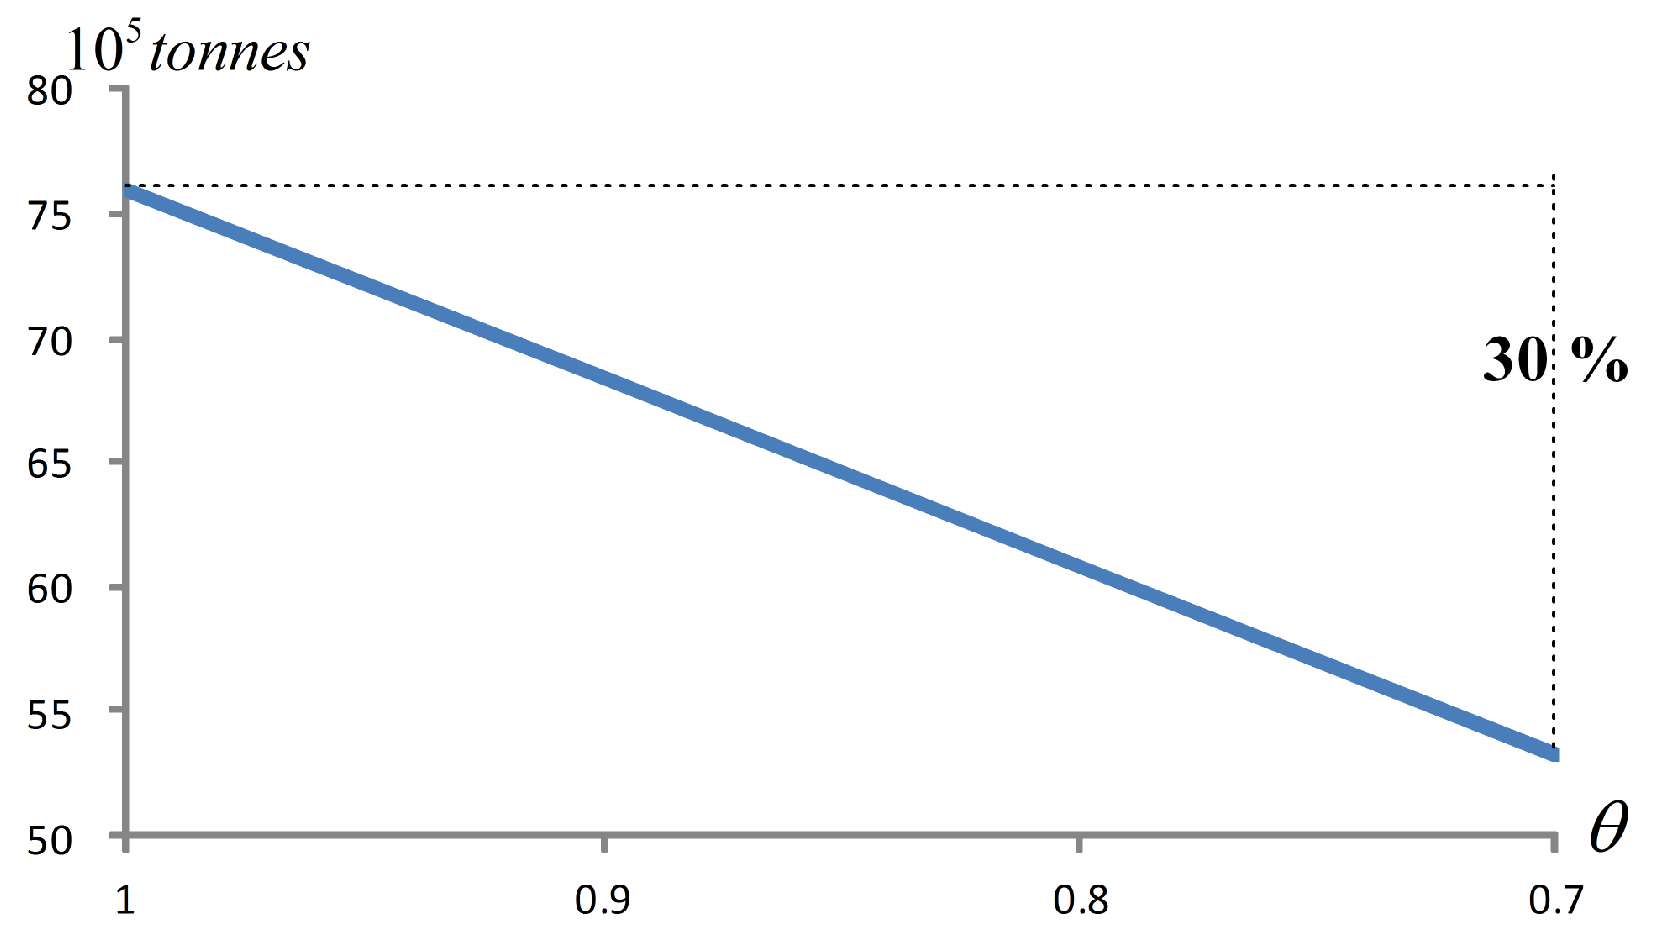
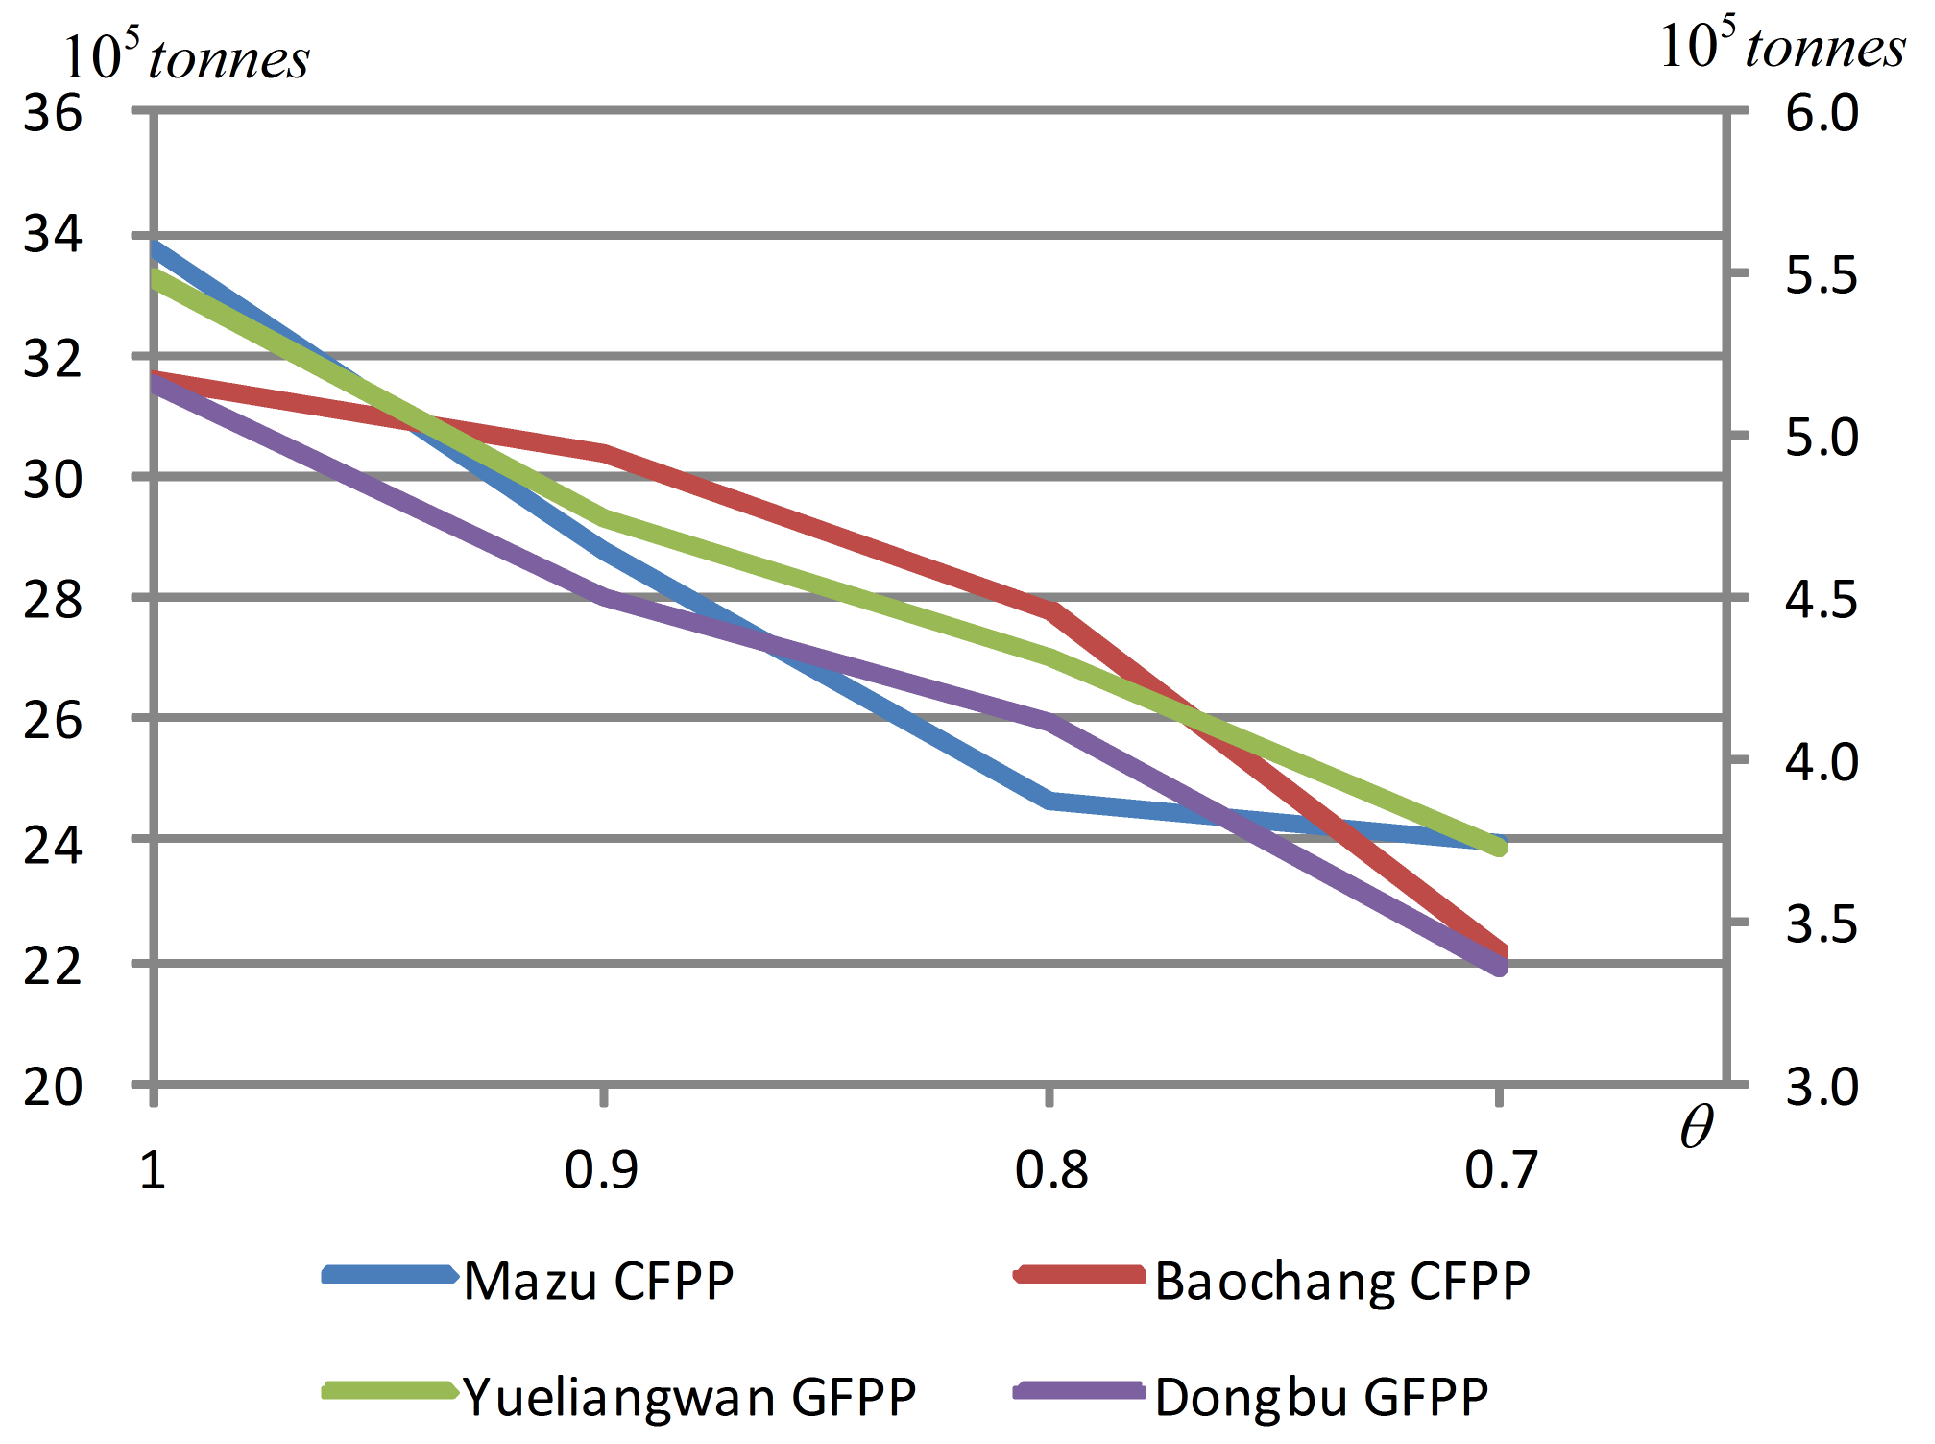
To achieve carbon emissions reduction in CPPs, this paper proposed an equilibrium strategy-based bi-level multi-objective programming method under an uncertain environment which fully considered the conflict between the authority and CPPs, the trade-off between environmental protection and economic development. By using the proposed model, rational carbon emissions quota allocation mechanism is established. In this mechanism, the authority allocated a certain amount of carbon emissions quota to the CFPPs or GFPPs. Under the limited carbon emissions quota, each CFPP and each GFPP developed its own generation plans strategies. The proposed method was applied in a real case of Shenzhen to demonstrate its efficiency and practicability and adopted Matlab to calculate the results. Based on the results, some conclusions were reached. First, the CEQA-based equilibrium strategy effectively reduced carbon emissions. Then, stricter carbon emissions reductions targets lead to a large fall in both revenue and profits. Moreover, GFPPs had an advantage over CFPPs in CEQA.
In this paper, we mainly considered two stakeholders in the decision making system. In the future, more stakeholders, such as non-profit environmental organizations, would be considered. In this paper, we only considered carbon emissions reduction and some pollutants, such as P M 2.5 , were ignored. In the future, a more comprehensive methodology for improving regional atmospheric environments would be developed.

Author Contributions

All authors contributed substantially to the research presented in this paper. Q.H., Q.F., and L.L. designed the research and methodology. Q.H. wrote the paper and analysed the results. Q.F. developed the optimization model. L.L. raised the idea and proposed the framework of the paper. Y.T. calculated the results. All authors read and approved the final manuscript.

Funding

This research is supported by the National Natural Science Foundation of China (Grant No. 71704124), and the Humanity and Social Science Youth Foundation of Ministry of Education of China (Grant No. 17YJC630096 and No. 17YJC890021).

Acknowledgments

The authors would like to thank the reviewers for their constructive and valuable suggestions for improving this paper.

Conflicts of Interest

The authors declare no conflict of interest.

References

  1. Bp, G. Bp Energy Outlook. 2018. Available online: https://www.bp.com/en/global/corporate/energy-economics/energy-outlook.html (accessed on 4 September 2018).
  2. Bp, G. Bp Statistical Review of World Energy. 2018. Available online: https://www.bp.com/en/global/corporate/energy-economics/statistical-review-of-world-energy.html (accessed on 4 September 2018).
  3. Yang, Y.; Yan, Q. An efficient way to use medium-or-low temperature solar heat for power generation—Integration into conventional power plant. Appl. Therm. Eng. 2011, 2, 157–162. [Google Scholar] [CrossRef]
  4. Service, R.F. Cleaning up coal-cost-effectively. Science 2017, 356, 798–798. [Google Scholar] [CrossRef] [PubMed]
  5. Allen, M.R.; Frame, D.J. Warming caused by cumulative carbon emissions towards the trillionth tonne. Nature 2009, 458, 1163–1166. [Google Scholar] [CrossRef] [PubMed]
  6. Mao, X.Q.; Zeng, A. Co-control of local air pollutants and CO2 from the chinese coal-fired power industry. J. Clean. Prod. 2014, 67, 220–227. [Google Scholar] [CrossRef]
  7. Fisher, R.G. Fuel and emissions reduction power plant design using oxygen for combustion and flue gas recirculation to minimize carbon dioxide and nox emissions. U.S. Patent Application No 11/789,478, 25 April 2007. [Google Scholar]
  8. Bandyopadhyay, A. Amine versus ammonia absorption of co as a measure of reducing ghg emission: A critical analysis. Clean Technol. Environ. Policy 2011, 13, 269–294. [Google Scholar] [CrossRef]
  9. Holbert, K.E.; Heydt, G.I.; Ni, H. Use of satellite technologies for power system measurements, command, and control. Proc. IEEE 2005, 93, 947–955. [Google Scholar] [CrossRef]
  10. Olsen, D.J.; Dvorkin, Y. Optimal carbon taxes for emissions targets in the electricity sector. IEEE Trans. Power Syst. 2018, 99, 1. [Google Scholar] [CrossRef]
  11. Cong, R.; Wei, Y. Potential impact of (cet) carbon emissions trading on china’s power sector: A perspective from different allowance allocation options. Energy 2010, 35, 3921–3931. [Google Scholar] [CrossRef]
  12. Lin, B.; Li, X. The effect of carbon tax on per capita CO emissions. Energy Policy 2011, 39, 5137–5146. [Google Scholar] [CrossRef]
  13. Teeter, P.; Sandberg, J. Constraining or enabling green capability development? How policy uncertainty affects organizational responses to flexible environmental regulations. Br. J. Manag. 2017, 28. [Google Scholar] [CrossRef]
  14. Sorrell, S.; Sijm, J. Carbon trading in the policy mix. Oxf. Rev. Econ. Policy 2003, 19, 420–437. [Google Scholar] [CrossRef]
  15. Ma, C.; Ren, Y. The allocation of carbon emission quotas to five major power generation corporations in china. J. Clean. Prod. 2018, 189. [Google Scholar] [CrossRef]
  16. Li, R.; Tang, B. Initial carbon quota allocation methods of power sectors: A china case study. Nat. Hazards 2016, 84, 1075–1089. [Google Scholar] [CrossRef]
  17. Kim, K.M.; Karsten, N. Allocation of carbon emission certificates in the power sector: How generators profit from grandfathered rights. Clim. Policy 2005, 5, 61–78. [Google Scholar]
  18. Zhang, M.; Ni, J.; Yao, L. Pigovian tax-based equilibrium strategy for waste-load allocation in river system. Clim. Policy 2018, 563, 223–241. [Google Scholar] [CrossRef]
  19. Hassin, R.; Green, R.R. Cascade equilibrium strategies in a two-server queueing system with inspection cost. Eur. J. Oper. Res. 2018, 267. [Google Scholar] [CrossRef]
  20. Lu, J.; Shi, C.; Zhang, G. On Bilevel Multi-Follower Decision Making: General Framework and Solutions; Elsevier Science Inc.: New York, NY, USA, 2006. [Google Scholar]
  21. Stackelberg, H.V. Marktform Und Gleichgewicht; Springer: Berlin, Germany, 1934. [Google Scholar]
  22. Zhang, G.; Lu, J.; Gao, Y. Multi-Level Decision Making; Springer: Berlin/Heidelberg, Germany, 2015. [Google Scholar]
  23. Burgard, A.P.; Pharkya, P.; Maranas, C.D. Optknock: A bilevel programming framework for identifying gene knockout strategies for microbial strain optimization. Biotechnol. Bioeng. 2003, 84, 647–657. [Google Scholar] [CrossRef] [PubMed] [Green Version]
  24. Colson, B.; Marcotte, P.; Savard, G. Bilevel programming: A survey. 4OR 2005, 3, 87–107. [Google Scholar] [CrossRef]
  25. Wu, B.; Flynn, A. Sustainable development in china: Seeking a balance between economic growth and environmental protection. Sustain. Dev. 1995, 3, 1–8. [Google Scholar] [CrossRef]
  26. Qu, G. China’s dual-thrust energy strategy: Economic development and environmental protection. Energy Policy 1992, 20, 500–506. [Google Scholar]
  27. Lv, C.; Xu, J. Equilibrium strategy based coal blending method for combined carbon and PM10 emissions reductions. Appl. Energy 2016, 183, 1035–1052. [Google Scholar] [CrossRef]
  28. Dai, C.; Cai, X.H.; Cai, Y.P. A simulation-based fuzzy possibilistic programming model for coal blending management with consideration of human health risk under uncertainty. Appl. Energy 2014, 133, 1–13. [Google Scholar] [CrossRef]
  29. Shih, J.S.; Frey, H.C. Coal blending optimization under uncertainty. Eur. J. Oper. Res. 1995, 83, 452–465. [Google Scholar] [CrossRef]
  30. Xu, J.; Zhou, X. Fuzzy-Like Multiple Objective Decision Making; Springer: Berlin/Heidelberg, Germany, 2011. [Google Scholar]
  31. Xu, J.; Yang, X.; Tao, Z. A tripartite equilibrium for carbon emission allowance allocation in the power-supply industry. Energy Policy 2015, 82, 62–80. [Google Scholar] [CrossRef]
  32. Zeng, Z.; Xu, J.; Wu, S. Antithetic method-based particle swarm optimization for a queuing network problem with fuzzy data in concrete transportation systems. Comput.-Aided Civ. Infrastruct. Eng. 2014, 29, 771–800. [Google Scholar] [CrossRef]
Figure 1. Flowchart of the bi-level structure.
Sustainability 10 03195 g001
Figure 2. Location of the case region.
Sustainability 10 03195 g002
Figure 3. Carbon emissions when θ is changing.
Sustainability 10 03195 g003
Figure 4. Financial revenue and CPP economic profits when θ is changing.
Sustainability 10 03195 g004
Figure 5. CPP carbon emissions when θ is changing. Note: CFPPs belong to the left vertical axis and GFPPs belong to the right vertical axis.
Sustainability 10 03195 g005
Figure 6. CPP carbon emissions decreased amounts when θ is changing.
Sustainability 10 03195 g006
Table 1. Certain parameters of each CPP.
Mazu CFPPBaochang CFPPYueliangwan GFPPDongbu GFPP
Pollutants reduction efficiency, η i w
For S O 2 ( w = 1 ) (%)96.596.2
For N O x ( w = 2 ) (%)85.785.3
For P M 10 ( w = 3 ) (%)98.398.7
Pollutants reduction cost, C T j w
For S O 2 ( w = 1 ) (CNY/kg)2.51.9
For N O x ( w = 2 ) (CNY/kg)15.716.3
For PM 10 ( w = 3 ) (CNY/kg)3.33.2
Power demand, E D j c E D i g (kwh)2.7 × 10 9 2.5 × 10 9 0.72 × 10 9 0.68 × 10 9
Lower bound for quota, C E j c l C E i g l (tonnes)23.6 × 10 5 21.8 × 10 5 3.6 × 10 5 3.3 × 10 5
Upper bound for quota, C E j c u C E i g u (tonnes)34 × 10 6 32 × 10 6 5.5 × 10 6 5.2 × 10 6
Table 2. Other parameters used in the proposed model.
Unit carbon emissions quota price, β (CNY/tonne)30
Added-value tax, α (CNY/kWh)0.01
Price of unit coal-fired power, P g (CNY/kWh)0.45
Price of unit gas-fired power, P c (CNY/kWh)0.581
Total power demand, D (kWh) 6.6 × 10 9
Carbon emissions in the last production period, LCE (tonnes) 7.6 × 10 6
Table 3. Uncertain parameter of CPPs in fuzzy form.
Mazu CFPPBaochang CFPPYueliangwan GFPPDongbu GFPP
Carbon to power parameter,(1130, 1195, 1260, 1335)(1070, 1155, 1240, 1335)(2170, 2245, 2360, 2425)(2185, 2250, 2375, 2470)
N i g N j c (kWh/tonne)
Gas to power parameter, T i (kWh/m 3 ) (4.77, 4.95, 5.17, 5.63)(3.42, 4.12, 5.1, 6.88)
Coal quality requirement, L R j r , U R j r
Volatile matter (% weight)
Lower bound(5.4, 5.82, 6.19, 6.59)(6.32, 6.78, 7.2, 7.7)
Upper bound(25.8, 26.0, 26.3, 26.6)(27.8, 28.5, 29.4, 30.3)
Heat rate (GJ/tonne)
Lower bound(21.8, 22.2, 22.6, 23.0)(21.2, 21.8, 22.5, 22.9)
Ash content (% weight)
Upper bound(19.1, 19.64, 20.34, 20.92)(17.88, 18.56, 19.34, 20.22)
Moisture content (% weight)
Upper bound(4.12, 4.56, 5.34, 5.98)(4.98, 5.56, 6.44, 7.02)
Sulphur content (% weight)
Upper bound(0.64, 0.75, 0.84, 0.97)(0.76, 0.87, 0.93, 1.04)
Carbon emissions factor, C E F i g (Kg/m 3 ) (1.75, 1.98, 2.31, 2.86)(1.63, 1.94, 2.18, 2.66)
Unit procurement, C i g (CNY/m 3 ) (1.83, 2.14, 2.48, 2.75)(1.73, 2.12, 2.46, 2.89)
Table 4. Uncertain parameters of coals in fuzzy form.
Shenhua CoalDatong CoalIndonesia Coal
Characteristics, Z k r
Volatile matter (% weight)(7.1, 7.9, 8.5, 9.2)(24, 28, 35, 45)(17, 21, 24, 26)
Heat rate (GJ/tonne)(22.3, 22.8, 23.6, 24.5)(21.5, 21.8, 22.2, 22.9)(20.6, 21.2, 21.4, 21.7)
Ash content (% weight)(20.4, 20.7, 21.2, 21.7)(15.1, 15.7, 16.3, 16.9)(11.4, 11.8, 12.3, 12.5)
Moisture content (% weight)(4.2, 4.4, 4.7, 4.9)(5.3, 5.6, 5.9, 6.2)(2.1, 2.3, 2.7, 2.9)
Sulphur content (% weight)(0.56, 0.59, 0.62, 0.65)(0.23, 0.26, 0.29, 0.34)(0.81, 0.87, 0.92, 1)
Pollutants emission factor, E F k w
For S O 2 ( w = 1 ) (kg/tonne)(4.9, 5.4, 6.1, 6.8)(6.4, 6.8, 7.3, 7.9)(6.7, 7.1, 7.6, 8.2)
For N O x ( w = 2 ) (kg/tonne)(2.2, 2.5, 2.8, 3.1)(3.19, 3.25, 3.14, 3.62)(5.78, 6.24, 6.67, 7.31)
For P M 10 ( w = 3 ) (kg/tonne)(0.31, 0.36, 0.43, 0.5)(0.62, 0.68, 0.73, 0.77)(0.97, 1.05, 1.14, 1.24)
Conversion parameter from unit coal to power, T j k
Mazu CFPP (kWh/tonne)(2540, 2590, 2640, 2670)(2370, 2420, 2460, 2550)(2210, 2325, 2410, 2535)
Baochang CFPP (kWh/tonne)(2410, 2530, 2650, 2770)(2340, 2425, 2530, 2625)(2320, 2385, 2430, 2505)
Carbon emission factor, C E F j k c
Mazu CFPP (kg/tonne)(2005, 2060, 2125, 2250)(1925, 1980, 2045, 2170)(1815, 1900, 1985, 2020)
Baochang CFPP (kg/tonne)(2045, 2110, 2155, 2210)(1945, 1990, 2080, 2185)(1845, 1920, 1995, 2080)
Procurement cost, C j k c (CNY/tonne)(675, 687, 695, 703)(635, 645, 657, 663)(602, 615, 628, 635)
Table 5. Sensitivity analysis on the authority’s attitude towards carbon emissions reduction.
Policy CandidateFinancial Revenue,CPPCarbon Emissions QuotaEconomic ProfitsShenhua Coal,Datong Coal,Indonesia Coal,Gas X i
θ FR ( 10 7 CNY) m j c , m i g ( 10 5 tonnes) EP j c , EP i g ( 10 7 CNY) Y j 1 ( 10 5 tonnes) Y j 2 ( 10 5 tonne) Y j 3 ( 10 5 tonnes)( 10 7 m 3 )
133.22Mazu CFPP33.7252.157.507.501.380.00
Baochang CFPP31.6349.617.507.500.140.00
Yueliangwan GFPP5.5013.880.000.000.0024.69
Dongbu GFPP5.1610.460.000.000.0024.54
0.929.87Mazu CFPP28.7845.137.506.130.270.00
Baochang CFPP30.3647.697.507.020.000.00
Yueliangwan GFPP4.7511.990.000.000.0021.32
Dongbu GFPP4.519.020.000.000.0021.43
0.826.57Mazu CFPP24.6339.027.504.340.000.00
Baochang CFPP27.7443.627.505.740.000.00
Yueliangwan GFPP4.3110.900.000.000.0019.38
Dongbu GFPP4.118.190.000.000.0019.55
0.723.23Mazu CFPP23.9638.017.504.010.000.00
Baochang CFPP22.1534.856.344.220.000.00
Yueliangwan GFPP3.739.420.000.000.0016.75
Dongbu GFPP3.367.140.000.000.0015.97

