Article

Investigating Health Systems in the European Union: Outcomes and Fiscal Sustainability

by
Madalina Ecaterina Popescu
1,2,*,
Eva Militaru
1,
Amalia Cristescu
1,3,
Maria Denisa Vasilescu
1,2 and
Monica Mihaela Maer Matei
1,2
1
National Scientific Research Institute for Labour and Social Protection, 6-8 Povernei Street, 010643 Bucharest, Romania
2
The Faculty of Economic Cybernetics, Statistics and Informatics, The Bucharest University of Economic Studies, 15–17 Dorobanti St., Sector 1, 010552 Bucharest, Romania
3
The Faculty of Theoretical and Applied Economics, The Bucharest University of Economic Studies, 15–17 Dorobanti St., Sector 1, 010552 Bucharest, Romania
*
Author to whom correspondence should be addressed.
Sustainability 2018, 10(9), 3186; https://doi.org/10.3390/su10093186
Submission received: 8 August 2018 / Revised: 3 September 2018 / Accepted: 3 September 2018 / Published: 6 September 2018
(This article belongs to the Special Issue Sustainability for Healthcare)

Abstract

:
Healthcare systems aim to provide access to good quality care, while ensuring equity and solidarity. The fiscal sustainability of healthcare systems has become a matter of concern in recent European Union (EU) debates, considering the ever increasing need for adequate healthcare determined by factors such as aging population, investments in technology and infrastructure, medical products and wages. Our paper seeks to measure the health system performances of the EU countries by building up a composite index, which will then be used as a tool in investigating the relationship between health performance and the fiscal sustainability of health systems. A principal components analysis (PCA) was applied to build the composite index through the use of the most relevant health indicators provided by Eurostat and the Sustainable Development Knowledge Platform. The composite index offers a comprehensive performance assessment and provides a clear ranking of the EU countries based on their health system performances. Further investigation of the link between health performance and fiscal sustainability revealed that higher ranks are associated with higher shares of health expenditures in gross domestic product (GDP), a large share of employment in the health sector, and higher duration of working life. These patterns are followed by efficient health systems, encountering reduced sustainability risks.

1. Introduction

Health is essential for sustainable human development, being not only a fundamental human right, but also an important factor in the economic evolution of a society and, therefore, it may be considered as an adequate measure of a nations’ progress toward reaching sustainable development. Health has a significant impact on the development of a nation by increasing productive employment, reducing medical expenses, and promoting social cohesion.
The healthcare systems in the European Union countries aim to provide quality health care to all individuals, and to ensure that the need for health care does not cause poverty or imply significant financial constraints. This is conducive to the well-being of people and to economic prosperity as it enhances labor market participation and productivity, which are essential elements for prolonging active life in the context of an aging society. At the same time, health systems are essential for achieving economic cohesion and social protection processes in Europe.
Even though health systems are different in terms of organization, applied policies and financial means, they are built on a range of common values, such as universality, access to good quality care, equity and solidarity. The challenges faced by European health systems are numerous, but in the current socio-economic context we can conclude on the following aspects: (1) the aging of Europe’s population, leading to a higher risk of developing chronic conditions, which increases the demand for health care and the fiscal pressure; (2) health professionals are unevenly distributed, which hampers some areas of care and negatively affects specific geographical areas; (3) the costs of innovative technologies and medicines are rising which constitutes an additional burden on the public finance systems; (4) access to healthcare is not distributed evenly, thus leading to inequalities in health outcomes at the society level. Obviously, in this frame, we must also introduce the idea of human and fiscal sustainability, as common values need to be guaranteed in the medium and long run [1].
Sustainability involves the health system maintaining itself and adapting in a constantly changing economic, social and demographic context, making sure that limited resources (physical, financial and human) are being used efficiently and responsibly in order to permanently maintain or improve the health of the population as a whole and of each individual. A sustainable health system must be defined by at least three key elements: accessibility for each individual, mutual acceptance between patients and the medical staff, and adaptability, as health systems should be able to permanently adapt to the socio-economic and demographic changes, to new illnesses, to scientific discoveries and dynamic technologies, in order to remain viable. Practically, we could say that sustainability is a moving target in a rapidly changing health system that must adapt to the main challenges faced by society [2].
One dimension through which the sustainability of health systems can be viewed is fiscal sustainability. The European Commission defines fiscal sustainability in general as the ability to maintain current policies without causing rising debt as a share of gross domestic product (GDP) [3]. The issue of fiscal sustainability of healthcare systems has been brought to the fore in recent European Union (EU) debates, specifically in the light of the increasing need for adequate healthcare under the pressure of demographic drivers—especially aging and other non-demographic factors such as investments in technology and infrastructure, medical products and wages. Moreover, the debt levels of many EU countries, worsened by the economic and financial crisis of 2008, exert additional pressure on the fiscal sustainability of public finances in general, and also on health expenditure which is mainly funded from public sources. Therefore, fiscal sustainability should be regarded more as a constraint, rather than as a goal per se [4].
In this context, the health policy of the European Union gained a new macroeconomic dimension following the recent introduction of the legislative framework for economic governance. This new dimension involves, among others, the analysis of budgets and financial commitments of the national governments in order to identify policies and factors that pose a threat to the sustainability of the health systems. The macroeconomic dimension of health concerns the individuals, institutions and resources of the healthcare sector, but also their impact on the fiscal level and implicitly on the economic level. New health policies at EU level have led to wide-ranging debates on funding arrangements, medical services delivery, and ensuring universal access to high quality medical services. Thus, the European Union is increasingly involved in analyzing and evaluating health policies, trying to identify, assess and address specific areas of interest.
Nevertheless, health systems in the European Union need extensive reforms in order to improve the provision of adequate, affordable and efficient health services to all citizens. It seems that traditional sources of funding for European healthcare services are insufficient and too expensive. Innovation is necessary in order to maintain health sustainability, especially since the idea of free, state-supported health services is deeply rooted in the minds of most Europeans. The new reforms are aimed at reducing the role of the state in providing health services and heading towards the private environment in order to introduce a competitive market element and avoid the collapse of state systems under pressure from aging populations, rising expenditures and high budget deficits.
In order to efficiently and correctly identify existing health system challenges, states need to carry out a comprehensive analysis of the sustainability of their health systems. Given that they are open systems, they need to be adaptable to changes, and in order to maintain high-quality standards, they must benefit from human, financial and informational resources [5].
It is clear that a growing amount of resources (money, human resources, infrastructures, information, etc.) is being allocated for healthcare in the EU countries; these are measurable inputs which are translated within the system into outcomes. This process of transforming inputs into outputs is actually a policy tool which deals with efficiency, and the way it is done certainly contributes to the improved fiscal sustainability of health systems. The ability of each country to use combinations of resources and transpose them into health outcomes depends on many aspects, such as system design and institutional setup, but also on the economic and social condition of the country and the current performance level of the health system. Countries with similar levels of development and comparable health spending, register different health indicators. In countries where the outcomes of the health system are very low, any incremental spending has a notable influence, whereas in countries with outstanding health performance any additional investments are affected by decreasing marginal returns.
To sum up, any discussion on the fiscal sustainability of health systems should start from the measurable performances of health systems, and then relate performances with the resources spent to achieve them. Starting from such an analysis, states can then develop targeted policies and launch innovative health service projects to improve the sustainability of the system as a whole. Measuring health system performances is not very straightforward, and it has been widely accepted that it represents a multi-dimensional issue. Some effective tools in investigating the performance of a health system rely on the use of composite indicators that have the benefit of measuring performance by combining distinct health indicators into a single composite index. Given the increasing interest in using composite indicators to measure healthcare performance, we decided to explore both the economic and the methodological aspects involved in building such a complex index. Since the literature review on the health composite index developed for the 28 EU countries is rather scarce, we believe that our paper fills in this gap by providing new measurement solutions for EU health systems’ performances. It also provides methodological ways to explore the relationship between the performances of the healthcare systems in the EU countries and their fiscal sustainability.
The purpose of this paper consists, therefore, in measuring the health systems’ performances of the European Union countries by building up a comprehensive composite index, which will then be used as a tool in investigating the relationship between health performance and fiscal sustainability of health systems in these countries. A principal components analysis (PCA) methodology was applied for building the composite index through the use of most relevant health indicators provided by Eurostat and the Sustainable Development Knowledge Platform for which data was available. Various Sustainable Development Goals 3 indicators (SDG3) dedicated to ensuring healthy lives and promoting well-being for all at all ages are considered in the composite index, as these have become critical targets in the 2030 Agenda. The 2030 Agenda is a holistic plan of action over the next 12 years which aims at capitalizing and completing the Millennium Development Goals in crucial aspects regarding human beings and the planet, by addressing the economic, social and environmental dimensions of sustainable development. We discuss the fiscal sustainability of health systems by focusing on expenditures and sources of funding, whereas we explore the relationship with health performances through a multiple correspondence analysis (MCA) approach.
The structure of the paper is the following: Section 2 is dedicated to the literature review in the field, while the methodology and data are described in Section 3. The main results of the composite index together with the analysis of fiscal sustainability of health systems in the EU are tackled in Section 4, while the last section is dedicated to the discussions, implications and the concluding remarks of the paper.

2. Literature Review

According to the main sustainable development goals, societies are committed to improve in the following interconnected areas: economic development (including extreme poverty alleviation), social inclusion, good governance and environmental sustainability. Health is obviously important as a fundamental human right, but it is also essential for the realization of these four pillars which are necessary for individual and social well-being. National goals for reaching economic growth can only be attained with a healthy population.
Numerous studies have focused on the link between health and growth. A very important component of a country’s economic development is people’s health. The relationship is not necessarily unidirectional: health determines development [6], but economic development also leads to improvements in health [7].
Some authors argue that an increase in government spending on health results in boosting economic growth [8,9]. Among other things, the authors suggest that the government should increase spending for the development of the health sector, because it increases productivity and growth. Similar results were obtained by [10], who focused on the potential trade-off between health and other public services, as well as by [11] who treated health as a form of capital, so that medical care is both a consumer good offering direct satisfaction and an investment good that generates indirect utility by increasing productivity, fewer sick leave days and higher wages. On the other hand, other authors [12] found that the relationship is unidirectional: government spending on health has a very low impact on economic growth, and economic development has no impact at all on government spending.
The White Paper “Together for Health: A Strategic Approach for the EU 2008–2013” was the first community strategy on health, with the main objective to create a coherent framework at community level, underpinning member states’ actions [13]. The document highlighted the central place of health in people’s lives and the need to find effective actions and policies for this key theme, with emphasis on the relationship between health and economic prosperity. In the same document, the experts drew attention to health spending that can be seen as an investment in the future, whereas the lack, insufficiency or inadequacy of investments in key health areas can entail further cost escalations. Therefore, a synergistic approach of the health issue has been proposed, integrating many sectors of activity and community policies, including regional and environmental policy, pharmaceutical and food regulation, health research and innovation policies, social security policies, policies on health and safety at work.
Currently, the EU member states are following the 2030 Agenda for sustainable development, representing a commitment from governments and the international community to improve health as a core factor for development. The Sustainable Development Goals (SDGs) define the priority areas for action set out in the 2030 Agenda, among which Objective 3—to ensure a healthy life and promote well-being for all at all ages.
One of the aims of SDG3 is universal health coverage (UHC), an essential goal for every nation to achieve fair and sustainable health outcomes and to increase the well-being of individuals and communities. A functional health system comprises resources, people and institutions, interconnected in order to maintain and improve the health of a population. Strengthening health systems is a way of progressing to UHC and ensures that the main goals of national health policies regarding quality, efficiency, equity, accountability, resilience and sustainability are incorporated in system performance [14].
There are various health systems in the world and a large diversity within Europe as well. In several European countries, public spending for health is largely funded by government revenue. In other states, the health spending is financed mostly by social security funds. There is also private funding for healthcare, which mainly consists of household payments (direct payments or co-payment arrangements) and different schemes of private health insurance [15].
Today, healthcare systems play a more important role in people’s lives than ever before. From a long-term sustainability perspective, the health system needs to have a conceptual framework that should comprise indicators such as: efficiency, availability, security, responsiveness, equity and effectiveness [16]. The sustainability of the health system is largely based on the individual and on his decisions on health and prevention spending that are greatly influenced by the individual’s health and certainty about the future. In these circumstances, the economic behavior of the healthcare consumer is important to analyze especially because it is characterized by limited rationality [17].
To help countries develop policies to increase efficiency, a first step is to quantify the effectiveness of national health systems and to analyze the factors that improve efficiency. Evaluating the performance of health systems is a challenging process that requires a multi-dimensional approach. According to the European Commission [18], there are two key criteria for selecting the priority areas for comparison and evaluation: (1) the impact on three dimensions—health impact, economic impact, equity impact; and (2) methodological criteria related to the viability of the implementation or feasibility of measures meant to improve system performance.
In recent years there has been growing interest in building composite indicators to measure health system performance because of the benefit of combining disparate health indicators into a single composite index that could capture a multi-dimensional perspective of the entire process. Among the first studies in this area, we mention Murray and Frenk who proposed in 2000 a conceptual framework to measure the performance of the health system [19]. Since then, several studies have generally observed a wide variation between countries in the efficiency of achieving health objectives and also in the influence that economic and social status has on efficiency [20,21].
Amongst the most successful health composite indicators used around the globe there are: the Star rating system for the UK National Health System (NHS) providers, the United States Medicare index, the Canadian regional healthcare indicator and the health system performance index published by the World Health Organisation (WHO), to name just a few.
Each of these composite indicators has several particularities. For instance, the annual Star rating system of the NHS hospitals in the UK was based on a composite index for acute hospital general trusts, combining various four-point scale indicators on hospital cleanliness and waiting time, as well as information on the financial state of the trust [22].
The United States Medicare state-level composite index was constructed by [23,24], based on a series of 22 Medicare quality indicators regarding the healthcare services (primarily in fee-for-service).
In Canada, the Institute for Health Information publishes annually several studies on regional health indicators [25,26]. Six main categories are considered in the index computation (outcomes, resources, prenatal care, efficiencies, community health and elderly services), while the set of weights assigned to the performance indicators are ‘based on expert opinion’.
Although these composite indicators could be seen as valuable tools in different policy making areas, some can be the subject of much debate. This is the case, for instance, of the composite index of health system performance published by the World Health Organisation in [27]. It is mostly criticized because of the high heterogeneity between the 191 countries considered in the analysis when comparing the broad areas of health, financial fairness and responsiveness.
Several fiscal space analyses pointed out that in countries with low and medium incomes, where resources are scarce, improving the efficiency of health systems is becoming increasingly relevant in order to address the challenges of delivering effective health services and moving towards UHC [28,29].
A recent study examined the efficiency of national health systems based on longitudinal data at country level [30]. The authors collected data on health expenditure per capita, infant mortality rate, mortality rate below 5 years and life expectancy for 173 countries for the period 2004–2011. Based on data envelopment analyses (DEA) the authors evaluated the efficiency of national health systems and using regression models they investigated the determinants of efficiency. The results indicated a large variation between countries regarding the efficiency of their national health systems, Africa having the lowest efficiency (67%), while Western Pacific countries the highest (86%). The study highlights the need to increase the efficiency of national health systems in order to meet the health needs of the population.
The same DEA approach was used to assess the efficiency of the health systems of 30 countries in Europe, with 3 output variables: infant mortality rate, life expectancy and life expectancy at birth, and three input variables: public health expenditures as a percentage of GDP, number of hospital beds, and number of doctors. The results indicated that alongside the developed countries also several developing countries were positioned on the efficiency frontier [31].
In a recent comprehensive study, statistical methods were used to compile data and estimate the performance of 33 health-related SDGs for 188 countries between 1990 and 2015. Each indicator was rescaled between 0 and 100, with 0 the worst observed value between 1990 and 2015 and 100 the best observed value. In 2015, the median SDG index for health was 59.3 and varied widely between countries, from 85.5 in Iceland to 20.4 in the Central African Republic. Since 2000, significant progress has been made for indicators such as mortality under-5 years, neonatal mortality, and met need with modern contraception. Moderate improvements have been observed for indicators such as the incidence of HIV and tuberculosis, minimal changes in hepatitis B incidence, whereas excess child weight has increased considerably [32].
At country level, studies generally focus on assessing hospital performance, these being the main healthcare centers. Performance analysis is an important way for hospitals to achieve greater efficiency in providing services to their clients. For China’s Hubei Province, some authors [33] focused on evaluating the performance of non-profit public hospitals using the backpropagation Artificial Neural Network. The results of their study can be used as decision support for the development and reform of non-profit hospitals, as well as for improving the performance of care units. Other authors [34] use a hybrid multiple criteria decision making (MCDM) approach in order to identify key performance indicators for hospital management. Their results consist of a complex set of cause and effect indicators connected by an influential relationship diagram and 7 performance indicators that can be used to gradually improve the health organizations’ efficiency.
The Italian Health Service was recently analyzed in a relational perspective using a Viable Systems Approach–Service Science (VSA–SS) approach, the study proposing an innovative methodology to assess the appropriateness of the healthcare service, indicating the need to develop the healthcare system in terms of efficiency, effectiveness and sustainability [35].
Healthcare systems often face the paradox of limited resources and increasing demand for services. In these conditions, the question of the sustainability of the health system at a global level is being examined more frequently. However, although patient satisfaction is well-known to be an essential factor in the social dimension of healthcare sustainability, we should not neglect the aspects related to the satisfaction of healthcare professionals and the organizational efficiency of medical institutions measured mainly by the efficiency of the services they provide. Various indicators can be used for the measurement of the level of satisfaction perceived by the actors of the healthcare system [36].
The American healthcare system can be a reference point for European health systems, given that the United States has already confronted with some of the current challenges that affect the sustainability of healthcare services. The key to achieving a sustainable healthcare system in the United States is represented by a set of reforms that targeted an unique and integrated service payment system, increased competition and surveillance, reduced fragmentation and regulation, the introduction of information technology into healthcare services, as well as the stimulation of medical professionals by introducing a differentiated assessment and payment system, education reform and innovation [37].
Innovation is seen as a key element which can solve the main issue of global health systems—the demand for healthcare grows and funding sources are limited, taking into account that fiscal return may take years to reap its reward [2]. Governments could identify new and innovative solutions to finance future health costs.

3. Methodology and Data

The first objective of this paper consists in building up a composite index that could measure the health system performances of the European Union countries. In general, a composite indicator is an aggregated index containing individual performance indicators. Secondly, the resulting Health Index will then become a powerful tool in investigating the fiscal sustainability of the health systems of the 28 EU countries in order to address some policy implications on this matter.
The use of composite indexes has brought arguments both in favor and against it, mainly related to methodological aspects. See Table 1 for a critical summary list of pros and cons on the use of composite indexes.
On the one hand, composite indexes are used more to monitor performance and to rank institutions and organizations in economic and socio-political areas [38,39]. These indicators are integrating large amounts of information in a comprehensible format and, as such, they prove to be valuable tools in providing performance summary assessments in priority areas. Some of the advantages include: keeping the focus on important political issues, offering a more comprehensive performance assessment, and presenting an ‘overview’ that is easily observable.
Constructing composite indicators is not always straightforward in terms of methodological aspects which may raise several technical and economic challenges that can generate potential misinterpretations or wrongful manipulation techniques on the respective composite measures if not addressed properly.
More so, these challenges are not restricted to only technical aspects since the usage and the publishing of composite performance measures may have the potential to generate very different behavioral responses and, as such, a careful analysis process needs to be undertaken in regards to their creation and subsequent use.
Although composite indicators tend to become more intensively used as political tools in different policy areas, they can be affected by a series of methodological constraints. Therefore, when building a composite indicator, it is of extreme importance to apply a rigorous methodology and to follow a set of important steps in building the composite index. Among the most relevant aspects that require a careful judgement when building composite indicators are: the choice of health indicators, the transformation of the performance measurements of the initial indicators, as well as the method applied to combine and to assign specific weights to the initial data based on clear and rigorous decision rules. The assigned set of weights should reflect the societal preferences of the health system outputs.
Since there is no straight general rule on the precise steps required for building effective composite indicators, the following steps were selected from the international empirical works [40,41]—and applied in this study as being the most relevant ones:
Step 1. Defining the Purpose of the Composite Index
The first step consists in identifying the units to be addressed and the main purpose for building such a composite index. Thus, prior to choosing the health indicators to be included in the composite, we need to draw on the existing theoretical framework and establish the boundaries of the units considered in the assessment, together with the main aspects of performance we intend to measure [41].
For the purpose of this paper we focus on building a composite index to measure the health systems performance of the 28 European Union countries. The analysis will cover the most recent year with available data for the set of countries considered.
Step 2. Selecting the Individual Health Indicators
Choosing the most relevant individual indicators to measure the health system performance for the EU countries is by far one of the most fundamental steps, where clear judgment becomes a requirement. The choice of the indicators is often a trade-off between data availability and the credibility of the composite index to accurately measure performance. It will be ideal to include in the composite a complete set of relevant indicators to form a credible image of the performance measurement composite based on the theoretical framework. However, most often there are data availability constraints that allow researchers only to partially capture the multi-dimensional aspects of health performance.
In this study, an initial set of 16 health indicators with available data for the 28 EU countries was collected, using the following data sources: Eurostat [42] and the Sustainable Development Knowledge Platform [43] respectively, which provides information on indicators of SDGs.
The purpose was to collect as many indicators as possible to best capture the performance of the health systems in the EU countries targeting, on the one hand, the indicators of the supply of medical services (such as number of doctors, nurses and midwives, dentists, physiotherapists and pharmacists; but also the population’s perception level for unmet medical examinations due to high cost); population-specific health status indicators (fertility rates, mortality rates, life expectancy); and labor market specific health indicators (such as the incidence rate of fatal accidents at work).
The choice of the self-reported unmet needs for the medical examination variable among the initial data set can be perceived as a health service satisfaction indicator directly related to individual-level cost concerns. For instance, the analysis of [44] upon the propensity and perceived expensiveness of health examinations showed that attending health examinations is positively associated with the possession of health insurance and the absence of financial or temporal constraints. For the purpose of our paper, this indicator was selected to reveal insights upon the population’s perception upon the use of inappropriate charges for medical services.
The main indicators considered in building the composite Health Index are summarized in Table 2, while a detailed description of them is presented in Table A1 Appendix A. Among the 16 health indicators considered, seven of them are of particular relevance as belonging to the SDG3 (Ensuring healthy lives and to promote well-being for all at all ages) health indicators. The main targets for 2030 promoted by the Agenda 2030 for these indicators are summarized in Table A2 Appendix A, according to the main social development goals.
The data collection process was a difficult one. For instance, initially all SDG3 indicators for all EU countries were considered for data collection, but because of data availability restrictions only seven indicators out of the 13 specific health targets were eventually selected. Moreover, in order to extend the initial data set of indicators we also considered several relevant health indicators provided by Eurostat to capture a better perspective of the medical services supply, as well as some health labor market particularities for which data was available for the same period for all countries.
It is widely recognized that one of the systems directly related to fiscal sustainability of the health systems is the labor market. Essentially this is supported by the fact that the labor market represents a significant source of health financing. A more accurate investigation of the linkage between these two systems reveals other important issues that should be taken into consideration when evaluating health care systems, such as occupational health or work-related fatalities. According to International Labor Organization (ILO), occupational diseases may contribute to the overall burden of disease as much as tuberculosis, HIV/AIDS and malaria taken together [45]. Furthermore, safer and healthier workplaces are considered an important trigger of sustainable economic growth [46]. Consequently, we have decided to include in our health index the indicator measuring fatal accidents at work. It represents only a part of the work related fatalities but it was the only available option provided by Eurostat with data available for all countries for the investigated period.
Our selection of health indicators was based on the relevant published literature, the data availability and in accordance to the main objective of the study, mainly to obtain a composite index that reflects the health system performance of the EU countries. Thus, the analysis was made for 2015, as being the most recent year with available data for the 28 EU countries.
The main advantage of using such an index is the storing of large amounts of information in one single value. Moreover, the composite index will allow for the identification of certain health related systemic problems that countries may have, and this will, in turn, point to the rethinking and reforming some of the adopted macroeconomic policies for those countries.
Step 3. Transforming the Individual Indicators
Prior to combining the individual indicators, we have to check for missing data and for possible transformations of the measured performance of individual indicators in order to allow any extra unit of attainment in a specific dimension to become of equal value at all levels of attainment.
The first aspect that has to be tackled at this step regards the missing data imputation problem. Since missing data often hinders the development of strong composite indicators, it has been recommended to treat them by using special techniques. In principle, there are several general methods of handling missing data, such as: deleting the case, single, or multiple imputations. In this study, a single value regression imputation technique was used to treat missing data as part of the analysis by attempting to impute values using linear regression to extrapolate the trend based on historical data collected from the 2000–2015-time horizon. However, two variables from our initial list had to be excluded from the analysis due to many missing values (physiotherapists per 100,000 inhabitants and pharmacies per 100,000 inhabitants).
The second issue concerns the use of multiple indicators measured in distinct units, which could be reflected into different weights in the composite index. In order to solve such a problem of mixing various units of measurement (such as %, number of persons or expenditure level), the initial data has to be transformed or standardized prior to being aggregated into the composite index.
Variables should also be normalized in order to avoid the presence of outliers or extreme values. In case indicators are characterized by a very skewed underlying distribution, logarithmic transformations could be used to normalize them [38].
In general, there are several normalization methods, among which standardization (or z-scores) has the benefit of converting the initial indicators to a common scale, having a mean of 0 and a standard deviation of 1. This preliminary procedure was also applied in our study as it plays a significant role when checking the suitability of the initial data set and provides a better understanding of the possible implications of the methodological choices taken while building the composite index (such as weighting or applying an aggregation technique). From a technical point of view, this involves rescaling the original indicators by subtracting the mean and dividing by standard deviation. For a specific country c, the new value achieved by a specific indicator X will be computed by the formula:
  X n o r m a l i z e d , c = X c X ¯ σ X  
where X ¯ is the sample mean of the indicator X and σ X is the standard deviation of X.
Step 4. Combining the Components Using a Decision Rule
The next step consists in deciding upon the best method to combine different dimensions of performance (that are measured on distinct scales) in a meaningful way. This is an important process that implies defining the set of weights assigned to the initial indicators and the methodology for aggregating the variables into a single composite index.
Without a rigorous methodology, such a composite index could hide important attribute values for certain dimensions, which could result in taking inefficient policy-making steps.
When computing a composite index, it is of extreme relevance to decide upon the best way all the information is weighted and aggregated. One simple approach in weighting the initial indicators that is often used in policing performance assessment consists in giving equal weight to all initial variables. This is the case when all performance dimensions are considered to be of similar relevance or when there is no information or statistical or empirical grounds for prioritizing the initial variables. Moreover, according to [47] equal weights are generally appropriate only when the initial indicators are either uncorrelated or highly correlated, and less applicable when some are correlated and others are not.
Another approach suggests, however, the use of distinct weights in order to reflect the priority, reliability or some other characteristics of those indicators [38]. The most common multivariate statistical techniques used in building such composite indicators are the PCA and factor analysis (FA). These methods are used to estimates weights for the initial indicators based on correlations between them.
In this study, principal components analysis was used in SPSS, which is essentially a method to reduce the dimensionality of the initial data set down to a small number of uncorrelated (orthogonal) factors called principal components. This statistical procedure allows a small number of principal components to account for much of the variance among the initial set of variables.
The lack of correlation between the principal components is a useful feature because it indicates that these components measure different statistical dimensions of the initial data. Each component is a weighted linear combination of the initial variables. Based on the correlation matrix or the covariance matrix, if the data has been standardized the eigenvalues are estimated and they give the weights for each principal component. The principal components are ranked decreasingly by the variation of the original variables, the first component corresponding to the largest variation. The second principal component which is uncorrelated with the first one corresponds to the maximum variation that is not contained in the first component, and so on.
This procedure has the advantage of being as objective as possible, since it will never rely on arbitrarily selected weights but will always show values that are obtained via statistical methods. In the formula of the composite index the variables that need to have a small contribution will be represented with a minus, so that the level of the health status can be represented with values as high as possible.
We are aware of the large variety of methodologies that could have served the purpose of building composite indicators. However, in this study we focused on the PCA method, as it is one of the most commonly used techniques in building composite indicators. In this sense, Jacobs, Smith and Goddard [41] bring evidence of the use of PCA in several applications such as the internal market index for the EU countries to reduce the dimensionality of the initial data sets. Moreover, according to [39] one benefit of a linear composite consists in the fact that transformation of the initial variables can ensure that the weights of the composite are kept valid across the range of observed performance. Additionally, in order to reduce dimensionality through non-linear extensions of PCA we need sufficiently large data sets. The size of our sample is not appropriate for proving non-linearity or for performing the validation procedures required by non-linear PCA (NPCA). In conclusion, the computational cost involved by NPCA cannot be justified in this context.
Step 5. Testing the Robustness of the Composite Index through Sensitivity Analysis
The last step in the process of building the composite index implies conducting a sensitivity analysis to test the robustness of the index. One possible way could be to examine the ranks and the final scores of the correlation coefficients while simulating multiple structures of the composite index with distinct choices of weights. Another useful addition to it could be to construct the confidence intervals around the composite index, as larger standard errors would lead to wider confidence intervals which signals less precision around the estimates.
The robustness of the composite index can also be tested through the use of different statistical tests that evaluate the quality of the PCA results. Such tests are the Kaiser–Meyer–Olkin (KMO) and the Bartlett’s test of sphericity. On the one hand, the KMO test evaluates the sampling adequacy, by comparing the magnitudes of the partial correlation coefficients to the magnitudes of the observed correlation coefficients. For values greater than 0.5, the test indicates that a factor analysis is appropriate to be applied [48], even though the most reliable results of the PCA are to be expected when the test value is higher than 0.8, showing that there is a high factorability for the data sample.
On the other hand, the Bartlett’s test of sphericity checks for any redundancy between variables so that the individual indicators from the correlation matrix to be uncorrelated (i.e., the correlation matrix should be an identity matrix). The test is statistically significant if the associated probability of the test is less than 0.05.
In this paper we applied both KMO and the Barlett’s test in order to check the robustness of the index. We notice that the KMO test value is 0.740, suggesting that the sampling is adequate and the PCA is, indeed, appropriate. Regarding the Bartlett’s test of sphericity we notice that the test is statistically significant (approximate chi-square = 148.937), meaning that the correlation matrix is not an identity matrix and that variables are related and therefore suitable for structure detection.

4. Main Results

4.1. Building the Health System Performance Index

Within this section, the PCA presented in the previous section is now applied in order to build a composite index for the health system performance of the EU countries. As already mentioned, the most relevant health indicators were provided by Eurostat and the Sustainable Development Knowledge Platform.
Since PCA is a sensitive method to the relative scaling of the initial variables, the initial data set had to be transformed prior to applying the dimensions reduction method. Thus, to address the issue of mixed units of measurement, a normalization technique was required. From the variety of normalization techniques, we chose to standardize the data and thus avoid the potential biases resulting from the inclusion of data with different scales and ranges of values.
For reasons of multicollinearity, from the initial list the following indicators were excluded: the under-five mortality rate (strongly correlated by 98.8% with infant mortality rate); neonatal mortality rate (also strongly correlated by 97.5% with infant mortality rate); as well as life expectancy (97.6% strongly correlated with mortality rate attributed to cardiovascular disease, cancer, diabetes or chronic respiratory disease). The correlation matrix is shown in the Appendix B, Table A3.
Following the PCA, the eigenvalues are shown in Appendix B, Table A4, together with the extracted components. It is to be noted that only the first three main components have values above 1 (λ1 = 4.42, λ2 = 2.43 and λ3 = 1.21), having a minimum informational loss of approximately 26.75%. So, following the Kaiser criterion, only the first three principal components were considered for computing the composite index.
Table 3 presents the rotated matrix of the principal components, after applying the Varimax normalized variation method, which helps identify the most powerful correlations between the initial data and the principal components.
The first principal component (PC1) explains 40.1% of the total variance of the initial data and is strongly correlated with: maternal mortality rate, infant mortality rate, mortality rate attributable to cardiovascular disease, cancer, diabetes or chronic respiratory disease, tuberculosis incidence to 100,000 and the incidence of fatal accidents at work. Practically, the PC1 is an element describing the health status of the population, mainly based on mortality rates at birth, by types of diseases or by fatal accidents at workplace respectively.
The second principal component (PC2) explains 22.1% of the total variance of the initial data and is strongly correlated with total fertility rate, the number of nurses and midwives per 100,000 inhabitants and the prevalence of current consumption of tobacco among people aged 15 and over, indicating information on issues related mainly to population fertility, incidence of tobacco use, and the number of nurses and midwives available to ensure adequate care.
The third principal component (PC3) explains 11% of the total variance of the initial data and is strongly correlated with indicators of the supply of medical services: the number of doctors per 100,000 inhabitants, the number of dentists per 100,000 inhabitants and the indicator of individuals’ perception on unmet medical service due to high costs. Thus, we can say that PC3 is reflecting the supply level of medical services and the accessibility degree of these services.
The non-standardized health system performance index is obtained as follows:
HEALTH _ INDEX   =   40.14 73.26 C P 1 +   22.10 73.26 C P 2 + 11.02 73.26 C P 3 = 0.548 · C P 1 + 0.302 · C P 2 + 0.150 · C P 3  
Considering then the weights and the direction in which the variables contribute to the identification of a composite indicator of the health system performance at the EU country level, the following variables were included with the minus sign in the calculation of the composite index:
Maternal mortality rate.
Infant mortality rate.
Incidence of tuberculosis per 100,000 inhabitants.
Mortality rate attributable to cardiovascular disease, cancer, diabetes or chronic respiratory disease.
Prevalence of current tobacco consumption among people aged 15 and over.
Incidence rate of fatal accidents at work.
Self-reported unmet needs for medical examination (too expensive).
The list of the EU countries on the basis of the composite index that measures the health systems performance for the year 2015 is shown in Appendix B, Figure A1.
For the ease of interpretation of country values through the use of percentages between 0 and 100, the composite index was then transformed using the percentile rank method in SPSS, following the approach proposed in [49].
According to Figure 1, the best performing country within the EU member states is Denmark, for which the maximum value of 100% of the health system performance index is registered. Denmark is closely followed by two other Nordic countries—Sweden and Finland, with similar performances. These findings may suggest that the Nordic health systems perform best as compared to other EU countries. As a particularity of the Nordic health system, we should highlight their integrated, tax-based decentralized health system. In general, the percentage of total expenditure on health in GDP is comparable with or even above the EU average and has increased over the last decade, being expected to grow even further in the future as a consequence of population aging. In Denmark, among the main recent initiatives to improve the health system, the transparency reform stands out. The focus of this reform is on quality and results, aiming to improve healthcare management and long-term care system and to generate more systematic knowledge about quality and best practice, as well as a national platform with updated health data. Finland, on the other hand, faces moderate sustainability risks because of the unfavorable budgetary position on age-related public spending. The new reform targeting the organization of healthcare and social services, however, aims to reduce the projected public finance sustainability gap by 2030.
Italy’s health system is fourth, registering a very high level of performance of about 89.3% in 2015. In terms of population, Italy is also the fourth largest country in the EU (after Germany, France and UK), with a life expectancy at birth above the EU average. Regarding the total public expenditure on healthcare as percentage of GDP, although the forecasted trend is estimated to steadily increase [50], no real sustainability risk should appear if the legislated pension reforms is fully implemented.
One particular surprise in the ranking of the EU member states based on the Health Index, appears to be the high position of Greece in the top five, for which further investigation is required. On the one hand, the life expectancy at birth in Greece is above the EU average and has slightly increased since the Great Recession, even though the population is projected to decrease to 8.6 million people in 2060. Another relevant aspect consists in the fact that in 2015 Greece registered the highest number of medical doctors (632 per 100,000 inhabitants) and dentists (123 per 100,000 inhabitants) as compared to the other EU countries, even though it had the highest prevalence of tobacco use in the EU (43.8%).
The positions of Germany, Luxembourg, Netherlands, Ireland and Belgium in top 10 most high performing EU countries in terms of health system come as no surprise. At the opposite pole, however, we notice at the bottom of the ranking the presence of two Baltic countries (Latvia and Lithuania) alongside the South-Eastern European countries: Romania, Bulgaria, Slovakia and Croatia, as well as Hungary. Among these groups of countries, Romania is at the bottom end of the list, with the lowest level of health performance of only of 3.6%. Even though the Romanian economy has significantly grown since the EU accession, this country is still facing critical development challenges and healthcare reforms are still very much needed [51]. Moreover, according to [52,53], dedicated measures to stimulate labor force participation in Romania are also required, focusing especially on women, as they are the main determinants of fertility rates.

4.2. Analyzing the Fiscal Sustainability of Health Systems in the European Union (EU) Countries in Relation to Health Performances

In this section of the paper we explore the relationship between the performances of the healthcare systems in the EU countries and their fiscal sustainability. We measured healthcare performances through the health index which has been developed in the previous section of the paper. As mentioned, the composite index could be considered as an output of the health systems given that it illustrates the health status of the population, the population fertility and the accessibility of medical services. Fiscal sustainability will be expressed through a set of indicators which shall be discussed below. There are at least three areas for approaching the fiscal sustainability of health systems: collection, efficiency and the role of private spending [54]. We shall focus as it follows on the first two.
In order to have a representation of the fiscal dimension of a health system, we have included in our investigation in principal variables capturing health system inputs. Evidently the most evocative input should be the level of the healthcare expenditures (% GDP). It is well known that it is difficult for systems to be efficient at low expenditure [55]. Regardless of the domain we are investigating, human resources make a significant contribution to efficiency improvement. Therefore, the second input represents the share of employment in human health and social work activities (% total employment). The high correlation (0.77) between these two inputs could be explained by the fact that labor costs are an important expenditure category. Furthermore, the diversity of the health financing sources is considered a key determinant of health system performance [56]. According to Eurostat, the financing mechanisms are divided into the following main categories: (i) government schemes—determined by law; (ii) compulsory contributory health insurance schemes—based on the payment of health insurance contributions by or on behalf of the individuals concerned; (iii) voluntary healthcare payment schemes—based upon the purchase of a health insurance policy; (iv) household out-of-pocket payment—direct payment for healthcare goods and services from the household primary income or savings [57]. The entropy concept was used to summarize this information. In order to facilitate the comparison of the structural diversity within the health systems with respect to the financing sources, mainly through visualization means, we need to compress the information provided by the distribution of health expenditures, into a single number. Shannon entropy is a concept from information theory widely used for this purpose [58,59,60]. This is considered to measure the diversity within a system characterized, by n different states, each state i being associated with a probability p i . In the context of our investigation, n is the number of financing schemes and p i is the relative share of each one. Shannon entropy compares the observed distribution, given by p i , with an uniform distribution. Thus the entropy index achieves its maximum value under conditions of absolute diversity. At the opposite pole, systems described by absolute concentration, where one state has probability equal to one, will have minimum entropy. The mathematical formula satisfying these conditions is given by:
  E n t r o p y = i = 1 n p i ln ( p i ) ,  
In a nutshell, a higher entropy index is associated with greater diversification, involving many possible actions, while a lower value indicates that there is one prevalent financing arrangement through which people obtain health services. For 2015, the entropy index ranges between 0.49 (Sweden) and 1.21 (Greece). In Sweden, the share of government schemes is about 83%, meanwhile in Greece we notice a relatively even distribution between three categories: government schemes (30.27%), compulsory contributory health insurance schemes (28.8%), and household out-of-pocket payment (35.46%). The correlation between the diversification of funding sources and health system performance is investigated by the means of MCA.
However, when discussing the sustainability of a health system it is important to take into account also the years spent on average by the population in the labor market. This indicator is associated with improved health, longer life expectancy, but also with economic activity and reduced budgetary pressure. Eurostat estimates the duration of working life using the activity rates from the Labour Force Survey. In brief, this indicator estimates how long a person who is currently 15 years old will be active on the labor market during his or her life [61].
Figure 2 shows how healthcare expenditures influence the value of the Health Index. At the same time the scatter plot reveals through the colors (ranging from blue to orange) the duration of working life and, through the size of the points, the share of employment in human health and social work activities. The positive correlation between the main input, reflecting health financing, and the composite index is obvious. The plot also emphasizes that most of the high ranking countries are among the countries with longest durations of working life—greater than 38 years and a better representation of healthcare activity with respect to employment. This pattern is reproduced by countries like Finland, Denmark, Sweden, Germany, Netherlands and the UK where large outputs are obtained from large inputs.
Even if they are situated in the same area as the countries mentioned before, Belgium, Italy and Greece, characterized by a high level of health expenditures and a top 10 position according to the Health Index, strike a slightly discordant note due to the color. This means that the duration of the working life in these countries is well below the EU average—less than 33 years. Also, the size of the points representing Italy and Greece is similar to the less-performing systems lying out on the lower left side of the figure. This shows that these systems obtained a high ranking according to the health index even if the employment share in human health and social work activities is not very high. According to our representation, the health system in France shows inefficiency given that both expenditures and human resources involved are high; meanwhile, the outcomes, especially the one given by the ranking method, are rather low. The nearest neighbor of France as illustrated by our scatterplot is the point representing the health system in Austria. It seems that this system is performing better compared to France, since with less inputs it manages to produce better outputs. These findings are consistent with previous results obtained in 2010 from a DEA approach, where Austria and France show inneficiency in transforming inputs reflecting health expenditure into outputs that capture health status of the population [31]. On the flip side, countries like Romania, Poland, Bulgaria, Slovakia, Croatia, Hungary, Latvia, Lithuania and the Czech Republic belong to the group defined by reduced inputs and a weak performance. From this group, Bulgaria draws our attention since even if it registers the highest share of healthcare expenditures in GDP it is laying at the bottom end of our ranking.
From the technical efficiency point of view, Luxembourg could be considered a best practice example due to the fact that, with reduced inputs, this system comes out in the 10 most high-performing countries according to our health index ranking. Another interesting case is that of Cyprus where although the input levels are similar to the countries situated in the lower left corner of the plot, it is significantly separated from those according to the higher output levels. A similar conclusion was drawn in the previously mentioned study [31], based on non-parametric efficiency estimation, where the healthcare system in Cyprus was classified as efficient.
In order to summarize and visualize the relationships between the health index and the indicators describing the fiscal sustainability of health systems, the MCA was used in R [62]. This technique is considered the equivalent of PCA for categorical variables. Therefore, the results are also based on an eigenvalue decomposition, only that this time the computations are made on the Burt table instead of a correlation matrix. This represents the matrix of all two-way cross-tabulations of the categorical variables. The main result of MCA is a graphical representation where each point represents a category of one of the variables included in the analysis. This map will emphasize the associations between the categories of different variables. Each of the axes accounts for a percentage of the total variation within the data, called total inertia [63].
Hence, we can visualize in a two-dimensional space the information contained in the following variables describing the national health systems: Health Index, Healthcare expenditures (%GDP), Duration of working life, Employment in human health and social work activities and Entropy. In order to obtain this simplified representation, we transformed those five numerical variables into categorical variables with three levels. The considerations underlying the selection of the categories are as follows:
-
The first category, labelled “Low” (L), includes the countries characterized by values well below the EU average. The second category, labelled “Medium” (M), refers to countries situated around the EU average and the third level, labelled “High” (H) is assigned to the countries where the values of the indicators are well above average;
-
The absolute frequencies recorded by each category must be comparable;
-
The breakpoints are selected using the criteria of the most significant gap. This means that the countries were sorted by ascendant order according to the values of the variables. Afterwards the lower and the upper bound of the intervals defining a certain category point out the maximum difference between the current value and the previous one. Appendix B, Table A4 provides the intervals used to build the categorical variables and also the names of the new variables.
Figure 3 shows the map obtained from MCA. The percentage of the cumulated inertia captured by the two axes is about 83.8%, revealing that two dimensions are enough to explain the variation within our data (Appendix B, Table A5). The first dimension accounts for most of the variability in the data (67.24%) and it contrasts low-ranking systems with high-ranking systems.
The map underlines the proximity between all the categories labeled “Low” (L). This means that in general, low-ranking systems are also included in the category characterized by reduced levels of health spending, small length of working life and lack of human resources in human health and social work activities. On the left side of the map, we can see that higher ranks are associated with higher shares of health expenditures in GDP, a large share of employment in the health sector and higher duration of working life. Also, by including the entropy variable in the analysis we can conclude that a higher diversification of financing sources does not necessarily have a positive impact on healthcare systems.
As shown in Figure 3, a reduced level of diversification (entropy:L), where the funding comes mainly from one source, is mostly associated to high performance. This is the case of Sweden and Denmark where over 80% of the expenditures are covered by government schemes. UK and Italy are also belonging to the low-level category of the entropy variable, following the same pattern as the previously mentioned countries. At the opposite pole, among the countries depicting a high level of diversity Finland, Greece and Belgium are also performing very well according to the Health Index. The map represented in Figure 3 foretells this result through the length of the distance between the category “Low” of the Health Index (HI:L) and the level “High” of the entropy variable (entropy:H). It is obvious that this distance is much higher than the distance between categories “High” Health Index (HI:H) and “Low” entropy (entropy:L).

5. Discussion, Implication and Conclusions

Balancing between growing need for adequate, affordable and efficient healthcare, which implies growing expenditure with the necessity of efficient spending of public finances will continue to be a difficult burden on EU governments in the years to come. Adequate and sustainable budgeting is one of the main goals of any healthcare system, being a key feature of good quality, accessible and affordable healthcare services. Nevertheless, there are different pathways towards this goal and each EU country may find its own way through a mix of policies regarding revenue generation and collection, reallocation of funds within the system, system design and institutional arrangements.
Given the recent increase of worldwide interest in the use of composite indicators for measuring healthcare performance, this paper explores both the economic and the methodological aspects involved in building such a complex index in order to quantify the health systems performance of the European Union countries. Principal components analysis was applied upon an initial set of 16 relevant health indicators provided by Eurostat and the Sustainable Development Knowledge Platform for which data was available. In order to capture the multi-dimensionality of the health systems performance problem we used indicators reflecting not only the supply of medical services, but also the population-specific health status indicators, as well as labor market specific health indicators.
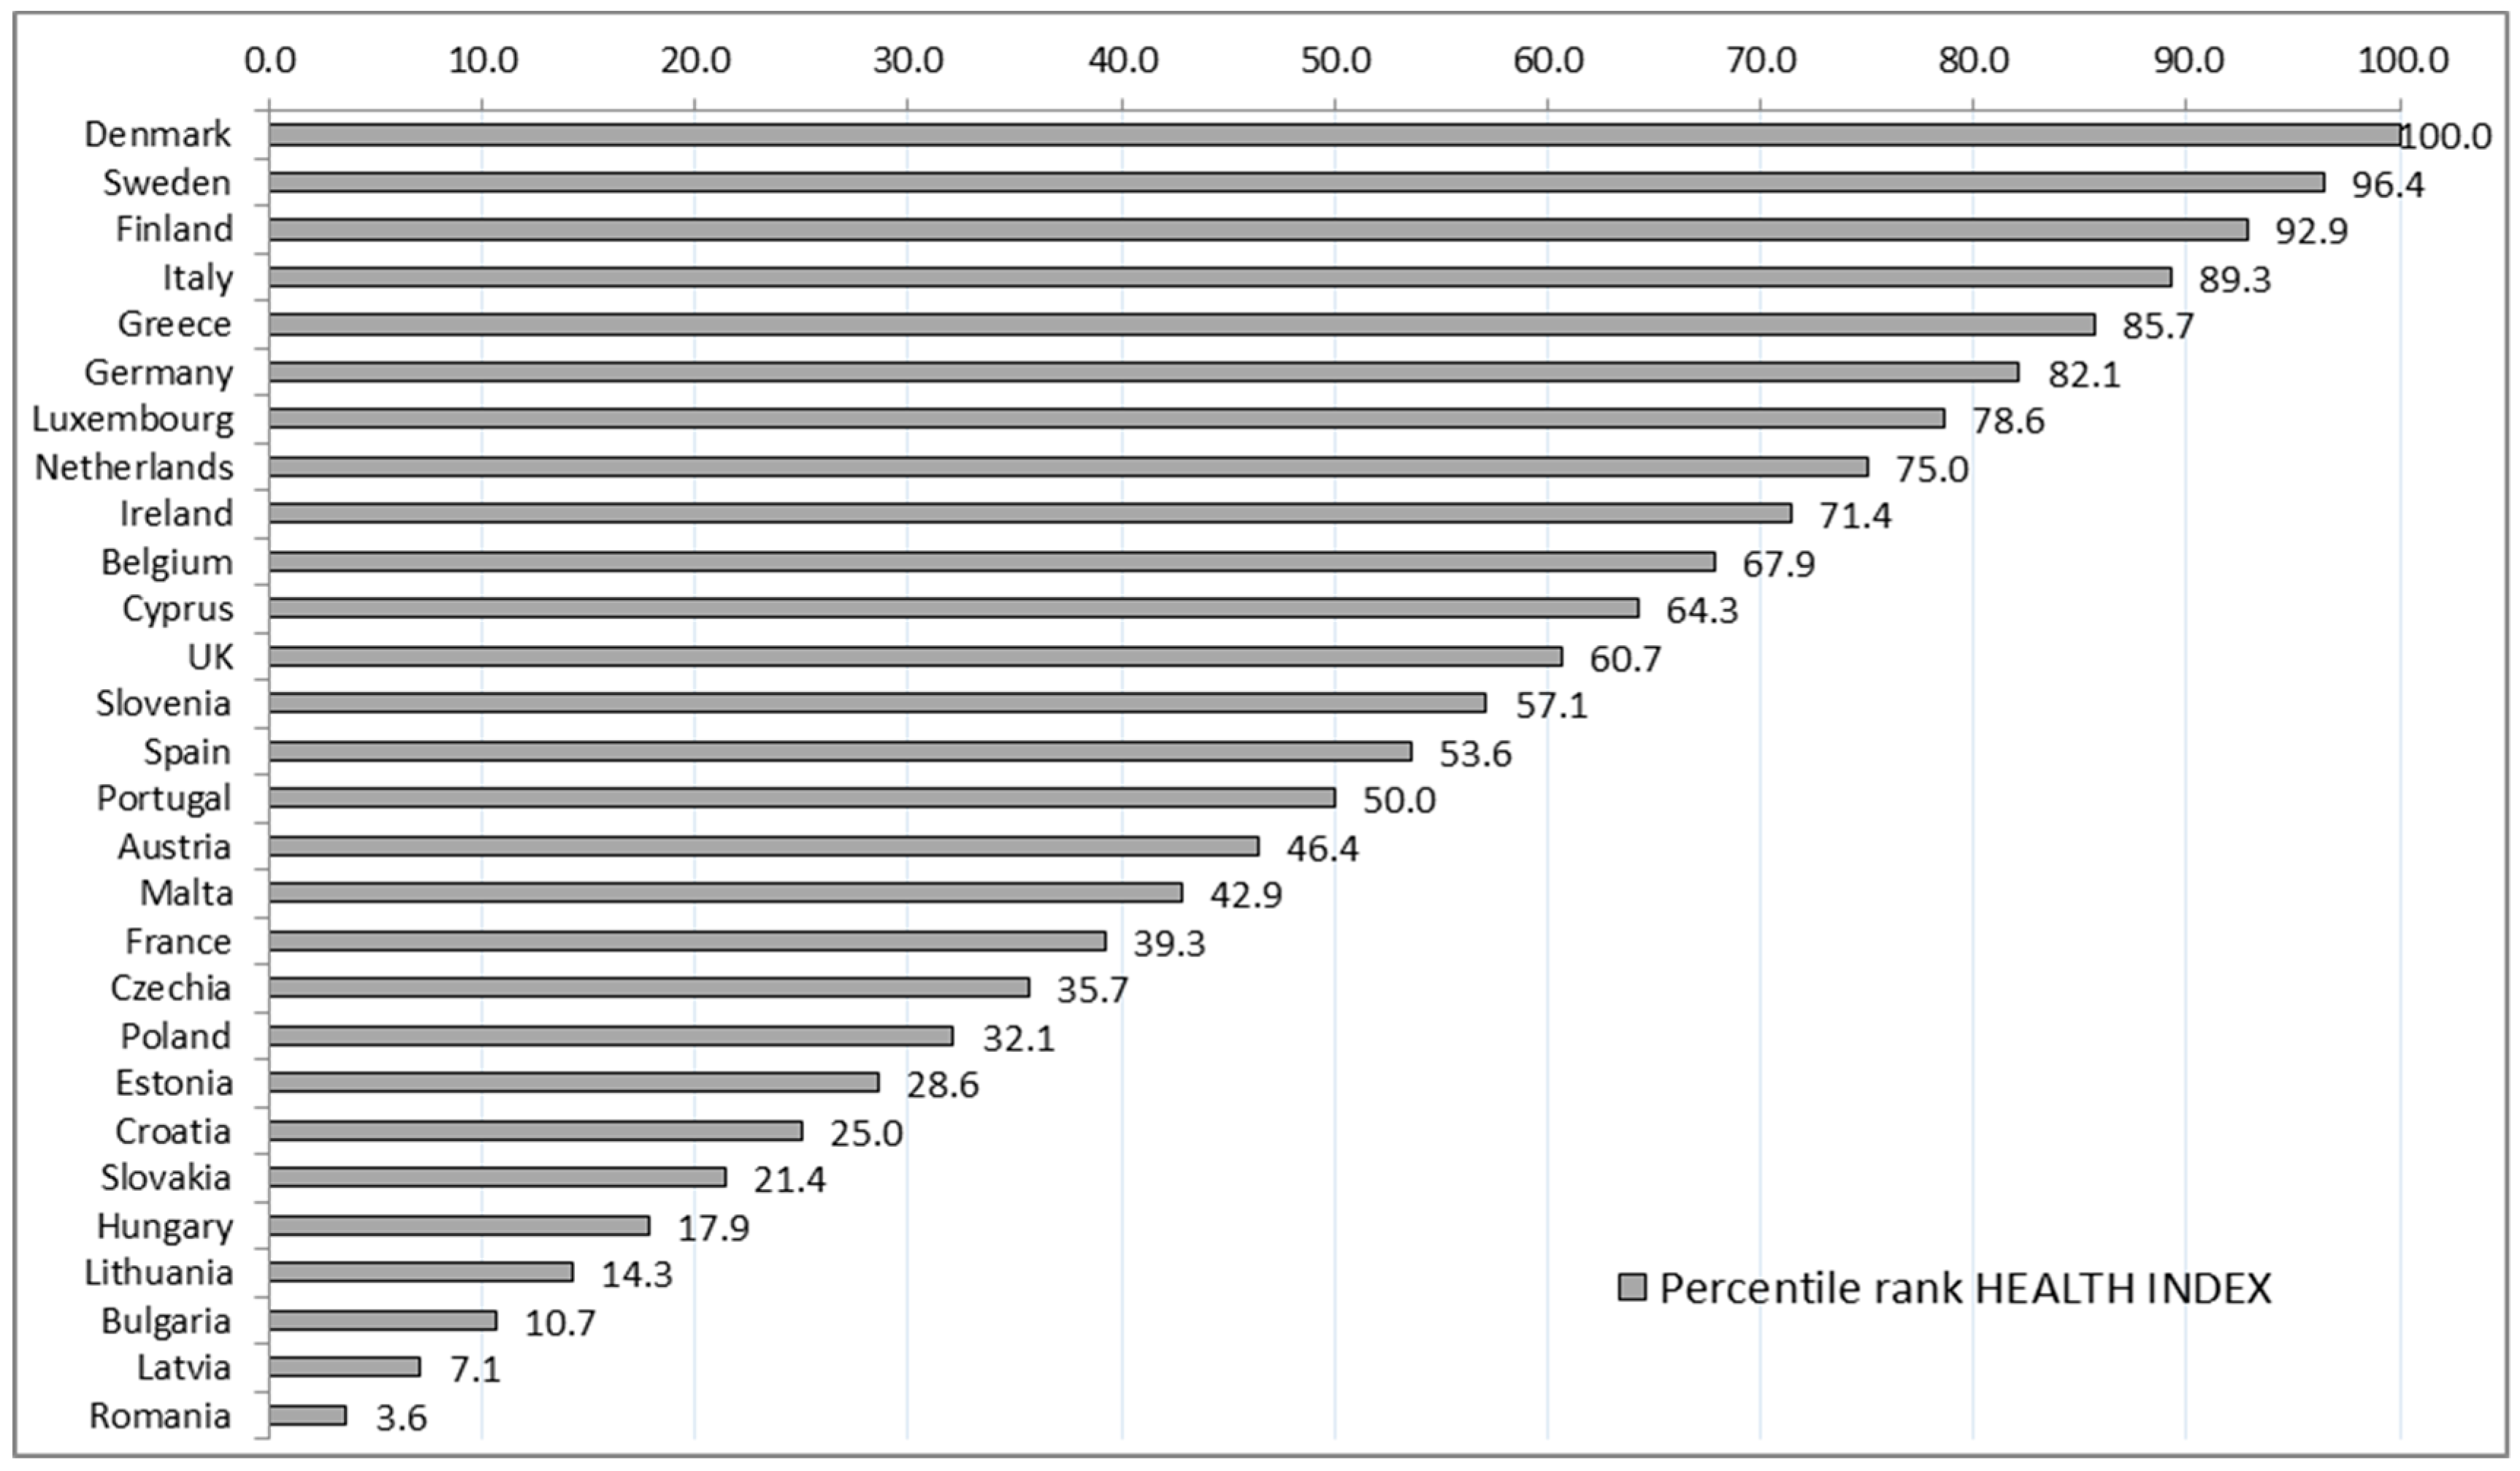
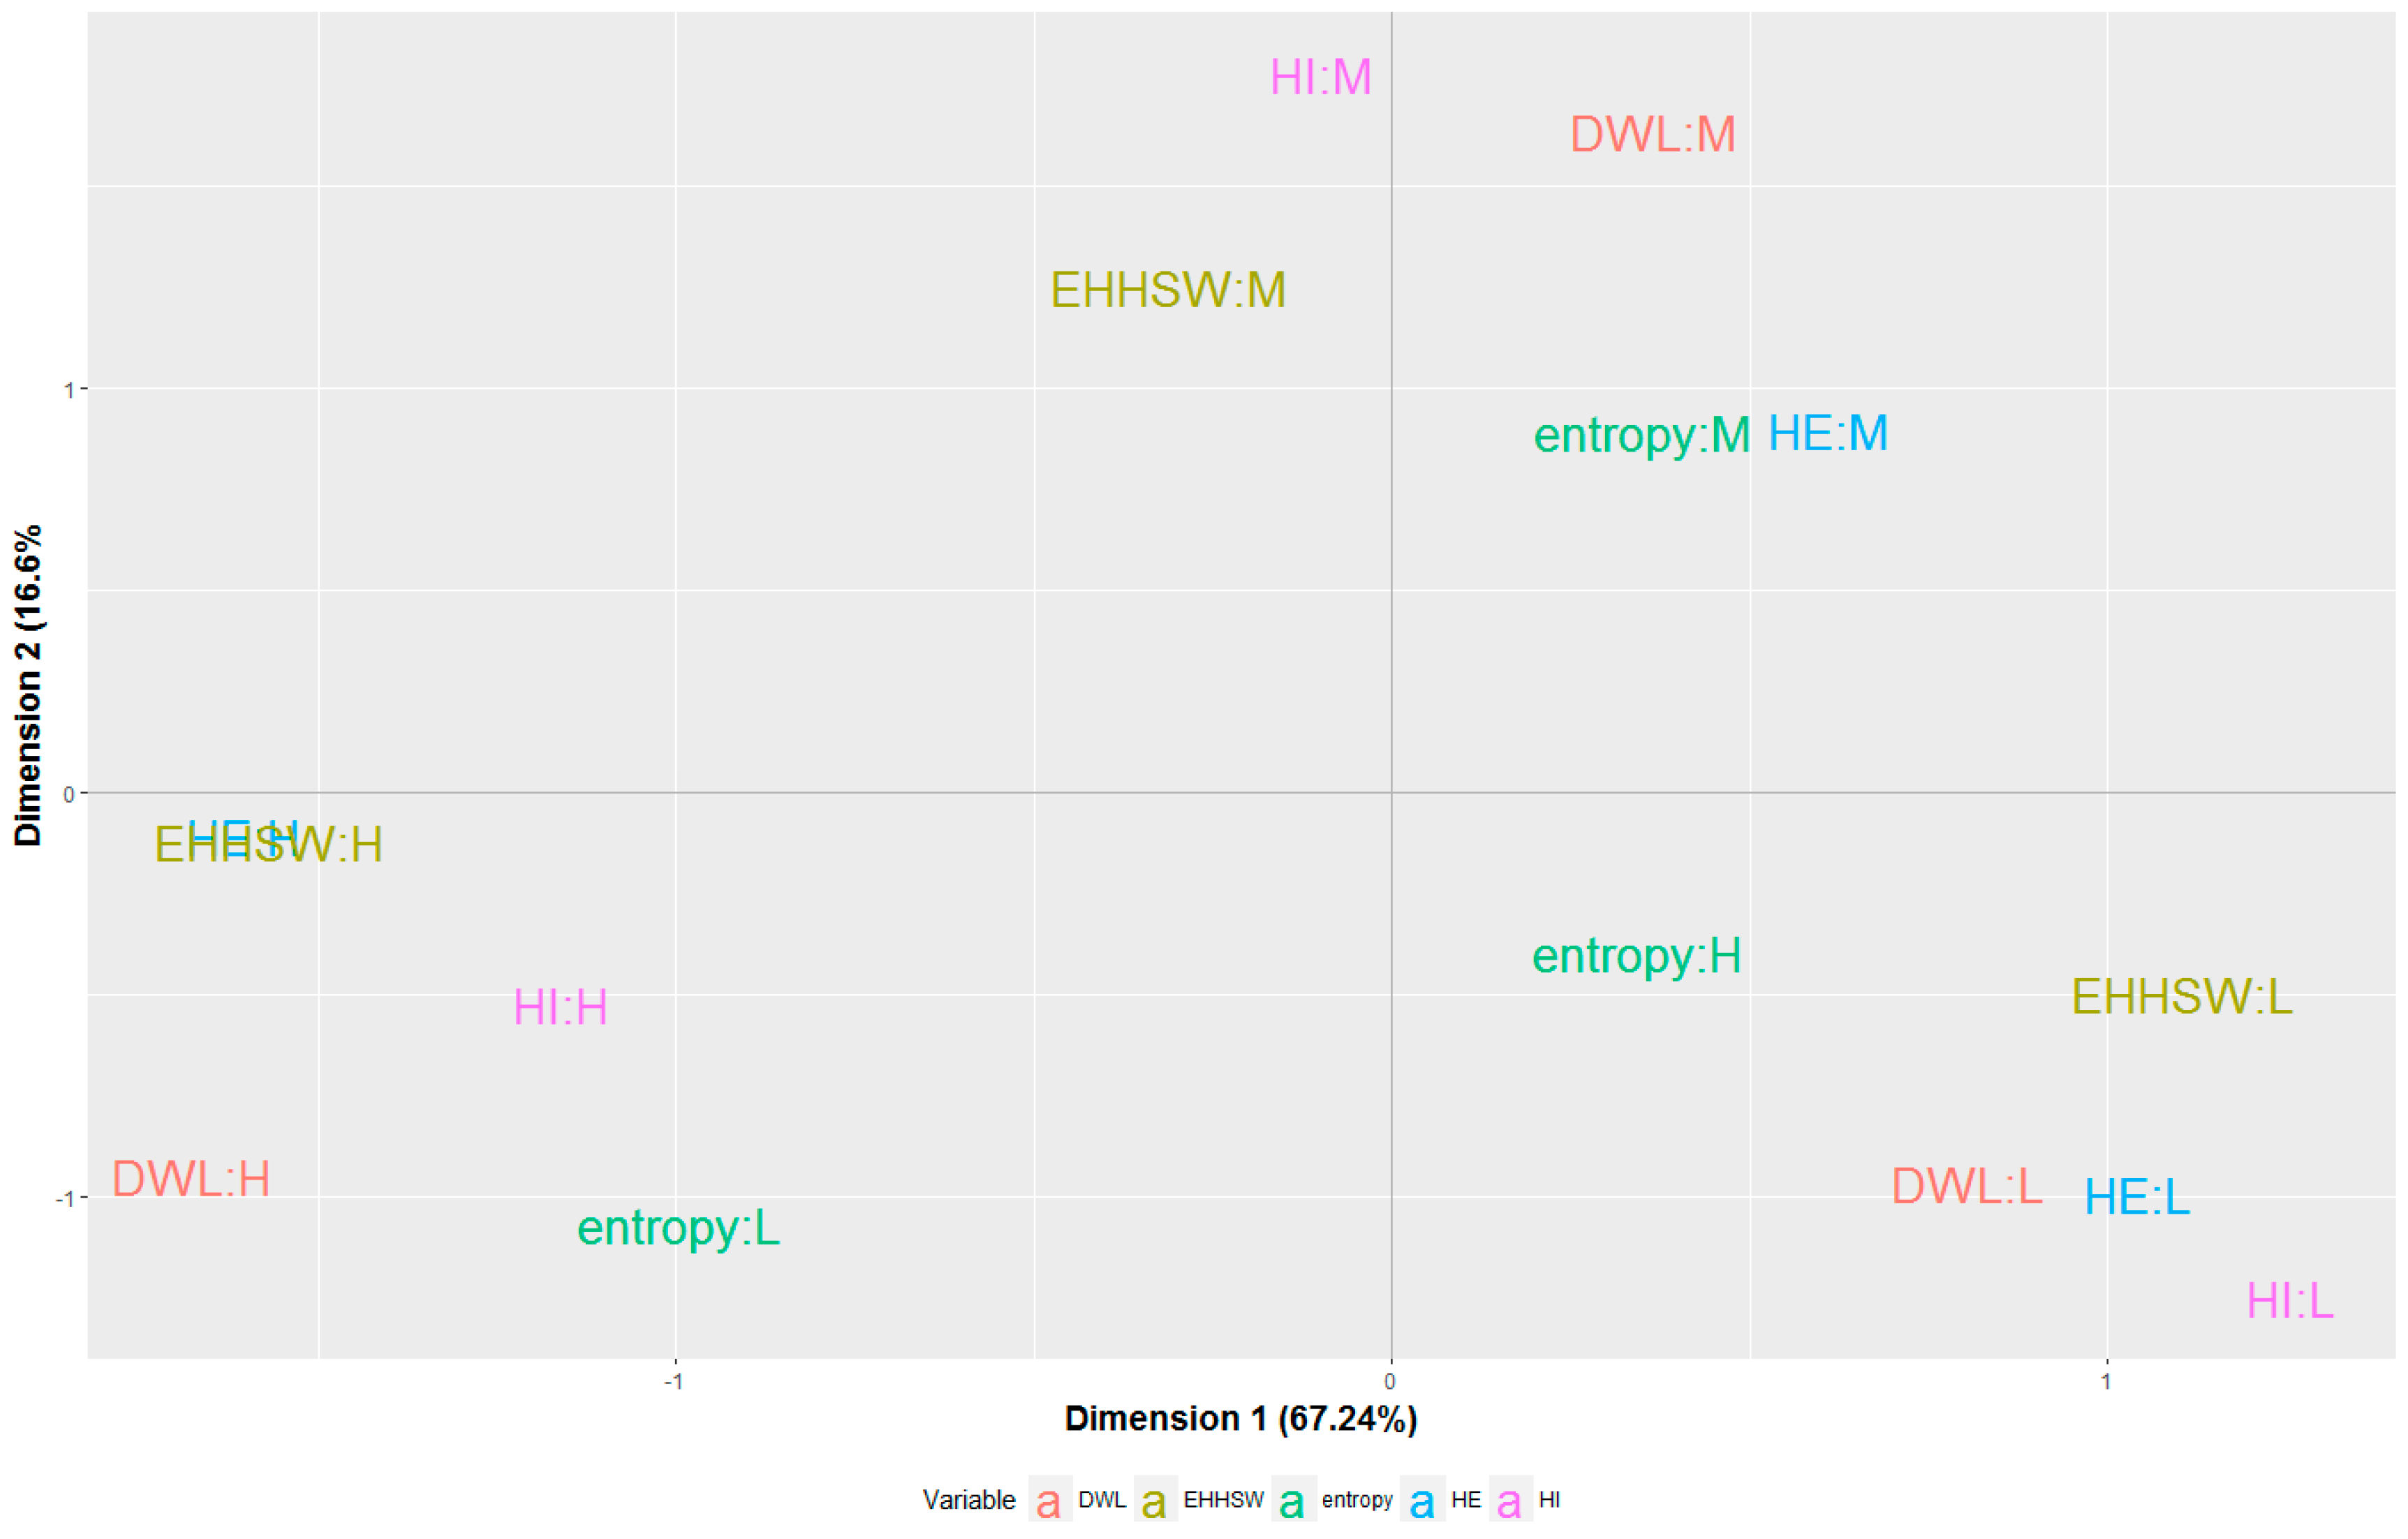
The main benefit of the composite index consisted in the ability to offer a comprehensive performance assessment and to provide a clear ranking of the EU countries based on the performance of their health systems, focusing on objective criteria. The composite index then became a useful tool for exploring the correspondence between health performances and fiscal sustainability of health systems in these countries. The analysis was built on a MCA framework, a technique which allowed for simplified and suggestive visual representations helping us to raise some key discussions.
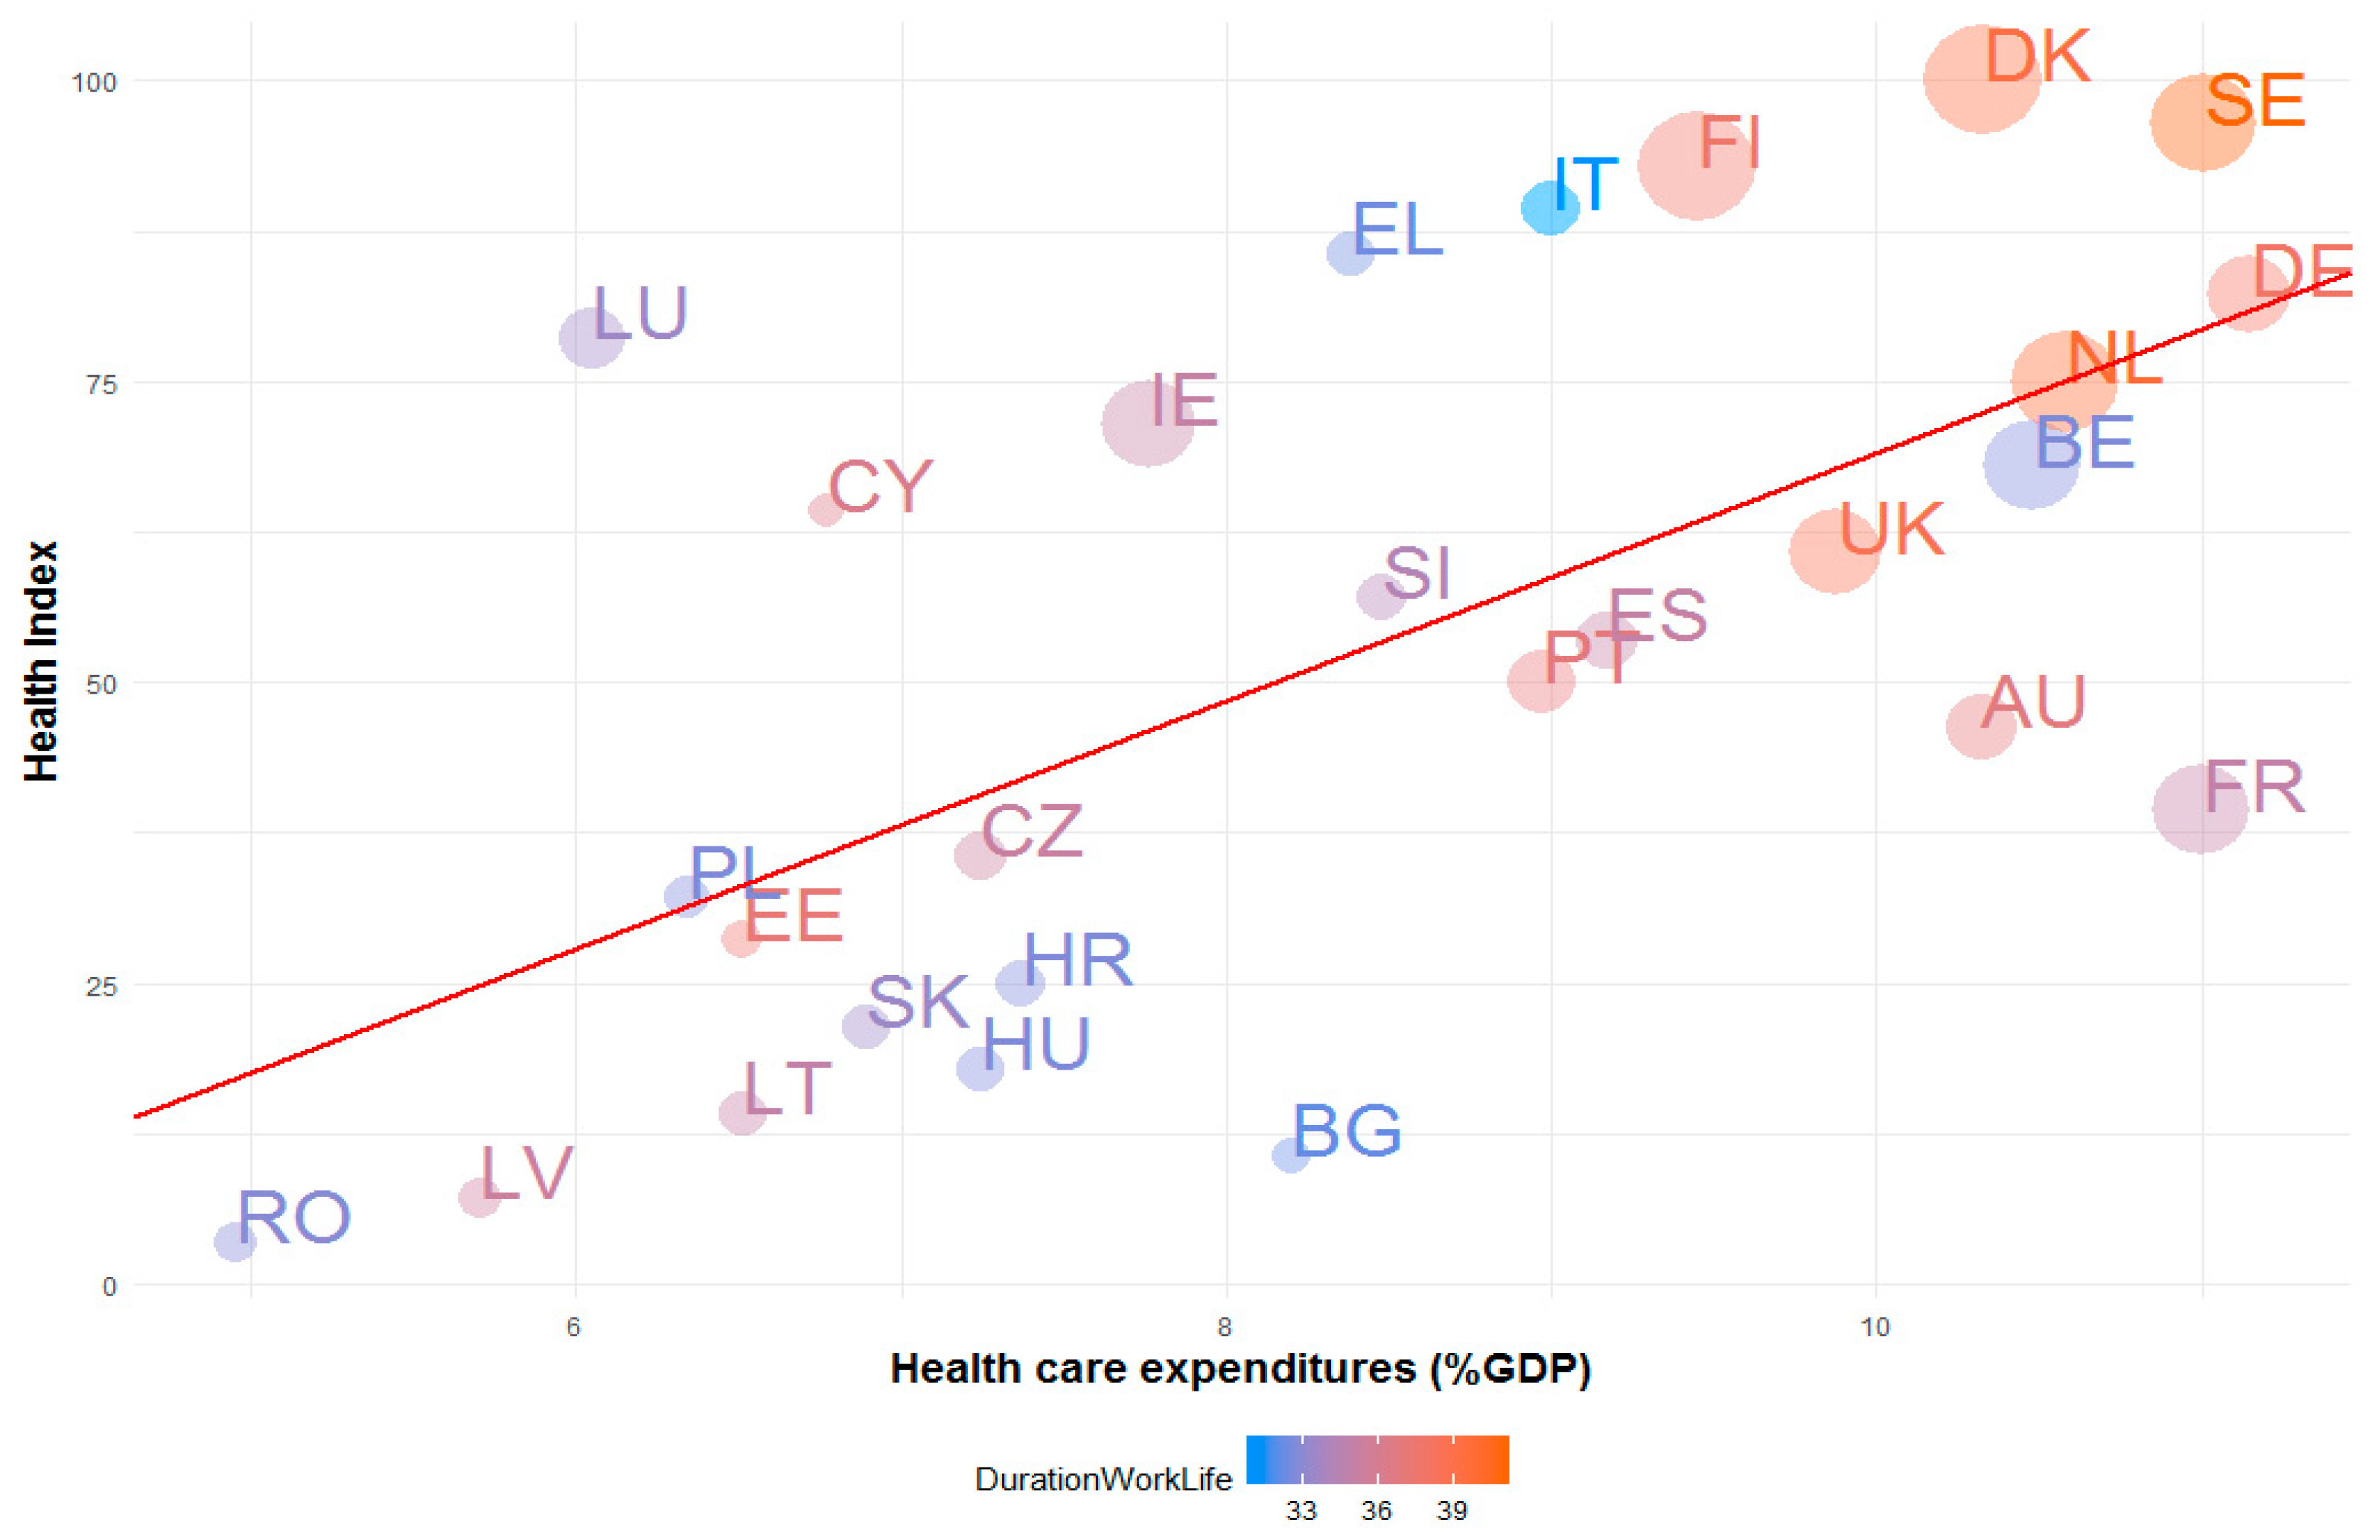
The main findings suggested that the countries characterized by high levels of healthcare expenditures as percentage of GDP, compared to average EU level, are commonly at the top of the Health Index. This means that they often have reduced mortality rates, a lower incidence of fatal work accidents and tuberculosis disease, higher fertility rates, a substantial supply of medical services expressed by the number of doctors. Furthermore, most of these countries are frequently above the EU average with respect to the duration of working life and health employment. Another finding underlined by our investigation shows that the health systems included within this category are characterized by a low diversification of the health funding sources, government schemes covering over 80% of the total health expenditures. These patterns suggest an efficiency of healthcare spending that could reduce the risks to long-term fiscal sustainability. Generally, our results are consistent with previous results obtained from a DEA approach developed in 2010 on European countries [31].
It seems that countries which assign a lower than average share of their GDP to healthcare, relative to the EU average, find it harder to achieve outcomes comparable to countries with larger healthcare expenditures. Therefore, these countries usually score lower than the aforementioned ones, lagging behind EU levels with respect to the health status of the population and the supply of medical services. These results are in line with other findings that argue that the increase in health expenditure as a share of GDP lead to improvements in healthcare [9]. Even if we notice a proximity to the weak diversification category, in this case, the association between the attributes of the health systems and the diversification of the funding mechanisms is not so precise. Consequently when the input depicts a low level, the distribution among different sources it is not so significant.
The empirical research on the EU member states provides a better understanding of the health system performance and fiscal sustainability. From a managerial point of view, this study provides a methodology for evaluating and ranking health system performances and some clues upon the health spending efficiency and policy implications. From an academic perspective, we propose a more circumspect and objective attitude towards the way health spending efficiency and health system performances can be tackled, thus opening the debate for further investigation.
We are aware, however, of the limitations of our study. Although composite indicators could be seen as valuable tools in different policy making areas, they can also be the subject of debate regarding the choice of initial indicators, as well as the method applied for weighting and aggregating. Proper comparisons with other health composite indicators from the international literature could provide a more complex sensitivity analysis of the proposed composite index. However, in the absence of similar characteristics in terms of initial data sets, country samples and time-frames, a comparison of such results might be biased and generate potential misinterpretations. Since the literature review indicated no proper comparison match to our composite index (developed for the year 2015 for the 28 EU countries), we believe we must be cautious when dealing with such issues and avoid further comparisons. Constructing composite indicators is not always a simple task and the linked methodological difficulties may raise several technical and economic challenges. In our case, a larger set of initial indicators would have been ideal for capturing a more holistic image of the health system performances. Further investigation on the propensity and perceived expensiveness of health examinations could also have been better tackled. The choice of initial indicators should, however, be seen as a trade-off between data availability and the relevance of the composite index in accurately measuring the performance of the EU health systems’ performance.
Regarding the methodological aspects, although the PCA methodology was tested for adequacy and found to be appropriate, we may still face the criticism that correlations might not necessarily reflect the real connections between the selected indicators and the phenomena under observation.
Finally, there is the issue concerning the choice of the country sample that includes both long-standing members and newer ones. Even though we are aware of the heterogeneity between data, we accept such biases in order to be able to conduct an investigation of health system performances at the EU level and to objectively provide a ranking between the EU member states using PCA. The results confirm that more developed countries tend to have better performing health systems, but the MCA revealed some particular cases of inefficiency given that both the expenditures and the human resources involved are high. Our findings provide additional arguments to support our choice of using such a country sample.
As future research, we are planning to further investigate the technical efficiency of EU health systems through specific non-parametric methodologies, such as the DEA technique, having the Composite Health Index as output and fiscal indicators as inputs to the model. We consider that building the composite health index represents a prerequisite step in the efficiency estimation framework. This statement is supported in the first place, by the so called “curse of dimensionality” translated into an upward bias of DEA efficiency scores when using a large number of input and/or output variables. Of course, an additional way of reducing this drawback will consist in extending the sample size by including other health systems in the analysis. This approach could have the benefit of allowing a more complex investigation of the efficiency of different health systems, by ranking them according to the capacity of maximizing their outputs given their inputs.

Author Contributions

All co-authors contributed to conceiving and designing the study, as well as to writing and editing the paper. Although the paper was the outcome of a joint effort by all co-authors, in particular, Section 2 is the work of M.D.V. and A.C., Section 3 is the work of M.E.P., while Section 4 and Section 5 are the work of M.E.P., M.M.M.M. and E.M., respectively. The manuscript was approved by all co-authors for publication and the work described was original research that has not been published previously and is not under consideration for publication elsewhere, in whole or in part.

Funding

NUCLEU Program funded by the Romanian Ministry of Research and Innovation (Project PN 18420202).

Acknowledgments

Part of this work was supported by the NUCLEU Program funded by the Romanian Ministry of Research and Innovation (Project PN 18420202).

Conflicts of Interest

The authors declare no conflict of interest.

Appendix A

Table A1. Main indicators considered in the Composite Health Index.
IndicatorsAbbreviated NameDefinition
Maternal mortality ratioMaternal mortalityThe obstetric risk: the number of deaths of pregnant women per 100,000 live births occurring in a given year in one country.
Infant mortality rateInfant mortalityThe number of deaths under one year of age divided by the number of live births occurring in a given year in one country.
Under-five mortality rate Under-five mortalityThe probability of dying before reaching five years of age expressed per 1000 live births in a given year in one country.
Neonatal mortality rateNeonatal mortalityThe number of deaths of children under 28 days of age expressed per 1000 live births in a given year in one country.
Tuberculosis incidence per 1000 populationTB incidenceThe burden of tuberculosis (TB) in a population: the number of TB cases arising per 1000 population in a given year in one country.
Mortality rate attributed to cardiovascular disease, cancer, diabetes or chronic respiratory diseaseCCDC MortalityThe probability of dying between 30–70 years from cardiovascular diseases, cancer, diabetes or chronic respiratory diseases in a given year in one country.
Age-standardized prevalence of current tobacco use among persons aged 15 years and olderTobacco useThe number of current smokers over 15 years old of any tobacco product in the population of one country in a given year.
Life expectancyLife expectancyThe average number of years a person born in a given country is expected to live if mortality rates at each age were to remain steady in the future.
Total fertility rateFertility rateThe average number of children born alive by a woman during her lifetime.
Self-reported unmet needs for medical examination(too expensive)Unmet medical needsIndividual’s own assessment of unmet needs for healthcare services because of being too expensive (expressed as % of total population).
Incidence rate of fatal accidents at workFatal accidents at workThe number of fatal accidents occurring at work in a given year in one country.
Medical doctors per 100,000 inhabitantsMedical doctorsThe number of medical doctors available per 100,000 inhabitants in one country.
Nurses and midwives per 100,000 inhabitantsNursesThe number of nurses and midwives per 100,000 inhabitants in one country.
Dentists per 100,000 inhabitantsDentistsThe number of dentists available per 100,000 inhabitants in one country.
Physiotherapists per 100,000 inhabitantsPhysiotherapistsThe number of physiotherapists available per 100,000 inhabitants in one country.
Pharmacists per 100,000 inhabitantsPharmacistsThe number of pharmacists available per 100,000 inhabitants in one country.
Sources: authors’ selection based on Eurostat and the Sustainable Development Knowledge Platform.
Table A2. Main Sustainable Development Goals 3 (SDG3) targets for the indicators considered for the Health Index.
IndicatorsTargets by 2030
Maternal mortality ratioSDG3.1—reduce the maternal mortality ratio to less than 70 per 100,000 live births.
Infant mortality rateSDG3.2—end preventable deaths of newborns.
Under-five mortality rate SDG3.2—reduce under-5 mortality to at least as low as 25 per 1000 live births.
Neonatal mortality rateSDG3.2—reduce neonatal mortality to at least as low as 12 per 1000 live births.
Tuberculosis incidence per 1000 populationSDG3.3—end the epidemics of tuberculosis and other communicable diseases.
Mortality rate attributed to cardiovascular disease, cancer, diabetes or chronic respiratory diseaseSDG3.4—reduce by one third premature mortality from non-communicable diseases through prevention and treatment and promote mental health and well-being.
Age-standardized prevalence of current tobacco use among persons aged 15 years and olderSDG3.a strengthen the implementation of the World Health Organization Framework Convention on Tobacco Control in all countries, as appropriate.
Sources: authors’ contribution.

Appendix B

Table A3. Correlation matrix of the initial data set.
Maternal MortalityInfant MortalityUnder-Five MortalityNeonatal MortalityTB IncidenceCCDC Mortality RateTobacco UseLife ExpectancyTotal Fertility RateFatal Work AccidentsUnmet Medical NeedsMedical DoctorsNursesDentists
Maternal_mortality1.0000.7620.7350.6770.7840.5980.086−0.5720.0940.6440.467−0.387−0.220−0.003
Infant_mortality0.7621.0000.9880.9750.6900.6610.290−0.646−0.0890.4880.593−0.254−0.415−0.260
Under_five_mortality0.7350.9881.0000.9760.7210.6720.289−0.677−0.0700.5150.578−0.202−0.420−0.243
Neonatal_mortality0.6770.9750.9761.0000.6260.6070.282−0.598−0.1130.4260.583−0.175−0.392−0.285
TB_incidence0.7840.6900.7210.6261.0000.6230.109−0.6710.0850.6970.474−0.163−0.2930.104
CCDC_Mortality0.5980.6610.6720.6070.6231.0000.421−0.976−0.1120.4960.393−0.306−0.501−0.073
Tobacco_use0.0860.2900.2890.2820.1090.4211.000−0.349−0.3500.1370.5380.264−0.6690.376
Life_expectancy−0.572−0.646−0.677−0.598−0.671−0.976−0.3491.0000.050−0.503−0.3520.2740.4230.063
Fertility_rate0.094−0.089−0.070−0.1130.085−0.112−0.3500.0501.000−0.098−0.181−0.1930.555−0.167
Fatal_work_accidents0.6440.4880.5150.4260.6970.4960.137−0.503−0.0981.0000.270−0.165−0.3600.043
Unmet_medical_needs0.4670.5930.5780.5830.4740.3930.538−0.352−0.1810.2701.0000.251−0.4760.364
Medical_doctors−0.387−0.254−0.202−0.175−0.163−0.3060.2640.274−0.193−0.1650.2511.000−0.0820.560
Nurses−0.220−0.415−0.420−0.392−0.293−0.501−0.6690.4230.555−0.360−0.476−0.0821.00−0.149
Dentists−0.003−0.260−0.243−0.2850.104−0.0730.3760.063−0.1670.0430.3640.560−0.1491.000
Source: authors’ computation.
Table A4. The total variance explained.
ComponentInitial Eigenvalues
Total% of VarianceCumulative %
14.41540.13840.138
22.43122.10162.239
31.21211.01573.254
40.7887.16580.419
50.6325.74986.168
60.4373.97390.142
70.3503.17993.321
80.2542.31295.633
90.1911.73797.370
100.1681.52998.899
110.1211.101100.000
Source: authors’ computation.
Figure A1. List of the EU countries based on the Health Index, 2015. Source: authors’ computation.
Sustainability 10 03186 g0a1
Table A5. Numerical variables transformation.
Numerical VariableLevelsCategorical Variable
Low (L)Medium (M)High (H)
Health Index≤32.15(32.15, 64.3]>64.3HI
Healthcare expenditures (%GDP)≤6.89(6.89, 9.45]>9.45HE
Duration of working life (Years)≤33.5(33.5, 36.2]>36.2DWL
Employment in human health and social work activities (share in total employment)≤7.73(7.73, 12.98]>12.98EHHSW
Entropy≤0.74(0.74, 0.96]>0.96entropy
Source: authors’ computation.
Table A6. Summary of multiple correspondence analysis (MCA): principal inertias (eigenvalues).
Dim.Value%Cum%Scree Plot
10.24434267.267.2******************
20.06029916.683.8*****
30.0036671.084.8
40.0020250.685.4
--------------------
Total0.363540
Source: authors’ computation.

References

  1. Sustainable Development Solutions Network. Health in the Framework of Sustainable Development. Technical Report for the Post-2015 Development Agenda, Sustainable Development Solutions Network. 2014. Available online: http://unsdsn.org/wp-content/uploads/2014/02/Health-For-All-Report.pdf (accessed on 23 August 2018).
  2. Scrutton, J.; Holley-Moore, G.; Bamford, S.M. Creating a Sustainable 21st Century Healthcare System. The International Longevity Centre—UK (ILC-UK). 2015. Available online: http://www.ilcuk.org.uk/ (accessed on 2 August 2018).
  3. European Commission. Identifying Fiscal Sustainability Challenges in the Areas of Pensions, Health Care and Long-Term Care Policies; Occasional Paper No. 201; European Commission: Brussels, Belgium, 2014; Available online: http://dx.doi.org/10.2765/85081 (accessed on 2 August 2018).
  4. Thomson, S.; Foubister, T.; Figueras, J.; Kutzin, J.; Permanand, G.; Bryndova, L. Addressing Financial Sustainability in Health Systems. WHO on Behalf of the European Observatory on Health Systems and Policies, Copenhagen, 2009. Available online: http://www.euro.who.int/__data/assets/pdf_file/0018/76041/E93058.pdf?ua=1 (accessed on 2 August 2018).
  5. Coiera, E.; Hovenga, E.J. Building a Sustainable Health System. U.S. National Library of Medicine, National Center for Biotechnology Information, 2008. Available online: https://www.ncbi.nlm.nih.gov/pubmed/17700898 (accessed on 2 August 2018).
  6. Dalpatadu, K.; Sein, U. Health systems development: Role of public health in economic development. Reg. Health Forum 2005, 9, 36–53. [Google Scholar]
  7. Aisa, R.; Pueyo, F. Endogenous Longevity, Health and Economic Growth: A Slow Growth for a Longer Life. Econ. Bull. 2005, 9, 1–10. [Google Scholar]
  8. Nurudeen, A.; Usman, A. Government Expenditure and Economic Growth in Nigeria, 1970–2008. A Disaggregated Analysis. Bus. Econ. J. 2010, 4. Available online: http://astonjournals.com/manuscripts/Vol2010/BEJ-4_Vol2010.pdf (accessed on 30 July 2018).
  9. Wang, F. More Health Expenditure, Better Economic Performance? Empirical Evidence From OECD Countries. Inquiry 2015, 52. [Google Scholar] [CrossRef] [PubMed] [Green Version]
  10. Agenor, P.R. Health and Infrastructure in Models of Endogenous Growth. Center Growth Bus. Cycle Res. Discuss. Pap. Ser. 2005, 62, 1407–1422. [Google Scholar] [CrossRef]
  11. Berger, M.C.; Messer, J. Public Financing of Health Expenditures, Insurance and Health Outcomes. Appl. Econ. Taylor Fr. J. 2002, 34, 2105–2113. [Google Scholar] [CrossRef]
  12. Bakare, A.S.; Olubokun, S. Health Expenditure and Economic Growth in Nigeria: An Empirical Study. J. Emerg. Trends Econ. Manag. Sci. 2011, 2, 83–87. [Google Scholar]
  13. Commission of the European Communities. Together for Health: A Strategic Approach for the EU 2008–2013; White Paper; Commission of the European Communities: Brussels, Belgium, 2007; Available online: https://ec.europa.eu/health/ph_overview/Documents/strategy_wp_en.pdf (accessed on 2 August 2018).
  14. Kieny, M.P.; Bekedam, H.; Dovlo, D.; Fitzgerald, J.; Habicht, J.; Harrison, G.; Kluge, H.; Lin, V.; Menabde, N.; Mirza, Z.; et al. Strengthening health systems for universal health coverage and sustainable development. Bull. World Health Organ. 2017, 95, 537–539. [Google Scholar] [CrossRef] [PubMed]
  15. Hejduková, P.; Kureková, L. National health systems’ performance: Evaluation WHO indicators. Procedia Soc. Behav. Sci. 2016, 230, 240–248. [Google Scholar] [CrossRef]
  16. Kelley, E.; Hurst, J. Health Care Quality Indicators Project: Conceptual Framework Paper. OECD Health Work. Pap. 2006, 23. [Google Scholar] [CrossRef]
  17. Vuong, Q.H.; Ho, T.M.; Nguyen, H.K.; Vuong, T.T. Healthcare consumers’ sensitivity to costs: A reflection on behavioural economics from an emerging market. Humanit. Soc. Sci. Palgrave Commun. 2018, 4, 70. [Google Scholar] [CrossRef]
  18. European Commission. Definition and Endorsement of Criteria to Identify Priority Areas When Assessing the Performance of Health Systems; Expert Panel on Effective Ways of Investing in Health; European Commission: Brussels, Belgium, 2014; Available online: https://ec.europa.eu/health/expert_panel/sites/expertpanel/files/002_criteriaperformancehealthsystems_en.pdf (accessed on 1 August 2018).
  19. Murray, C.J.; Frenk, J. A framework for assessing the performance of health systems. Bull. World Health Organ. 2000, 78, 717–747. [Google Scholar] [PubMed]
  20. Boerma, T.; Chopra, M.; Evans, D. Health systems performance assessment in the Bulletin. Bull. World Health Organ. 2009, 87, 2. [Google Scholar] [CrossRef] [PubMed]
  21. Greene, W. Distinguishing between heterogeneity and inefficiency: Stochastic frontier analysis of the World Health Organization’s panel data on national health care systems. Health Econ. 2004, 13, 959–980. [Google Scholar] [CrossRef] [PubMed]
  22. Department of Health. NHS Performance Ratings: Acute Trusts 2000/01; Department of Health: London, UK, 2001. Available online: http://www.doh.gov.uk/performanceratings/2001/index.html (accessed on 29 July 2018).
  23. Jencks, S.F.; Cuerdon, T.; Burwen, D.R.; Fleming, B.; Houck, P.M.; Kussmaul, A.E.; Nilasena, D.S.; Ordin, D.L.; Arday, D.R. Quality of medical care delivered to Medicare beneficiaries: A profile at state and national levels. J. Am. Med. Assoc. 2000, 284, 1670–1676. [Google Scholar] [CrossRef]
  24. Jencks, S.F.; Huff, E.D.; Cuerdon, T. Change in the quality of care delivered to Medicare beneficiaries, 1998-1999 to 2000-2001. J. Am. Med. Assoc. 2003, 289, 305–317. [Google Scholar] [CrossRef]
  25. Canadian Institute for Health Information. Health Indicators May 2018; Canadian Institute for Health Information: Ottawa, ON, Canada, 2018; Available online: https://www150.statcan.gc.ca/n1/en/catalogue/82-221-X (accessed on 20 June 2018).
  26. Canadian Institute for Health Information. Health Care in Canada 2001; Canadian Institute for Health Information: Ottawa, ON, Canada, 2001; Available online: https://secure.cihi.ca/estore/productSeries.htm?pc=PCC64 (accessed on 20 June 2018).
  27. World Health Organization. The World Health Report 2000—Health Systems: Improving Performance; World Health Organization: Geneva, Switzerland, 2000; Available online: http://www.who.int/whr/2000/en/ (accessed on 20 June 2018).
  28. World Bank. Analyzing Fiscal Space Options for Health in Zimbabwe; Ministry of Health and Child Care: Harare, Zimbabwe, 2016; Available online: https://doi.org/10.1596/26410 (accessed on 20 June 2018).
  29. Health Sector Resiliency Project. Potential Avenues to Increase Government Investment in Health in Afghanistan: Fiscal Space Analysis; Health Sector Resiliency Project: Kabul, Afghanistan, 2016; Available online: http://thinkwell.global/wp-content/uploads/2017/07/Palladium-Fiscal-Space-Analysis-Report-2016-Final.pdf (accessed on 6 August 2018).
  30. Sun, D.; Ahn, H.; Lievens, T.; Zeng, W. Evaluation of the performance of national health systems in 2004-2011: An analysis of 173 countries. PLoS ONE 2017, 12. [Google Scholar] [CrossRef] [PubMed]
  31. Asandului, L.; Roman, M.; Fatulescu, P. The Efficiency of Healthcare Systems in Europe: A Data Envelopment Analysis Approach. MPRA Paper No. 58954. 2014. Available online: http://mpra.ub.uni-muenchen.de/58954/ (accessed on 1 August 2018).
  32. GBD. Measuring the health-related Sustainable Development Goals in 188 countries: A baseline analysis from the Global Burden of Disease Study 2015. Lancet 2016, 388, 1813–1850. [Google Scholar] [CrossRef] [Green Version]
  33. Li, C.; Yu, C. Performance Evaluation of Public Non-Profit Hospitals Using a BP Artificial Neural Network: The Case of Hubei Province in China. Int. J. Environ. Res. Public Health 2013, 10, 3619–3633. [Google Scholar] [CrossRef] [PubMed] [Green Version]
  34. Si, S.L.; You, X.Y.; Liu, H.C.; Huang, J. Identifying Key Performance Indicators for Holistic Hospital Management with a Modified DEMATEL Approach. Int. J. Environ. Res. Public Health 2017, 14, 934. [Google Scholar] [CrossRef] [PubMed]
  35. Saviano, M.; Bassano, C.; Calabrese, M. A VSA-SS Approach to Healthcare Service Systems. The Triple Target of Efficiency, Effectiveness and Sustainability. Serv. Sci. 2018, 2, 41–61. [Google Scholar] [CrossRef]
  36. Mutingi, M.; Mbohwa, C. Understanding sustainability in healthcare systems: A systems thinking perspective. In Proceedings of the 2014 IEEE International Conference on Industrial Engineering and Engineering Management, Bandar Sunway, Malaysia, 9–12 December 2014; ISBN 978-1-4799-6410-9. [Google Scholar] [CrossRef]
  37. Fineberg, H. A Successful and Sustainable Health System—How to Get There from Here. N. Engl. J. Med. 2012, 366, 1020–1027. [Google Scholar] [CrossRef] [PubMed]
  38. Freudenberg, M. Composite Indicators of Country Performance: A Critical Assessment; OECD STI Working Paper DSTI/DOC 2003/16; OECD: Paris, France, 2003. [Google Scholar]
  39. Smith, P.C. Developing Composite Indicators for Assessing Health System Efficiency; Center of Health Economics, University of York: York, UK, 2002. [Google Scholar]
  40. OECD & Joint Research Centre. Handbook on Constructing Composite Indicators: Methodology and User Guide; OECD & Joint Research Centre, OECD: Paris, France, 2008; Available online: http://ictlogy.net/bibliography/reports/projects.php?idp=2308 (accessed on 29 July 2018).
  41. Jacobs, R.; Smith, P.; Goddard, M. Measuring Performance: An Examination of Composite Performance Indicators; Centre for Health Economics Technical Paper Series 29; Centre for Health Economics: York, UK, 2004. [Google Scholar]
  42. Eurostat. Database. Available online: http://ec.europa.eu/eurostat/data/database (accessed on 2 June 2018).
  43. United Nations. Sustainable Development Knowledge Platform; United Nations. 2017. Available online: https://sustainabledevelopment.un.org/sdg3 (accessed on 2 June 2018).
  44. Vuong, Q.-H. Data Descriptor: Survey data on Vietnamese propensity to attend periodic general health Examinations. Sci. Data 2017, 4, 170142. [Google Scholar] [CrossRef] [PubMed]
  45. International Labour Office. Estimating the Economic Costs of Occupational Injuries and Illnesses in Developing Countries: Essential Information for Decision-Makers; International Labour Organization: Geneva, Switzerland, 2012; Available online: https://www.ilo.org/wcmsp5/groups/public/---ed_protect/---protrav/---safework/documents/publication/wcms_207690.pdf (accessed on 24 August 2018).
  46. International Labour Organization. Safety and health at work: A vision for sustainable prevention. In Proceedings of the 20th World Congress on Safety and Health at Work: Global Forum for Prevention, Frankfurt, Germany, 24–27 August 2014; Available online: https://www.ilo.org/wcmsp5/groups/public/---ed_protect/---protrav/---safework/documents/publication/wcms_301214.pdf (accessed on 24 August 2018).
  47. Joint Research Centre. State of the Art Report on Current Methodologies and Practices for Composite Indicator Development; The Applied Statistics Group, Institute for the Protection and Security of the Citizen, European Commission: Brussels, Belgium, 2002. [Google Scholar]
  48. Kaiser, H.F.; Rice, J. Little Jiffy, Mark IV. Educ. Psychol. Meas. 1974, 34, 111–117. [Google Scholar] [CrossRef]
  49. Davidescu, A.A.; Vass Paul, A.M.; Gogonea, R.M.; Zaharia, M. Evaluating Romanian Eco-Innovation Performances in European Context. Sustainability 2015, 7, 12723–12757. [Google Scholar] [CrossRef] [Green Version]
  50. European Commission. The 2018 Ageing Report—Underlying Assumptions & Projection Methodologies; Institutional Paper 065; European Commission: Brussels, Belgium, 2017. [Google Scholar]
  51. Grigorescu, A.; Condrea, E.; Bradley, C.D.F. Quality Management in Healthcare Systems. Ovidius Univ. Ann. Ser. Econ. Sci. 2015, 15, 246–251. [Google Scholar]
  52. Caplescu, R.; Mihaescu, C.; Begu, L. Labour force indicators and fertility in Romania. A macro-level analysis for 2000–2010. Econ. Comput. Econ. Cybern. Stud. Res. 2013, 47, 129–146. [Google Scholar]
  53. Jaba, E.; Chirianu, I.A.; Balan, C.B.; Robu, I.B.; Roman, M.D. The analysis of the effect of women’s articipation in the labor market on fertility in European Union countries using welfare state models. Econ. Comput. Econ. Cybern. Stud. Res. 2016, 50, 69–84. [Google Scholar]
  54. OECD. Fiscal Sustainability of Health Systems: Bridging Health and Finance Perspectives; OECD Publishing: Paris, France, 2015. [Google Scholar]
  55. Evans, D.B.; Tandon, A.; Murray, C.J.; Lauer, J.A. Comparative efficiency of national health systems: Cross national econometric analysis. BMJ 2001, 323, 307–310. [Google Scholar] [CrossRef] [PubMed]
  56. Schieber, G.; Baeza, C.; Kress, D.; Maier, M. Financing health systems in the 21st century. Dis. Control Prior. Dev. Ctries. 2006, 225–242. [Google Scholar]
  57. Eurostat Metadata—Health Care Expenditures. Available online: http://ec.europa.eu/eurostat/cache/metadata/en/hlth_sha11_esms.htm (accessed on 20 June 2018).
  58. Smith, S.M.; Gibson, C.M. Industrial diversification in nonmetropolitan counties and its effect on economic stability. West. J. Agric. Econ. 1988, 13, 193–201. [Google Scholar]
  59. Hackbart, M.M.; Anderson, D.A. On measuring economic diversification. Land Econ. 1975, 51, 374–378. [Google Scholar] [CrossRef]
  60. Khem, R.S. Measuring Economic Diversification in Hawaii; Research and Economic Analysis Division Department of Business, Economic Development and Tourism, State of Hawaii. 2008. Available online: http://files.hawaii.gov/dbedt/economic/data_reports/EconDiversification/Economic_Diversification_Report_Final%203-7-08.pdf (accessed on 23 August 2018).
  61. Eurostat Metadata—Duration of Working Life. Available online: http://ec.europa.eu/eurostat/cache/metadata/en/lfsi_dwl_a_esms.htm (accessed on 20 June 2018).
  62. Nenadic, O.; Greenacre, M. Correspondence analysis in R, with two-and three-dimensional graphics: The ca package. J. Stat. Softw. 2007, 20. [Google Scholar] [CrossRef]
  63. Blasius, J.; Greenacre, M. (Eds.) Visualization and Verbalization of Data; CRC Press: Boca Raton, FL, USA, 2014. [Google Scholar]
Figure 1. Hierarchy of the EU countries based on the percentage Health Index, 2015. Source: authors’ computation.
Sustainability 10 03186 g001
Figure 2. Health systems performance. Source: authors’ computation.
Sustainability 10 03186 g002
Figure 3. The correspondence between the inputs and outputs of the health systems. HI = categorical variable built upon Health Index; DWL = categorical variable built upon Duration of working life indicator; HE = categorical variable built upon Health expenditures (%GDP) data; EHHSW = categorical variable built upon Employment in human health and social work activities variable; Entropy = categorical variable built upon entropy index computed using the shares of different financing mechanisms. Source: authors’ computation.
Sustainability 10 03186 g003
Table 1. Main arguments in favor and against using composite index.
ProsCons
Offers a 360 degree view in assessing performance
Emphasizes performance on policy making procedures
Enables system efficiency analysis
Facilitates public communication and promote accountability
Highlights the best-performing organizations and institutions and pinpoints organizations that may need improvements
Stimulates the search for improving analytical methods and data quality
Presents the ‘big picture’ overview and proves easier to interpret in contrast to trying to identify common trends for many separate indicators
Hides serious malfunctions in some parts of the system because of aggregation
Difficulty in determining the source of performance lagging and where the focusing effort should be placed
Relying on poor data quality may prove too risky for certain indicators that aim for wide area coverage comprehensiveness
Individual measures taken to improve performance, based on composite indicators, are always a subject of dispute
Ignoring performance related measures, due to difficult quantification, is often a practice prone to show a distorted reality view
The methods by which weights are decided upon are unlikely to be straightforward from the very beginning of any study.
Source: authors’ contribution.
Table 2. Main indicators considered in the Composite Health Index.
Health Status IndicatorsMedical Service Supply Indicators Health Indicators Related to Labor Market
Maternal mortality ratioMedical doctors per 100,000 inhabitantsIncidence rate of fatal accidents at work
Infant mortality rateNurses and midwives per 100,000 inhabitants
Under-five mortality rate **Dentists per 100,000 inhabitants
Neonatal mortality rate **Physiotherapists per 100,000 inhabitants *
Tuberculosis incidence per 1000 populationPharmacists per 100,000 inhabitants *
Mortality rate attributed to cardiovascular disease, cancer, diabetes or chronic respiratory diseaseSelf-reported unmet needs for medical examination (too expensive)
Prevalence of tobacco use among persons aged 15 years and older
Life expectancy **
Total fertility rate
* was not used in the principal components analysis (PCA) due to incomplete data. ** was not used in the PCA due to multicollinearity reasons. Source: authors’ selection based on Eurostat and the Sustainable Development Knowledge Platform.
Table 3. The rotated matrix of the principal components.
PC InterpretationHealth IndicatorComponent
123
PC1—Mortality rates at birth, by types of diseases or by fatal work accidentsZscore(Maternal _mortality)0.912−0.083−0.073
Zscore(Infant_mortality)0.8080.297−0.060
Zscore(CCDC_mortality)0.7590.363−0.097
Zscore(Fatal_work_accidents)0.7560.1150.021
Zscore(TB_incidence)0.903−0.0740.106
PC2—Population fertility, tobacco use and nurses available to ensure adequate care.Zscore(Tobacco_use)0.2560.6650.387
Zscore(Fertility_rate)0.152−0.807−0.049
Zscore(Nurses)−0.325−0.844−0.126
PC3—Supply level and accessibility of medical servicesZscore(Unmet_medical needs)0.4770.3560.505
Zscore(Medical_doctors)−0.2980.1240.821
Zscore(Dentists)0.0610.0960.876
Extraction Method: Principal Component Analysis. Rotation Method: Varimax with Kaiser Normalization.
a. Rotation converged in 5 iterations.
where CCDC stands for cardiovascular disease, cancer, diabetes or chronic respiratory disease and TB stands for Tuberculosis. Source: authors’ computation.

