New Market Opportunities and Consumer Heterogeneity in the U.S. Organic Food Market
Abstract
1. Introduction
2. Data
3. The Empirical Model
4. Results
4.1. Comparison with the Previous Findings
4.2. Robustness Tests
5. Conclusions
Author Contributions
Funding
Acknowledgments
Conflicts of Interest
Appendix A
| Ranking | State | Income Per Capita | Median Household Income | Group |
|---|---|---|---|---|
| 1 | Maryland | 36,338 | 73,971 | 1 |
| 2 | Massachusetts | 36,593 | 71,919 | 1 |
| 3 | District of Columbia | 45,877 | 71,648 | 1 |
| 4 | Alaska | 33,062 | 71,583 | 1 |
| 5 | Connecticut | 39,373 | 70,048 | 1 |
| 6 | Hawaii | 29,736 | 69,592 | 1 |
| 7 | New Jersey | 37,288 | 69,160 | 1 |
| 8 | New Hampshire | 34,691 | 66,532 | 1 |
| 9 | Virginia | 34,052 | 64,902 | 1 |
| 10 | California | 30,441 | 61,933 | 1 |
| 11 | Minnesota | 32,638 | 61,481 | 1 |
| 12 | Washington | 31,841 | 61,366 | 2 |
| 13 | Colorado | 32,357 | 61,303 | 2 |
| 14 | Utah | 24,877 | 60,922 | 2 |
| 15 | Delaware | 30,488 | 59,716 | 2 |
| 16 | North Dakota | 33,071 | 59,029 | 2 |
| 17 | New York | 33,095 | 58,878 | 2 |
| 18 | Illinois | 30,417 | 57,444 | 2 |
| 19 | Wyoming | 29,698 | 57,055 | 2 |
| 20 | Rhode Island | 30,830 | 54,891 | 2 |
| 21 | Vermont | 29,178 | 54,166 | 2 |
| 22 | Iowa | 28,361 | 53,712 | 2 |
| 23 | Pennsylvania | 29,220 | 53,234 | 3 |
| 24 | Texas | 27,125 | 53,035 | 3 |
| 25 | Nebraska | 27,446 | 52,686 | 3 |
| 26 | Wisconsin | 28,213 | 52,622 | 3 |
| 27 | Kansas | 27,870 | 52,504 | 3 |
| 28 | Nevada | 25,773 | 51,450 | 3 |
| 29 | Oregon | 27,646 | 51,075 | 3 |
| 30 | South Dakota | 26,959 | 50,979 | 3 |
| 31 | Arizona | 25,715 | 50,068 | 3 |
| 32 | Michigan | 26,613 | 49,847 | 3 |
| 33 | Maine | 27,978 | 49,462 | 3 |
| 34 | Indiana | 25,140 | 49,446 | 3 |
| 35 | Georgia | 25,615 | 49,321 | 3 |
| 36 | Ohio | 26,937 | 49,308 | 3 |
| 37 | Missouri | 26,126 | 48,363 | 3 |
| 38 | Idaho | 23,938 | 47,861 | 4 |
| 39 | Oklahoma | 25,229 | 47,529 | 4 |
| 40 | Florida | 26,582 | 47,463 | 4 |
| 41 | North Carolina | 25,774 | 46,556 | 4 |
| 42 | Montana | 25,989 | 46,328 | 4 |
| 43 | South Carolina | 24,596 | 45,238 | 4 |
| 44 | New Mexico | 23,683 | 44,803 | 4 |
| 45 | Louisiana | 24,800 | 44,555 | 4 |
| 46 | Tennessee | 24,922 | 44,361 | 4 |
| 47 | Kentucky | 23,684 | 42,958 | 4 |
| 48 | Alabama | 23,606 | 42,830 | 4 |
| 49 | Arkansas | 22,883 | 41,262 | 4 |
| 50 | West Virginia | 22,714 | 41,059 | 4 |
| 51 | Mississippi | 21,036 | 39,680 | 4 |
| Median | United States | 28,889 | 53,657 |
References
- Chinnici, G.; D’Amico, M.; Pecorino, B. A Multivariate Statistical Analysis on the Consumers of Organic Products. Br. Food J. 2002, 104, 187–199. [Google Scholar] [CrossRef]
- Hughner, R.S.; McDonagh, P.; Prothero, A.; Shultz, C.J., II; Stanton, J. Who Are Organic Food Consumers? A Compilation and Review of Why People Purchase Organic Food. J. Consum. Behav. 2007, 6, 94–110. [Google Scholar] [CrossRef]
- Schifferstein, H.N.J.; Peter, A.M. Oude Ophuis. Health-Related Determinants of Organic Food Consumption in The Netherlands. Food Qual. Pref. 1998, 9, 119–133. [Google Scholar] [CrossRef]
- Zanoli, R.; Naspetti, S. Consumer Motivations in the Purchase of Organic Food: A Means-End Approach. Br. Food J. 2002, 104, 643–653. [Google Scholar] [CrossRef]
- Baker, S.; Thompson, K.E.; Engelken, J.; Huntley, K. Mapping the Values Driving Organic Food Choice: Germany vs the UK. Eur. J. Mark. 2004, 38, 995–1012. [Google Scholar] [CrossRef]
- Hill, H.; Lynchehaun, F. Organic Milk: Attitudes and Consumption Patterns. Br. Food J. 2002, 104, 526–542. [Google Scholar] [CrossRef]
- Lockie, S.; Lyons, K.; Lawrence, G.; Grice, J. Choosing Organics: A Path Analysis of Factors Underlying the Selection of Organic Food among Australian Consumers. Appetite 2004, 43, 135–146. [Google Scholar] [CrossRef] [PubMed]
- Rana, J.; Paul, J. Consumer Behavior and Purchase Intention for Organic Food: A Review and Research Agenda. J. Retailing Consum. Serv. 2017, 38, 157–165. [Google Scholar] [CrossRef]
- Baldi, I.; Filleul, L.; Mohammed-Brahim, B.; Fabrigoule, C.; Dartigues, J.; Schwall, S.; Drevet, J.; Salamon, R.; Brochard, P. Neuropsychologic Effects of Long-Term Exposure to Pesticides: Results from the French Phytoner Study. Environ. Health Perspect. 2001, 109, 839–844. [Google Scholar] [CrossRef] [PubMed]
- Boockmann, B.; Fries, J.; Göbel, C. Specific Measures for Older Employees and Late Career Employment. 2012. Available online: https://papers.ssrn.com/abstract=2159817 (accessed on 31 May 2017).
- Rivas, A.; Cerrillo, I.; Granada, A.; Mariscal-Arcas, M.; Olea-Serrano, F. Pesticide Exposure of Two Age Groups of Women and Its Relationship with Their Diet. Sci. Total Environ. 2007, 382, 14–21. [Google Scholar] [CrossRef] [PubMed]
- Bryła, P. Organic food consumption in Poland: Motives and barriers. Appetite 2016, 105, 737–746. [Google Scholar] [CrossRef] [PubMed]
- Chryssochoidis, G.M. Testing and Validating the LOV Scale of Values in an Organic-Food-Purchase-Context. In World Scientific Book Chapters; World Scientific Publishing Co. Pte. Ltd.: Singapore, 2004; pp. 291–301. Available online: https://ideas.repec.org/h/wsi/wschap/9789812796622_0018.html (accessed on 1 May 2018).
- Lea, E.; Worsley, T. Australians’ Organic Food Beliefs, Demographics and Values. Br. Food J. 2005, 107, 855–869. [Google Scholar] [CrossRef]
- Fillion, L.; Arazi, S. Does Organic Food Taste Better? A Claim Substantiation Approach. Nutr. Food Sci. 2002, 32, 153–157. [Google Scholar] [CrossRef]
- Bryła, P. The perception of EU quality signs for origin and organic food products among Polish consumers. Qual. Assur. Saf. Crops Foods 2017, 9, 345–355. [Google Scholar] [CrossRef]
- Lucas, M.R.; Röhrich, K.; Marreiros, C.; Fragoso, R.; Kabbert, R.; Clara, A.M.; Martins, I.; Böhm, S. Quality, Safety and Consumer Behaviour towards Organic Food; CEFAGE-UE Working Paper 5; CEFAGE-UE: Évora, Portugal, 2008. [Google Scholar]
- Beckmann, S.C.; Brokmose, S.; Lind, R.L. Danske Forbrugere og Økologiske Fødevarer: ØKO Foods II Projektet; Handelshøjskolens Forlag: Oslo, Norway, 2001. [Google Scholar]
- Durham, C. Organic Purchase Dedication: A Fractional Probit Model. Agric. Resour. Econ. Rev. 2007, 36, 304–320. [Google Scholar] [CrossRef]
- Grunert, S.C.; Kristensen, K. Den Danske Forbruger og Økologiske Fødevarer; Institut for Informationsbehandling, Handelshøjskolen i Århus: Aarhus, Denmark, 1992. [Google Scholar]
- Li, J.; Zepeda, L.; Gould, B.W. The Demand for Organic Food in the U.S.: An Empirical Assessment. J. Food Distrib. Res. 2007, 38, 1–16. [Google Scholar]
- Chen, B.; Saghaian, S.; Zheng, Y. Organic Labelling, Private Label, and US Household Demand for Fluid Milk. Appl. Econ. 2018, 50, 3039–3050. [Google Scholar] [CrossRef]
- Dimitri, C.; Dettmann, R.L. Organic Food Consumers: What Do We Really Know about Them? Br. Food J. 2012, 114, 1157–1183. [Google Scholar] [CrossRef]
- Jörgensen, C. Prisbildning Och Efterfrågan På Ekologiska Livsmedel; Livsmedelsekonomiska Institutet (SLI): Stockholm, Sweden, 2001. [Google Scholar]
- Menghi, A. Consumer Response to Ecological Milk in Sweden; Examensarbete-SLU; Institutionen Foer Ekonomi: Uppsala, Sweden, 1997. [Google Scholar]
- Cicia, G.; del Giudice, T.; Scarpa, R. Consumers’ Perception of Quality in Organic Food: A Random Utility Model under Preference Heterogeneity and Choice Correlation from Rank-Orderings. Br. Food J. 2002, 104, 200–213. [Google Scholar] [CrossRef]
- Thiele, S.; Weiss, C. Consumer Demand for Food Diversity: Evidence for Germany. Food Policy 2003, 28, 99–115. [Google Scholar] [CrossRef]
- Alviola, P.A.; Capps, O. Household Demand Analysis of Organic and Conventional Fluid Milk in the United States Based on the Nielsen Homescan Panel. Agribusiness 2010, 26, 369–388. [Google Scholar] [CrossRef]
- Smed, S. Information and consumer perception of the “organic” attribute in fresh fruits and vegetables. Agric. Econ. 2012, 43, 33–48. [Google Scholar] [CrossRef]
- Zhang, F.; Huang, C.L.; Lin, B.H.; Epperson, J.E. Modeling fresh organic produce consumption with scanner data: A generalized double hurdle model approach. Agribusiness 2008, 24, 510–522. [Google Scholar] [CrossRef]
- Gifford, K.; Bernard, J.C. The Impact of Message Framing on Organic Food Purchase Likelihood. J. Food Distrib. Res. 2004, 35, 19–28. [Google Scholar]
- Krystallis, A.; Chryssohoidis, G. Consumers’ Willingness to Pay for Organic Food: Factors That Affect It and Variation per Organic Product Type. Br. Food J. 2005, 107, 320–343. [Google Scholar] [CrossRef]
- Grunert, K.G. Current Issues in the Understanding of Consumer Food Choice. Trends Food Sci. Technol. 2002, 8, 275–285. [Google Scholar] [CrossRef]
- LaBarbera, P.A.; Mazursky, D. A Longitudinal Assessment of Consumer Satisfaction/Dissatisfaction: The Dynamic Aspect of the Cognitive Process. J. Mark. Res. 1983, 20, 393–404. [Google Scholar] [CrossRef]
- Von Meyer-Höfer, M.; Olea-Jaik, E.; Padilla-Bravo, C.A.; Spiller, A. Mature and Emerging Organic Markets: Modelling Consumer Attitude and Behaviour with Partial Least Square Approach. J. Food Prod. Mark. 2015, 21, 626–653. [Google Scholar] [CrossRef]
- Davies, A.; Titterington, A.J.; Cochrane, C. Who Buys Organic Food: A Profile of the Purchasers of Organic Food in Northern Ireland. Br. Food J. 1995, 97, 17–23. [Google Scholar] [CrossRef]
- Yiridoe, E.K.; Bonti-Ankomah, S.; Martin, R.C. Comparison of Consumer Perceptions and Preference toward Organic versus Conventionally Produced Foods: A Review and Update of the Literature. Renew. Agric. Food Syst. 2005, 20, 193–205. [Google Scholar] [CrossRef]
- Nasir, V.A.; Karakaya, F. Consumer Segments in Organic Foods Market. J. Consum. Mark. 2014, 31, 263–277. [Google Scholar] [CrossRef]
- Onyango, B.M.; Hallman, W.K.; Bellows, A.C. Purchasing Organic Food in US Food Systems: A Study of Attitudes and Practice. Br. Food J. 2007, 109, 399–411. [Google Scholar] [CrossRef]
- Roitner-Schobesberger, B.; Darnhofer, I.; Somsook, S.; Vogl, C.R. Consumer Perceptions of Organic Foods in Bangkok, Thailand. Food Policy 2008, 33, 112–121. [Google Scholar] [CrossRef]
- Zepeda, L.; Li, J. Characteristics of Organic Food Shoppers. J. Agric. Appl. Econ. 2007, 39, 17–28. [Google Scholar] [CrossRef]
- Thompson, G.D. Consumer Demand for Organic Foods: What We Know and What We Need to Know. Am. J. Agric. Econ. 1998, 80, 1113–1118. [Google Scholar] [CrossRef]
- Groff, A.J.; Kreider, C.R.; Toensmeyer, U.C. Analysis of the Delaware Market for Organically Grown Produce. J. Food Distrib. Res. 1993, 24, 118–126. [Google Scholar]
- Dynan, K.E. Habit Formation in Consumer Preferences: Evidence from Panel Data. Am. Econ. Rev. 2000, 90, 391–406. [Google Scholar] [CrossRef]
- Fuhrer, J.C. Habit Formation in Consumption and Its Implications for Monetary-Policy Models. Am. Econ. Rev. 2000, 90, 367–390. [Google Scholar] [CrossRef]
- Grilli, L.; Rampichini, C. Selection Bias in Linear Mixed Models. Metron Int. J. Stat. 2010, 68, 309–329. [Google Scholar] [CrossRef]
- Shieh, Y.-Y.; Fouladi, R.T. The Effect of Multicollinearity on Multilevel Modeling Parameter Estimates and Standard Errors. Educ. Psychol. Meas. 2003, 63, 951–985. [Google Scholar] [CrossRef]
- Kim, G.; Schieffer, J.; Mark, T. Do Superfund Sites Affect Local Property Values? Evidence from a Spatial Hedonic Approach; Agricultural and Applied Economics Association: Washington, DC, USA, 2016; Available online: http://ageconsearch.umn.edu/bitstream/235835/2/Revised%202016%20AAEA%20Paper%20(GwanSeon%20Kim).pdf (accessed on 1 March 2017).
- Steenbergen, M.R.; Jones, B.S. Modeling Multilevel Data Structures: EBSCOhost. Am. J. Political Sci. 2002, 46, 218–237. [Google Scholar] [CrossRef]
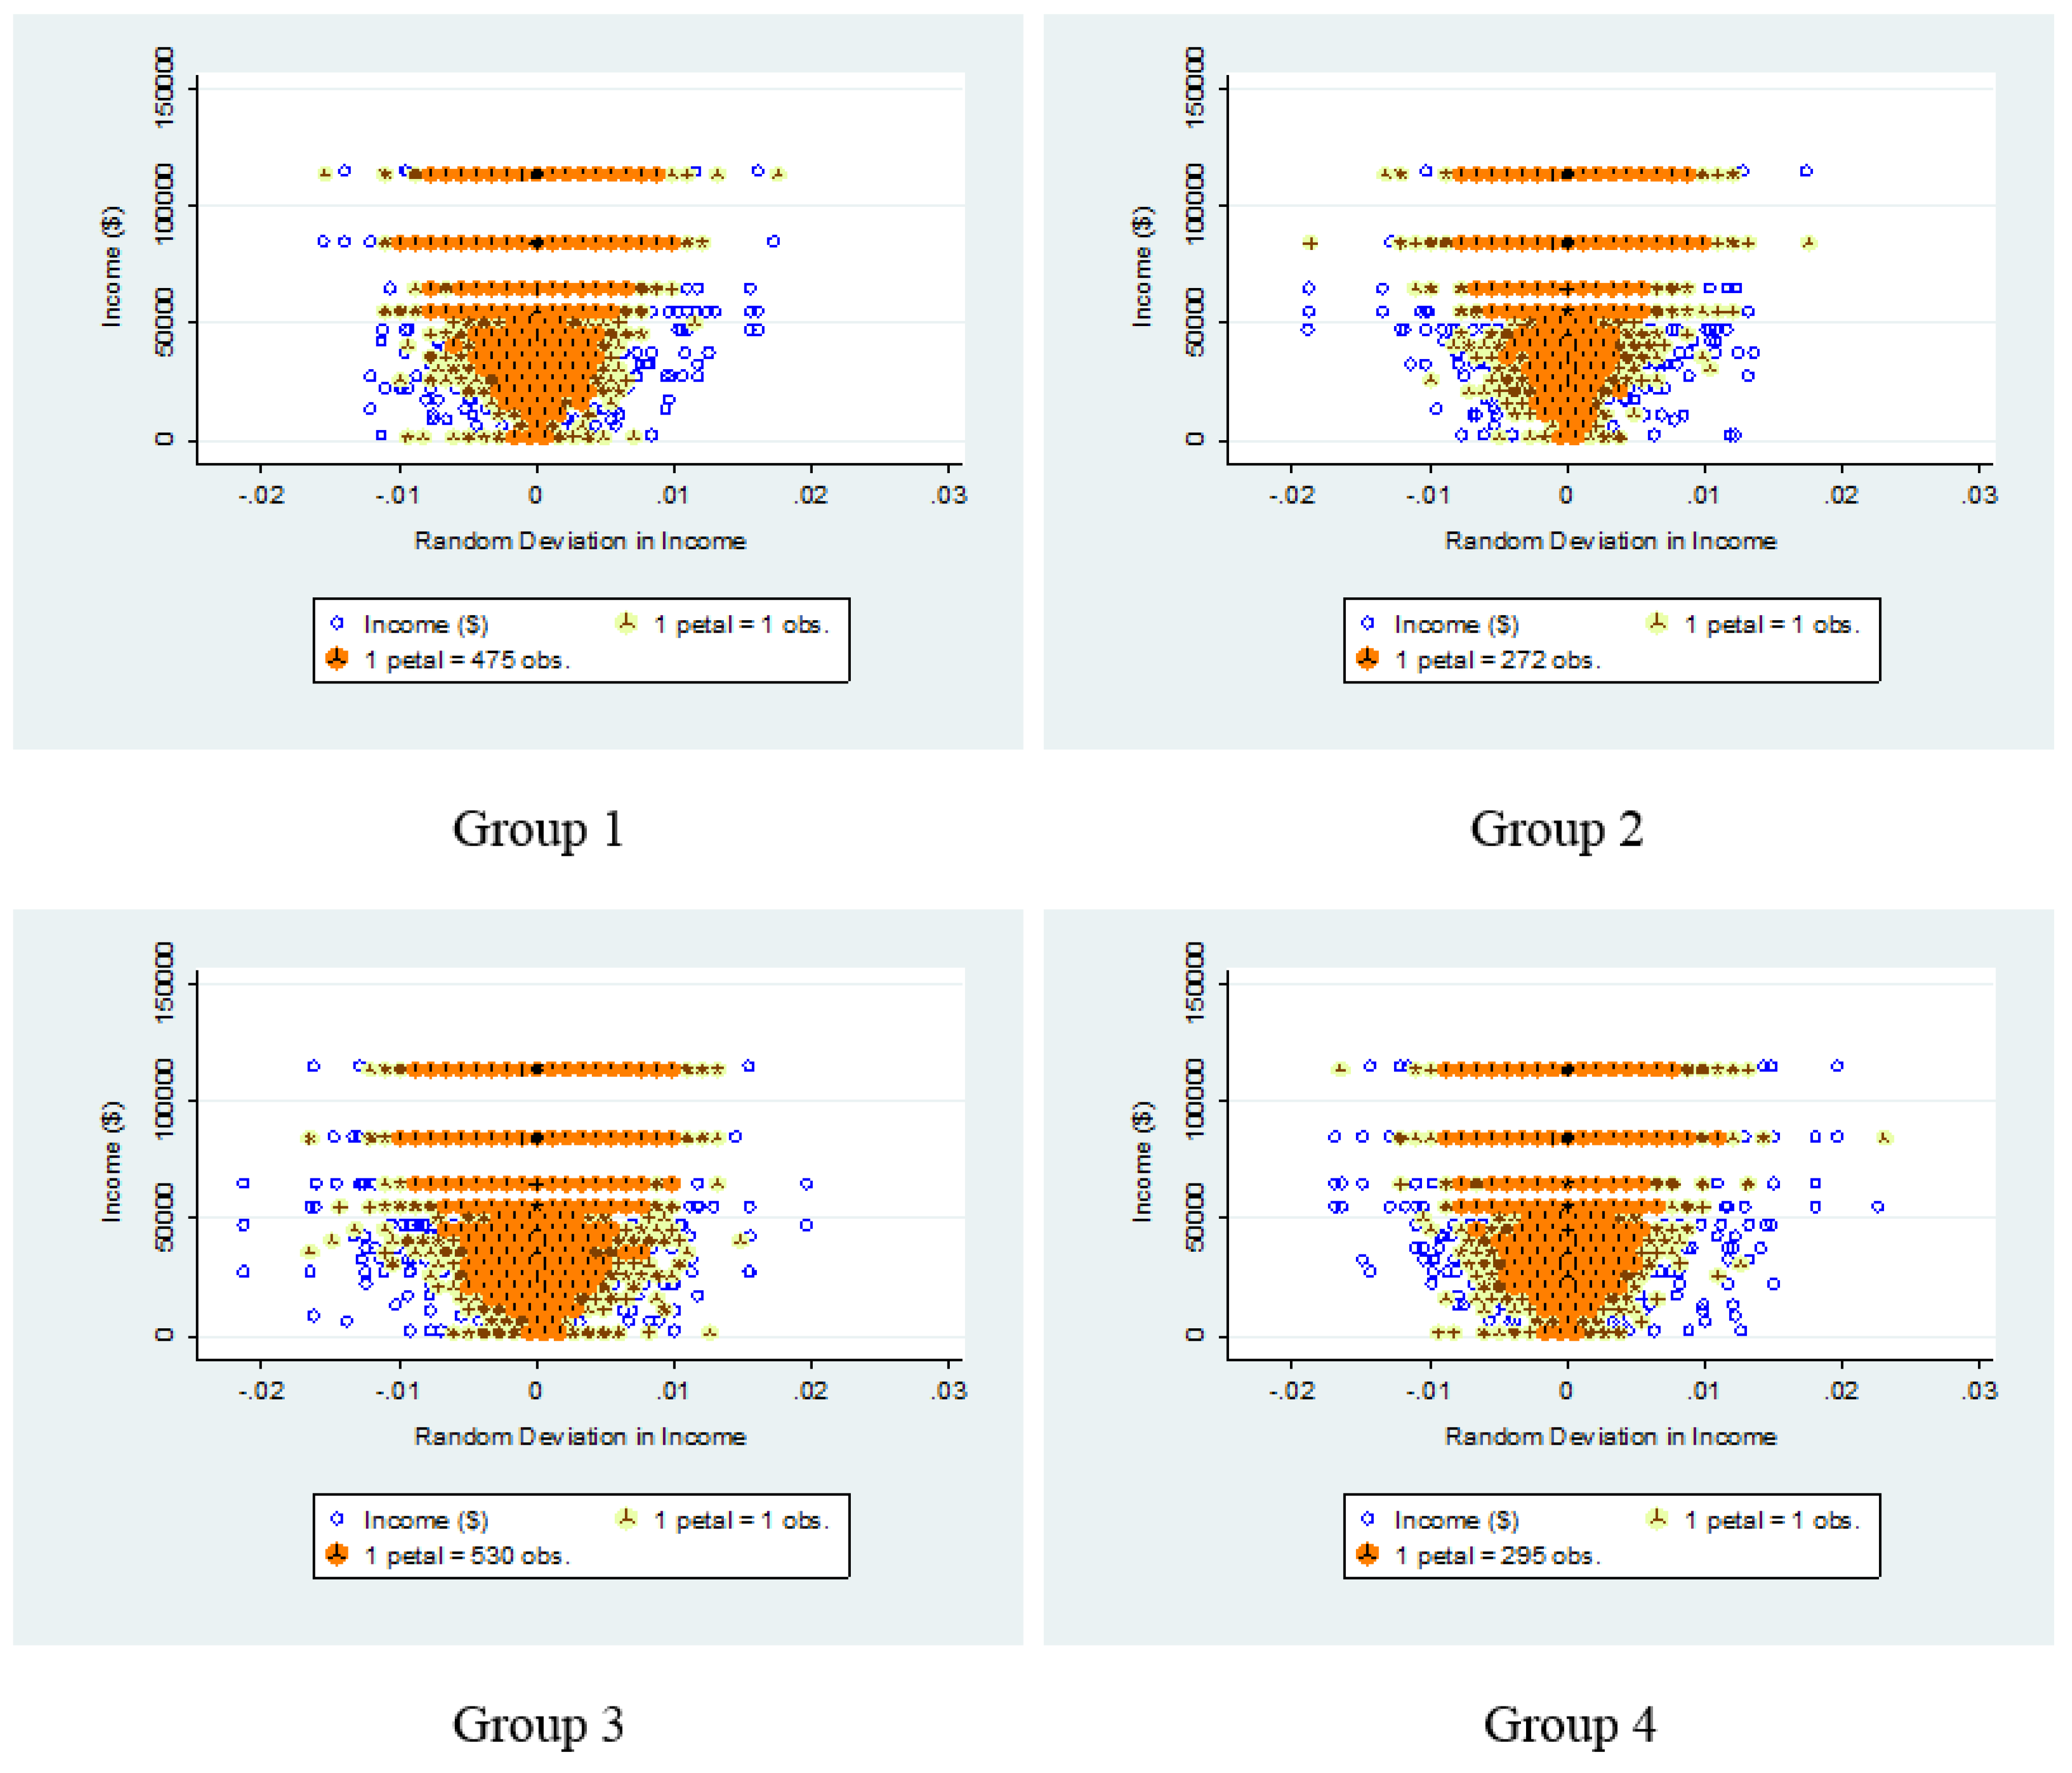
- Dupont, W.D.; Plummer, W.D., Jr. Density Distribution Sunflower Plots in Stata 8. In Proceedings of the 3rd North American Stata Users Group Meeting, Boston, MA, USA, 23–24 August 2004. [Google Scholar]
- Díaz, F.J.M.; Pleite, F.M.-C.; Paz, J.M.M.; García, P.G. Consumer Knowledge, Consumption, and Willingness to Pay for Organic Tomatoes. Br. Food J. 2012, 114, 318–334. [Google Scholar] [CrossRef]
- Dimitri, C.; Venezia, K.M. Retail and Consumer Aspects of the Organic Milk Market; USDA: Washington, DC, USA, 2007.
- Sandalidou, E.; Baourakis, G.; Siskos, Y. Customers’ Perspectives on the Quality of Organic Olive Oil in Greece: A Satisfaction Evaluation Approach. Br. Food J. 2002, 104, 391–406. [Google Scholar] [CrossRef]
- Yue, C.; Grebitus, C.; Bruhn, M.; Jensen, H.H. Potato Marketing–Factors Affecting Organic and Conventional Potato Consumption Patterns. In Proceedings of the 12th Congress of the European Association of Agricultural Economists–EAAE, Ghent, Belgium, 26–29 August 2008; Available online: http://ageconsearch.umn.edu/bitstream/43948/2/149.pdf (accessed on 1 August 2017).
- Detre, J.D.; Mark, T.B.; Clark, B.M. Understanding Why College-Educated Millennials Shop at Farmers’ Markets: An Analysis of Students at Louisiana State University. J. Food Distrib. Res. 2010, 41, 14–24. [Google Scholar]
- Govindasamy, R.; DeCongelio, M.; Italia, J.; Barbour, B.; Anderson, K. Empirically Evaluating Consumer Characteristics and Satisfaction with Organic Products. New Jersey Agricultural Experiment Station P-02139-1-01. 2001. Available online: http://ageconsearch.tind.io/record/36736/files/pa010101.pdf (accessed on 1 May 2017).
| Variable | Type | Description | Mean | Std. Dev | Exp. Sign |
|---|---|---|---|---|---|
| Expenditure | Continuous | Total annual organic expenditure (in logs) | 3.09 | 1.52 | |
| Income | Continuous | Average annual income (in thousands) | 70.38 | 31.41 | + |
| Black | Binary | 1 if HH is Black/African American; 0 otherwise | 0.07 | 0.25 | − |
| Asian | Binary | 1 if HH is Asian; 0 otherwise | 0.04 | 0.20 | − |
| Other | Binary | 1 if HH is Other; 0 otherwise | 0.05 | 0.21 | − |
| Household Size | Continuous | Number of individuals residing in the home | 2.87 | 1.19 | + |
| College | Binary | 1 if education level of HH is some college; 0 otherwise | 0.30 | 0.46 | + |
| Graduate | Binary | 1 if education level of HH is college or post-college graduate; 0 otherwise | 0.44 | 0.50 | + |
| Age1 | Binary | 1 if age of HH is between 30 and 49; 0 otherwise | 0.35 | 0.48 | +/− |
| Age2 | Binary | 1 if age of HH is between 50 and over 65; 0 otherwise | 0.63 | 0.48 | +/− |
| Children6 | Binary | 1 if HH has children with less than age 6; 0 otherwise | 0.04 | 0.20 | + |
| Middle Atlantic | Binary | 1 if region is Middle Atlantic; 0 otherwise | 0.13 | 0.33 | +/− |
| East North | Binary | 1 if region is East North Central; 0 otherwise | 0.18 | 0.38 | +/− |
| West North | Binary | 1 if region is West North Central; 0 otherwise | 0.08 | 0.27 | +/− |
| South Atlantic | Binary | 1 if region is South Atlantic Central; 0 otherwise | 0.20 | 0.40 | +/− |
| East South | Binary | 1 if region is East South Central; 0 otherwise | 0.06 | 0.23 | +/− |
| West South | Binary | 1 if region is West South Central; 0 otherwise | 0.10 | 0.30 | +/− |
| Mountain | Binary | 1 if region is Mountain; 0 otherwise | 0.08 | 0.27 | +/− |
| Pacific | Binary | 1 if region is Pacific; 0 otherwise | 0.13 | 0.34 | +/− |
| Married | Binary | 1 if HH is married; 0 otherwise | 0.01 | 0.08 | − |
| USDA | Binary | 1 if USDA organic seal on product; 0 otherwise | 0.70 | 0.46 | + |
| Repurchase | Binary | 1 if HH consumes organic food at least one consecutive year; 0 otherwise | 0.27 | 0.45 | + |
| Without Centering | With Centering | |
|---|---|---|
| Random Effect Parameters | Estimate | Estimate |
| Constant | 1.2359 | 1.2077 |
| (0.0128) | (0.0042) | |
| Income | 0.008 | 0.009 |
| (0.0004) | (0.0005) | |
| Correlation | −0.3516 | −0.0322 |
| (0.0248) | (0.0265) | |
| Std. deviation (Residual) | 0.7315 | 0.7287 |
| (0.0017) | (0.0017) | |
| Log-Likelihood Ratio Test for Multilevel Model vs. Linear Regression | ||
| Chi-square | 80,735.42 | 82,698.12 |
| p-value | 0.0000 | 0.0000 |
| Without Centering | With Centering | |||||
|---|---|---|---|---|---|---|
| Variable | Coef. | SE | Coef. | SE | ||
| Income | 0.006 | *** | 0.0001 | − | − | |
| Centered Income | − | − | 0.001 | *** | 0.0002 | |
| Black | −0.146 | *** | 0.0200 | −0.137 | *** | 0.0202 |
| Asian | 0.201 | *** | 0.0265 | 0.234 | *** | 0.0267 |
| Others | 0.044 | ** | 0.0216 | 0.031 | * | 0.0187 |
| Household Size | 0.004 | 0.0036 | 0.009 | *** | 0.0036 | |
| College | 0.205 | *** | 0.0110 | 0.252 | *** | 0.0111 |
| Graduate | 0.396 | *** | 0.0120 | 0.503 | *** | 0.0118 |
| Age30_49 | −0.162 | *** | 0.0231 | −0.103 | *** | 0.0234 |
| Age49_over | −0.287 | *** | 0.0237 | −0.235 | *** | 0.0240 |
| Children6 | 0.235 | *** | 0.0162 | 0.227 | *** | 0.0163 |
| Middle Atlantic | −0.226 | *** | 0.0279 | −0.229 | *** | 0.0281 |
| East North | −0.401 | *** | 0.0267 | −0.434 | *** | 0.0269 |
| West North | −0.515 | *** | 0.0298 | −0.553 | *** | 0.0302 |
| South Atlantic | −0.273 | *** | 0.0263 | −0.299 | *** | 0.0265 |
| East South | −0.527 | *** | 0.0316 | −0.586 | *** | 0.0320 |
| West South | −0.334 | *** | 0.0286 | −0.355 | *** | 0.0289 |
| Mountain | 0.013 | 0.0297 | −0.025 | 0.0301 | ||
| Pacific | 0.268 | *** | 0.0279 | 0.260 | *** | 0.0282 |
| Married | 0.006 | 0.0170 | 0.045 | *** | 0.0271 | |
| USDA | 0.052 | *** | 0.0053 | 0.054 | *** | 0.0052 |
| Repurchase | 0.822 | *** | 0.0047 | 0.825 | *** | 0.0047 |
| Constant | 2.335 | *** | 0.0384 | 2.785 | *** | 0.0382 |
| Log-likelihood | −228,981.32 | −229,748.25 | ||||
| AIC | 458,014.60 | 459,548.50 | ||||
| BIC | 458,273.30 | 459,807.10 | ||||
| Observations | 154,308 | 154,308 | ||||
| Group 1 | Group 2 | Group 3 | Group 4 | |||||
|---|---|---|---|---|---|---|---|---|
| Variable | Coef. | Coef. | Coef. | Coef. | ||||
| Income | 0.0005 | 0.0008 | 0.0010 | ** | 0.0012 | ** | ||
| (0.0005) | (0.0006) | (0.0005) | (0.0006) | |||||
| Black | −0.2077 | *** | 0.0241 | −0.1343 | *** | −0.2042 | *** | |
| (0.0443) | (0.0564) | (0.0375) | (0.0413) | |||||
| Asian | 0.1002 | ** | 0.2932 | *** | 0.2374 | *** | 0.3036 | *** |
| (0.0435) | (0.0651) | (0.0573) | (0.0811) | |||||
| Others | −0.0068 | 0.1017 | ** | −0.0022 | 0.0235 | |||
| (0.0373) | (0.0482) | (0.0360) | (0.0449) | |||||
| Household Size | 0.0290 | *** | 0.0022 | 0.0080 | −0.0083 | |||
| (0.0082) | (0.0091) | (0.0065) | (0.0087) | |||||
| College | 0.2538 | *** | 0.2324 | *** | 0.2593 | *** | 0.2653 | *** |
| (0.0283) | (0.0309) | (0.0206) | (0.0255) | |||||
| Graduate | 0.5368 | *** | 0.5579 | *** | 0.5280 | *** | 0.4882 | *** |
| (0.0289) | (0.0315) | (0.0214) | (0.0266) | |||||
| Age30_49 | −0.1171 | ** | −0.0034 | −0.1072 | ** | −0.1456 | ** | |
| (0.0553) | (0.0622) | (0.0429) | (0.0572) | |||||
| Age49_over | −0.2590 | *** | −0.1470 | ** | −0.2342 | *** | −0.2922 | *** |
| (0.0566) | (0.0637) | (0.0440) | (0.0581) | |||||
| Children6 | 0.2198 | *** | 0.1765 | *** | 0.2253 | *** | 0.2836 | *** |
| (0.0374) | (0.0438) | (0.0298) | (0.0411) | |||||
| Married | −0.0037 | 0.0415 | 0.0691 | ** | −0.0006 | |||
| (0.0359) | (0.0414) | (0.0317) | (0.0410) | |||||
| USDA | 0.0476 | *** | 0.0731 | *** | 0.0564 | *** | 0.0705 | *** |
| (0.0122) | (0.0134) | (0.0096) | (0.0126) | |||||
| Repurchase | 0.7830 | *** | 0.8038 | *** | 0.8281 | *** | 0.8747 | *** |
| (0.0104) | (0.0118) | (0.0085) | (0.0116) | |||||
| Constant | 2.8581 | *** | 2.5897 | *** | 2.6130 | *** | 2.8072 | *** |
| (0.0742) | (0.1085) | (0.0926) | (0.0861) | |||||
| Log-Likelihood | −40,264.576 | −33,642.183 | −70,179.851 | −42,002.553 | ||||
| Observation | 27,423 | 22,609 | 46,616 | 27,716 | ||||
© 2018 by the authors. Licensee MDPI, Basel, Switzerland. This article is an open access article distributed under the terms and conditions of the Creative Commons Attribution (CC BY) license (http://creativecommons.org/licenses/by/4.0/).
Share and Cite
Kim, G.; Seok, J.H.; Mark, T.B. New Market Opportunities and Consumer Heterogeneity in the U.S. Organic Food Market. Sustainability 2018, 10, 3166. https://doi.org/10.3390/su10093166
Kim G, Seok JH, Mark TB. New Market Opportunities and Consumer Heterogeneity in the U.S. Organic Food Market. Sustainability. 2018; 10(9):3166. https://doi.org/10.3390/su10093166
Chicago/Turabian StyleKim, GwanSeon, Jun Ho Seok, and Tyler B. Mark. 2018. "New Market Opportunities and Consumer Heterogeneity in the U.S. Organic Food Market" Sustainability 10, no. 9: 3166. https://doi.org/10.3390/su10093166
APA StyleKim, G., Seok, J. H., & Mark, T. B. (2018). New Market Opportunities and Consumer Heterogeneity in the U.S. Organic Food Market. Sustainability, 10(9), 3166. https://doi.org/10.3390/su10093166


