Article

The Role of Community-led Governance in Innovation Diffusion: The Case of RFID Waste Pricing System in the Republic of Korea

1
Department of Public Administration, Yonsei University, Seoul 04763, Korea
2
Korea Institute of Public Affairs, Institute of Information Knowledge and Policy, Graduate School of Public Administration, Seoul National University, 1 Gwanak-ro, Gwanak-gu, Seoul 08826, Korea
*
Author to whom correspondence should be addressed.
Sustainability 2018, 10(9), 3125; https://doi.org/10.3390/su10093125
Submission received: 27 July 2018 / Revised: 15 August 2018 / Accepted: 15 August 2018 / Published: 1 September 2018

Abstract

:
This study explores the role of community-led governance in innovation adoption by drawing determinants of RFID waste pricing system adoption. The Ministry of Environment of the Republic of Korea adopted an individual-incentive based RFID waste pricing system for apartment complexes in 2013 in an effort to reduce food waste. After invention and wide usage during World War Two, RFID has received lots of intention especially in public policy field. This innovative system using RFID machines and RFID tag-embedded cards showed effectiveness in waste reduction. Residents of each apartment complex decide whether and when to adopt the RFID system. Based on innovation diffusion theory, we would like to draw which determinant factors most affect RFID pricing system adoption. Although innovation diffusion is dependent on community level, many previous studies surveyed individuals and asked them about organizational adoption. We use non-perceptional data representing the characteristics of the level of apartment complex. This study, relying on ecological variables collected from 2018 apartment complexes across 25 autonomous districts located in Seoul City, explores significant factors related to the process of the RFID adoption. According to the empirical results, there were two important determinants: how much information the government provided, and how the apartment complex residents have opportunity to gather opinion and decide the RFID pricing system adoption. We emphasize the importance of community-led governance in adopting an innovative environmental system and how community-led governance contributes to sustainable innovation adoption.

1. Introduction

This study attempts to identify the relevant determinants of the adoption of the RFID (radio frequency identification) household waste-charging system in 2081 apartment complexes located in Seoul City. More specifically, we researched the adoption behavior of each apartment complex from January 2013 to October 2015 and ran a logistic regression analysis and survival analysis. We set the apartment complex as the unit of analysis for several reasons. Firstly, in Korea, the central and local government have handed over the authority of deciding whether to adopt RFID to the local residents of the apartment complexes; the residents have the right to choose how and when to adopt the RFID technology. Secondly, as Choi and Chang [1] pointed out, the apartment complex is the most popular regional community in the modern society. The definition of community, “a social organization that shares an emotional bond of common goals and values based on a certain region as a physical space”, [2] and organization, “a group of people working together to pursue a goal”, suggests to us the potential of using the apartment complex as the unit of organization.
Previous studies focused mainly on analyzing the effect of the adoption of new technology on the individual limiting the ability to capture the influence of regional-level characteristics beyond individual variables. Previous research on individual-based innovation diffusion has limitations to effectively reveal ecological factors of community-based innovation beyond the effects of individual factors. By focusing on the adoption behavior of residents of apartment complexes, we can identify some theoretical and practical implications about how community governance and government campaigns can diffuse new technology to apartment complexes
Firstly, we attempt to rectify the individual-based limitation by setting the apartment complex as the unit of analysis. As described above, although the organization, such as the apartment complex used in this study, is the unit of policy in decision-making, previous studies set the individual as the unit of analysis. For example, previous studies used the technology–organization–environment (TOE) theory introduced by Tornatzky and Klein [3], in which analyzing the organizational behavior is the main purpose of surveying individuals to collect data. In this study, we revise the TOE model, and use the apartment complex as the unit of analysis to capture the community characteristics, including governance factors and the interaction between community and government.
Secondly, by identifying the apartment complex as a “community organization“, and using it as an analytical unit, it is possible to clarify the factors of technology adoption in the organizational unit and to suggest appropriate policy suggestions. As Morgan [4] pointed out, the organization is an “independent, living organism” that self-judges and survives through its interaction with the environment. Therefore, each organization makes decisions based on their external environment and resources [5], and therefore, organizational decision-making should be studied from an organizational point of view. As Kim [6] noted, however, if the organization, which is an actual decision-maker about policy adoption, cannot be the unit of analysis, it is impossible to explain why the behavior that is observed differs from the general expectations in policy adoption and implementation. As Billings and Wroten [7] stressed, because there is common method bias in the survey data, the correlation between two variables appears larger than its actual value. In addition, because previous studies asked survey respondents only for a conceptual definition of each variable, such as technology compatibility or organizational readiness, there is a lack of an operational definition that is necessary for the scholars who implement the hard data.
Lastly, we focus on the role of the government and community-led governance in the provision of information and innovation adoption. Previous studies based on the TOE theory failed to shed light on the role of the government, because most analyzed the behavior of the individuals who work for the market. Instead, they focused more on community governance and the role of the government. By analyzing the behavior of the apartment complex residents and local government officials simultaneously, we can suggest an impact of community governance on policy adoption and implementation. Especially, we would like to stress how community governance can play an important role in innovation adoption. We also add the variable of the total amount of information provided by the government, in order to understand the implications of the government’s role in the diffusion of innovative technology.
The structure of this paper is as follows. Firstly, we introduce a RFID-based food waste system in Seoul in the research background part, and also briefly explain the innovation adoption theory. In the research design section, we will explain the process of our study, show interview results, and introduce how we constructed the operational definition of variables and measured them based on the interview. The empirical result of the survival analysis will be shown in the empirical analysis part. In the conclusion section, we summarize the empirical results and explain the theoretical and practical implications of our study. Lastly, we mention the limitations of our study.

2. Literature Review

2.1. Research Background

After the passage of the 2013 “Prohibition of Waste Emission” law in the Republic of Korea, reducing food waste became increasingly important. The Korean government estimated that the annual food waste disposal in 2012 cost the country about 18 trillion Korean Won, corresponding to about 1.6 billion U.S. dollars. Before the 2013 food waste reform act, the Korean Ministry of Environment introduced policy reforms to reduce waste, including the Waste Deposit Refund System (1991), the Act on the Promotion of Saving and Recycling of Resources (1992), the Extended Producer Responsibility initiatives (2003), and the Mandatory Food Waste Separation Act (2005). The recent transformation of the food waste system is based on the incentive mechanism of pay-as-you-throw (PAYT), meaning that the less food waste that householders, restaurants, and other business firms generate, the less they pay.
Table 1 shows the overall trend of food waste generation in Seoul and the whole country of the Republic of Korea. Every day, Seoul generated about 2837 tons of food waste in 2012 and 609 tons in 2013. More specifically, just after adopting the reform of food waste disposal in 2013, the amount of food waste disposal decreased significantly, by approximately −4.24% in the whole country and −8.04% in Seoul (see Table 1). However, the amount of food waste disposal increased again in 2014 and 2015. Comparing the amount of the food waste disposal in the whole country in 2015 and 2016, an increasing rate of the amount of food waste disposal in Seoul is relatively lower than that that of the whole country. It appears that Seoul has been doing more to reduce food waste since the reform of food waste management.
The Ministry of Environment and the local governments in the Republic of Korea delegated authority to the residents of apartment complexes for food waste disposal management in 2013, so the local residents can decide themselves whether to adopt the innovative RFID system. The 2013 reform of food waste disposal enforces all of the Seoul citizens to choose one of three types of food waste disposal methods, the RFID based food waste disposal method, chip method, and garbage bag (see Table 2). There are variations in choosing them, depending on the single dwelling unit and multi-family housing, and the further apartment complexes also choose one of these three disposal methods. All of the households in single dwelling unit areas still use food waste bags (see Table 3).
This study focuses on what factors are related to the adoption of the RFID food waste disposal in the apartment complexes of Seoul. To reduce food waste, the Korean Ministry of the Environment invested nearly three billion U.S. Dollars into an RFID household-based waste-charging system, with one primary difference from other unit-based waste-pricing systems; in this one, each household was issued an RFID-embedded card encoded with the household’s information When the household members touch the card to the RFID machine installed in the apartment complex, the machine recognizes the member and gauges the total amount of food waste they have produced. It then displays the total cost of the day’s waste. Figure 1 shows the picture of RFID food waste disposal bins in an apartment complex of Seoul. At the end of the month, the local government collects the data of each household’s waste, and charges and bills them. The local residents, therefore, pay a waste charge proportional to the amount of waste they have produced. In 2017, about 137 local governments introduced the RFID type of food waste management and about 3,550,000 householders used the RFID food waste disposal system (see Table 4).
The successful adoption of the RFID-household based waste-charging system depends on the local residents. First, the local government advertises the effectiveness of the innovative RFID system through public hearings and its web page. Then, the local residents in each apartment complex decide, by consensus, whether to adopt the system, and send a representative of the apartment complex to the local government. We show how many apartment complexes adopted RFID system by date in Appendix A.
The Seoul municipal government decided to adopt the RFID household-based waste-charge system in January 2013, and to give the apartment complexes the authority to decide when to adopt it. From January 2013 to October 2015, when our research concluded, 520 apartment complexes of 2081 complexes adopted the RFID system; the others did not begin implementing RFID (see Table 8). As some apartment complexes did not adopt the RFID innovation until the research ended, the right-sided censoring occurred as shown in Figure 2. We ran several survival analysis models, where RFID adoption is recognized as a “failure,” using right-censored data

2.2. Determinants of Innovation Adoption

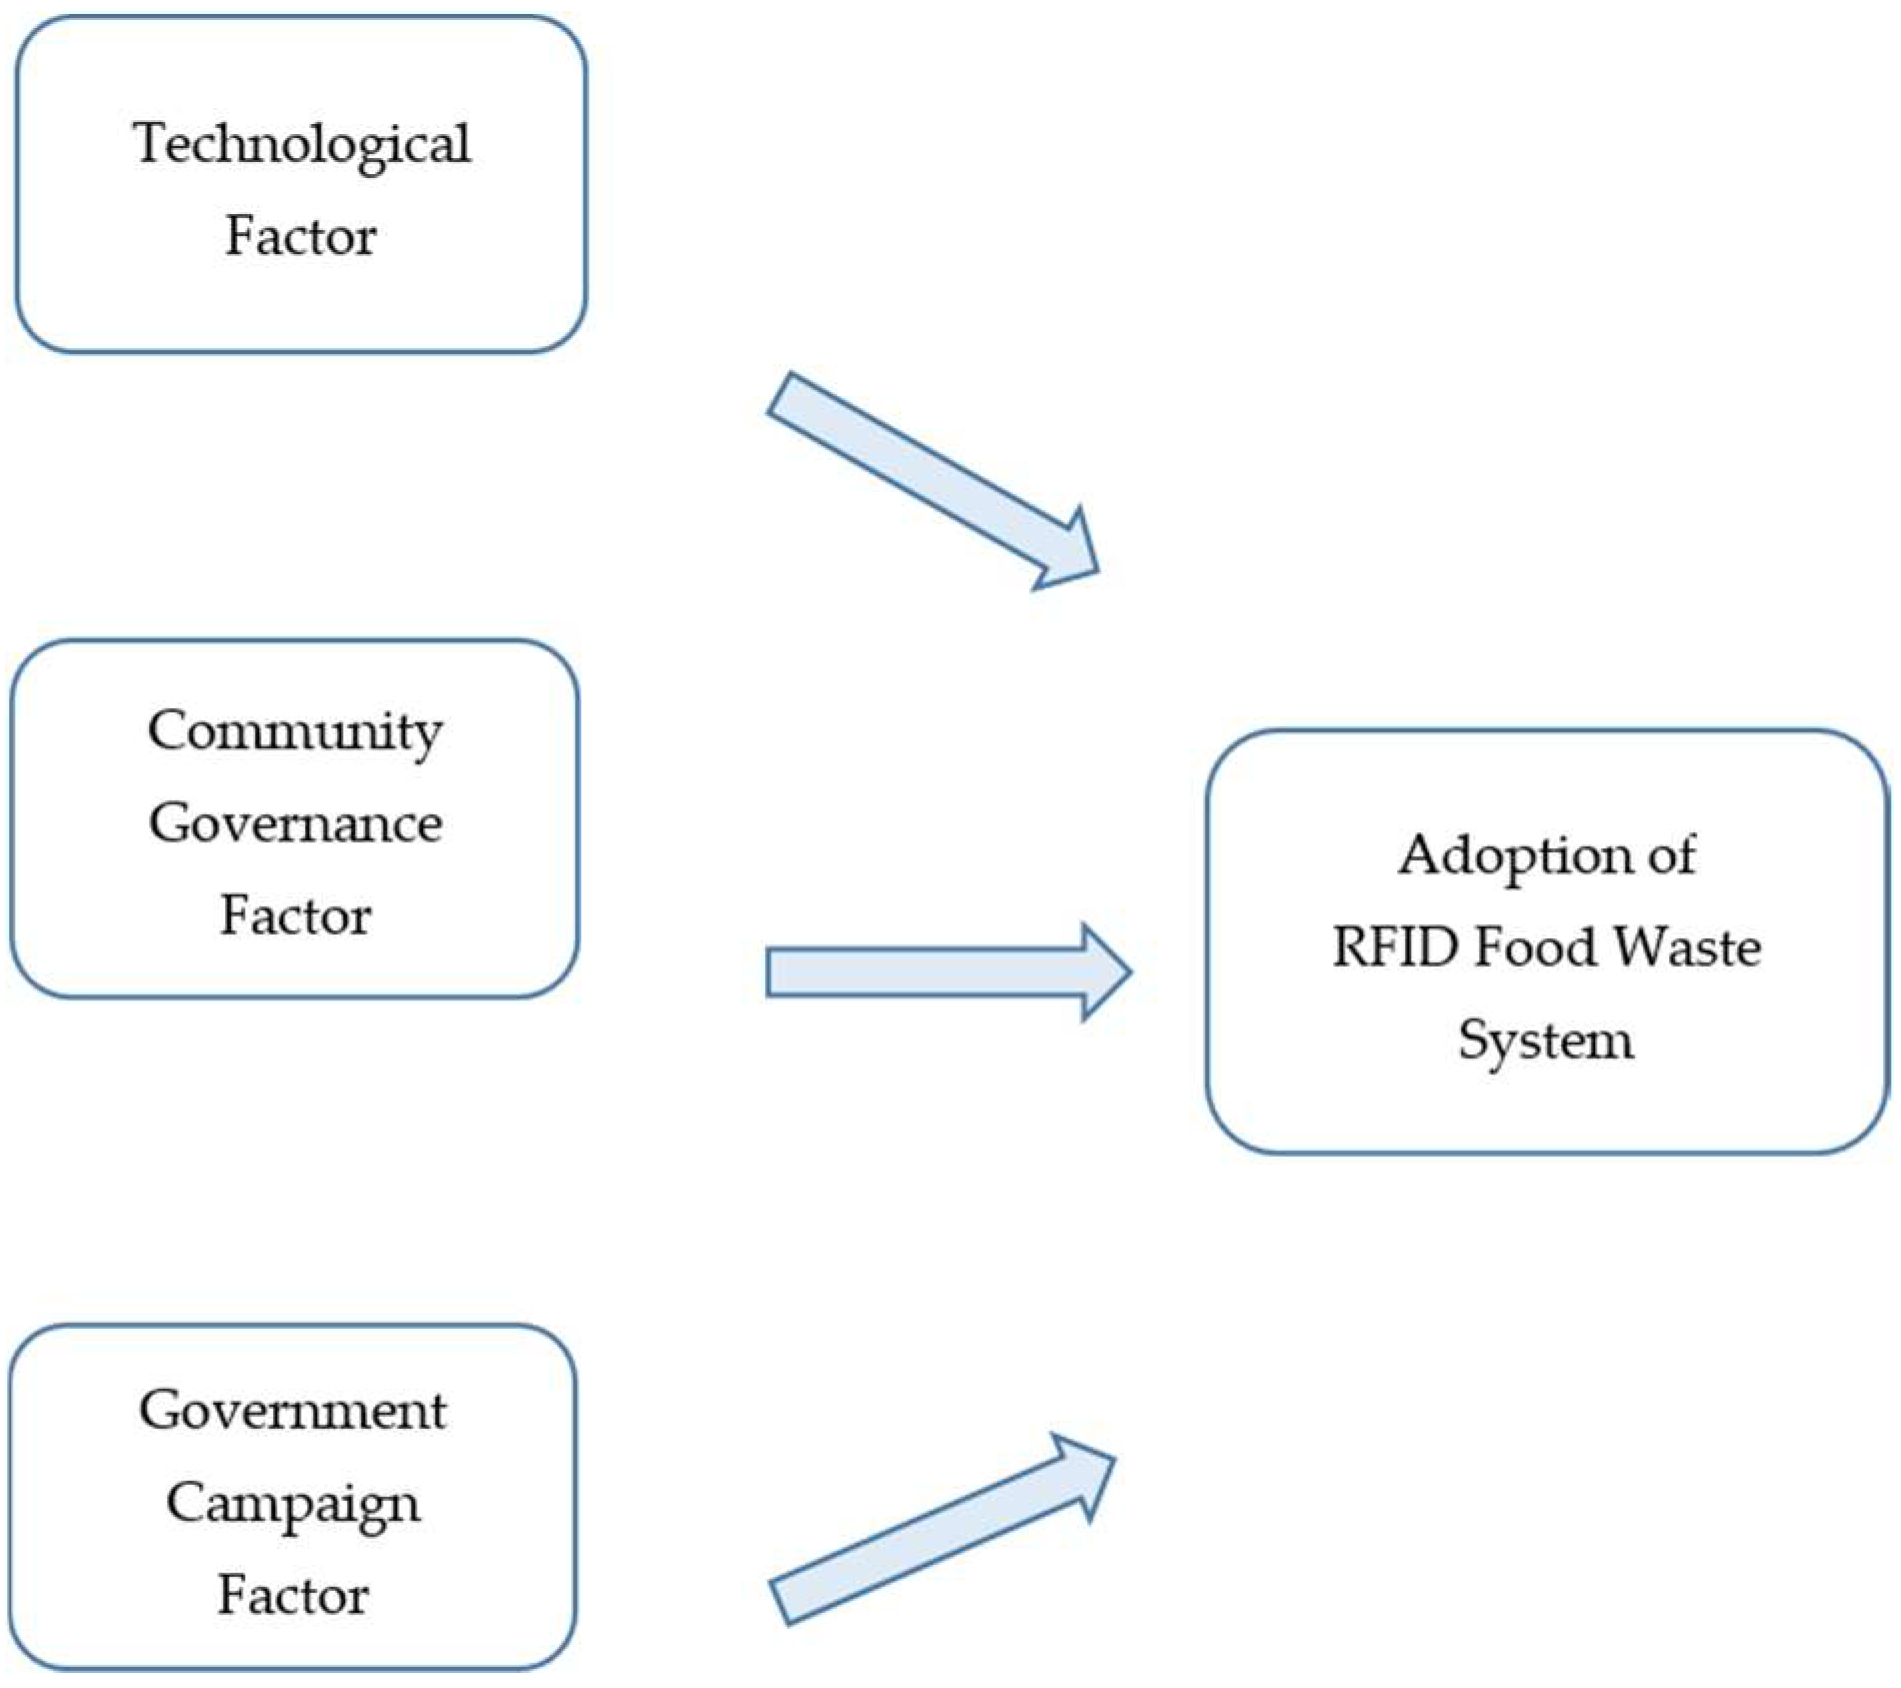
2.2.1. Technology Factors

Cost is one of the most important factors when considering technology adoption. As Fenn and Raskino [10] pointed out, as the IT field becomes more sophisticated, the cost of technology adoption increases. In order to introduce new innovative technologies, it is necessary not only to provide machines and equipment, but also to change the lifestyles themselves. Konsynski and Smith [11] also stressed that the cost of training and educating users is included in the cost of adoption. If the adoption costs are too high, the organizations are more likely to become cautious about adopting the technology because of the burden of the excessive costs on organization management [12]. Therefore, it can be suggested that the higher the cost of technology adoption, the more likely it will be that the innovation will not be introduced. On the other hand, the recent rapid development of technology makes huge cost savings possible [13], and organizations are beginning to evolve a more long-term perspective on calculating the costs and benefits of adopting innovative technology. Naturally, one view is that the adoption costs to technology adoption are decreasing in importance.
Another variable related to technological factors is the technological compatibility; how compatible innovative technology is with existing technology. Some scholars understand compatibility as a level of standardization [6]. Technological compatibility does not only mean hardware compatibility, however. According to Schultz and Slevin [14], the term also includes software. In other words, some scholars understand compatibility as how compatible innovative technology is with existing institutions or systems. Lai et al. [15] defined compatibility as “whether the newly adopted technology is compatible with current value and experience of organization”, and Brown and Russell [16] stressed the importance of examining how innovative technology corresponds to the organization’s existing visions and goals. Moore [17] and Fenn and Raskino [10], however, pointed out that as innovative technology in the 21st century usually revolutionizes the whole process of work, it is possible that whether the existing system and vision are compatible may not influence whether the technology is adopted. Bradford and Florin [18] stressed the importance of the decisions of top managers rather than compatibility.

2.2.2. Organization Factors: Community Governance

Larger organizations are more likely to adopt technology easily. According to previous researchers, such as Wen et al. [19], larger organizations can more easily grasp information about the technology’s usefulness and potential, and are more likely to have enough material and human resources to adopt and operate the innovation technology [20]. In addition, larger organizations have a greater ability to overcome the risks that may arise in the event of technology failure. As the size of the organization increases, however, the decision-making process become more complicated, requiring more time to achieve consensus [21].
The more financially ready the organization is, the more likely it is to adopt innovative technology. Financial readiness can not only provide a solid basis on which to establish the infrastructure needed for the adoption of the technology, but it can also bear the risk of failing to adopt it. In addition, financially ready organizations can generally acquire information and make decisions relatively quickly, thanks to their secure and solid networks both inside and outside of the organization. A wealthy company is not more likely to be adopt innovations aggressively, as seen in the cases of large corporations being reluctant to invest in new technology.
Lastly, we can consider the internal readiness of the organization, whether the organization’s internal systems and infrastructure can support the adoption of innovative technology. Many scholars have emphasized the importance of the organization’s “internal readiness”. Kinsella [22] defines “internal readiness” as a positive consensus and willingness within the organization; the better the consensus, the easier it will be to introduce technology. Steensma [23] also pointed out that how the organization’s members deal with the organization’s work skills can be an important measure of its internal readiness. Therefore, we can expect that the adoption of technology is more likely to occur in an organization with solid, concrete internal readiness.

2.2.3. Environment Factors: Government Campaign as External Gravity

External actors are another important variable in technology adoption. We can understand this effect from an isomorphic perspective [12]. When one firm successfully adopts an innovative technology, other firms tend to follow suit [19], a behavior that can be interpreted as isomorphic. In addition, the desire to occupy the market faster than the external competitors may promote the adoption of technology, especially if other organizations in similar fields are starting to adopt innovative technology [24]. In other words, when innovative technologies are first introduced to the market, companies often decide to adopt this technology according to the behavior of external entities [25]. In the case of technologies like RFID used for food waste, however, the government strongly encourages the adoption of RFID from the earliest stages. Through a public hearing and website of the self-governing district, the government has provided information about the effectiveness of this innovative technology. According to Thompson et al. [26], the government can change the behaviors of individuals and organizations by providing information, just as they achieve policy goals through financial incentives. In addition, in the view of Moore [17] and Fenn and Raskino [10], experts and media with expertise in technology actually provide technology adapters with the most important information on technology adoption and diffusion. In this study, we expect that technology adoption might increase as the government provides more information on the technology provided to technology adopters.

2.2.4. Limitations of Previous Studies

The need for this study, which draws from previous literature, is as follows. Since Rogers’ pioneering innovation research about technology adoption, there have been various attempts to identify the tendency and determinants of technology adoption. The previous literature is based on survey data, however. Among the several limitations of survey data, the most serious problem is the common method bias [27]. As Billings and Wroten [7] pointed out, if we measure several variables using the same method, the correlation between two variables turns out to be larger than the actual correlation. This suggests that the analysis bias is likely to occur if the empirical analysis is conducted using the survey data. Another problem with the survey analysis method is that the respondent may misunderstand or understand the question, but may not express his or her opinion frankly or honestly [28].
Another problem is related to operationalizing the variable. As described above, most studies that deal with the determinants of innovative technology adoption used survey data rather than hard data. These previous studies did not define the variables specifically, but rather asked only that the respondents understood the conceptual meaning of the variable. Variables such as “compatibility” and “internal readiness of organization” operate according to a conceptual definition of the variable, through which doing empirical analysis is hardly impossible if the researcher has hard data. Table 5 below shows the survey questionnaire that previous literature has used for study. As can be seen in the table, previous literature did not care focus on how to operationalize variables.
Furthermore, Rogers and recent innovation research group who studied the adoption of innovative technology did not focus on the role of the government [42]. Davis [43] also regarded the adopters as rational-economic figures, so the usefulness and appropriateness of technology would be the most important factors in their adoption decision. In the late 2000s, scholars like Ramanathan et al. [30] began to explore the role of the government, especially with regard to Asian countries. They added supporting data and the quantity of information provided by the government in the empirical model, but it remains difficult to find literature whose model contains a government-effect variable. Also, as Sear and Baba [44] pointed out, with the rapid globalization of the 21st century and the lowering of barriers to mutual exchange between countries and companies, the adoption of innovative technology should be understood as multi-level. In other words, useful research requires multi-level analysis, which considers not only the characteristics of the organization itself, but also the pressures from its industry, the willingness of the government, and even the flow of the global market.
There are some limitations of the technology-adoption tendency model drawn from previous literature. Gartner’s model has already been widely used in the business field, and its explanatory power has been acknowledged [45], but there is still a lack of verification and demonstration of it from an academic point of view [46]. Scholars such as Jarvenpaa and Makinen [46] pointed out the lack of attempts to build theoretical foundation of the hype cycle model. Steinert and Leifer [47] also stressed the weakness of the hype-cycle model, especially its vague definitions of the vertical and horizontal axis. As described above, the vertical axis of the hype curve represents expectations and visibility, according to Gartner’s original publication [10]. Its definition has differed from scholar to scholar, however. For example, in Ruef and Markard’s [48] analysis, the vertical axis represents media attention, while Jun [45] suggested that the maturity of technology, consumer adoption, and maturity of institutional infrastructure can also be represented on the vertical axis of the hype curve. In this study, we set ‘maturity of technological and institutional infrastructure’ as the vertical axis, which can be a radical factor in making concrete the theoretical validity of the hype-curve model.
In addition, previous studies that dealt with the hype curve mainly considered the behavior or tastes of the consumers—the demand-side stakeholders—although the stakeholders at each stage of the innovation may be either supply- or demand-side types [46]. As McPherson and Bacow [49] pointed out, it is necessary to scrutinize both supply- and demand-side stakeholders of the hype curve, in order to evaluate the effectiveness of the hype curve from a macro point of view. In the case introduced by McPherson and Bacow [49] about the adoption of technology in online education at universities, the demand-side stakeholders (professors) did not prefer online education programs to the traditional way of teaching, despite their remarkable convenience, because innovative online teaching could not guarantee teacher–student interaction or the security of lecture content. Van Lente et al. [50] also stressed the need for multidimensional thinking, because innovative technology usually faces the challenges of a complex interplay of specific, functional, and generic expectations [51]. In addition, as in this case of RFID household-based waste-charging system adoption the local government played both the roles of both demand- and supply-side stakeholders simultaneously, it is necessary to consider the needs of both types of actor. In this study, we focus on the role of the local government in technology adoption.

3. Research Design

3.1. Research Process

We conducted research for this study in four stages. As shown in Figure 3, before running an empirical model, we reviewed previous literature about innovation adoption and decided to use the technology–community–governance–government campaign (TCG) model. As described above, however, previous research has mainly used the conceptual definition to measure sub-factors or the TOE model. We first checked the conceptual definition of each variable and developed an operational definition for each one. To form an operational definition from a conceptual definition, we applied the implications of our interviews with officers of the local government, management staff of the apartment complexes, and local residents. Based on the interview results, we suggested an operational definition of each variable (see Table 6). Lastly, we collected hard data from various resources, such as the Ministry of Environment, Seoul City; food waste pick-up services; and the Korean Appraisal Board to run empirical models including the survival analysis.

3.2. Data Collection

Many previous studies dealing with innovation adoption used individual-level survey data to determine the factors of innovation. However, using individual-level surveys can cause not only individual fallacies, but also common method bias, because of the inherent limitations of survey data. To solve these problems, we set the apartment complex as the unit of analysis measured by non-cognitive variables. In addition, we operationalized the variables based on the results of interviews with local government officers, apartment complex managers, and apartment complex residents (see Appendix B), and analyzed the effect of various ecological variables related to the characteristics of the apartment complex collected from various statistical resources of public agencies in the Republic of Korea.
The collection of data took about three months, from July to October 2015. Information about the unit of analysis of this study, an apartment complex, was obtained primarily from the local governments, such as the Seoul Metropolitan government and Gu government. We then cross-checked this information with the data collected from the central government, the Ministry of Land, Transport, and Maritime Affairs. In order to measure the length of time taken to adopt the RFID household-based waste-charging system, we asked the Gu and Seoul City governments to provide information about each apartment complex’s current method of food waste pollution and the exact date of RFID adoption, if the apartment complex was using the RFID method by 1 October 2015. We set this data, which included information about RFID adoption, as the dependent variable of our logistics regression analysis and pooled the ordinary least square (OLS) method. For the survival analysis, we also used the time of length to adopt the RFID procedure as a dependent variable, measured by various interval periods after the initial implementation of the RFID based food waste-charging system across the apartment complexes.
The independent variables are divided into three categories. Firstly, we categorized the independent variables based on the TCG model and used the information from the interviews to operationalize the variables, because previous studies had mainly focused on survey data, where respondents were asked direct questions and the hard data had not yet been operationalized. Information about the first variable was included in the technological factor category, and ‘waste charge’ came from the Gu and Seoul Metropolitan governments through the Open Government System [52,53,54]. The data related to the method of heating and the total number of apartment complex office managers were obtained from the ‘k-apt’ website run by the Ministry of Land, Transport, and Maritime Affairs. The total number of households in the apartment complexes and the average apartment complex price were taken from the website of the Korea Appraisal Board. Lastly, to gauge the degree of government support, we searched the websites of each of the 25 Gu and Seoul Metropolitan City government using the keyword ‘RFID’.

3.3. Analytical Frame

The analytical framework we used for this study is represented in Figure 3. There are three main types of independent variable, namely, the technological factor, community governance, and government campaign. The category of the technological factor includes the cost of technology adoption and the similarities between the innovation technology and the current or former technologies. The category of the governance factor related to the management characteristics of the apartment complex, including the self-management committee and size of management office. Lastly, the category of the government campaign factor includes how much information the government provides to their people.

3.4. Variable Measurement

Table 7 shows how to measure dependent and independent variables in Figure 3. This study is an exploratory study investigating the factors that determine the adoption of the RFID household-based waste-charging system in apartment complexes. To identify these factors, we set up ‘difference between waste charging fee’ and ‘whether to use individual heating system’ as technological factors. According to Zailani et al. [55], the cost of innovative technology adoption is one of the most important factors determining the adoption of innovation. The higher the cost of adoption, the more delayed its adoption. In previous studies, the cost of technology adoption was defined as the cost required to purchase the new machine or equipment [56]. On the other hand, in the case of adopting the RFID system in apartment complexes (the unit of analysis of this study), purchasing an RFID machine is free, thanks to a subsidy from Seoul Metropolitan City, who also pays the electricity fee [57]. In the case of the RFID method, however, the food waste charge is higher than the existing waste-charge method. So, we considered the difference between the RFID waste charge and the charge for the current method as the cost of innovation adoption.
Next, we tried to operationalize our hypothesis regarding technological compatibility. According to Wang et al. [58], technological compatibility indicates whether or not newly adopted innovations are compatible with existing technology and systems. This means not only physical compatibility, but also regarding how the characteristics of the innovative technology fit the organization’s existing value and systems. Korean apartment complexes are, for the most part, heated using either the individual heating method or the central heating method. Of these methods, the central heating method is similar to the method of calculating the amount of food waste that was used before the adoption of the RFID method. The total heating expenses in the complex is calculated, and residents pay by 1/n, where n is the total cost. On the other hand, in the individual heating system, the residents pay exactly their proportion to the total amount of their usage. Therefore, the individual heating system and RFID household-based waste-charging system have many similarities. As a result, it is expected that the apartment complexes that have been selected and that use individual heating will be more active in adopting the RFID method. This was confirmed through an interview with the head of the Apartment Management Office [59]. Therefore, we measure technology compatibility as whether or not the apartment complex uses individual heating.
Organizational factors such as community governance in apartment complexes are as follows. Firstly, the size of the organization represents its physical size. In this study, it is defined as the total number of households in the apartment complex [60]. The financial readiness of the organization is closely related to how large its risk management capacity is. In our interview with local government officers, we can gain insight into the price of the apartment complex and its RFID adoption [61]. Therefore, we conclude that we can measure the average price of the apartment complex in order to operationalize the financial readiness of the organization.
More specifically, community governance consists of ‘self-committee’ and ‘the total number of managers working in the apartment complex management office.’ The committee variable represents whether the apartment complex chooses self-management or commission management in terms of apartment management. The committee is regarded as the resident representative meetings at the apartment complexes.
As described above, the decision to introduce new RFID technology is made through public hearings and the resident meetings of apartment complexes. Therefore, it is expected that the adoption of RFID technology will be decided more actively in a complex whose residents organize the committee system and committee [62]. The management general variable is related to the internal readiness of the organization. Asif [63] emphasized that the internal readiness of the organization should be sufficient in order to ensure a smooth introduction of the innovation. In this study, it was confirmed through interviews that the number of management personnel is influential on the adoption of RFID. As can be seen from the interviews, the management of the RFID system in the apartment complex is conducted mainly by the apartment complex management office [64]. For this reason, the Gu government can reject applications for RFID adoption by apartment complexes whose management offices are too small.
Lastly, external gravity as environment factor in innovation diffuse is operationalized as ‘information provided from the government.’ The variable of the government information provision represents how much information is provided regarding the RFID system, namely the total number of documents retrieved by searching with the keyword ‘RFID’ on the website of each Gu government division. It was confirmed through interviews that the number of articles on the Gu government’s website is important [65].

4. Empirical Analysis

4.1. Descriptive Statistics

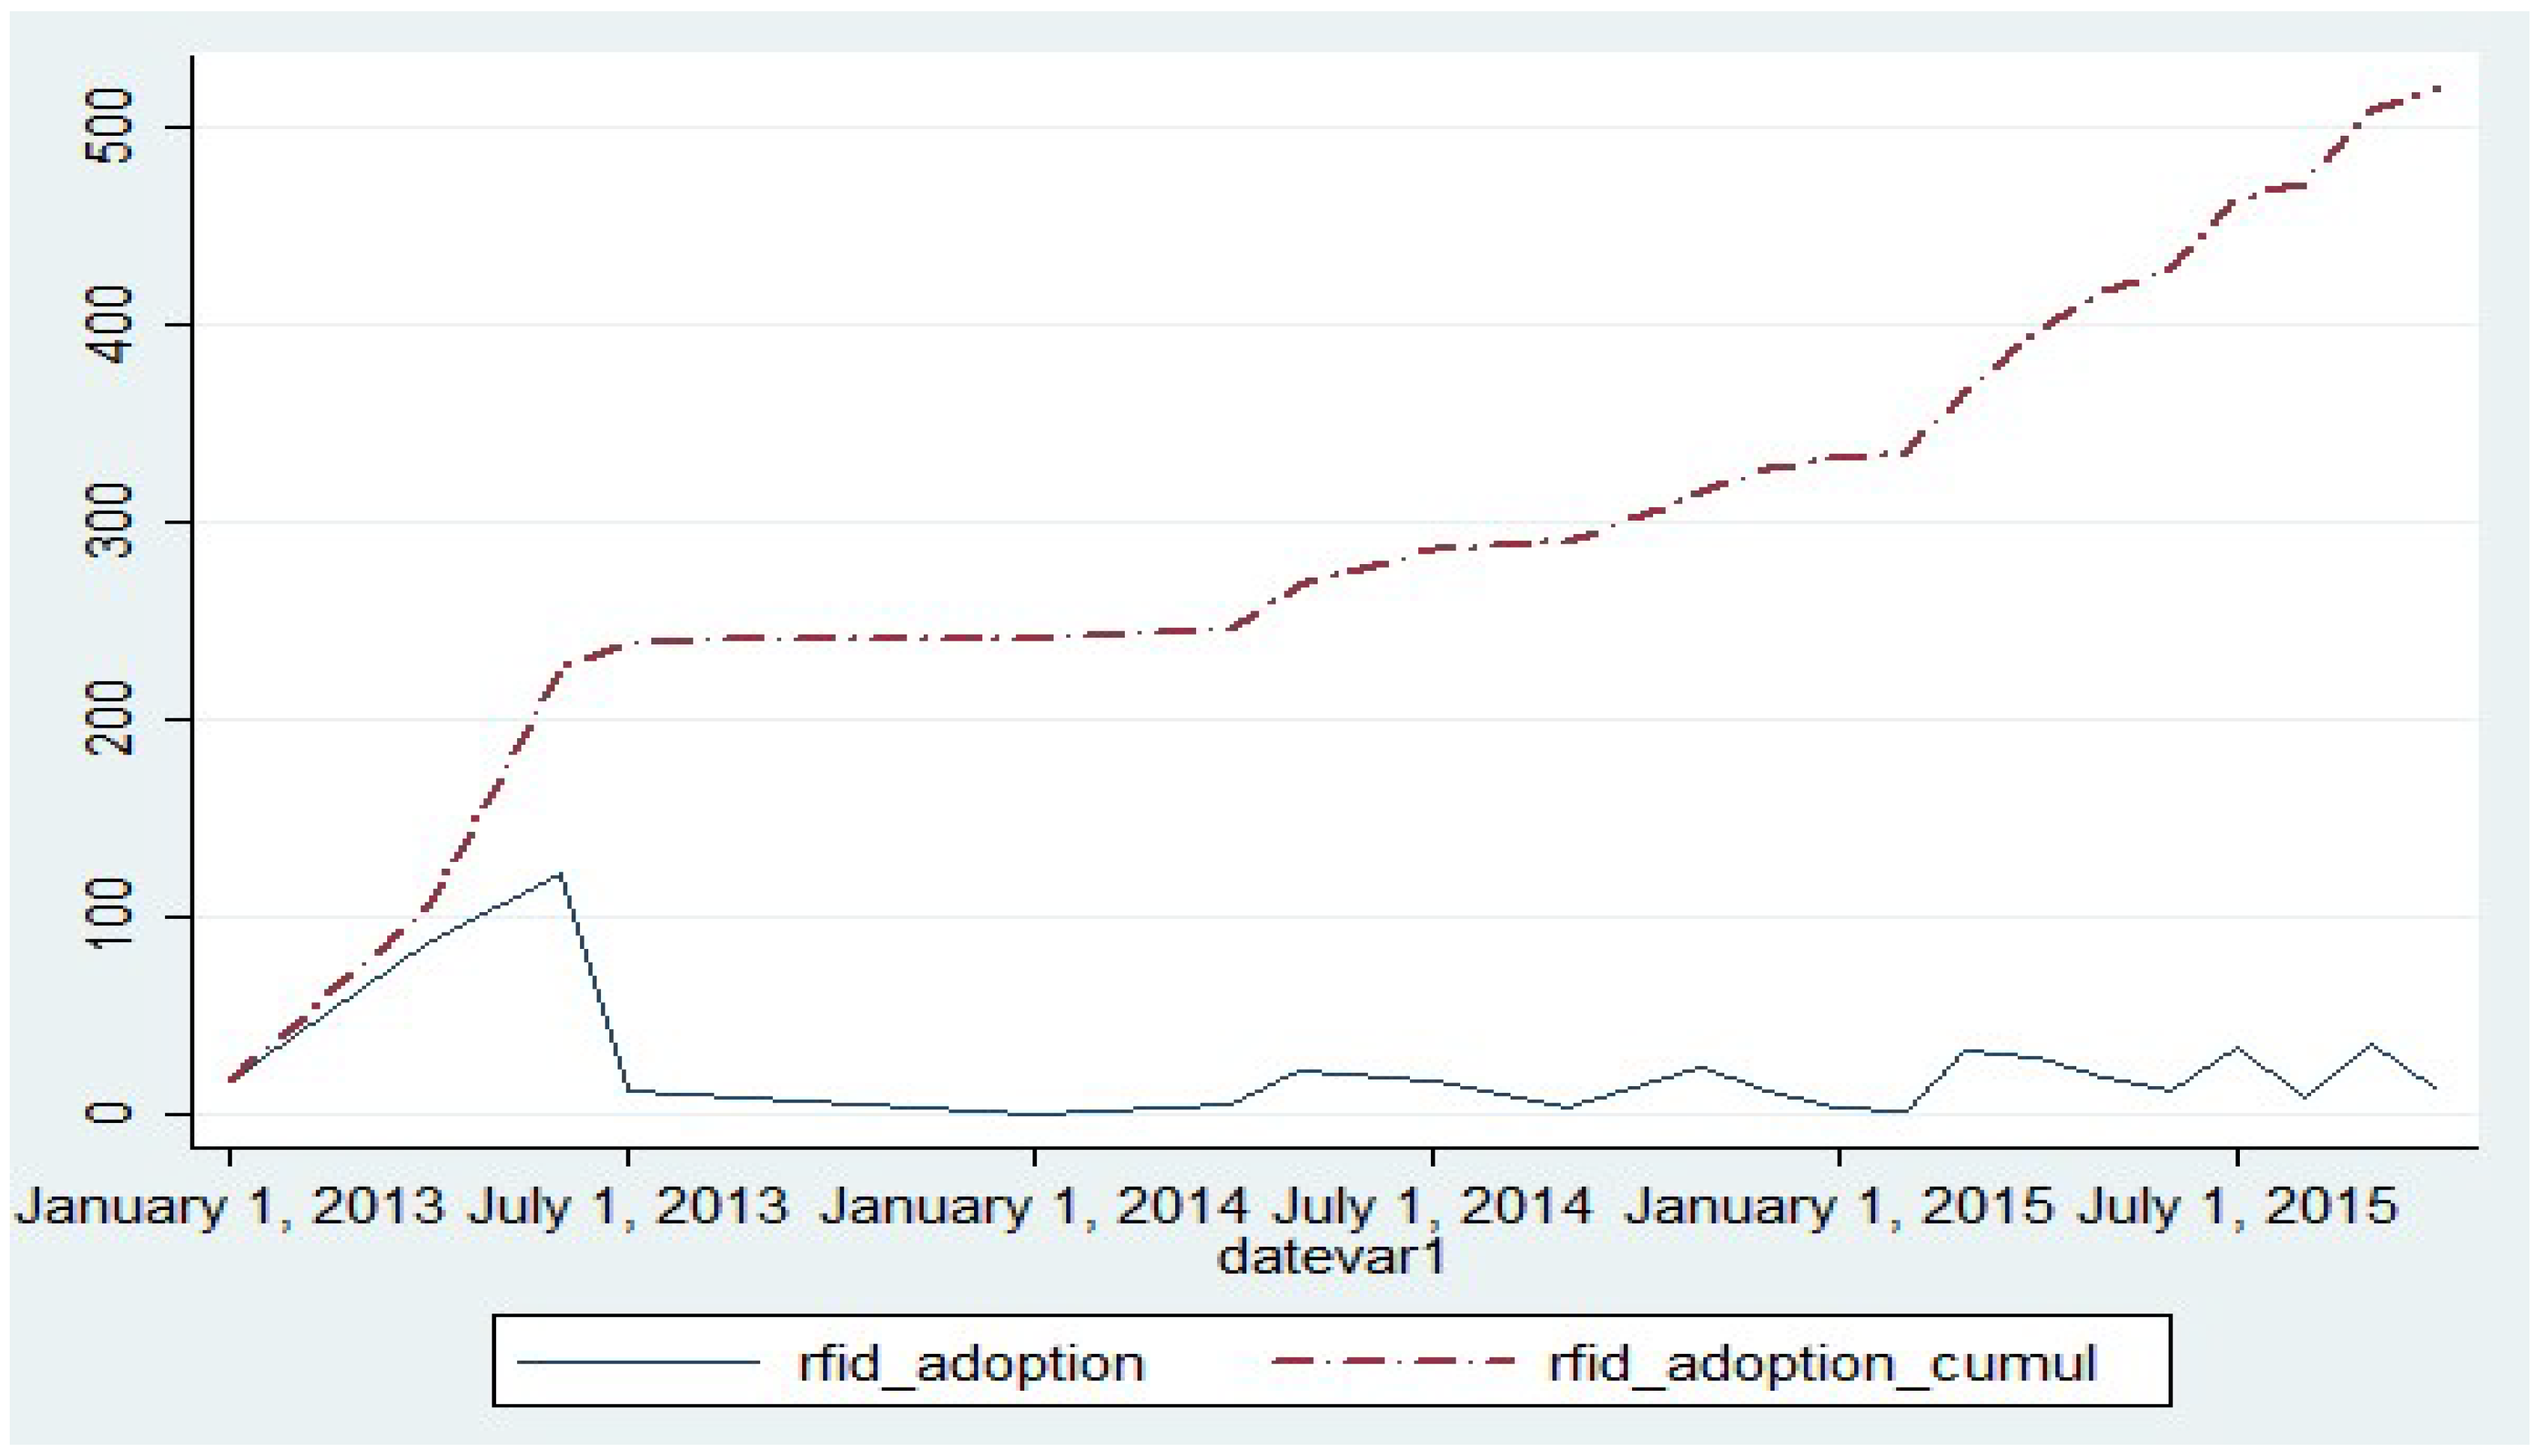
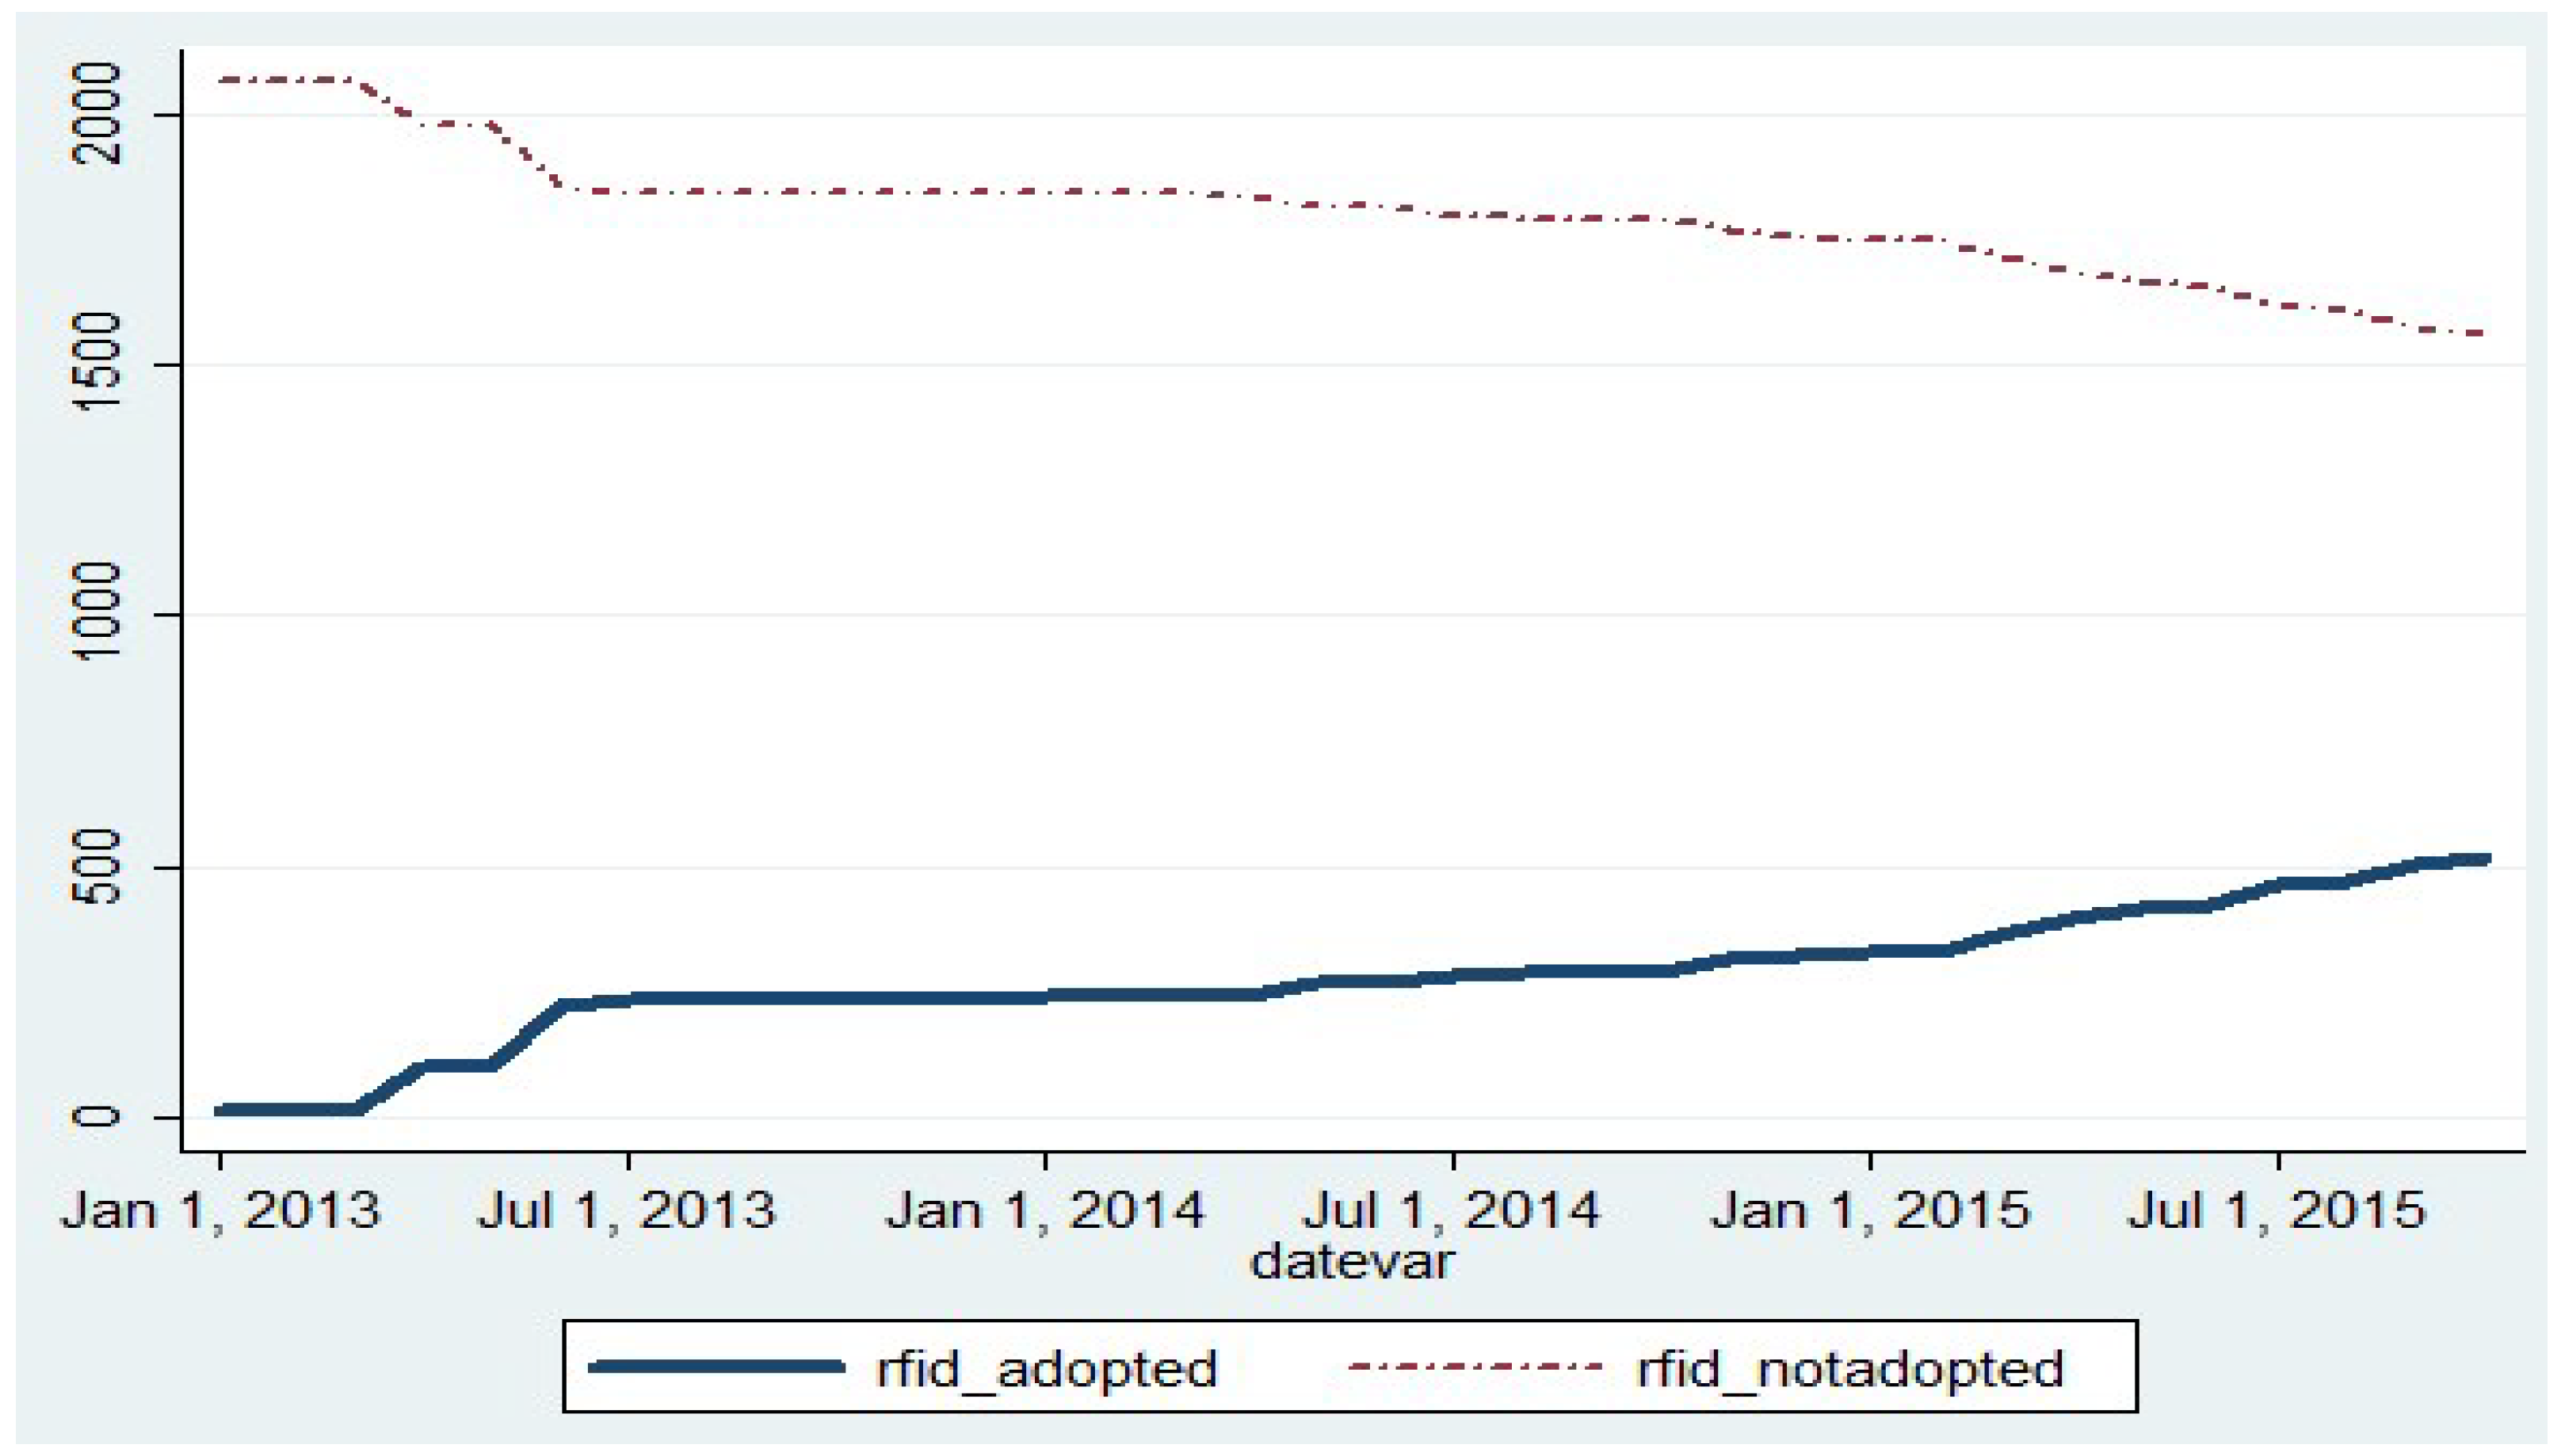
4.1.1. Dependent variable

The descriptive statistics of the dependent variable are described in Table 8, below. As can be seen, of the 2081 apartment complexes located in Seoul City, 1561 apartment complexes have not implemented the RFID household-based waste-charging system as of 1 October 2015. The other 520 apartment complexes have adopted it.
The RFID adoption by date is shown in Figure 4 and Appendix A. Among the 520 apartment complexes currently implementing the RFID system, most adopted the innovation within the first year. This result can be verified through the graph shown in Figure 5. Both the hazard graph and the histogram show a hype curve, in which most of the adoption occurred in the early stages of the technology-adoption process. After this early stage, the adoption trend has a slower period that several scholars have called a “chasm”. The adoption tendency initiates a second hype curve after the chasm, which can be seen in Figure 4. From January to July 2013, more than 100 of the 520 apartment complexes began to implement the innovation. After July 2013, the RFID system was steadily adopted, as seen from the cumulative graph, although the tendency of adoption decreased.
When we draw the frequency graph of the RFID-adopted and non-adopted apartment complexes to examine the tendency of the two groups, the number of non-adopted apartment complexes decreased as more and more began to implement the innovation, as shown in Figure 6, below. The red dotted line represents the decreased tendency of the non-adopted apartment complexes from January 2013 to October 2015. In opposition to this, the blue line, which represents the tendency of RFID-adopted apartment complexes, shows an increase.
We also drew graphs of the cumulative survival function and cumulative hazard function. As seen in Figure 6, the cumulative hazard function increases the longer the analysis continues. In the survival analysis, the hazard function represents a function of the probability that the object of interest will survive beyond a given time [66]. The hazard function and survival function are two sides of a coin. The calculated failure rate for smaller intervals of time results in the hazard function. In Figure 6, the cumulative hazard function, which describes the probability of an apartment complex that has adopted the RFID system, increases with time. On the other hand, the cumulative survival function decreases with time, as shown in Figure 7.

4.1.2. Independent variables

The descriptive statistics of the independent continuous variables are represented in Table 9, below. Among seven independent variables, five are continuous variables. Firstly, the difference in the waste charge between the RFID method and the current system is 40.44 as its mean and 8.08 as its standard deviation. The maximum value of the waste charge difference is 68 and the minimum value is 19. Apartment complexes in Seoul City contain 618.23 households on average. The biggest apartment complex contains 6864 households. The mean price of an apartment complex was 1698 as the number of observation, due to limitations in the data collection. The mean apartment price was 1851.30. The environmental factor ‘government information’ variable has 27.77 as a mean and 29.16 as a standard deviation. Some Gu local government divisions did not upload any reports about RFID on their websites, while one local government division had uploaded 126 reports by 1 October 2015.
Two categorical variables are included in the empirical model (see Table 10). The first categorical variable represents whether the apartment complex had adopted the individual heating system. Among 2081 apartment complexes, 1374 had implemented the individual heating system as of October 2015. The rest use the central heating system, in which the apartment complex office controls the heating system on the residents’ behalf. The second categorical variable is the committee variable. We can identify the management method of apartment complexes through this variable; 277 apartment complexes have adopted the committee system and their own management committee manages the apartment complex, while 1804 contracted a management firm to manage their residential area.

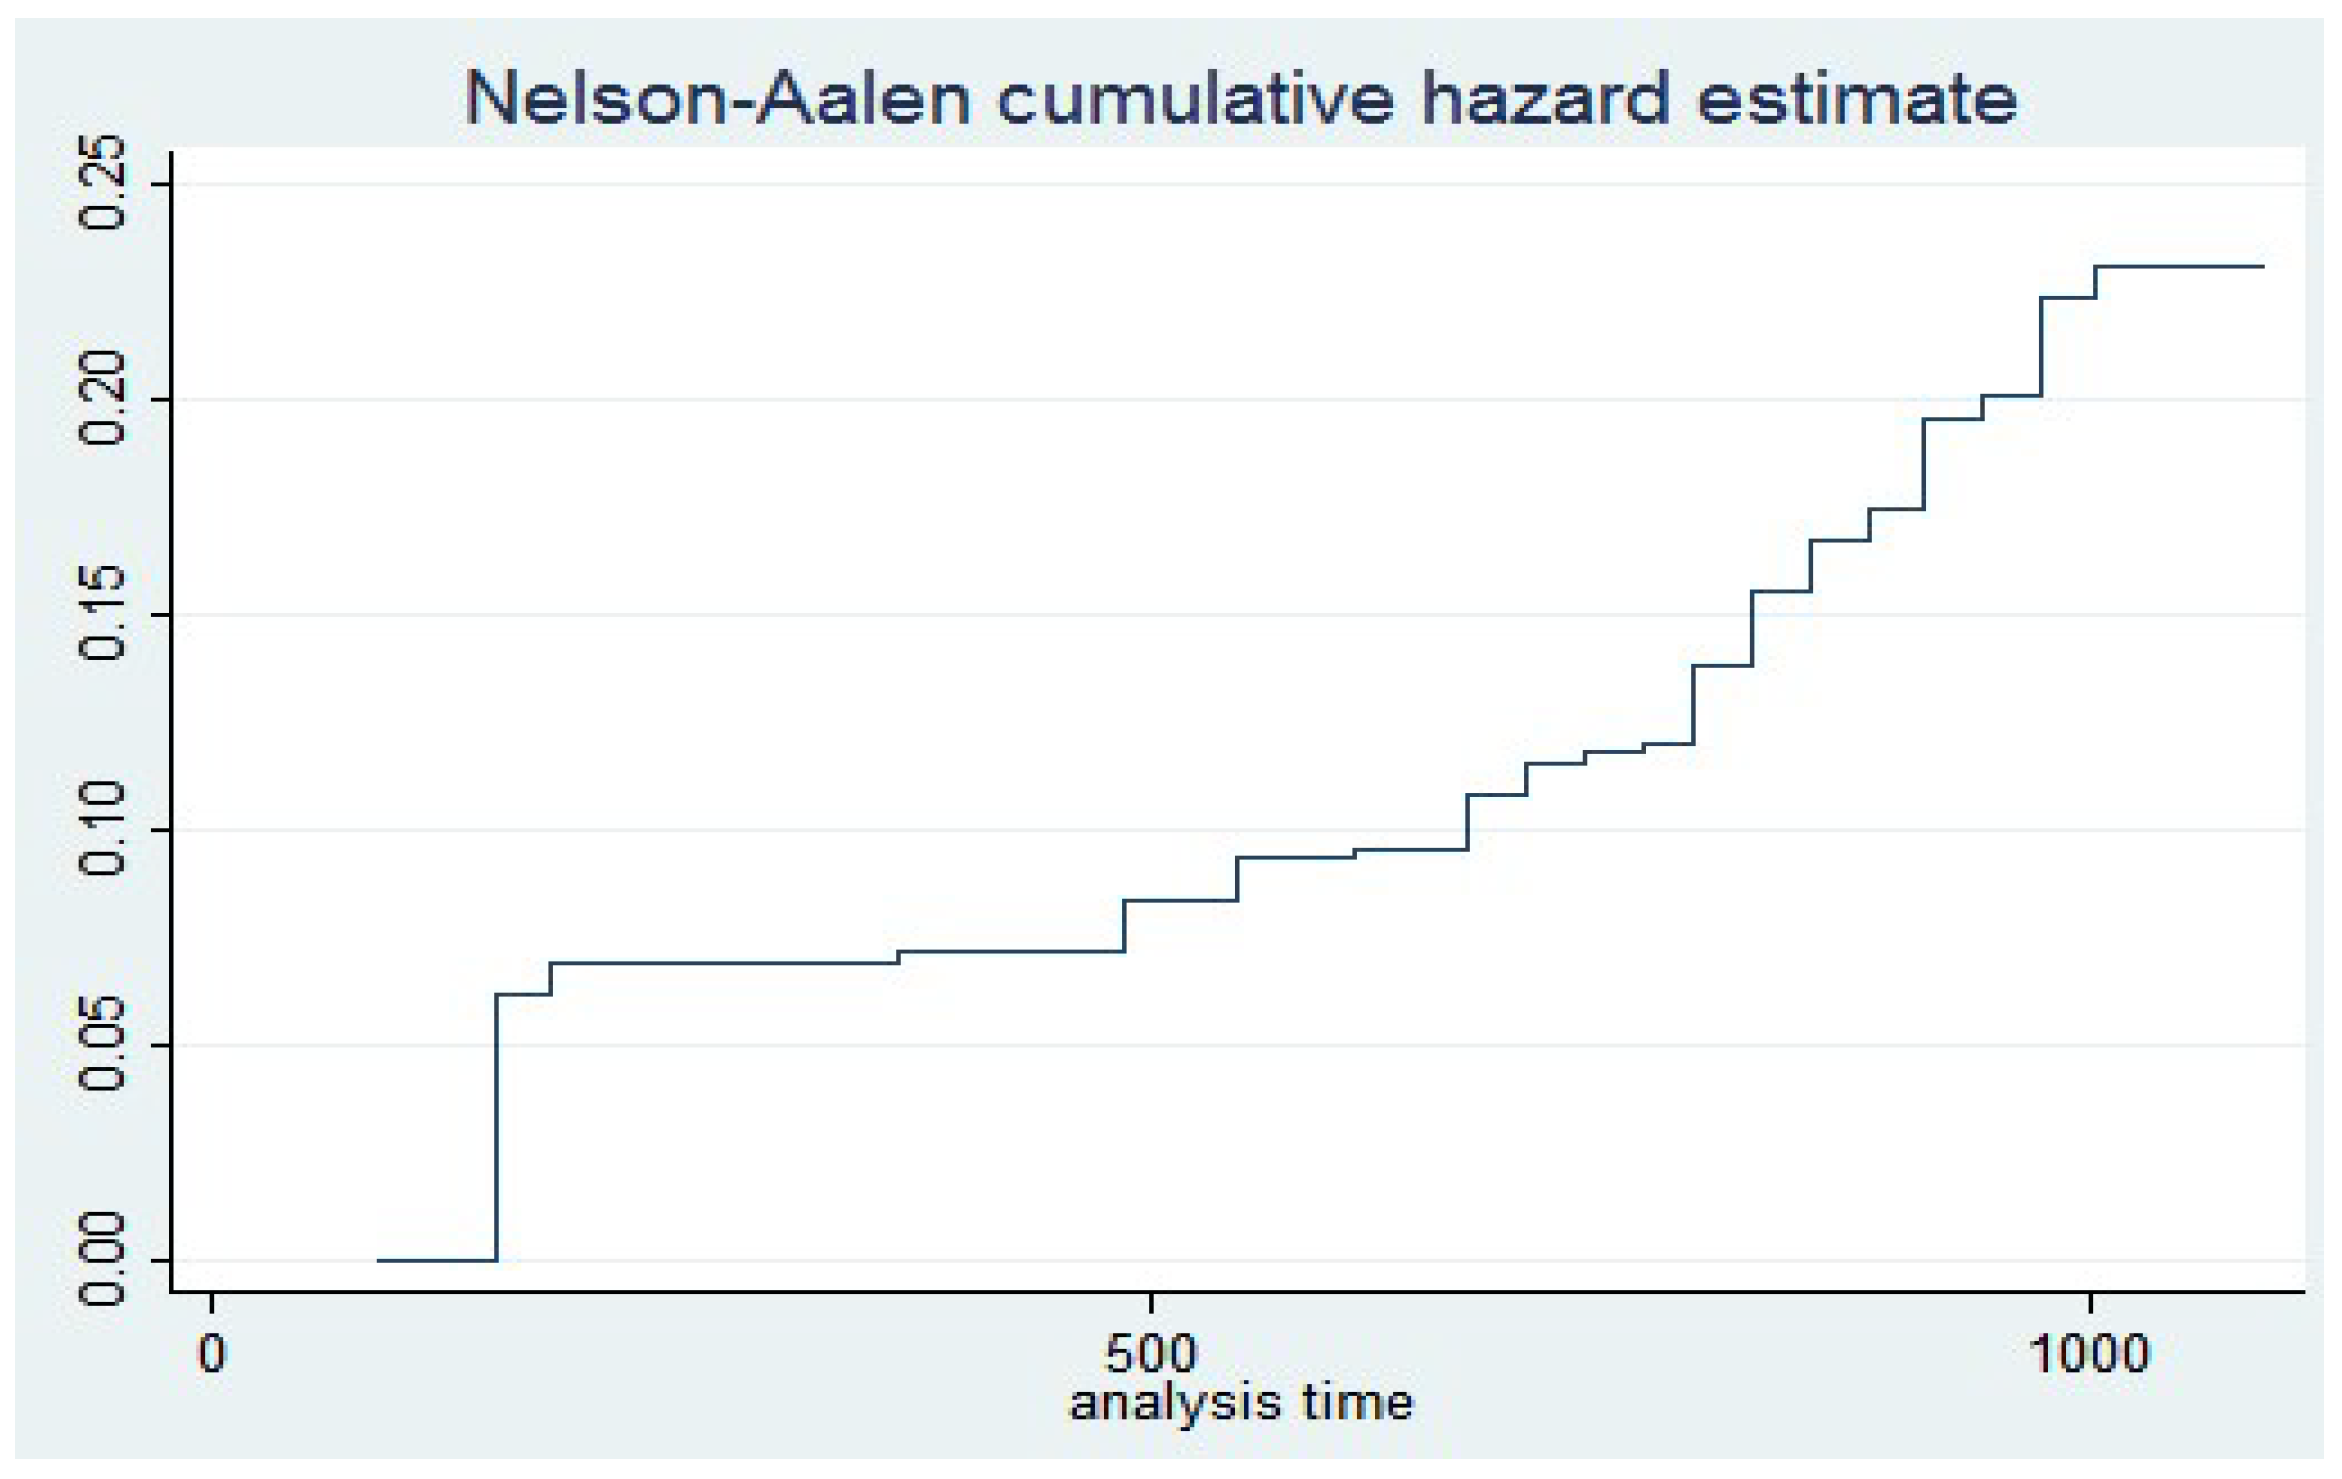
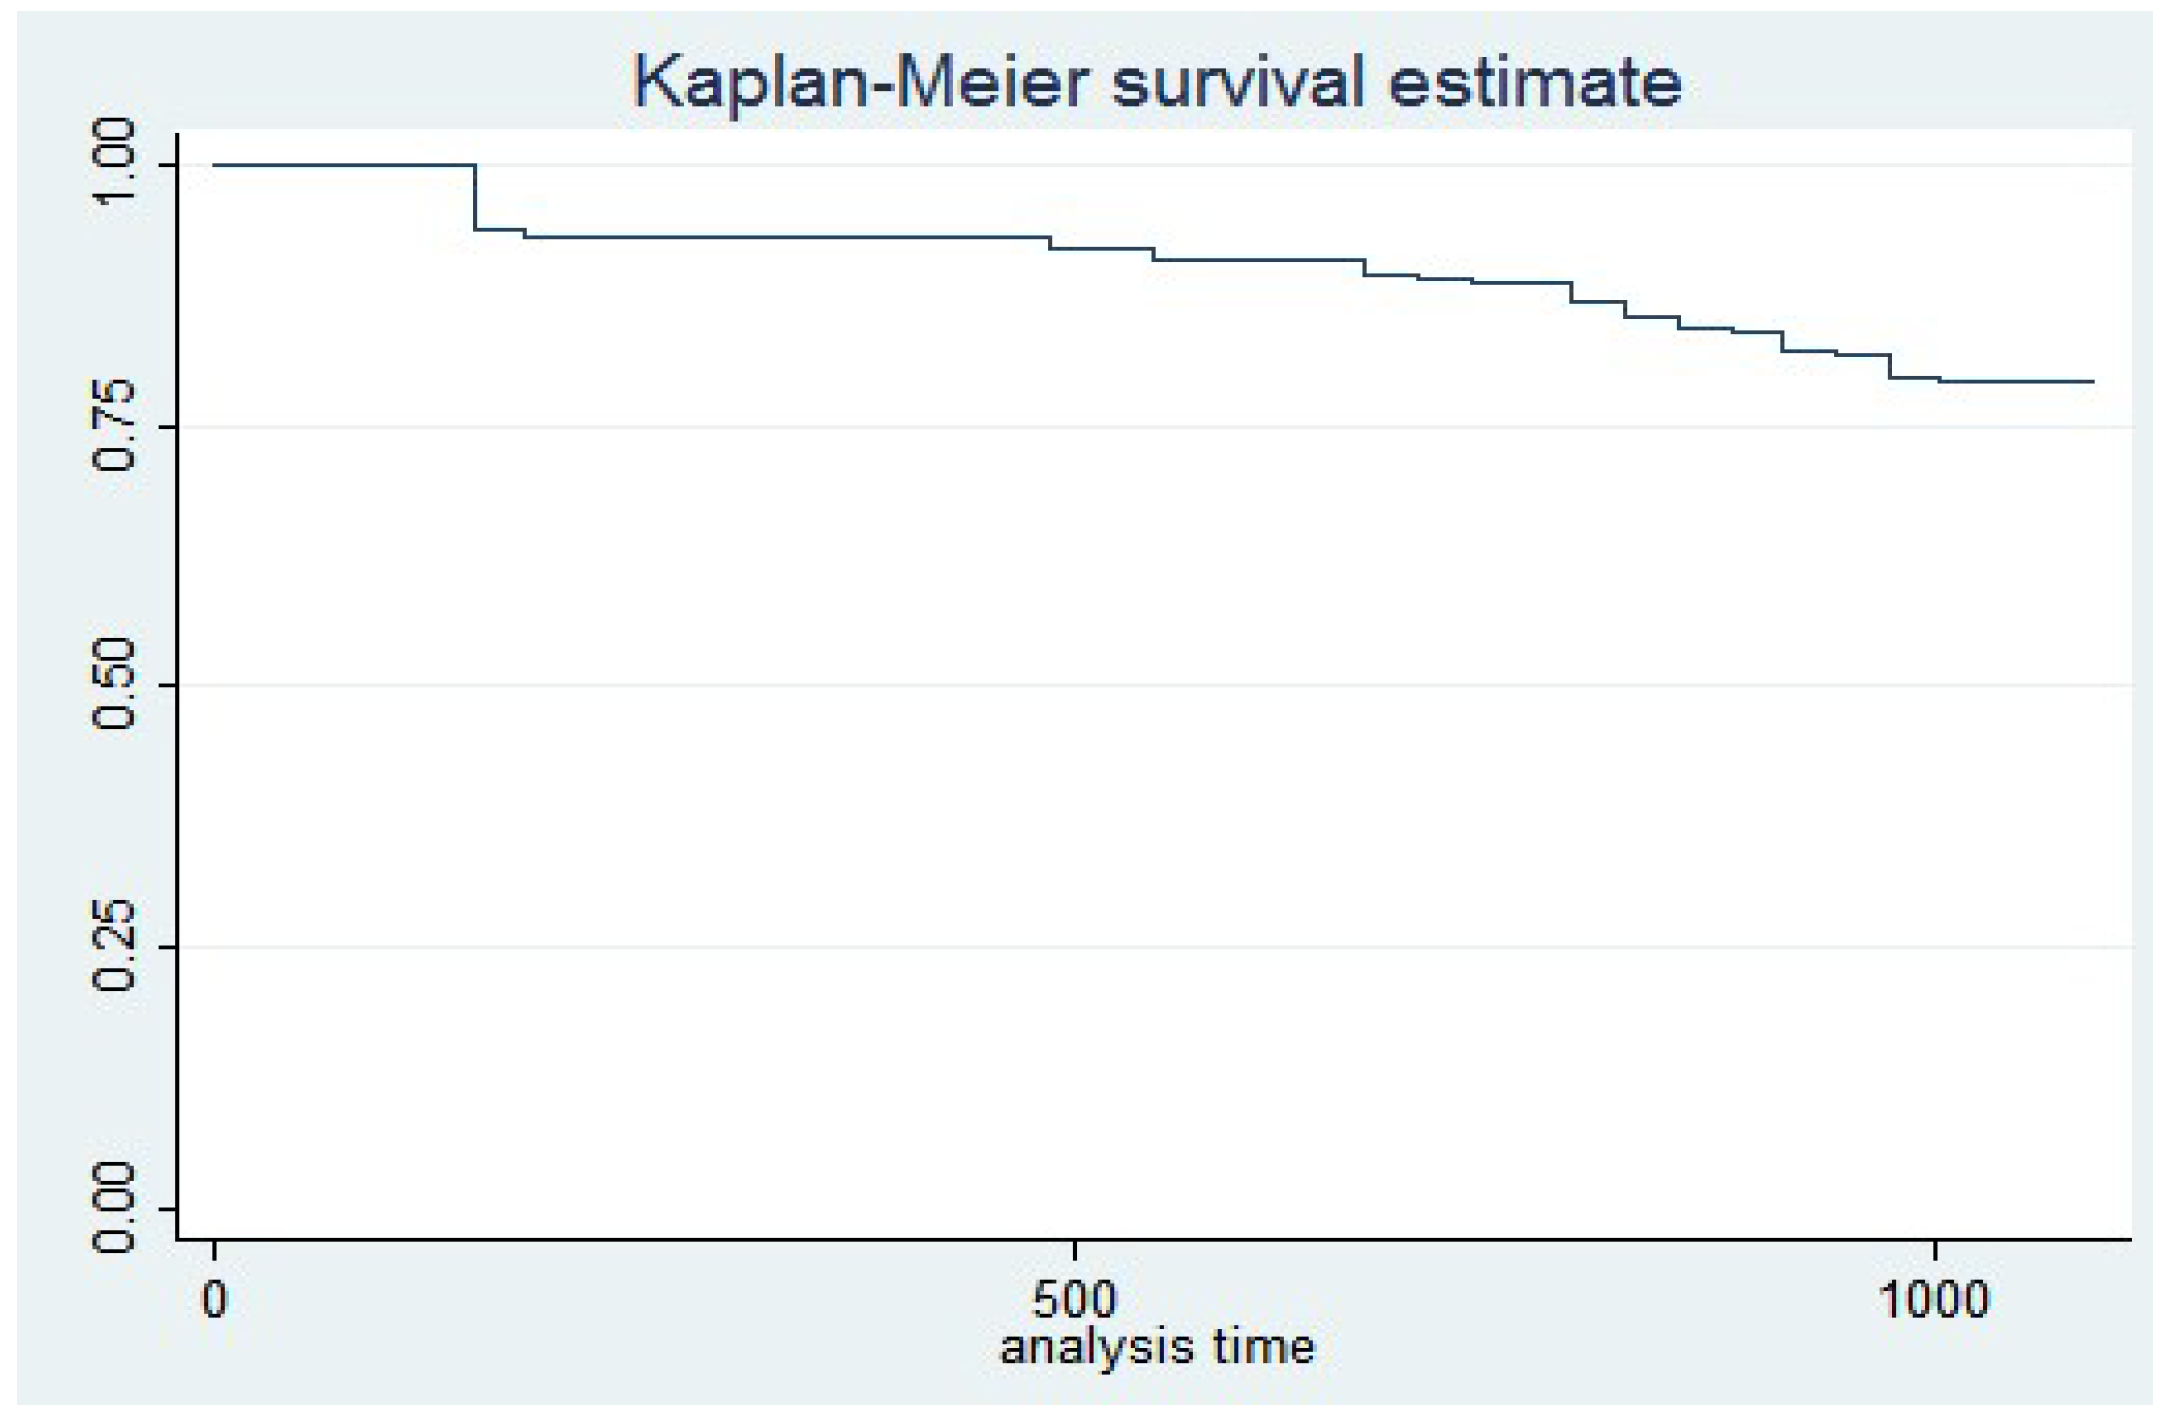
4.2. Empirical Analysis

Before running the survival analysis, such as the Cox regression, we first ran a logistic analysis and pooled OLS in this section, in order to have robustness (see Table 11). In our logistic analysis and pooled OLS analysis, the dependent variable is a dummy variable that indicates whether the apartment complex had adopted the RFID method as of 1 October 2015. In Model 1 and Model 2, below, the government-provided information is strongly significant. The government-provided information is significant in two models, which means that the support from the external environment, such as government, is critical in technology adoption, supporting the results of previous research. In addition, as RFID adoption is the result of government-led policy and strategy, it can be anticipated that the government’s role in providing information about RFID and persuading citizens to support innovative technology is very important.
The sign of the apartment-price variable is positive, so it can interpreted that the higher the apartment price, the higher the possibility of RFID adoption. This result is similar to previous literature, where the financial readiness of the organization was important in technology adoption.
The result of survival analysis is shown in Table 12 below. First of all, as described above, since our research ended before all of the 2,081 apartment complexes in Seoul had finished RFID adoption, we have right-censored data. In the survival analysis with censored data, we have used a combination of failure dummy and the time spent for adoption. In this data, failure means whether an apartment complex adopted RFID innovation, and time spent means the time spent in RFID adoption by apartment complexes that had finished their implementation by the time our research concluded. Several specific methodologies can be used when doing a survival analysis, but in the first stage, we can divide the methodology into two categories, the non-parametric model and the parametric model. The Cox proportional hazard model, represented in the third column, is one of the best-known non-parametric survival analysis models. The parametric models are differentiated according to which distribution the researcher used for the analysis. In this study, we adopted the exponential distribution model (Model 1) and the Weibull distribution model (Model 2). By running all three non-parametric and parametric models, we expect to gain the robustness of the empirical result.
When we initially interpreted the results of the first model, the models based on exponential distribution, waste-charge difference, apartment price, total number of households, committee, and online information provided by the government are significant. Specifically, the bigger the difference between the waste charge of the RFID-based method and the existing method, the more likely a complex is to adopt the RFID system actively. This result does not support the empirical results of previous studies.
As previous research stated, innovative technology is more likely to be adopted when the cost of technology adoption is low. In the case of the apartment price, number of households, committee, and government-provided information variables, the results are similar to those of previous studies. Specifically, in terms of apartment complex price, in apartment complexes with a higher mean price, RFID technology is adopted more aggressively. This is because an organization with strong financial readiness is more likely to be able to deal with risks that can occur during the adoption process. The next variable is the total number of households in the apartment complex. As can be confirmed from interviews, larger apartment complexes are more likely to adopt the RFID method because they are more capable of managing all of the issues related to RFID adoption, like complaints from local residents or lost cards. The next significant variable is the committee variable. This result implies that an apartment complex that uses the self-management method and has a management committee composed of residents of the apartment complex is more likely to adopt the RFID method. As can be heard from interviews with apartment complex management officers, as whether to adopt the RFID method is a decision made by local residents, there is a higher possibility of implementing the RFID method if there is already a public space for exchanging opinions, such as a community committee [67]. Lastly, the information about RFID provided from the Gu government turns out to be significant in the adoption of RFID system. The more the Gu government is supportive, the higher the possibility of RFID adoption.

5. Discussion and Conclusions

In this study, we analyze the effect of the characteristics of apartment complexes on RFID household-based waste-charging system. The Ministry of Environment and local governments in the Republic of Korea delegate authority to the residents of apartment complexes, so the local residents can decide themselves whether to adopt the innovative RFID system. Previous studies, however, used individual-level survey data to determine the factors of innovation adoption. Using individual-level surveys may cause not only individual fallacies, but also common method bias, due to the inherent limitations of survey data. To avoid these problems, we set the apartment complex as the unit of analysis. In addition, we operationalized variables based on the results of interviews with local government officers, apartment complex managers, and apartment complex residents, and analyzed the effect of variables related to the characteristics of the apartment complex, using hard data collected from various resources.
We ran five empirical models in this study, the logistic regression analysis, pooled OLS analysis, survival analysis. We found several empirical findings on community innovation of food waste management.
Firstly, the waste-charge difference is strongly significant in all five models and its sign is positive. The larger the waste-charge difference between the newly adopted RFID system and the current system, the more likely the apartment complex is to adopt the RFID system. This result does not match the results of previous studies. As Konsynski and Smith [11] pointed out, the cost of technology adoption is an important variable. The higher the cost, the less likely an organization is to adopt innovative technology. From this analysis, however, we can interpret the results as leading to the conclusion that the higher the cost, the more likely a complex is to adopt the RFID technology. This might be due to several reasons. As the waste charge is fairly low, it is not a big concern for local residents [68]. In addition, this seems mainly because the local residents who reside in apartment complexes with a higher level of waste charge might have higher level of interest in fairness. Because the individual incentive-based RFID system is a relatively fair system in comparison with the former system, it is possible that the local residents have a positive perspective on the RFID system.
Secondly, the apartment-price variable is strongly significant in all three of the survival analysis models and its sign is positive, which means that innovative RFID technology is more likely to be adopted in wealthy districts.
Thirdly, the committee variable is strongly significant in four of the five models. As verified from interviews with various individuals, because local residents have the authority to decide whether to adopt the RFID system, it is more likely to be implemented in apartment complexes with management committee, where consensus and interaction is systematically supported.
Lastly, government-provided information is important in RFID adoption. Previous studies did not focus much on the role of the government, but we want to stress the importance of the government in innovation adoption and diffusion.
The implications of this study are as follows. Firstly, unlike previous studies, we set the apartment complex as the unit of analysis when analyzing innovation adoption at the community level. By analyzing the adoption determinants at this level, we can identify the characteristics of the community (the apartment complex) in order to drive innovation adoption. As previous research usually analyzed adoption determinants from an individual point of view, even though innovation adoption is determined at the organizational level, it is hard to identify the exact characteristics of the community. Also, as Kim et al. [69] pointed out, innovation behavior can best be understood when an organization or company is the unit of analysis. Secondly, we can confirm the importance of the community itself in innovation adoption. As we can verify in our empirical results, the committee variable is important in RFID system adoption. Previous literature mainly focused on the support of top managers as an important determinant of innovation, rather than focusing on the ordinary members. As can be seen from result of this study, however, if the members of a community or organization have a positive point of view and motivation to form a consensus, diffusion of innovation will be more likely. In addition, in terms of policy diffusion, this result can support the possibility of democratic policy implementation. In the past, the role of citizens or community members was not very important in policy diffusion and implementation, especially in developing countries where policy was largely monopolized by the government, such as Korea. With decentralization and democratization, however, citizen involvement in policy decision-making is widely sought. As confirmed by this study, citizens’ activism can stimulate innovative policy adoption. Thirdly, citizens’ activism and social consensus can stimulate policy innovation [70]. Local governments can also play an important role by providing information to residents in order to help them to make decisions [71]. Furthermore, community innovation to adopt new technology like RFID in mega-metropolitan areas would provide valuable policy stories for various open innovation strategies for future smart cities in an era of the fourth industrial revolution [72,73].
There are still methodological issues to explore community innovation process. Even though innovation adoption decisions are usually made at an organizational level, previous studies mainly used individual-level survey data to identify the determinants of an organization’s technology adoption. This fact may lead not only to individual fallacies, but also to common method bias. Because we operationalized a conceptual definition of ecological variables based on interview results and ran an empirical analysis using hard data from various sources, we can identify the determinants of RFID system adoption in a more precise way. However, this research still has a limitation to account for various hidden mechanisms involved in community innovation process. Further multilevel research is required to explore how community innovation for new technology is associated with micro, meso, and macro levels of factors across metropolitan cities over time [74,75].

Author Contributions

S.L. and K.J. conceived and designed the research; S.L. and K.J. performed the research; S.L. and K.J. analyzed the data; and S.L. and K.J. wrote the paper.

Funding

This research received no external funding.

Acknowledgments

This research is a revised version of one part of the first author’s Ph.D. dissertation paper.

Conflicts of Interest

The authors declare no conflict of interest.

Appendix A. RFID Adoption by Date

Adoption dateFrequencyPercent
1 January 2013183.46
1 April 20138716.73
1 June 201312223.46
1 July 2013132.5
1 January 201410.19
1 April 201450.96
1 May 2014224.23
1 July 2014183.46
1 September 201440.77
1 November 2014254.81
1 December 2014132.5
1 January 201540.77
1 February 201530.58
1 March 2015326.15
1 April 2015295.58
1 May 2015203.85
1 June 2015122.31
1 July 2015356.73
1 August 201591.73
1 September 2015366.92
1 October 2015122.31

Appendix B. List of Interviewees

IdentificationAgeGenderOccupationApartment Complex
155FemaleHead of management office Jinheung
258MaleHead of management office Hyundai 1
334FemaleStaff of management office Kyungnam
465MaleHead of management office Hyosung
546FemaleResident Woosung 1
672FemaleResident Hyundai 2
754FemaleResidentWoosung 6
845MaleGovernment official in Waste and Cleaning department of Gangnam-
959MaleHead of management office Nature Hill 1
1068MaleHead of management office Nature Hill 2
1132FemaleStaff of management office Nature Hill 3
1238FemaleResident Nature Hill 4
1362MaleResident Star Hill
1464FemaleResidentStar Hill
1538MaleGovernment official in Waste and Cleaning Department of Seocho-
1635MaleGovernment official in Waste and Cleaning Department of Youngdeungpo-
1731MaleGovernment official in Waste and Cleaning Department of Jongro-
1828FemaleGovernment official in Waste and Cleaning Department of Songpa-

References and Notes

  1. Choi, J.H.; Chang, D.K. Prevention of progressive collapse for building structures to member disappearance by accidental actions. J. Loss Prev. Process Indust. 2009, 22, 1016–1019. [Google Scholar] [CrossRef]
  2. Park, K.O. Establishment of the social environment to active communities in apartment housing. J. Kor. Hous. Assoc. 2010, 21, 141–150. [Google Scholar] [CrossRef]
  3. Tornatzky, L.G.; Klein, K.J. Innovation characteristics and innovation adoption-implementation: A meta-analysis of findings. IEEE Trans. Eng. Manag. 1982, 1, 28–45. [Google Scholar] [CrossRef]
  4. Morgan, G. Creative Organization Theory: A Resource Book; Sage: Newbury Park, UK, 1989. [Google Scholar]
  5. Dunleavy, P. Is there a radical approach to public administration? Publ. Admin. 1982, 60, 215–225. [Google Scholar] [CrossRef]
  6. Kim, K.H.; Shin, S.J.; Choi, S.Y.; Yeo, J.H.; Kang, K.S. A study on economical introduction of RFID system in the small and medium 3rd party logistics. J. Kor. Saf. Manag. Sci. 2008, 10, 117–126. [Google Scholar]
  7. Billings, R.S.; Wroten, S.P. Use of path analysis in industrial/organizational psychology: Criticisms and suggestions. J. Appl. Psychol. 1978, 63, 677–688. [Google Scholar] [CrossRef]
  8. KOSIS (Korean Statistical Information Service). Available online: http://kostat.go.kr/portal/korea/index.action (accessed on 18 July 2018).
  9. Homepage Title. Available online: https://www.keco.or.kr/en/core/waste_rfid/contentsid/1984/index.do (accessed on 18 July 2018).
  10. Fenn, J.; Raskino, M. Mastering the Hype Cycle: How to Choose the Right Innovation at the Right Time; Harvard Business Press: Boston, MA, USA, 2008. [Google Scholar]
  11. Konsynski, B.; Smith, H.A. Developments in practice x: Radio frequency identification (RFID)-an internet for physical objects. Comm. Assoc. Inform. Syst. 2003, 12, 301–311. [Google Scholar]
  12. Lai, H.M.; Lin, I.C.; Tseng, L.T. High-level managers’ considerations for RFID adoption in hospitals: An empirical study in Taiwan. J. Med. Syst. 2014, 38, 1–17. [Google Scholar] [CrossRef] [PubMed]
  13. Mehrjerdi, Y. RFID-enabled healthcare systems: Risk-benefit analysis. Int. J. Pharmaceut. Healthc. Market. 2010, 4, 282–300. [Google Scholar] [CrossRef]
  14. Schultz, R.L.; Slevin, D.P. Implementation and management innovation. In Implementing Operations Research and Management Science; Elsevier: New York, NY, USA, 1975; pp. 3–20. [Google Scholar]
  15. Lai, M.L.; Choong, K.F. Motivators, barriers and concerns in adoption of electronic filing system: Survey evidence from Malaysian professional accountants. Am. J. Appl. Sci. 2010, 7, 562–567. [Google Scholar] [CrossRef]
  16. Brown, I.; Russell, J. Radio frequency identification technology: An exploratory study on adoption in the South African retail sector. Int. J. Inform. Manag. 2007, 27, 250–265. [Google Scholar] [CrossRef]
  17. Moore, G.A. Crossing the Chasm (Revised Ed.); Harper Business: New York, NY, USA, 1991. [Google Scholar]
  18. Bradford, M.; Florin, J. Examining the role of innovation diffusion factors on the implementation success of enterprise resource planning systems. Int. J. Account. Inform. Syst. 2003, 4, 205–225. [Google Scholar] [CrossRef]
  19. Wen, L.; Zailani, S.; Fernando, Y. Determinants of RFID adoption in supply chain among manufacturing companies in China: A discriminant analysis. Int. J. Tech. Manag. Innovat. 2009, 4, 22–32. [Google Scholar] [CrossRef]
  20. Grover, V.; Goslar, M.D. The initiation, adoption, and implementation of telecommunications technologies in US organizations. J. Manag. Inform. Syst. 1993, 10, 141–164. [Google Scholar] [CrossRef]
  21. Mintzberg, H. The Structuring of Organizations: A Synthesis of the Research. University of Illinois at Urbana-Champaign’s Academy for Entrepreneurial Leadership Historical Research Reference in Entrepreneurship. 1979. Available online: https://ssrn.com/abstract=1496182 (accessed on 1 September 2018).
  22. Kinsella, B. The Wal-mart factor. Ind. Eng. 2003, 35, 32–37. [Google Scholar]
  23. Steensma, H.K. Acquiring technological competencies through inter-organizational collaboration: An organizational learning perspective. J. Eng. Tech. Manag. 1996, 12, 267–286. [Google Scholar] [CrossRef]
  24. Poston, R.; Grabski, S. Financial impacts of enterprise resource planning implementations. Int. J. Account. Inform. Syst. 2001, 2, 271–294. [Google Scholar] [CrossRef]
  25. Zhu, K.; Kraemer, K.L.; Xu, S. The process of innovation assimilation by firms in different countries: A technology diffusion perspective on e-business. Manag. Sci. 2006, 52, 1557–1576. [Google Scholar] [CrossRef]
  26. Thompson, D. James Madison on Cyber-democracy. In Democracy.com: Governance in a Networked World; Elaine, K., Joseph, N., Eds.; Hollis Publishing Company: Hollis, NH, USA, 1999; pp. 35–42. [Google Scholar]
  27. Min, H.; Park, J.; Kim, H.J. Common method bias in hospitality research: A critical review of literature and an empirical study. Int. J. Hospit. Manag. 2016, 56, 126–135. [Google Scholar] [CrossRef]
  28. Kim, S. Determinants impacting the adoption and implementation of RFID technology and the moderating effect of organizational readiness. J. Inform. Syst. 2010, 19, 149–177. [Google Scholar] [CrossRef]
  29. Lin, C.Y.; Ho, Y.H. RFID technology adoption and supply chain performance: An empirical study in China’s logistics industry. Int. J. Supply Chain Manag. 2009, 14, 369–378. [Google Scholar] [CrossRef]
  30. Ramanathan, R.; Ramanathan, U.; Ko, L.W.L. Adoption of RFID technologies in UK logistics: Moderating roles of size, barcode experience and government support. Expert Syst. Appl. 2014, 41, 230–236. [Google Scholar] [CrossRef] [Green Version]
  31. Grandon, E.E.; Pearson, J.M. Electronic commerce adoption: An empirical study of small and medium US businesses. Inform. Manag. 2004, 42, 197–216. [Google Scholar] [CrossRef]
  32. Venkatesh, V.; Davis, F.D. A theoretical extension of the technology acceptance model: Four longitudinal field studies. Manag. Sci. 2000, 46, 186–204. [Google Scholar] [CrossRef]
  33. Wymer, S.A.; Regan, E.A. Factors influencing e-commerce adoption and use by small and medium businesses. Electron. Market 2005, 15, 438–453. [Google Scholar] [CrossRef]
  34. Iacovou, C.L.; Benbasat, I.; Dexter, A.S. Electronic data interchange and small organizations: Adoption and impact of technology. MIS Q. 1995, 19, 465–485. [Google Scholar] [CrossRef]
  35. Caldeira, M.M.; Ward, J.M. Understanding the successful adoption and use of IS/IT in SMEs: An explanation from Portuguese manufacturing industries. Inform. Syst. J. 2002, 12, 121–152. [Google Scholar] [CrossRef]
  36. Lee, J.B.; Lee, S.C.; Lee, H.S.; Lee, H.C. An analysis of environmental factor and organization factors in RFID adoption: Based on moderating effect of firms. J. Inform. Syst. 2006, 15, 213–236. [Google Scholar]
  37. Dosi, G. The research on innovation diffusion: An assessment. In Diffusion of Technologies and Social Behavior; Springer: Berlin, Germany, 1991; pp. 179–208. [Google Scholar]
  38. Xu, S.; Zhu, K.; Gibbs, J. Global technology, local adoption: A Cross-Country investigation of internet adoption by companies in the united states and china. Electron. Market. 2004, 14, 13–24. [Google Scholar] [CrossRef]
  39. Lee, M.S. An empirical study on the effect of trust and RFID technology acceptance. Kor. J. Bus. Admin. 2008, 16, 47–81. [Google Scholar]
  40. McKnight, D.H.; Choudhury, V.; Kacmar, C. Developing and validating trust measures for e-commerce: An integrative typology. Inform. Syst. Res. 2002, 13, 334–359. [Google Scholar] [CrossRef]
  41. Gefen, D.; Karahanna, E.; Straub, D.W. Trust and TAM in online shopping: An integrated model. MIS Q. 2003, 27, 51–90. [Google Scholar] [CrossRef]
  42. Rogers, E.M. Diffusion of Innovations (5th Edition); Simon and Schuster: New York, NY, USA, 2003. [Google Scholar]
  43. Davis, F.D. A technology acceptance model for empirically testing new end-user information systems: Theory and results. Ph.D. Dissertation, Massachusetts Institute of Technology, MA, USA, 1985. [Google Scholar]
  44. Sears, G.J.; Baba, V.V. Toward a multistage, multilevel theory of innovation. Can. J. Admin. Sci. 2011, 28, 357–372. [Google Scholar] [CrossRef]
  45. Jun, S.P. A comparative study of hype cycles among actors within the socio-technical system: With a focus on the case study of hybrid cars. Technol. Forecast. Soc. Change. 2012, 79, 1413–1430. [Google Scholar] [CrossRef]
  46. Jarvenpaa, H.; Makinen, S.J. Empirically detecting the Hype Cycle with the life cycle indicators: An exploratory analysis of three technologies. In Proceedings of the 008 IEEE International Conference on Industrial Engineering and Engineering Management, Snigapore, 8–11 December 2008; pp. 12–16. [Google Scholar]
  47. Steinert, M.; Leifer, L. Scrutinizing Gartner’s hype cycle approach. In Proceedings of the Technology Management for Global Economic Growth (PICMET); IEEE: Piscataway, NJ, USA, 2010; pp. 1–13. [Google Scholar]
  48. Ruef, A.; Markard, J. What happens after a hype? How changing expectations affected innovation activities in the case of stationary fuel cells. Tech. Anal. Strat. Manag. 2010, 22, 317–338. [Google Scholar] [CrossRef]
  49. McPherson, M.S.; Bacow, L.S. Online higher education: Beyond the hype cycle. J. Econ. Perspect. 2015, 29, 135–154. [Google Scholar] [CrossRef]
  50. Van Lente, H.; Spitters, C.; Peine, A. Comparing technological hype cycles: Towards a theory. Technol. Forecast. Soc. Change. 2013, 80, 1615–1628. [Google Scholar] [CrossRef]
  51. Van Lente, H.; Bakker, S. Competing expectations: The case of hydrogen storage technologies. Tech. Anal. Strat. Manag. 2010, 22, 693–709. [Google Scholar] [CrossRef]
  52. The Korean Government has been legally required to release governmental data to the public through its website, https://www.open.go.kr/ since 1996 ([53]). The main sources of public information and data are central and local governments, particularly local government, as it is less likely to deal with issues related to national security and defense [54]. The government can refuse to release information that might compromise national security.
  53. Lee, S.; Jung, K. A meta-analysis of determinants of RFID adoption around the world: Organization, technology, and public policy. Asia Pac. J. Innovat. Enterpren. 2016, 10, 67–90. [Google Scholar] [CrossRef]
  54. Jung, K.; Lee, S. A systematic review of RFID applications and diffusion: key areas and public policy issues. J. Open Innovat.: Tech. Market Complex. 2015, 1, 9. [Google Scholar] [CrossRef]
  55. Zailani, S.; Govindan, K.; Iranmanesh, M.; Shaharudin, M.R.; Chong, Y.S. Green innovation adoption in automotive supply chain: The Malaysian case. J. Cleaner Prod. 2015, 108, 1115–1122. [Google Scholar] [CrossRef]
  56. Tsai, W.C.; Tang, L.L. A model of the adoption of radio frequency identification technology: The case of logistics service firms. J. Eng. Tech. Manag. 2012, 29, 131–151. [Google Scholar] [CrossRef]
  57. “There is almost no cost for people to buy the RFID machine. In fact, this is a project to be carried out by the Ministry of Environment, so the central government invests and supports in many cases purchasing the machine… They wanted to go fast more than anything.” (Seoul Metropolitan City Government Officer). “The people who live in the apartment complex…do not have to pay for the machine. But instead the RFID method has a higher waste charge than the former system.” (Gu Government Officer)
  58. Wang, Y.B.; Lin, K.Y.; Chang, L.; Hung, J.C. A diffusion of innovations approach to investigate the RFID adoption in Taiwan logistics industry. J. Comput. 2011, 6, 441–448. [Google Scholar] [CrossRef]
  59. “Yes indeed. Residents who used individual heating were more interested in that (RFID) method. It’s familiar, isn’t it? They are accustomed to this… They want to continue the way they did.” (head of apartment complex management office)
  60. “Well...there is possibility that the machine breaks down in the middle, and also that the residents do not know how to use it at first….They can lose their RFID card as well. If you lose it, the manager who works in the apartment complex management office will pick up the master card key and open the machine…because every resident wants to throw food waste away faster…you know the smell…so you can see that you can only adopt the RFID system in a large apartment complex where there are many households and managers… It’s natural.”
  61. “The rich people do not care much about the method of throwing away waste. Good is good….The Gu government asked us to adopt a new system because it’s good. You know, this district is one of the wealthiest districts in Seoul. We do not care about the cost, actually. We are willing to follow the Gu government’s rule as long as it is convenient and efficient enough.”
  62. “When the Gu government suggests that people implement the new system, it is the residents who decide whether to adopt it or not, not the local government… So the Gu government held public hearings to persuade people and we sent a representative. Our apartment complex has its own management committee, so we meet often. So it was easy to decide who to send to the public hearing or whether to adopt the RFID method or something….There is a person and it is easy to have conversations with each other in our apartment. We kept gathering.”
  63. Asif, Z. Integrating the supply chain with RFID: A technical and business analysis. Comm. Assoc. Inform. Syst. 2005, 15, 24. [Google Scholar]
  64. “We manage the system. The managers can use RFID cards to help the residents throw food waste away whenever they lose the card…and we clean the site. Without us, no one can realistically manage and operate the RFID system… Who will fix all the problems immediately?”. “Without the managers from the management office, we cannot manage. When we first tried to adopt the RFID system, we also advertised that we would prefer an apartment complex with a large management office and a sufficient number of management personnel.
  65. “We held a public hearing so that we could explain the effectiveness and efficiency of this new system. Also, we usually update the documents about public hearings and other materials that relate to the RFID system on our webpage… Everyone knows how to search for information on the internet and they check the information through the internet… so we upload the files.”. “Homepage? We upload a lot of things….We usually upload our promotional materials and other public hearing materials… I also upload what local residents need often…if our district’s case or information about RFID come up as a press article, it will be uploaded as a link.”
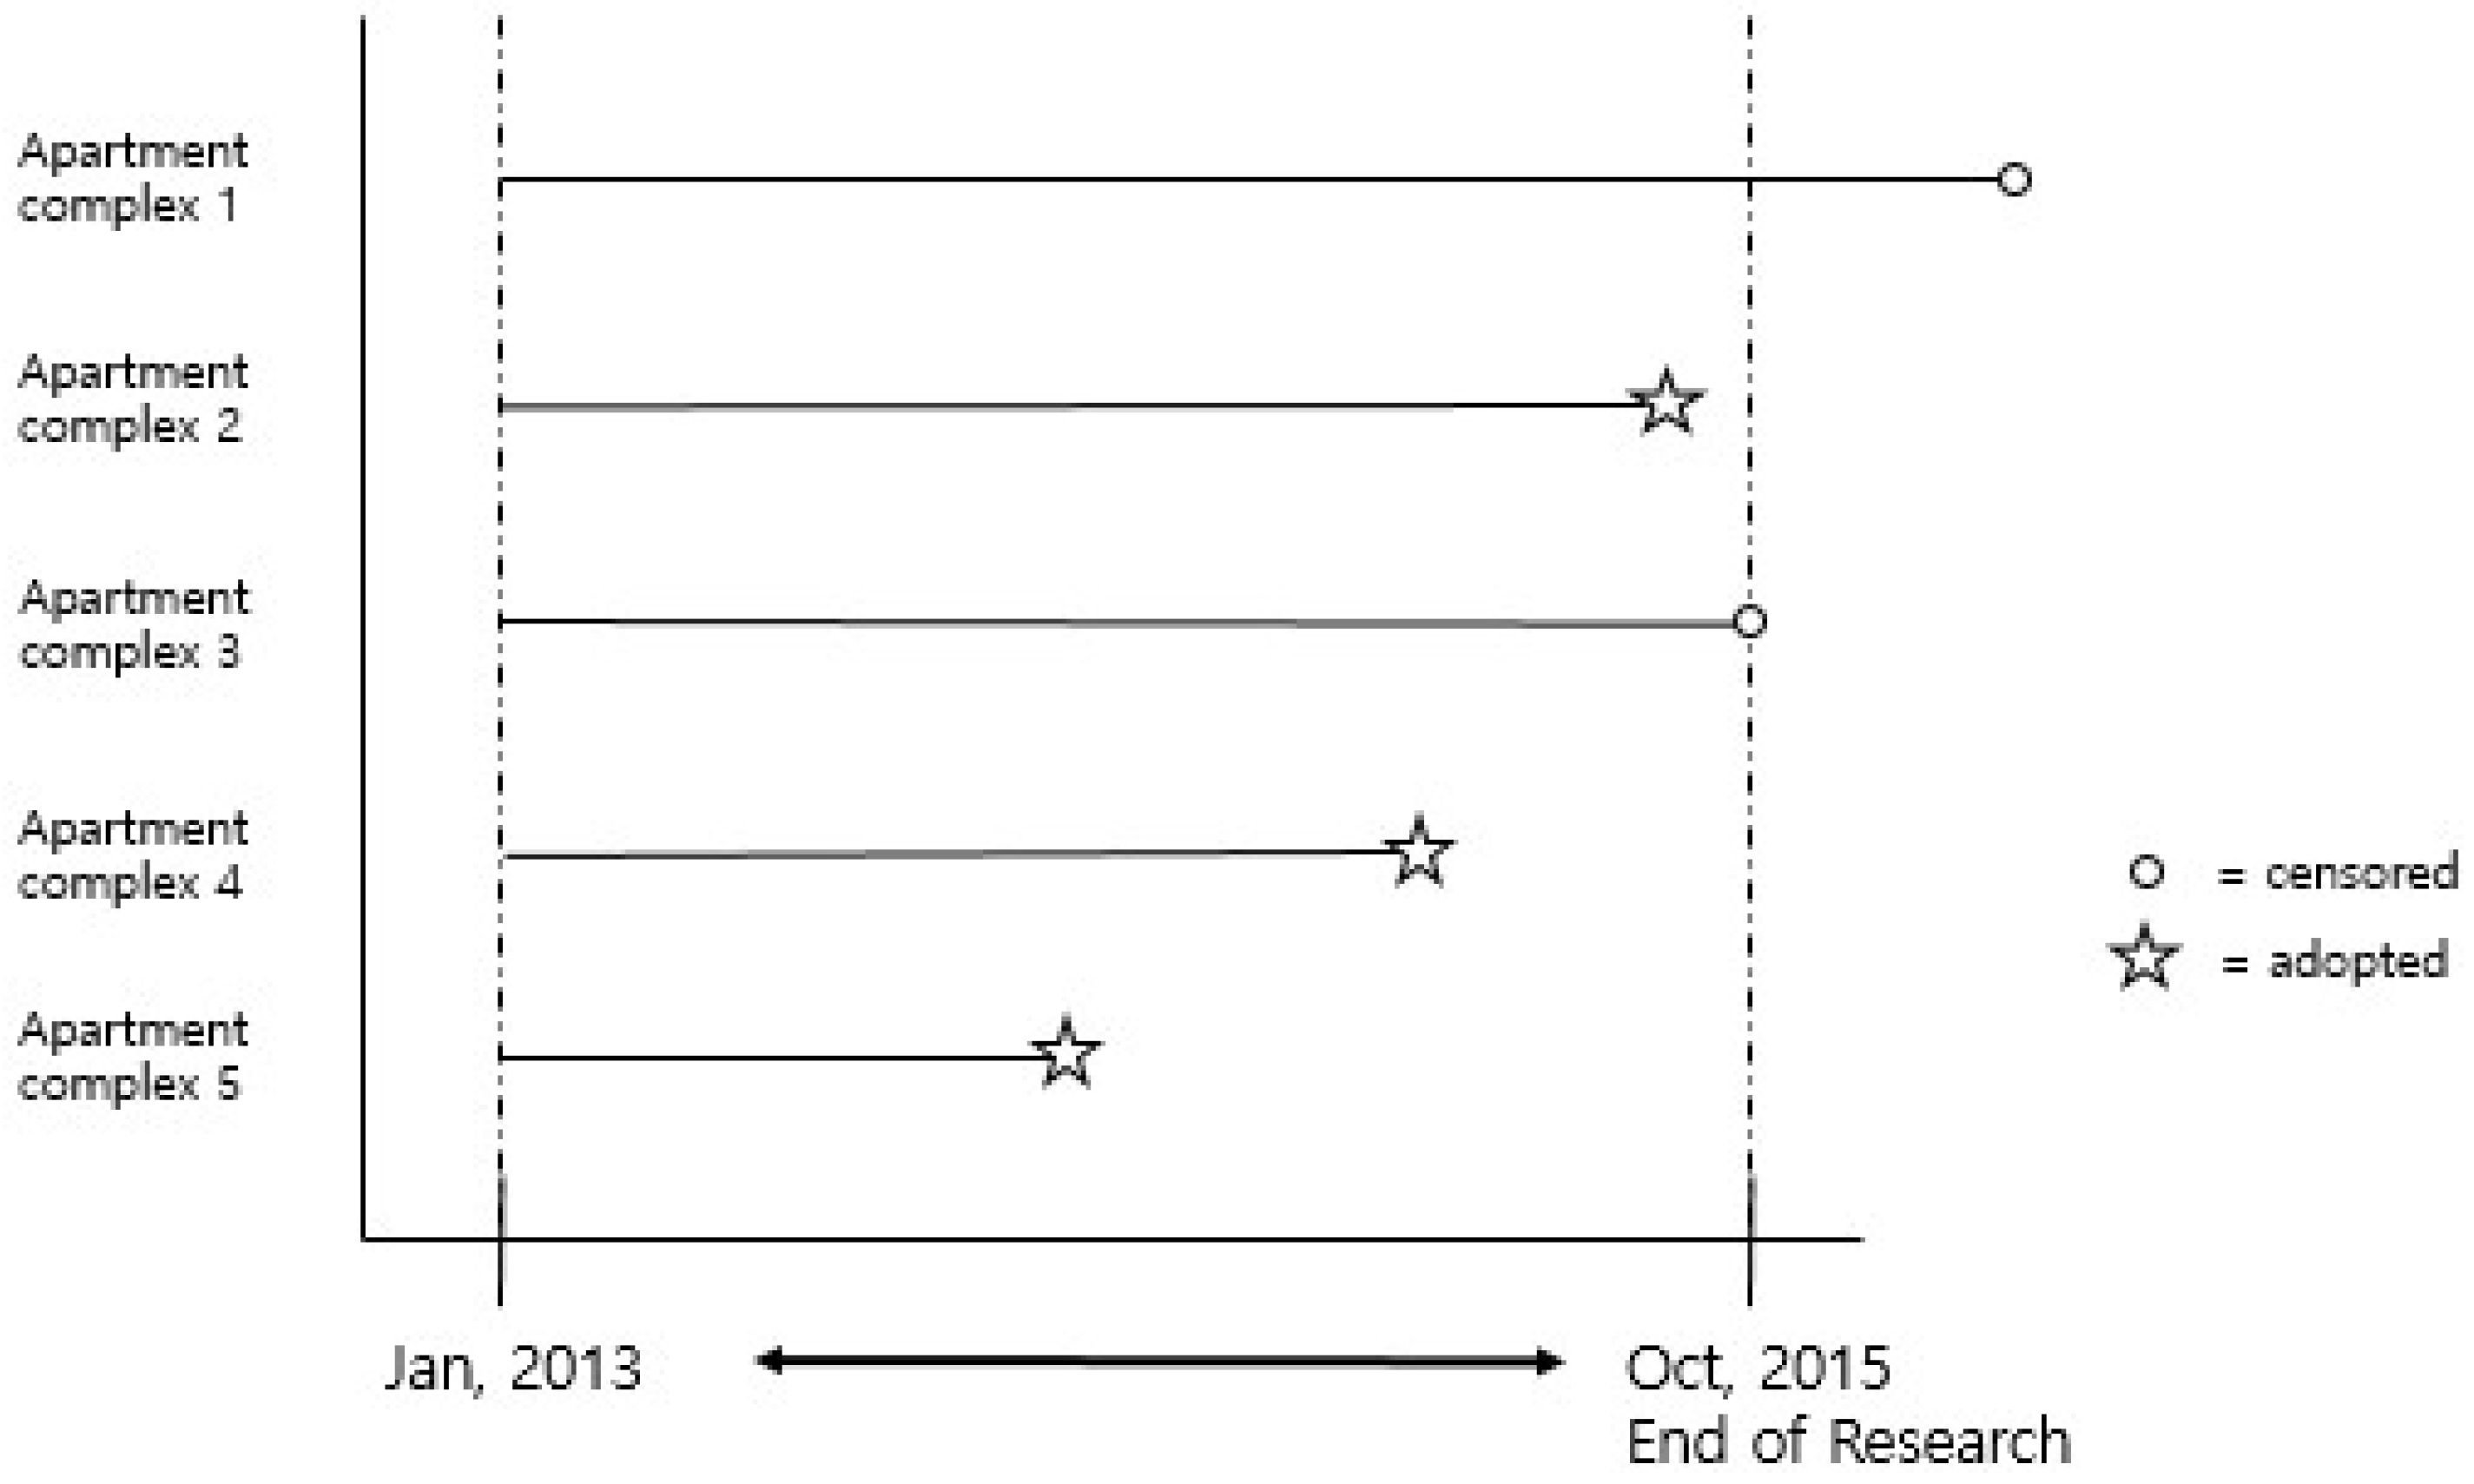
  66. Kleinbaum, D.G.; Klein, M. Evaluating the proportional hazards assumption. In Survival Analysis; Springer: New York, NY, USA, 2012; pp. 161–200. [Google Scholar]
  67. For instance, let’s look at a case of Cheunggu apartment complex and Hyundai apartment complex in the jurisdiction of Yeongdeungpo-Gu in Seoul City. Both of these apartment complexes were constructed in the 1990s, and the number of householders in these two complexes are similar to two hundred ones. There is, however, an apartment self-governing committee at the Cheunggu aparment complex, but not at the Hyundai apartment complex. In June 2013, the Cheunggu apartment complex adopted the RFID based food waste method. On the other hand, the Hyundai apartment complex have not the RFID method since the 2013 policy reform of food waste management. The self-governing committee contributed to adopting the RFID system as an early adopter through its connecting role to facilitate engagement and deliberation at community agenda. As of 2016, 80% of the apartment complexes in Yeongdeungpo-Gu area that do not adopt RFID system have no self-government committee. Apartment complexes with the self-governing committee are likely to adopt the RFID food waste disposal method.
  68. “You know… the waste charge is not that expensive… It is about the same as a kid’s snacks and a cookie. Nobody cares about such a cheap price.” (apartment complex management office manager)
  69. Kim, J.Y.; Choi, D.S.; Sung, C.S.; Park, J.Y. The role of problem solving ability on innovative behavior and opportunity recognition in university students. J. Open Innovat. Tech. Market Complex. 2018, 4, 4. [Google Scholar] [CrossRef]
  70. Egbetokun, A.; Oluwadare, A.J.; Ajao, B.F.; Jegede, O.O. Innovation systems research: An agenda for developing countries. J. Open Innovat. Tech. Market Complex. 2017, 3, 25. [Google Scholar] [CrossRef]
  71. Park, E.; Lee, J.W. A study on policy literacy and public attitudes toward government innovation focusing on Government 3.0 in South Korea. J. Open Innovat. Tech. Market Complex. 2015, 1, 23. [Google Scholar] [CrossRef]
  72. Trindade, E.P.; Hinnig, M.P.F.; da Costa, E.M.; Marques, J.S.; Bastos, R.C.; Yigitcanlar, T. Sustainable development of smart cities: A systematic review of the literature. J. Open Innovat. Tech. Market Complex. 2017, 3, 11. [Google Scholar] [CrossRef]
  73. Lee, M.; Yun, J.J.; Pyka, A.; Won, D.; Kodama, F.; Schiuma, G.; Yan, M.R. How to respond to the fourth industrial revolution, or the second information technology revolution? Dynamic new combinations between technology, market, and society through open innovation. J. Open Innovat. Tech. Market Complex. 2018, 4, 21. [Google Scholar] [CrossRef]
  74. Kim, P.H.; Wennberg, K.; Croidieu, G. Untapped riches of meso-level applications in multilevel entrepreneurship mechanisms. Acad. Manag. Perspect. 2016, 30, 273–291. [Google Scholar] [CrossRef]
  75. Jepperson, R.; Meyer, J.W. Multiple levels of analysis and the limitations of methodological individualisms. Socio. Theor. 2011, 29, 54–73. [Google Scholar] [CrossRef]
Figure 1. Radio frequency identification (RFID) machine (source: own).
Sustainability 10 03125 g001
Figure 2. Right-censored survival analysis data. Source: own.
Sustainability 10 03125 g002
Figure 3. Analytical frame. Source: own
Sustainability 10 03125 g003
Figure 4. Frequency and cumulative frequency graph of RFID adoption.
Sustainability 10 03125 g004
Figure 5. Frequency graph of RFID-adopted and non-adopted apartment complexes.
Sustainability 10 03125 g005
Figure 6. Cumulative hazard function graph of RFID adoption.
Sustainability 10 03125 g006
Figure 7. Survival function graph of RFID adoption.
Sustainability 10 03125 g007
Table 1. Food waste generation (unit: ton per day).
Year2007200820092010201120122013201420152016
Nation12,02512,40612,04211,58111,42911,49811,01011,73713,32613,542
Change -3.17%−2.93%−3.83%−1.31%0.60%−4.24%6.60%13.54%1.62%
Seoul2833298029072890276428372609279729672881
Change -5.19%−2.45%−0.58%−4.36%2.64%−8.04%7.21%6.08%−2.90%
Source: Authors recalculated the data from the Korean Statistical Information Service (KOSIS) [8].
Table 2. Current system of food waste disposal in the Republic of Korea.
TypeRFID Weight MethodChip (Container)Garbage Bag
Recognition of individual discarderElectronic cardNot applicableNot applicable
Measuring unitWeightVolume sizeVolume size
Imposition of feesBy householdBy household or apartment complexBy household
Payment of feesDeferred paymentPrepaid paymentPrepaid payment
ContainersRFID weighing systemA standard container with identification chipStandard bags (1,2,3,5,10, and 20 ℓ)
Source: own.
Table 3. Type of food waste disposal method after the 2013 food waste reform in Seoul.
Housing ContainerDistrict of Seoul (“Gu“)
Single dwelling unit (detached housing)Before 2013BagsDobong, Dongdaemun, Dongjak, Eunpyeong, Gangbuk, Gangdong, Geumcheon, Guro, Gwanak, Gwangjin, Jongno, Jungu, Jungnang, Mapo, Seodaemun, Seongbuk, Seongdong, and Yongsan
After 2013BagsGangnam, Gangseo, Seocho, Yangcheon, and Yeongdeungpo
Food waste containersNowon and Songpa
Multi-family housing (after 2013)HouseholdBagsGangnam, Gangseo, Jongno, Seocho, Yangcheon
RFID container (whole area)Geumcheon, and Yeongdeungpo
RFID container (partial area)Gangseo, Songpa, and Yongsan
ComplexRFID truck system)Dobong, Guro, and Mapo
Containers (chips and stickers)Dongdaemun, Dongjak, Eunpyeong, Gangbuk, Gangdong, Gwanak, Gwangjin, Jongno, Jungu, Jungnang, Nowon, Seodaemun, Seongbuk, Seongdong, and Yongsan
Source: own.
Table 4. Diffusion process of RFID based food waste method in the Republic of Korea.
Diffusion processPilot Project1Pilot Project2201520162017Total
(2010–2011)(2012–2014)
Local government188516108137
Households (thousands)170194047052014503550
RFID-food waste equipment230732,61810,16011,07110,54566,701
Source: Korea Environment Corporation’s website. Retrieved 18 July 2018, from https://www.keco.or.kr/en/core/waste_rfid/contentsid/1984/index.do [9]. Copyright © 2017 K-eco. Reprinted with permission.
Table 5. Questionnaires of previous studies.
FactorDimensionQuestionnaireStudy
Technology factorsTechnological readinessAre you familiar with RFID technology?Lin and Ho [29],
Do you have enough information about RFID technology?
Technology compatibilityIs the RFID technology compatible with your current system?Ramamurthy et al. [30], Grandon and Pearson [31], and Venkatesh and Davis [32]
Is RFID technology practical for your field?
Is RFID technology compatible with the current vision, virtue, and strategy of your organization?
CostIs the operation expensive?Wymer and Regan [33], and Iacovou et al. [34]
Is education and training expensive?
Is the cost of maintaining the technology high?
Organization factorsTop manager supportIs there enough support from the top managers?Caldeira and Ward [35]
Do you think the top managers consider RFID adoption as an important issue?
Size of the organizationDo you think your organization is large enough to adopt RFID?Lee et al. [36]
Internal readinessIs there solid internal readiness for RFID adoption?Kinsella [22]
Financial readinessIs the financial readiness of your organization very high?Dosi [37], and Iacovou et al. [34]
External factorsExternal pressureAre most similar organizations adopting RFID technology?Wymer and Regan [33]
Are competitors applying RFID success models?
Government supportDoes the government provide incentives for RFID adoption?Xu et al. [38], Lee [39], McKnight et al. [40], and Gefen et al. [41]
Does the government provide enough information about RFID?
Do you think the current level of government support is enough?
Source: own.
Table 6. Research method process.
Literature review▷ Review relevant literature in innovation adoption and revised TOE model
Research frame▷ Exploring relevant factors of community governance and government role
▷ Introducing TCG model (technology, community governance, and government)
Research method▷ Using interviews from the management office of apartment complexes and local government officials
▷ Using community level variables from the Ministry of Environment
Empirical analysis▷ OLS and survival analyses
Source: own.
Table 7. Variable measurement.
VariableNameDescriptionDefinitionSource
Dependent variableRFID adoptionWhether RFID was adopted in the apartment complex as of 1 October 2015Adopted = 1,
Not adopted = 0
Seoul City government
Survive_lengthTime taken to adopt RFID technology (unit: day)Numerical
Independent variableCharge_differenceDifference between RFID waste fee and the waste fee of the former methodNumerical Gu government
Heating_individualMethod of heatingIndividual heating = 1
Central heating = 0
k-apt system (central government)
N_householdNumber of households in each apartment complexNumericalGu government
Apt_priceApartment price NumericalKorean Appraisal Board
Committee Existence of community-led management committeeCommittee exist = 1, not exist = 0k-apt system (Ministry of Land, Infrastructure and Transport))
ManagerNumber of managers working in the apartment complex management office Numerical
Gov_infoTotal number of bulletin board messages about RFID method uploaded to the Gu government webpage as of 1 October 2015NumericalGu government
Source: own
Table 8. Descriptive statistics of RFID adoption.
RFIDFrequencyPercentCumulative
Not adopted156175.0175.01
Adopted52024.99100
Total2081100
Table 9. Descriptive statistics of continuous variable.
VariablesSample SizeMeanStandard DeviationMinimumMaximum
Charge_difference208140.448.081968
N_household2081618.23651.57406864
Apt_price16981851.3012,133.1824814,200
Gov_info208127.7729.160126
Manager208115.88116.9202944
Table 10. Descriptive statistics of categorical variable.
VariablesCategoryFrequencyPercent
Heating_individualIndividual heating137466.03
Central heating70733.97
CommitteeCommittee27713.31
Commission management180486.69
Table 11. Results of logit and OLS analyses.
Independent VariablesModel 1: Logit AnalysisModel 2: Pooled OLS
Odds RatioCoefficient
Charge_difference1.069
(0.009)
0.010
(0.001)
Heating_individual0.981
(0.154)
0.029
(0.022)
N_household1.000 ***
(0.0001)
0.0001
(0.0001)
Apt_price0.997 ***
(0.0004)
−3.56 × 10⁻⁷
(8.15 × 10⁻⁷)
Committee1.235 ***
(0.230)
0.008
(0.028)
Manager0.999
(0.0005)
−0.0004
(0.0007)
Gov_info1.036 ***
(0.002)
0.006
(0.0003)
Intercept0.036 ***
(0.169)
−0.350 ***
(0.054)
Note: numbers in parentheses are standard errors. (* p <0.10, ** p < 0.01, *** p < 0.05).
Table 12. Results of the survival analysis.
VariableModel 1: Exponential Distribution ModelModel 2: Weibull Distribution ModelModel 3: Cox Proportional Hazard Model
Hazard RatioHazard RatioHazard Ratio
Charge_difference1.604 ***
(0.009)
1.604 ***
(0.009)
1.064 ***
(0.009)
Heating_individual1.113
(0.144)
1.124
(0.145)
1.124
(0.145)
N_household1.000 ***
(0.0001)
1.000 ***
(0.0001)
1.000 ***
(0.0001)
Apt_price0.998 ***
(0.0001)
0.998 ***
(0.0001)
0.998 ***
(0.0001)
Manager1.000
(0.0001)
1.000
(0.0001)
1.000
(0.0001)
Committee1.460 ***
(0.228)
1.482 ***
(0.232)
1.482 ***
(0.232)
Gov_info1.031 ***
(0.002)
1.032 ***
(0.002)
1.032 ***
(0.002)
Intercept0.0001
(0.0001)
0.0001
(0.0002)
0.0001
(0.0001)
Number of observation 168316831683
Log Likelihood−938.47−922−2292.13
LR Chi_squared432.54455.99469.27
Note: numbers in parentheses are standard errors (* p < 0.10, ** p < 0.01, *** p < 0.05).

