1. Introduction
China is the country of origin of the tea tree and was also the first country in the world to discover and use tea [
1]. China’s tea industry has developed rapidly since the beginning of the 21st century. The tea yield has increased from 683,000 tons in 2000 to 2,249,000 tons in 2015, with an average annual growth rate of 8.3%. By 2015, China’s tea production accounted for 43.1% of the world’s total, and the tea planting area reached 2.87 million hectares, accounting for about 50% of the global tea garden area. With rising living standards of residents, and continuous advancement by scholars in tea and health research, it can be predicted that the scale of tea production in China will continue to expand over time [
2]. The tea industry has become an important pillar industry in the rural economies of the main production areas. It has played an important role in promoting agricultural restructuring, increasing farmers’ income, maintaining the ecological environment in the mountains, and advancing rural rejuvenation strategies.
At present, there are still many unsustainable issues in the development of China’s tea industry. The proportion of clonal tea plantations is small and the yield is low, so they cannot meet the large-scale demand of the market for high-quality tea products. The low degree of standardized production directly affects the quality and safety of tea products. Moreover, obsolete tea processing facilities lead to lower labor productivity. The traditional decentralized layout and small tea factories have created a contradiction between small production and large markets, which has become increasingly prominent. In addition, due to the continuous expansion in the size of the market, some regions have blindly increased tea cultivation to obtain economic benefits, ignoring the restrictions of natural conditions. This behavior has caused some damage to the ecological environment [
3,
4]. Clearly, optimizing the tea production layout is crucial for the sustainable development of the tea industry as well as ecological protection. In the new era, the development of the tea industry is in urgent need of transformation, and the spatial distribution of tea production is also facing major adjustments [
5]. Given this background, it is of great practical significance to clarify the temporal and spatial dynamics of China’s tea production and grasp the key influencing factors to formulate macroeconomic policies for tea industry development and optimize tea spatial layout.
Existing research on the spatial–temporal dynamics of tea production mainly analyzes the aspects of spatial agglomeration and characteristics of barycenter curves. Xu et al. [
6] found that China’s tea production was significantly concentrated in South China and South Central China during the period from 1994 to 2004. Xiao et al. [
5] used a concentration index and barycentric analysis method to study the temporal and spatial changes in Chinese tea production from 1986 to 2015 and found that the barycenter of tea production gradually moved from the east to the west. Guizhou, Guangxi, and Sichuan provinces in southwestern China had gradually become the new concentrated tea production regions. In addition, some scholars found that tea production was more spatially concentrated [
7,
8] and believed that spatial agglomeration had a positive effect on the development of the tea industry [
9]. Moreover, tea is an agricultural product, and the geographical distribution of its production follows certain rules. So, what are the influencing factors behind its spatial–temporal dynamics? Scholars believe that the main influencing factors include natural features such as temperature, precipitation, and topography [
10,
11,
12], as well as socio-economic factors, such as location condition, agricultural production structure, market concentration and orientation, technological level, and labor cost [
6,
7,
13].
In a comprehensive analysis of existing literature, we found that there are two aspects worth further study. First, in the study of spatial patterns, most studies used tea production data at the provincial level, ignoring differences in spatial distribution within provinces. Therefore, to improve the accuracy of spatial analysis, research must be conducted on a smaller spatial scale. Second, existing research has only carried out qualitative discussions of influencing factors, lacking analysis of theoretical frameworks and application of quantitative analysis methods. In addition, there is still a lack of discussion about government guidance, which has a significant impact on China’s agricultural development. Therefore, existing studies could not provide an effective answer regarding the spatial and temporal dynamics of tea production.
For further in-depth study, we apply the Herfindahl index and exploratory spatial data analysis using the prefecture as the basic spatial unit. We first reveal the temporal and spatial characteristics of China’s tea production from 2000 to 2015 from the aspects of spatial agglomeration, pattern changes, and spatial correlation. Then, using quantitative methods, three aspects of influencing factors are evaluated: resource endowments, New Economic Geography (NEG) factors, and government guidance.
The remainder of this article is structured as follows.
Section 2 theoretically discusses the influencing factors of tea production spatial distribution.
Section 3 introduces the data and primary methods used in the analysis.
Section 4 describes spatial–temporal dynamics of tea production, and
Section 5 uses a spatial econometric model to empirically study the influencing factors.
Section 6 concludes with a summary of the major findings and their policy implications.
2. Theoretical Analysis
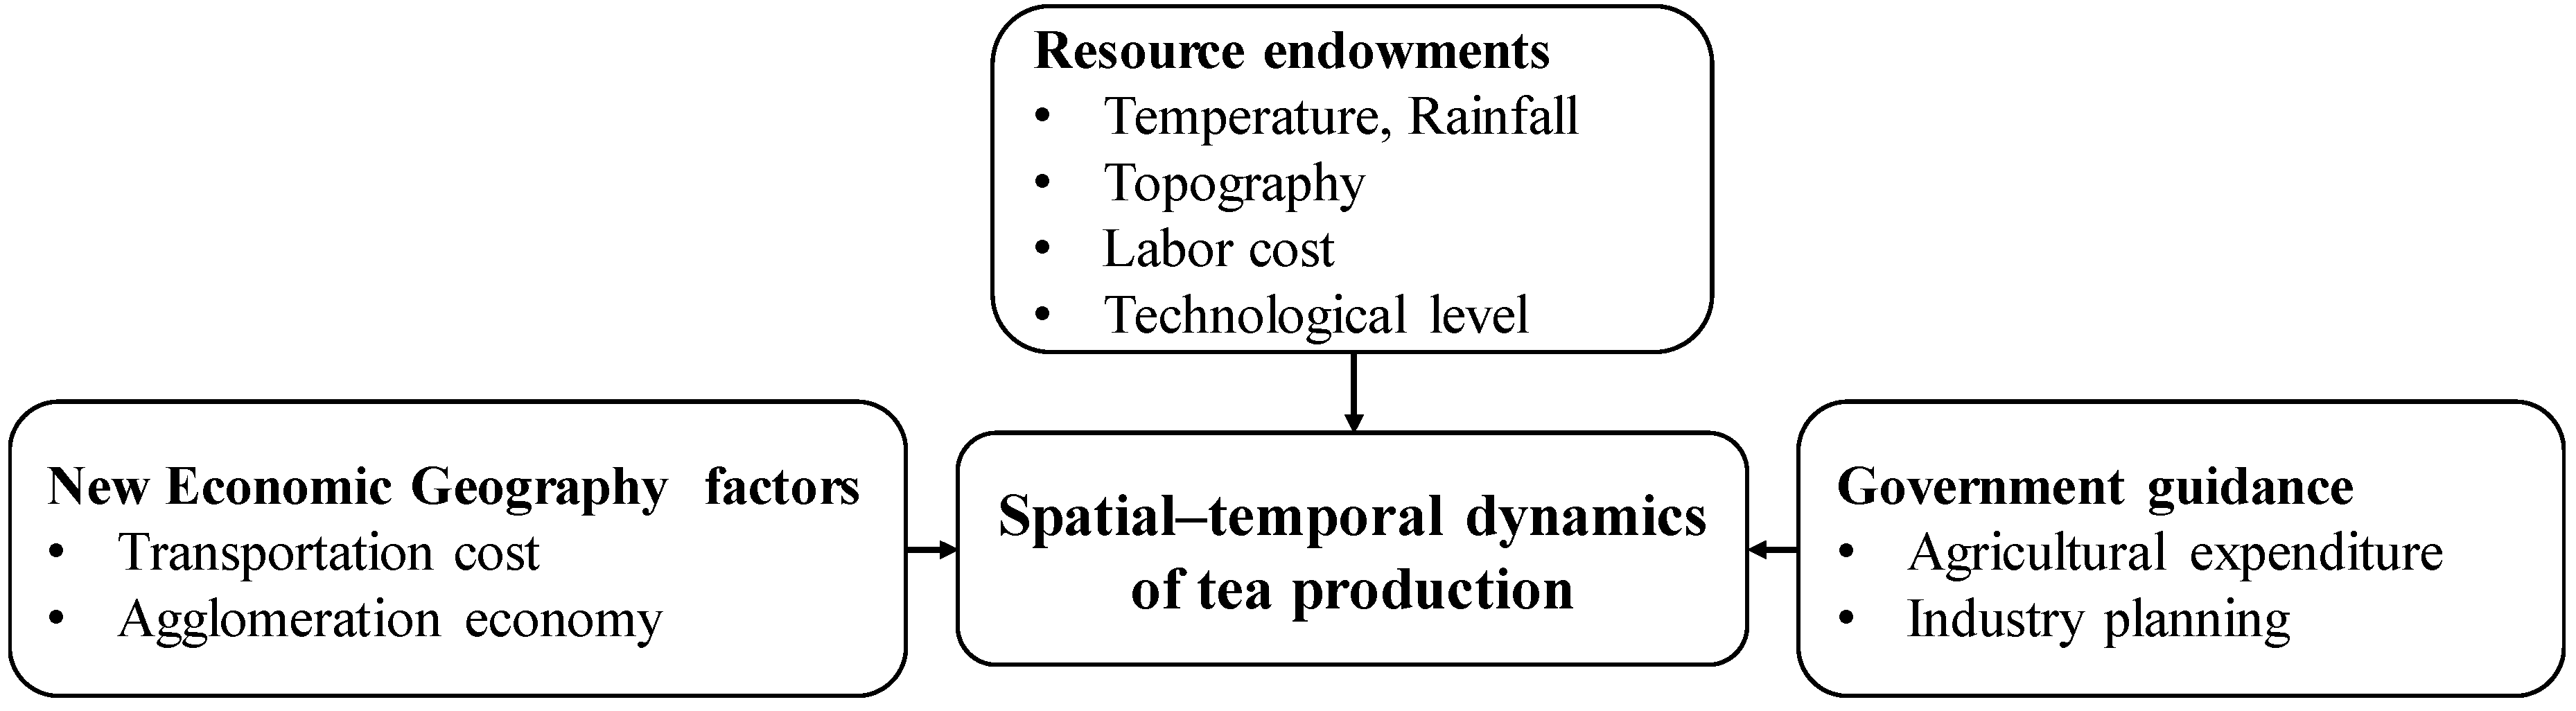
There are various factors that drive the geographical location of tea production. Theoretically, it has been thought that resource endowments and New Economic Geography (NEG) factors jointly affect the spatial distribution of agriculture. Most of the empirical studies on agricultural production location have been conducted from these two aspects [
14,
15]. However, the government also played an important role in the formation of agricultural production patterns in China [
16]. In addition, with the rapid growth of demand in the tea market, as well as the significant increase in traffic conditions and technological level, the NEG factors are becoming increasingly important. Therefore, this study attempts to explain three aspects of the spatial–temporal dynamics of China’s tea production: resource endowments, NEG factors and government guidance (see
Figure 1).
2.1. Resource Endowments
Traditional resource endowment theory emphasizes that industrial location is influenced by exogenous resource endowments such as natural resources, labor force, and technology [
17,
18], reasoning that comparative advantages lead to industrial location. Therefore, resource-dependent industries usually gather where resources are located. First, as a type of crop, the growth of tea trees and the quality of tea products have strict requirements in relation to natural factors such as temperature, precipitation, and topography. The average daily temperature for suitable growth of tea trees is between 15 and 30 °C, while the average annual temperature in suitable areas for planting should be between 15 and 25 °C; the accumulated temperature ≥10 °C should exceed 3000 °C; and the precipitation should exceed 750 mm [
19]. Therefore, tea trees prefer a warm and humid climate, and tend to be distributed in hilly regions where there is plenty of rainfall, more clouds and fog, less sunshine, and higher relative humidity. Second, tea is a typical labor-intensive product. Many industrial chain links require a large amount of labor, including tea planting, tea picking, processing, and sales. As a result, tea production is very sensitive to increases in labor costs. If labor costs in a tea-producing region are increased enough that enterprises lose their profits, tea production may shift to other regions with lower labor costs. In addition, from tea planting to tea processing, specialized technical support is required, including propagation of good tea varieties, construction of high-standard tea gardens, prevention of pests and diseases, and clean processing of tea [
20]. The promotion of tea technology can provide strong support for enterprises and tea farmers, so regions with high technological levels have significant advantages in expanding the scale of tea production and attracting tea enterprises. In general, natural factors provide the initial conditions for tea production agglomeration. Such a pattern is difficult to change in a short time. Economic factors, such as labor costs and technology, have changed along with the process of industrialization and urbanization, and have prompted new changes in the spatial distribution of tea production.
2.2. New Economic Geography (NEG) Factors
The NEG model emphasizes that industrial agglomeration is formed by the interaction between transportation costs and economies of scale, which completely endogenizes the industrial location decision [
21,
22]. Meanwhile, the NEG model proposes that industrial location caused by sporadic historical factors may also induce path dependence effects. Due to the effects of cyclical causality and industrial linkages, the layout of newly built enterprises depends on the foundation of regional historical industries [
23]. The rapid development of China’s transportation network and logistics technology has greatly reduced the tea industry’s transportation costs. In addition, tea cultivation in China has a long history. Natural advantages have resulted in some ecologically suitable areas becoming the original agglomeration regions for tea production. However, in recent years, to cope with the contradiction between small-scale production and large-scale markets, many regions have vigorously promoted the construction of high-standard tea gardens in accordance with the principles of scale, standardization, and spatial concentration. These contribute, to some extent, to the spatial agglomeration of tea production. Economies of scale can not only reduce transaction costs through industry linkages, but can also bring the benefits of increasing returns to scale [
24,
25,
26].
2.3. Government Guidance
The spatial pattern of China’s existing agricultural production is obviously affected by the government’s planning and regulation. Since the founding of New China, the government has attached great importance to the role of regional planning in the adjustment of agricultural production patterns. According to different production conditions and resource endowments, agricultural regional planning reasonably arranges agricultural planting structures, based on which various levels of government within China implement agricultural production layouts [
27]. In 1979, the Tea Research Institute of the Chinese Academy of Agricultural Sciences first carried out regional tea planning, which resulted in the division of suitable tea regions and corresponding varieties, and proposed a plan for adjusting the tea industry’s structure and layout of commodity bases [
28]. This has become an important scientific foundation for the government’s guidance on tea production layout, and has had a profound impact on the spatial tea distribution in China. With the dramatic increase in the size of the tea market and the drastic changes in the spatial patterns of tea production, the Ministry of Agriculture released the 2009–2015 National Key Development Plan for Tea in 2009. The plan pointed out that 118 key development counties were selected from more than 1000 tea-producing counties, and were divided into four major tea agglomeration regions. The central government gradually increased investment in special funds for the tea industry, and local governments gave priority to land for tea production and processing. These policies have greatly promoted the expansion of tea production in China, as well as the trend of spatial agglomeration in recent years. Additionally, national macroeconomic policies such as agricultural management, land management, rural labor, and other related policies have directly or indirectly affected the tea spatial distribution.
3. Data Sources and Methodology
3.1. Data Sources
The tea yield of prefecture-level cities was the core indicator for this study, and was mainly derived from the annual China Tea Yearbook [
29] and the China Agricultural Statistics Yearbook [
30], and the local statistical yearbooks of relevant provinces. A small amount of missing data was obtained by accessing the internet, for example, the official website of a city. For explanatory variables, data on natural factors such as temperature, accumulated temperature, precipitation, and topography were taken from the website of the Chinese Academy of Sciences Resource and Environmental Sciences Data Center (
http://www.resdc.cn). Data on highway mileage, labor wages, crop acreage, and government fiscal expenditures were sourced from the China Regional Statistical Yearbook [
31] and the China City Statistical Yearbook [
32]. Information on the companies that promote tea technologies was found on the internet (
https://www.tianyancha.com).
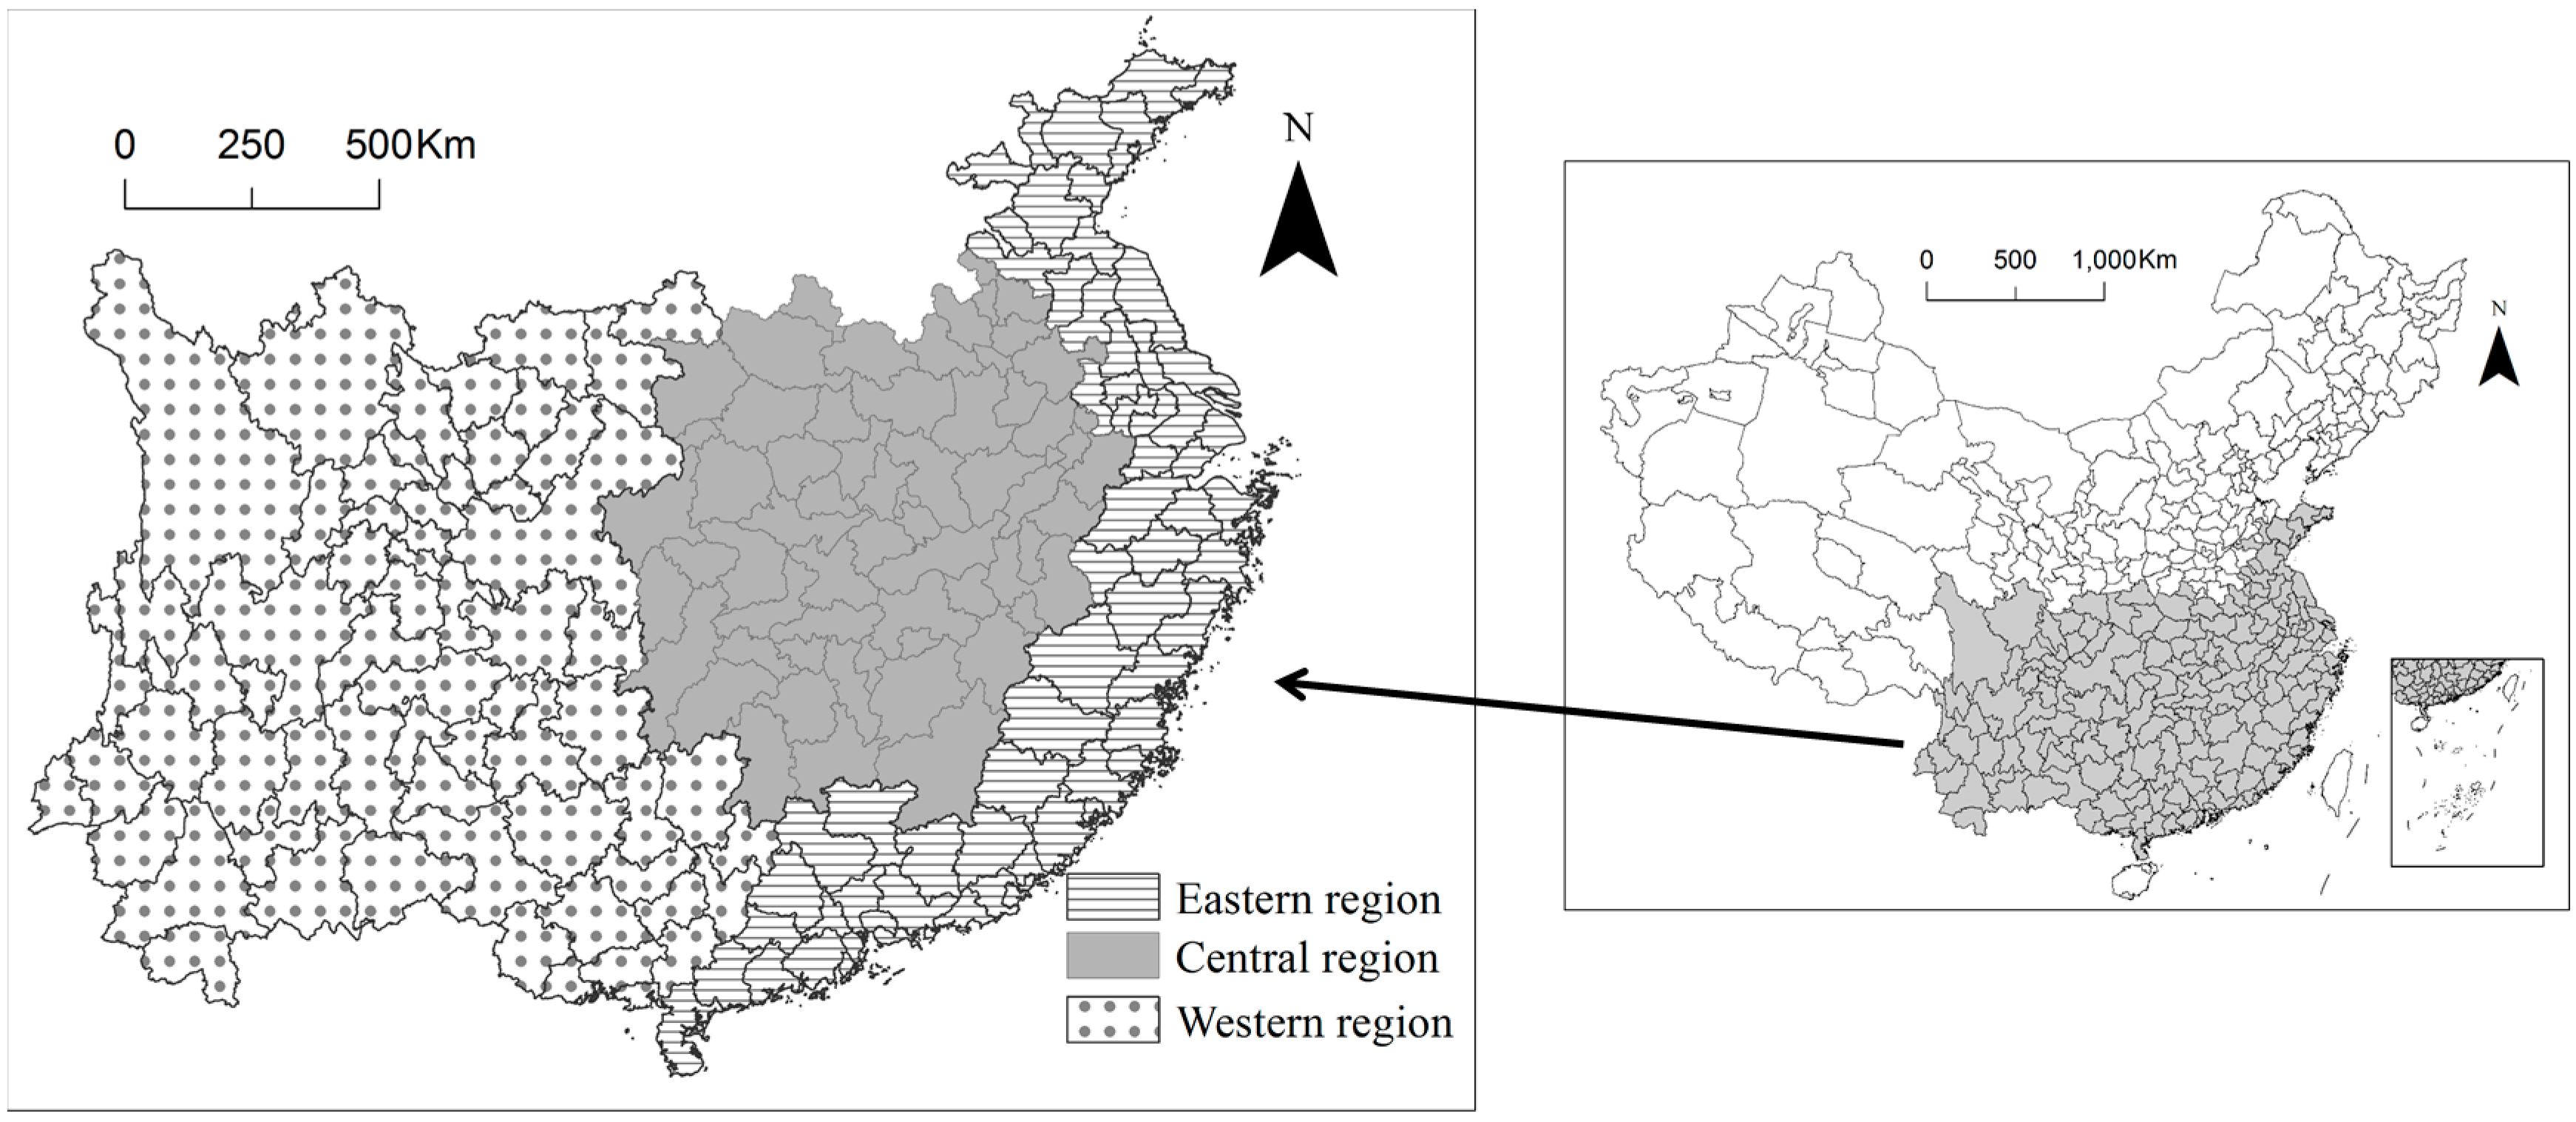
The study region included China’s 17 major tea-producing provinces. In 2015, these 17 provinces accounted for 99.91% of the national tea production (due to the lack of data, this does not include Taiwan Province). With reference to national regional planning, we divided these provinces into three regions: the eastern, central, and western regions (see
Figure 2). The eastern region includes Jiangsu, Zhejiang, Fujian, Guangdong, and central and southern Shandong. The central region includes Anhui, Jiangxi, Hubei, Hunan, and southern Henan, while the western region includes Guangxi, Chongqing, Sichuan, Guizhou, Yunnan, and southern Shaanxi. These provinces comprised 188 prefecture-level cities as the basic unit for spatial pattern analysis in this study.
3.2. Methodology
(1) Herfindahl index (HH)
To reveal the variation trend of tea spatial agglomeration, the Herfindahl index was used for quantitative analysis [
33]. The formula is as follows.
In the formula: is the tea yield of prefecture i. The greater the Herfindahl index, the more concentrated the spatial distribution of tea production; conversely, the spatial distribution is more dispersed.
(2) Exploratory Spatial Data Analysis (ESDA)
ESDA was used to analyze the spatial dependence and heterogeneity of tea production. The Global Moran’s I could reflect the spatial relationship of overall development, whereas local indicators of spatial autocorrelation (LISA) could characterize local patterns where there is high or low autocorrelation [
34,
35,
36]. The calculation of the Global Moran’s I can be expressed as:
In the formula: ; n is the number of prefectures; and are the tea yields of prefectures i and j respectively; and is the element of the spatial weight matrix. In this study, the adjacency criterion was used. If prefecture i and prefecture j have a common boundary, the spatial weight takes the value 1; otherwise, it takes 0. Moran’s I ranged between −1 and 1. A positive value indicated a positive correlation between regions; a negative value indicates a negative correlation between regions. Moran’s I was close to 0, indicating that there was no spatial correlation.
The calculation of LISA can be expressed as:
In the formula, and , as a standardized form of observation. indicates that there is a positive correlation between tea spatial distribution in prefecture i and its neighboring prefectures. The larger the value, the stronger the positive correlation. indicates that there is a negative correlation between prefecture i and its neighboring prefectures. The greater the value, the stronger the negative correlation.
To study whether there are local agglomerations in prefectures, it is necessary to combine Moran’s I scatter plot and the local Moran’s I index. In the Moran’s I scatter plot, the tea production in each prefecture is abscissa, the spatial lag of tea production is the ordinate, and the average of the horizontal and vertical coordinates of the scatter plot is the center coordinate. The plot is divided into four quadrants, and the four quadrants correspond to the local spatial correlation of different prefectures. The first quadrant represents the High-High agglomeration (H-H) where both prefectures and their neighbors have high tea production; the second quadrant is the High-Low agglomeration (H-L), prefectures with high tea production whose neighboring prefectures are low; the third quadrant is the Low-Low agglomeration (L-L), where the prefectures and their surrounding prefectures both have low tea production; the fourth quadrant is the Low-High agglomeration (L-H), of prefectures with low tea production whose neighbors have high production.
(3) Spatial econometric model
When dependent variables have spatial effects such as spatial dependence and spatial heterogeneity, the parameter estimates obtained by the ordinary least-squares method tend to be biased and non-uniform. In this case, the spatial econometric model is used to solve this quantitative problem with spatial correlation. At present, the commonly used spatial econometric models mainly include the spatial lag model (SLM) and spatial error model (SEM) [
37].
When the dependent variable of a spatial unit is affected by neighboring units, the lagged terms of the dependent variables need to be added to the general model, which is then converted into a spatial lag model. The specific expression is as follows:
When the error term of a spatial unit is affected by neighboring units, that is, there is a spatial autocorrelation of the model error term, the error term needs to be added to the general model and converted into a spatial error model. The specific expression is as follows:
In these two formulas, Y represents the dependent variable and is an n × 1 vector; X represents the independent variable, and if there are m independent variables, it is an n × m matrix. β represents the regression coefficient and is an m × 1 vector. ε represents a random error term and N is the number of spatial units. W denotes an n × n spatial weight matrix. ρ denotes the spatial autocorrelation coefficient; if ρ is significant, it indicates that there is a certain spatial correlation among the dependent variables. γ denotes the spatial correlation coefficient between regression residuals; u is a random error vector.
4. The Spatial–Temporal Dynamics of Tea Production
4.1. Spatial Agglomeration in Tea Production
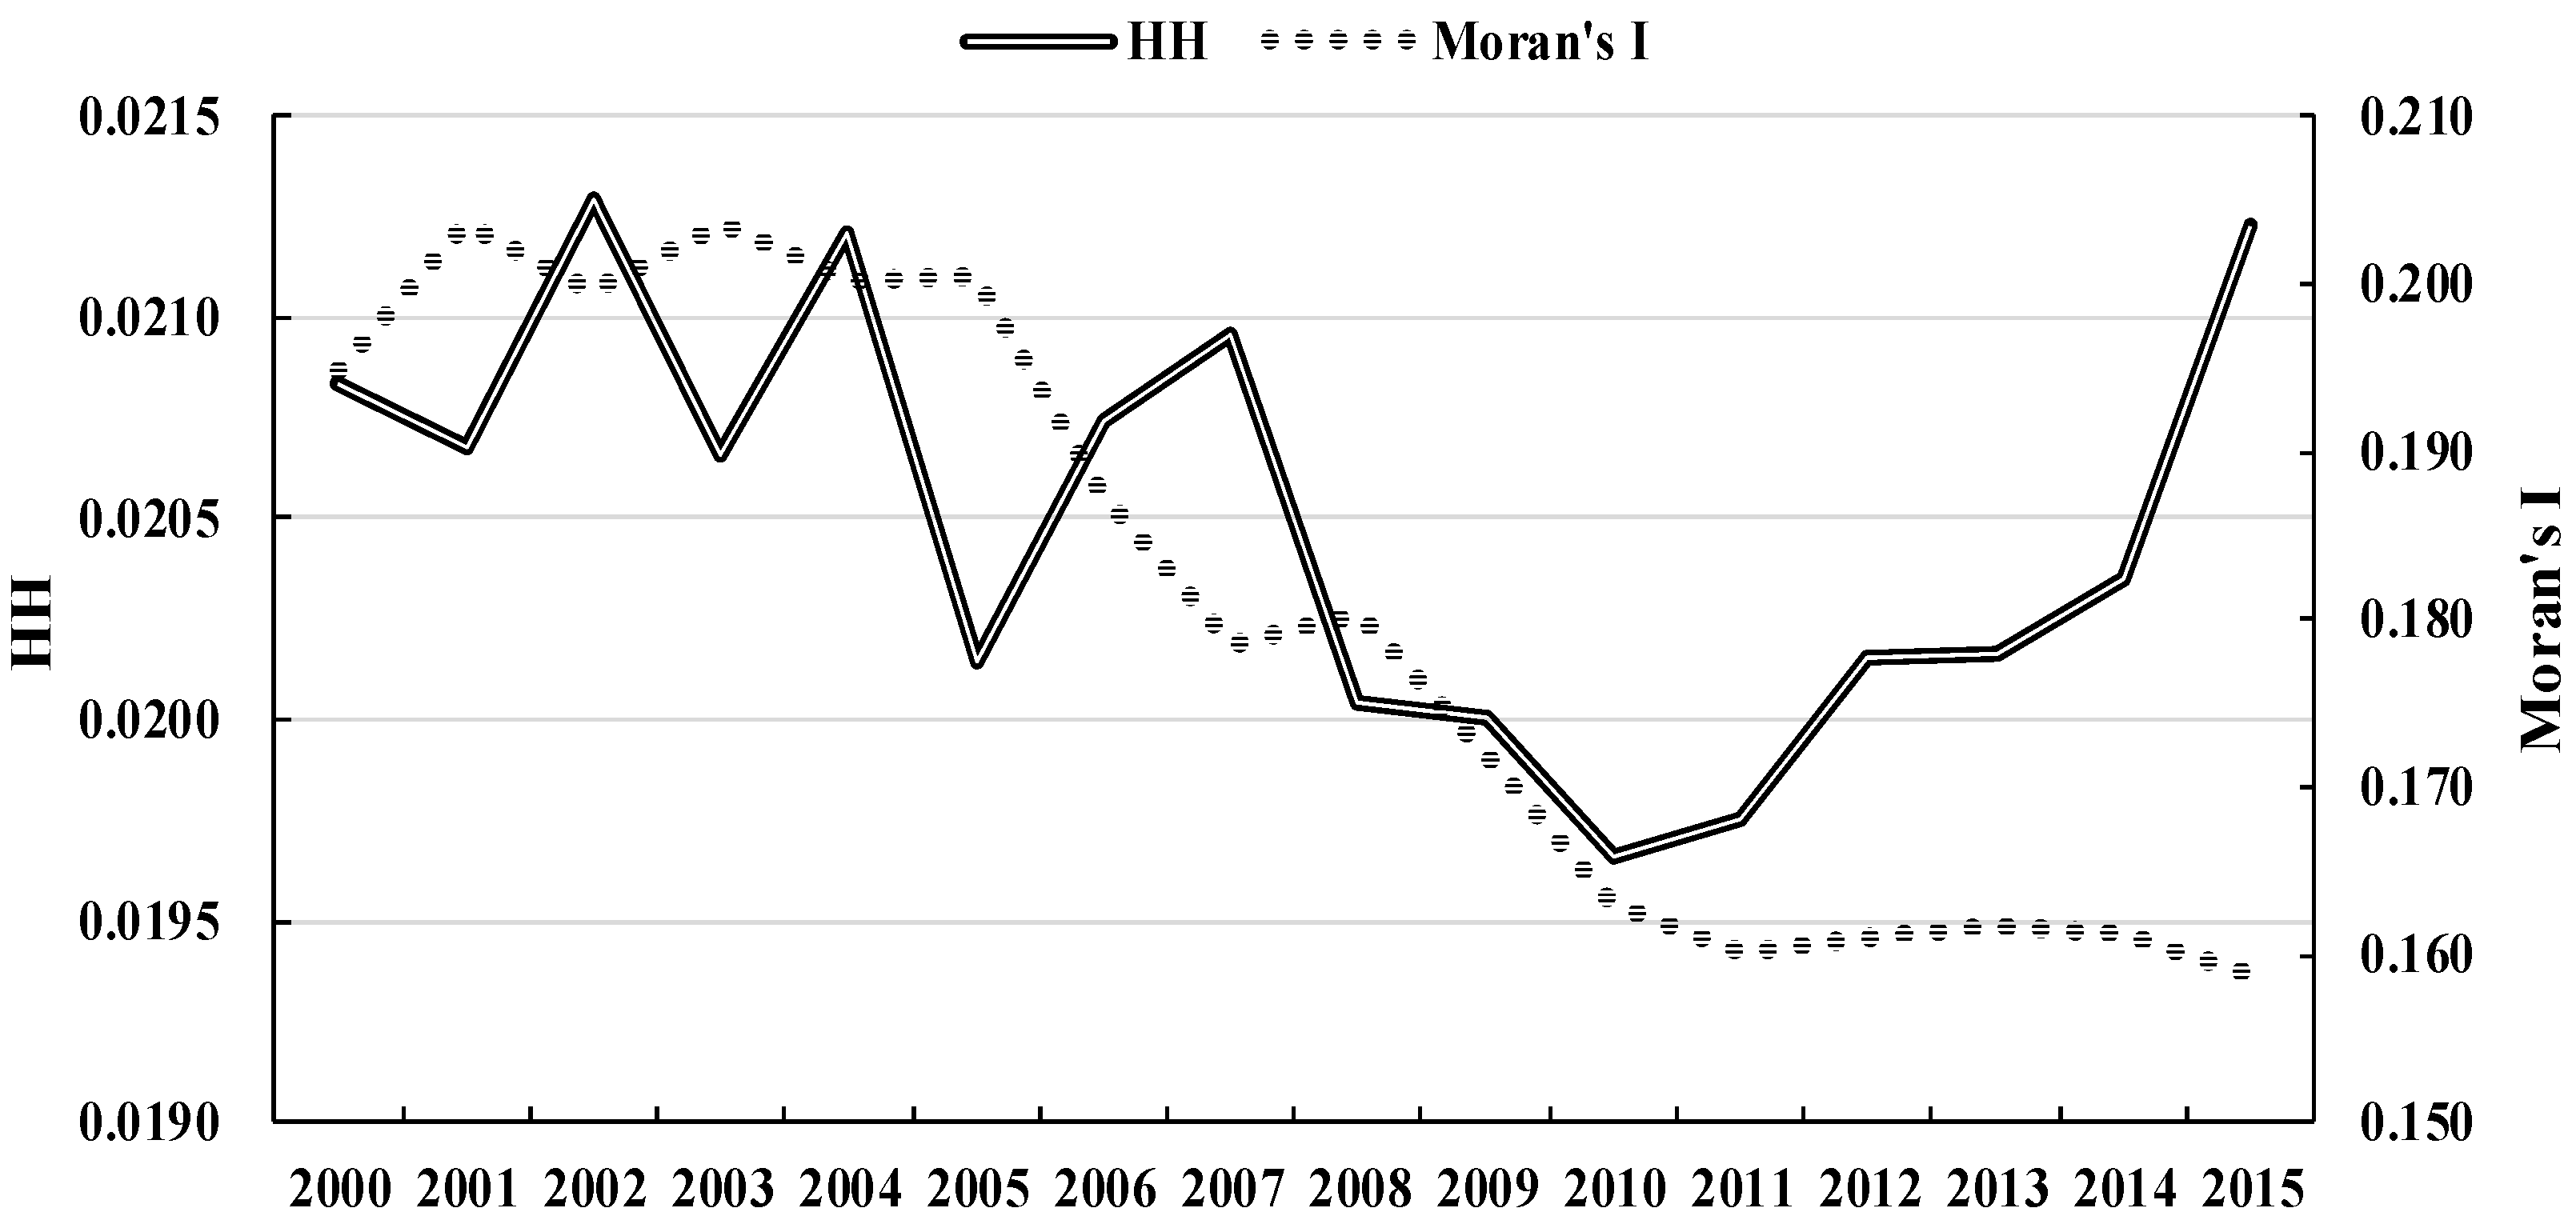
The degree of spatial agglomeration in tea production showed a U-shaped trend that first decreased and then increased. From 2000 to 2010, the degree of spatial agglomeration gradually declined in wave-like changes; the HH index decreased from 0.0208 to 0.0197. During the period from 2011 to 2015, tea production showed a trend of agglomeration in a few prefectures, with the HH index rising from 0.0198 to 0.0212, exceeding even the degree of agglomeration in 2000 (see
Figure 3). Therefore, it can be seen that the changes in tea spatial agglomeration in China were characterized by diffusion and re-agglomeration.
Tea production had a significantly positive spatial autocorrelation, but the degree of correlation has been decreasing. The values of Moran’s I exceeded 0.15 in all years, and all were significant at the 1% level, indicating that tea production had strong spatial correlation characteristics. That is, prefectures with high yields tended to agglomerate in space. The lower prefectures also had agglomeration features. From the perspective of spatial correlation changes, over the past 15 years, Moran’s I decreased from 0.195 to 0.159, indicating that the spatial correlation of high-yield prefecture-level cities tended to weaken over time, and the spatial distribution was more balanced (see
Figure 3).
4.2. Spatial Dynamics in Tea Production
The change trend of regional pattern showed that the tea production share in the eastern region has gradually decreased, and the shares of the central and western regions have gradually increased and exceeded the eastern region. In 2000, the share of tea production in the eastern, central, and western regions was 43.87%, 28.08%, and 28.04%, respectively (see
Table 1). The eastern region was significantly higher than the central and western regions. Although the tea yield in the three regions increased, there was a large difference in growth rates. From 2000 to 2015, the growth rate of the tea yield in the eastern, central, and western regions was 5.5%, 10.2%, and 11.6%, respectively. The eastern region was significantly lower than the central and western regions. As a result, the barycenter of tea production moved from the eastern region to the western region from 2000 to 2015. In 2011, the tea yield in the western region began to exceed that of the eastern region, and then it further concentrated in the central and western regions. By the end of 2015, tea production in the central region also exceeded that of the eastern region. The shares of tea production in the eastern, central, and western regions were adjusted to 30.0%, 30.6%, and 39.4%, respectively.
At the provincial level, there were two characteristics of tea spatial pattern changes. First, the share of coastal provinces with high economic levels gradually declined, and inland provinces with lower economic levels became hot spots for tea production growth. From 2000 to 2015, four of the five provinces with the largest drop in tea share were located along the coast, namely Fujian, Jiangsu, Guangdong, and Zhejiang, with share reductions of 0.61%, 1.14%, 2.67%, and 9.39%, respectively. The five provinces with the largest increase in tea share were Yunnan, Sichuan, Hubei, Guizhou, and Henan, all of which were located in inland regions. Their shares increased by 4.63%, 3.03%, 2.62%, 2.53%, and 1.55%, respectively. Second, due to the progress in tea cultivation techniques and climate warming, tea production continued to spread to northern provinces. Shaanxi, Henan, and Shandong are the northernmost provinces of China’s tea-producing regions, and their southernmost latitudes are 31°42′, 31°23′, and 34°23′, respectively. Between 2005 and 2015, the total tea production in these three provinces increased rapidly from 25,800 tons to 138,200 tons, an increase of nearly four times, and their production share increased from 2.6 to 6.1%.
4.3. Local Spatial Autocorrelation in Tea Production
In combination with the Moran’s I scatterplot and the local Moran’s I index, a LISA cluster map recording tea production of all prefectures was completed for 2001, 2005, 2010, and 2015. As time goes on, the four spatial locations and four ranges of spatial agglomeration have varying degrees of change (see
Figure 4).
(1) H-H agglomeration. In 2000, there were 20 prefectures of this type, distributed in southwest Yunnan, and Changde and Yiyang in Hunan, the southeastern coastal region that consists of Zhejiang and Fujian. In 2005, the number of prefectures increased to 22, and the spatial pattern was relatively stable. Tea production was still mainly in the southeast coastal region and the southwest of Yunnan. Yichang and Enshi in Hubei were newly added. In 2010, the number of prefectures remained at 22, and the spatial pattern was basically unchanged. In 2015, the number of prefectures was reduced to 19, and the spatial pattern had changed significantly. The prefectures in Zhejiang Province had all withdrawn, and the remaining units all belonged to Fujian Province in the southeast coastal region. In addition, Zunyi and Tongren in Guizhou Province and Leshan in Sichuan Province were added. The results show that the spatial pattern of the H-H agglomeration region changed little from 2000 to 2010, but the spatial pattern changed significantly from 2010 to 2015. The spatial scope of the southeast coastal agglomeration region gradually narrowed, and the H-H agglomeration shifted to the central and western regions.
(2) High-Low agglomeration and Low-High agglomeration. The number of prefectures in these two types was relatively small and spatially dispersed. The High-Low agglomeration regions were mainly distributed in the periphery of the Low-Low agglomeration, including Xinyang, Lu’an, and Rizhao. The tea production in these prefectures was relatively high, but was constrained by the weak capacity for attraction of the surrounding prefectures. The rapid increase in tea production had not led to corresponding growth in the surrounding prefectures. Low-High agglomeration were dotted in space. The tea production in these prefectures was small, and less affected by high-yield units. This was the transition region from high-yield units to low-yield units.
(3) Low-Low agglomeration. This type had the largest number of prefectures and they were highly agglomerated in space with a stable pattern. They were mainly distributed in the Jianghuai Plain, the Hengduanshan region, and the Pearl River Delta region. The Jianghuai Plain is characterized by high latitude, low temperature, and flat terrain. It is one of the largest grain production bases in China, and its land use is limited. Therefore, the conditions are not favorable for growing tea trees. The Hengduanshan region is characterized by high altitude, steep terrain, and a small area of available land, which is not suitable for the growth of tea trees. The Pearl River Delta region has natural conditions for the growth of tea trees, but the region is one of the most economically developed regions in China. High labor costs and expensive land have become major factors restricting tea production.
5. The Influencing Factors of Spatial–Temporal Dynamics
5.1. Explanatory Variables
According to the theoretical analysis, from the three aspects of resource endowments, NEG factors, and government guidance, we chose variables such as temperature, accumulated temperature, precipitation, topographic relief, labor costs, technological level, traffic conditions, regional specialization, agricultural finance, and industry planning to explain the spatial–temporal dynamics of China’s tea production. We built the following conceptual model:
In the formula, represents the logarithmic value of tea production in prefectures i; represents the resource endowments; represents NEG factors; represents government guidance; A is the constant term; and ε is the error term.
First, resource endowment theory proposes that exogenous factors, such as natural resources, labor, and technology, are the important reasons for industrial agglomeration. Thus, natural factors closely related to the growth of tea plants were selected, including temperature, accumulated temperature, precipitation, and topography. The variables selected are the annual average temperature (
Temp), accumulated temperature ≥10 °C (
Actemp), annual average rainfall (
Rain), and topographic relief (
Topo). The first three variables were directly converted to raster data for each prefecture, and topographic relief was calculated using the window analysis method [
38]. In terms of socio-economic factors, labor costs (
Wage) was expressed as the average wage of urban employees. Technological level (
Tech) was represented by a dummy variable; if the prefecture had a tea technology promotion company, the value was set to 1; if not, the value was set to 0.
Second, the NEG factors have increasingly explained the spatial distribution of agricultural production. In this study, road network density (
Road) was used to express traffic conditions, that is, the ratio of highway mileage to the prefecture’s area, which represents transportation cost. The location quotient (
Lq) was used to indicate the degree of regional specialization [
3]. The resulting formula is:
In the formula: is the tea garden area of prefecture i; is the sown area of crops of prefecture i; are the national tea plantation area and national crop sown area, respectively.
Third, government guidance plays an important role in the spatial layout of agricultural production in China. We selected the proportion of agricultural fiscal expenditure to total financial expenditure (
Fina) to express the government’s support for agriculture. Industry planning (
Plan) was represented by a dummy variable; that is, if the prefecture had a key development county specified in the 2009–2015 National Tea Key Development Plan, the value was set to 1; if not, the value was set to 0.
Table 2 presents the descriptive statistics for the variables.
5.2. Model Test
Before conducting regression, we made a logarithmic transformation of some continuous dependent and independent variables. The correlation coefficients of the variables were below 0.6, except for the correlation coefficient between annual mean temperature and accumulated temperature, which exceeded 0.9. To increase the explanatory power of the model and avoid multicollinearity, accumulated temperature was removed from the model. The variance inflation factor (VIF) was used to further statistically diagnose variable collinearity. The evaluation criteria for the VIF indicates that when 0 < VIF < 10, there is no multicollinearity among the variables. The VIF values of all variables in the final models were below 6, indicating that there were no obvious multicollinearity problems among the 10 independent variables and the spatial econometric model regression analysis could be performed.
Based on Moran’s I index, there was significant spatial autocorrelation in tea production. If spatial autocorrelation is ignored, the regression analysis using an ordinary least squares model (OLS) may exhibit a “pseudo-regression” phenomenon. To select the most suitable model, we used an OLS model, a spatial lag model (SLM), and a spatial error model (SEM) to estimate the influencing factors in 2005 and 2015, respectively. The estimation results show that the three models were all significant at the 1% level, and the goodness-of-fit of the models was high. However, as a classical linear regression model, OLS ignores spatial autocorrelation; therefore, the goodness-of-fit test is smaller than for the SLM and SEM. Comparing the log-likelihood (Log-L), Akaike information criterion (AIC), and Schwarz criterion (SC) for the three models, the SEM had the largest Log-L values and the smallest AIC and SC values. Therefore, according to Anselin’s criteria [
39], the SEM model was more suitable than the SLM or OLS models.
5.3. Regression Results and Discussion
According to the regression results of the SEM model (see
Table 3), the elasticity coefficients γ of the spatial error term Wu in 2005 and 2015 are 0.613 and 0.546, respectively, both of which are significant at the 10% level. This shows that tea production is obviously affected by the proximity of prefectures, and also has an impact on tea production in neighboring prefectures. There is a significant spatial spillover effect in tea production. In 2005 and 2015, local tea production increased by 1%, and tea production in neighboring prefectures increased by 0.613% and 0.546%, respectively. The elasticity coefficient of Wu in 2015 was lower than that in 2005, indicating that spatial spillover effects of tea production showed a downward trend.
The regression results on resource endowments show that natural factors such as temperature, rainfall, and topography had a positive effect on the spatial distribution of tea production, and all were statistically significant at the 5% level, indicating that natural factors are the basis of tea production. This result has been confirmed by most scholars [
11,
12,
19]. Tea trees tend to grow in high-humidity, hilly regions, features that are determined by biological characteristics. The world’s major tea-producing regions are distributed in humid tropical and subtropical zones. However, from the perspective of time evolution, the elasticity coefficients of various natural factors show a decreasing trend, which indicates that the constraint effect on tea production by natural factors is gradually weakening in China. The elasticity coefficient of labor costs was negative and significant at the 1% level, indicating that labor costs have a dampening effect on tea production. Comparing the regression results for the two years, the effect of labor costs obviously increased. This is consistent with the findings of Xiao et al. [
5], who argue that labor costs are an important factor in the spatial pattern of tea production. This can also explain the rapid shift of tea production from the eastern region where labor costs are high to the central and western regions with lower labor costs from 2000 to 2015. The elasticity coefficient of the technological level was positive, which was significant at the 5% level in 2005, but not significant at 10% in 2015, indicating that the importance of technological level has weakened compared to other factors. This finding is inconsistent with the result of Xu et al. [
6]. A possible reason is the difference in the spatial scale of the basic unit, as the provincial level is used in their research.
The regression results for NEG factors show that the elasticity coefficient of traffic conditions was positive, but not statistically significant. This indicates that transportation costs had no substantial impact on tea production. This result differs from existing research on other agricultural products such as vegetables [
14] and fruit [
3]. This is related to the particularity of tea products. During processing, the weight of tea leaves is greatly reduced after drying and dehydration. Compared with other agricultural products, on the one hand, the transportation costs of tea products in the process of circulation are relatively low. On the other hand, tea products do not require preservation and are suitable for long-distance transportation. The elasticity coefficient of regional specialization was positive and significant at the 5% level in 2005. In 2015, it was significant at the 1% level, and the elasticity coefficient increased from 0.126 to 0.244. By comparing the results of the two years, it can be found that in recent years, regional specialization and large-scale planting has promoted tea spatial agglomeration. This finding provides evidence for the New Economic Geography theory [
21]. That is to say, if the economic benefits obtained by industry agglomeration are higher than the transportation costs, the industry will prefer spatial agglomeration.
The regression results for government guidance show that the elasticity coefficient of agricultural fiscal expenditures was positive, but it was not statistically significant, indicating that agricultural fiscal expenditures had no significant effect on tea production. This may be because tea is only a small part of the agricultural structure compared with agricultural products such as grains and vegetables. Therefore, the effect of the tea special fund investment has not been highlighted in agricultural fiscal expenditures. The elasticity coefficient of agricultural policy was positive, and was significant at the 1% level in both 2005 and 2015. In terms of trends, the elasticity coefficient increased from 0.725 in 2005 to 0.886 in 2015. This indicates that the national development plan for key tea regions promulgated in 2009 played an important role in adjusting the tea distribution [
28,
40].
6. Conclusions and Policy Implications
With the rapid expansion of China’s tea market, the tea spatial distribution has undergone drastic changes, but the spatial layout of some tea producing regions still has unreasonable phenomena. It is critical to study the characteristics of spatial and temporal dynamics and influencing factors to optimize the tea spatial layout. Compared with existing research at the provincial level, this study clearly described the spatial and temporal dynamics at the prefecture level. In addition, based on the traditional theory of resource endowments and New Economic Geography theory, this study added a government guidance factor. A theoretical analysis framework was constructed from a new perspective to quantitatively analyze the influencing factors. The results provide a more comprehensive explanation of the spatial–temporal dynamics of tea production.
The main findings of this study are as follows. The degree of tea spatial agglomeration showed a U-shaped trend that first decreased and then rose, and tea production had significant spatial correlation characteristics. The share of tea production gradually moved from the eastern region to the central and western regions, as the regional pattern evolved from “Eastern > Western = Central” to “Western > Central > Eastern”. Yunnan, Sichuan, Hubei, Guizhou, and Henan provinces became new growth points. At the same time, due to improvement in tea cultivation techniques, tea production continued to spread to the north. Through the analysis of local spatial autocorrelation, it is found that different agglomeration regions showed certain expansion and contraction in different spatial range. What is more remarkable is that the H-H agglomeration gradually shifted to the central and western regions. The regression results showed that tea production had obvious spatial spillover effects; that is, an increase in local tea production led to an increase in tea production in neighboring prefectures. Natural resource factors, labor cost, regional specialization, and industry planning affected the tea spatial distribution to varying degrees. Overall, the impact of socio-economic factors on the spatial pattern of tea production gradually surpassed that of natural resources. Specifically, natural factors such as temperature, precipitation, and topography strongly impacted the tea geographical distribution, and their influence was stable in the long-term. Labor cost was an important factor that influenced changes in the tea production pattern, which explains to a certain extent the shift of the share of tea production from the economically developed eastern region to the less developed central and western regions. Industry planning had a positive guiding effect on the tea spatial layout.
According to these research results, based on the sustainability of tea production in economic development and environmental protection, we propose several policy implications to optimize the tea spatial layout. First, the government should make full use of the spatial spillover effect of tea production, establish inter-regional cooperation mechanisms, strengthen spatial agglomeration in advantageous regions, and build some modern tea production bases. This will help increase economic benefits resulting from spatial agglomeration. Second, natural factors such as temperature, precipitation, and topography determine the growth of tea plants and the quality of tea products. Therefore, construction of new tea gardens must be according to scientific evaluation of an area’s suitability for tea cultivation, as well as efforts to produce high-quality tea products. At the same time, the suitability evaluation can help avoid the destruction of the ecological environment caused by neglecting natural conditions. Third, we should actively respond to the shift in tea production from the eastern coastal areas to the central and western regions. It is necessary to vigorously promote the construction of high-standard tea gardens, popularize tea seed varieties of clones, and realize economies of scale and mechanization. This helps improve the regional ability to respond to rapid changes in the spatial distribution of tea production. Finally, since stable natural resource endowments are the basis of tea production, achieving a rational distribution of tea production requires long-term efforts by the market and the government. Therefore, it is necessary to make full use of the existing tea production pattern and planting habits, form a reasonable division of labor, strengthen brand building, and create distinctive tea products. This not only meets the diverse market needs, but also avoids vicious competition with similar products.
Compared with the existing literature, this study more clearly revealed the spatial–temporal dynamics of tea production at the prefecture-level; there are, however, some shortcomings. First, the growth of tea trees is significantly affected by the geographical microclimate. In the future, research needs to be conducted on smaller spatial scales, such as county-level and grid units. Traffic conditions, especially low-grade rural roads, may have an effect on tea production of small-scale spatial units. Second, the empirical result of the spatial econometric model shows that the SEM model is better than SLM, indicating that in addition to the independent variables considered in our study, there are other variables that cause spatial autocorrelation in tea production. In addition, due to data limitations at the prefecture-level, this study did not address the monopoly in the submarkets which could be defined according to geometric boundaries or type of tea, and failed to use spatial panel data for a more comprehensive analysis. These issues need to be further explored in future research.


