Article

The Spatiotemporal Characteristics of Chinese Civil Vehicles’ Possession in the Context of Rapid Economic Development from 1996 to 2015

1
School of Information Science and Technology, Yunnan Normal University, Kunming 650500, China
2
GIS Technology Engineering Research Centre for West-China Resources and Environment of Educational Ministry, Yunnan Normal University, Kunming 650500, China
3
School of Mathematics, Yunnan Normal University, Kunming 650500, China
4
Department of Geology and Geography, Georgia Southern University, Statesboro, GA 30458, USA
*
Author to whom correspondence should be addressed.
Sustainability 2018, 10(9), 2999; https://doi.org/10.3390/su10092999
Submission received: 9 August 2018 / Revised: 19 August 2018 / Accepted: 20 August 2018 / Published: 23 August 2018
(This article belongs to the Special Issue Sustainable Transport: Transport, Environment, and Development)

Abstract

:
The possession of civil vehicles in a country or a region often reflects its usage of cars. The purpose of this study is to better understand the regional diversity of civil vehicles’ possession in multiple geographic scales (national, regional, provincial). We also aim to investigate the impact of economic levels on the possession of civil vehicles through the lens of Mk test, Theil index, principal component analysis and panel data models. Results show that the possession quantity of civil vehicles in China changed significantly, with a slow growth in 1996–2005 and a rapid growth in 2006–2015. During 1996–2015, the possession quantity of civil vehicles revealed a spatial inequality. The positive impact of economic development on the possession of civil vehicles is gradually decreasing from east to west and from coastal to inland. From 2000 to 2015, disparities in the spatial distribution of civil vehicles showed a trend of ‘increasing slightly in the first place then decreasing continuously,’ during 2000–2005, within-regional inequalities are greater than between-regional inequalities. The inequalities between provinces in the northern coastal areas (NC) were the main reasons for within-regional inequalities. Since 2006, between-regional inequalities have been greater than within-regional inequalities. The level of economic development has a significant positive impact on the possession of civil vehicles; the spatio-temporal patterns of civil vehicles in most areas are in line with economic development trends.

1. Introduction

The economic development in China advanced rapidly with the GDP increased 9 times as much as it was in 1996, from 7181.36 billion to 4,668,905.21 billion in 2015 [1]. The rapid development of economy has provided great opportunities for the automobile industry. By the time of 2015, the automobile production and sales in China have been ranked the number one in the world for seven consecutive years. In the same time, civil vehicles’ possession increased to 162.8445 million, nearly 14 times than the one in 1996 [1]. The automobile industry has a strong leading role in industries such as iron and steel, metallurgy, rubber, petrochemicals and infrastructure, as well as service industries including automobile maintenance, automobile insurance and used car transactions. The automobile industry has become one of the pillar industries in national economy.
Although the rapid development of the automobile industry promoted social progress, drove economic growth and increased people’s travel efficiency, its negative economic, social and environmental effects have become increasingly prominent, such as traffic congestion, higher accident risk, unbalanced supply of parking facilities, high energy consumption and increased greenhouse gas emissions. Since 2011, the State Council has issued important regulations such as the Comprehensive Work Plan for Energy Conservation and the Work Plan for Speeding Up the Upgrading of Product Gasoline Quality so as to limit vehicle number and use intensity, encourage research on new-energy vehicles and enhance supervision over vehicle exhaust pollution. Governments in different regions successively introduced policies, such as improving automotive fuel quality, raise gasoline prices and charge parking fees at non-residential parking areas. Beijing, Shanghai, Tianjin, Guangzhou and other cities are trying to control the number of cars and reduce environmental pollution through the implementation of a number of policies, such as purchase lottery, odd-and-even license plate rule and differential traffic management for new energy vehicles thereby remitting the negative effects casing by the rapid vehicle possession growth.
The possession of civil vehicles in a country or region is often an indicator of car usage which has major impacts on the local and global environment. China is one of the countries that maintains the fastest growing rates of automobile ownership in the world [2]; Dargay et al. [3] predicted that the number of cars owned by every 1000 people in China will reach 270 by 2030. Deaths caused by traffic accidents have become the leading cause of death for people aged 5–44. The direct economic loss has accounted for approximately 1–3% of annual gross domestic product [4]. Since 2000, oil consumption of the road transport sector has increased by nearly 9.6% per year. About 85% of gasoline and 42% of diesel are consumed by motor vehicles [5]. In the developed cities, such as Beijing, Shanghai, Guangzhou, high-density parking spaces are seriously inadequate. Traffic congestion has become a serious social problem [6]. Exhaust emissions caused by car trips seriously affect the ecological environment and human health [7]. According to Sekine K’s [8] study, people with long-term exposure to areas with high traffic density have a high prevalence of respiratory diseases. Results of previous studies have indicated that factors such as family characteristics, personal income, urban morphology and public transport service levels have significant impacts on vehicle ownership [9,10,11,12,13]. Wu et al. [11] used the fixed-effect model and random-effects model of panel data to investigate the driving factors of private car ownership in 32 provincial capital cities in China. Yang Z. et al. [12] analyzed factors that influence automobile ownership in 293 Chinese cities from 1994 to 2012 based on two spatial scales—major economic zones and city sizes. Li [13] analyzed the influencing factors in the development of car ownership from nationwide to city scales; Dargay [3,14,15] and Matas [16] found that the main influencing factor in car ownership is per capita GDP. Mogridge [17] believes that family characteristics and capital income are determinants of car ownership. After quantitative analysis of the factors in car ownership, Huang [18] found that the economy is the main factor. Many researches have shown that the growth of car ownership has a strong correlation with economic development. Xu [19] indicated that economic level in China will continue growing in the next 30 years and china’s per capita GDP will likely reach 20,000 dollars by 2050. In the national sustained economic growth process, different geographical locations, industrial structures, human capital and production technologies in various regions in China have led to significant differences in their economic development levels [20]. With a rapid economic development in various regions of China, undeveloped areas that have better urban ecological environment and natural ecological environment will become the new growth point of the future civil vehicle ownership but will also face greater challenges in terms of natural and social environment.
Despite of increasing studies, most of these studies focused on a country or region as a whole [13], dividing China according to the three major economic regions (Eastern, middle and Western) [11,12,18] and city sizes [12]. Some other studies only focused on economically developed regions [8,9,10,11,12,18]. More attention should be paid to the long-term spatial-temporal development of civil vehicle in various provinces in China. It is necessary to reveal the correlation between economic and possession of civil vehicles in different regions. Taking China as an example, extensive socioeconomic inequalities exist in the eastern and western regions, coastal and inland regions. In general, the eastern and coastal areas are more developed, with higher levels of income and motorization, as opposed to the west and inland. According to the economic homogeneity of Chinese provinces, the Development Research Center of the State Council of China proposed eight economic regional divisions in 2005. Based on the three spatial scales (the whole country, 31 provinces (except Hong Kong, Macao and Taiwan) and eight economic regions), we explored the temporal and spatial characteristics of civil vehicles possession at multiple spatial scales from 1996 to 2015. We also used the principal component analysis to construct the comprehensive indicators of economic levels and analyze the impact of economic development on the possession of civil vehicles.

2. Materials and Methods

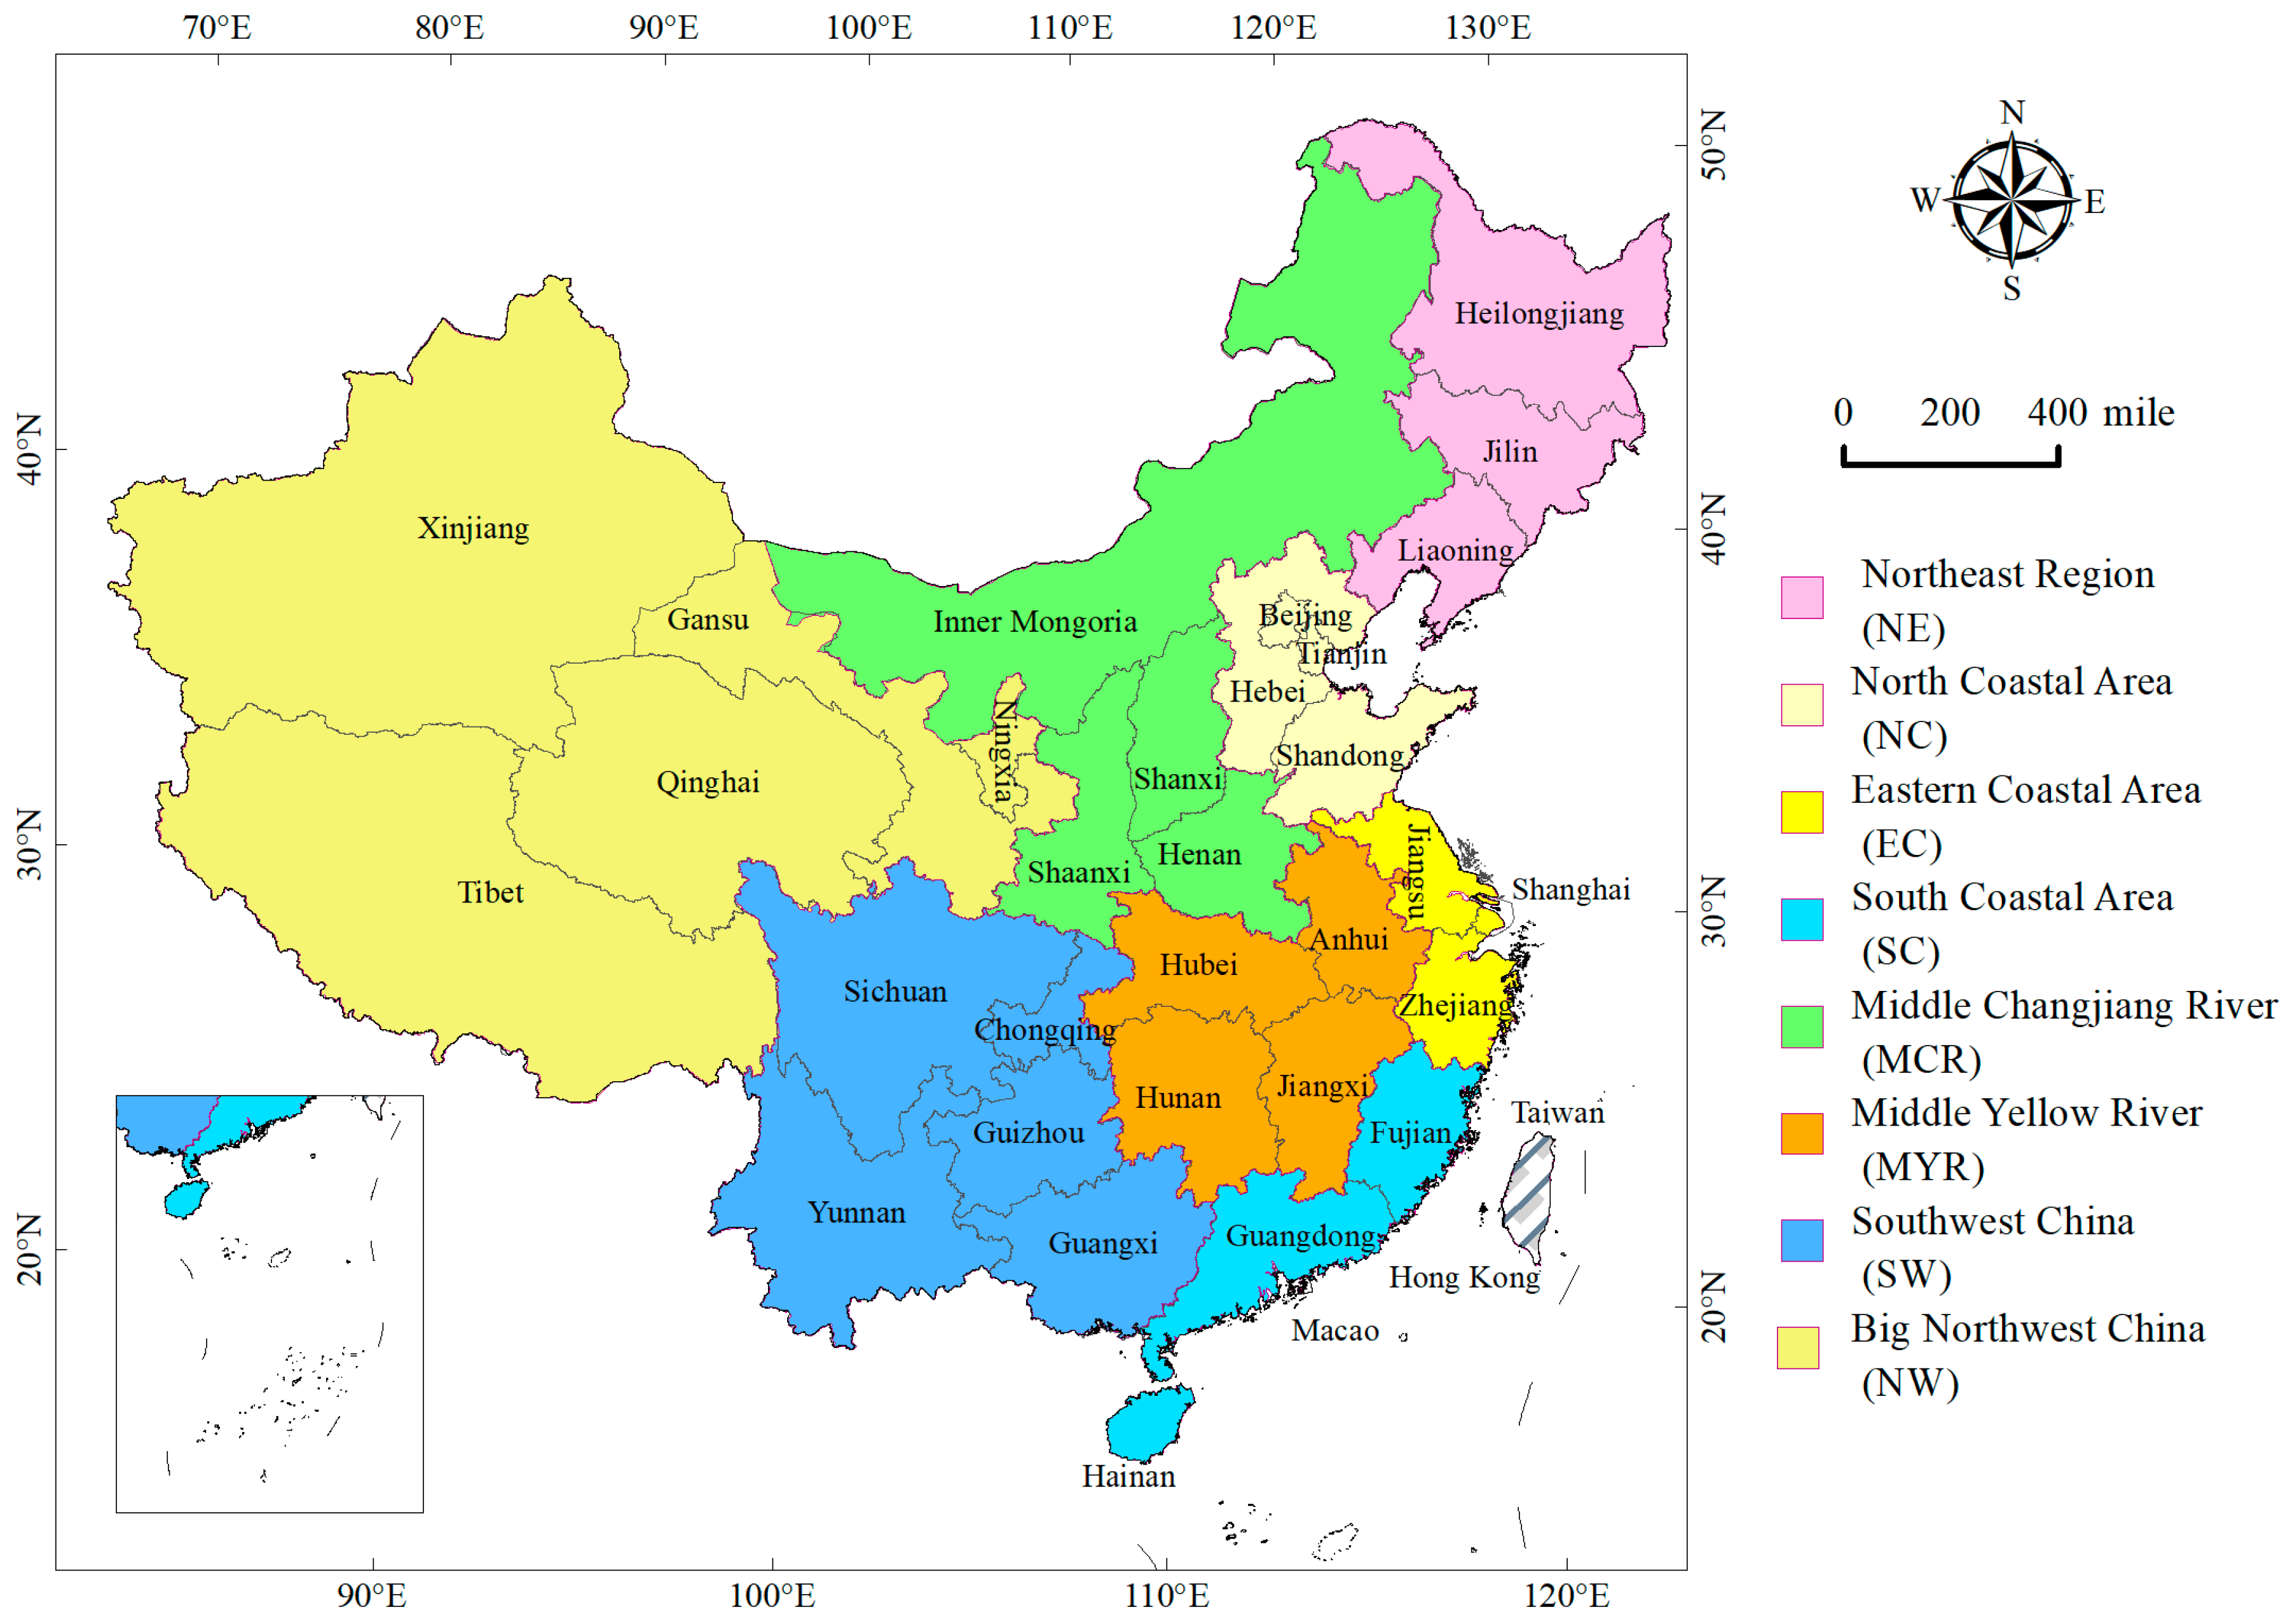
2.1. Study Area and Data

There are 31 provincial administrative regions in China mainland. The spatial distribution of the Chinese eight economic regions is shown in Figure 1. According to the statistical bureau of China, civil vehicle possession refers to the total numbers of vehicles that are registered and own vehicle license plate [1]. They are divided into private cars and cars belong to enterprises and institutions. In this study, possession of civil vehicles, gross regional product, household consumption expenditure, length of highways, local governments general budgetary revenue, total investment in fixed assets in the whole country were collected from the National Bureau of Statistics of China (http://data.stats.gov.cn/) from 1996 to 2015, this period was a period of rapid economic development in china. Due to provincial population data lacking from 1996 to 1999, the population related analysis were carried out from 2000 to 2015.

2.2. Methods

2.2.1. Mann-Kendall Test

In this study, the non-parametric method Mann-Kendall test (M-K) was used to detect the time series variation trend and the turning points. The M-K test does not require samples to satisfy independency and normal distributions, only the sample data is independent of each other [21]. The statistic of the M-K test is Zs, positive values of Zs indicate increasing trends while negative Zs value show decreasing trends. Testing trend is done at the specific α significance level when Zs > Z 1 α / 2 , the null hypothesis is rejected showing a significant trend. Change point can be found by two-sided test, two lines—Z1 and Z2. These two lines Z1 and Z2 may form intersections at specific time intervals. If the intersection point is significant at the 95% level, we can say that the critical change points statistically occurred in the time series [22].

2.2.2. Theil Index

Theil index is a weighted entropy index which was proposed by Theil (1967) [23] and originally used to measure economic inequality [24]. Theil index can be used to measure the inequality of each unit in a region while it can also be used to quantify the inequality of any group that consists of many units with similar characteristics in the same region [25]. Through the use of the one-stage nested Theil decomposition method and the M-K analysis of the Theil index sequence, this paper analyzed the spatial inequality of civil vehicles possession in China from 2000 to 2015 using the 31 provincial administrative regions as basic spatial units. Using the eight economic regions as a more macroscopic spatial unit, the overall inequality in China can be further divided into Tw which is the inequality within the region and Tk, which is the inequality between provinces in each economic region. Contribution rate of Tk, Tb, Tw to T is Dk, Db, Dw.
The specific calculation formulas are as follows:
T b = k = 1   8 C k l n C k n k n
T w = k = 1   8 C k ( i   g k C i C k l n C i C k n i n k )
T k = i   g k   C i C k l n C i C k n i n k
  T = T b + T w  
D k = C k × T k   k ( k = 1 ,   2 ,   3 8 )
D b = T b T   ,   D w = T w .   T
We divided 31 provinces into 8 groups according to their regions, set number k group as gk (k = 1, 2, …, 8). Here, nk and ni denote respectively as the population of region k and province i (i = 1, 2, …, 31); n represents the total popularity of 31 provinces, Ck and Ci, respectively, denote the proportion of civil vehicles in k-th region and i-th province as a percentage of the national total.

2.2.3. Principal Component Analysis (PCA)

We used gross regional product, household consumption expenditure, length of highways, local governments general budgetary revenue and total investment in fixed assets to measure economic development level. In order to comprehensively analyze the impact of economic development on the civil vehicle possession, we used principal components analysis (PCA) to calculate the weighted composite index that quantifies the level of economic development in this paper.
PCA is a statistical analysis method that reduces the multi-indicator data sets into less comprehensive indicators by linear weighted combination method [26,27]. When using PCA, we can choose to derive the feature vector from the correlation matrix or the covariance matrix of the data. If the original data has been normalized, then the PCA should use the covariance matrix [26]. Five variables which formed the raw data matrix X = (X1, X2, X3, X4, X5) respectively denote the column vector of gross regional product, household consumption expenditure, length of highways, local governments general budgetary revenue, length of highways and the total investment in fixed assets in the whole country, each column vector has n samples. The specific steps of PCA are as follows:
(1)
Standardize X to get S, S = (S1, S2, S3, S4, S5), Si = 1/n (Xi’Xi), i = 1, 2, …, 5.
(2)
Calculate the covariance matrix.
(3)
Calculate the eigenvalues and eigenvectors of the covariance matrix.
(4)
Get principal components whose associated eigenvalue is greater than 1.

2.2.4. Panel Data Model

Panel data is two-dimensional data with both time and cross-section information. Panel data has the advantages of increasing the sampling accuracy of the estimator, obtaining more dynamic information and reducing the possibility of linear correlation between explanatory variables [28,29,30]. The general form of the panel data model is:
  y i t   = α + P i t β i + ε i t ,   i = 1 , 2 ,   , N ;   t = 1 , 2 ,   , T
Here, N is the number of individual cross sections; T is the length of observation period; y i t . is the possession quantity of civil vehicles, ε i t . is the random error of the cross-sectional individual i at time t which satisfies the hypothesis of zero mean and equal variance.
According to the difference of slope and intercept, the panel data model can be divided into three types: invariant parameter model (αi = αj, βi = βj), variable intercept model (αiαj, βi = βj), variable coefficient model (αiαj, βiβj). In order to conduct the empirical analysis of the impact of economic development on the possession of civil vehicles in the three spatial scales (national, provincial and eight economic regions), the invariant parameter model and the variable coefficient model were constructed based on the 31 province panel data. Moreover, the invariant parameter panel data model was constructed based on the panel data of each economic region.
Before the regression of the panel data model, we need to do the unit root test, co-integration test, F test and Hausman test to ensure the validity of the model. To avoid spurious regression and ensure the accuracy of the test result, four unit root tests—Levin, Lin &Chu (LLC) t statistic, Im Pesaran and Shin (IPS) W-stat, ADF Fisher Chi-square and PP Fisher Chi-square are conducted to test the panel data [29]. If results of the test show the series are stationary or uniformity integrated, the co-integration test can be further performed [30]. We used the Pedroni test and kao test for the co-integration test. If the results of the co-integration test indicate that co-integration does exist among the correlated variables then panel data model can be constructed and model made by this time is more precise. We decide whether to use the mixed model or the fixed-effect model by the F-test and whether to use the fixed-effect model or the random-effect model by the Hausman test.

3. Results

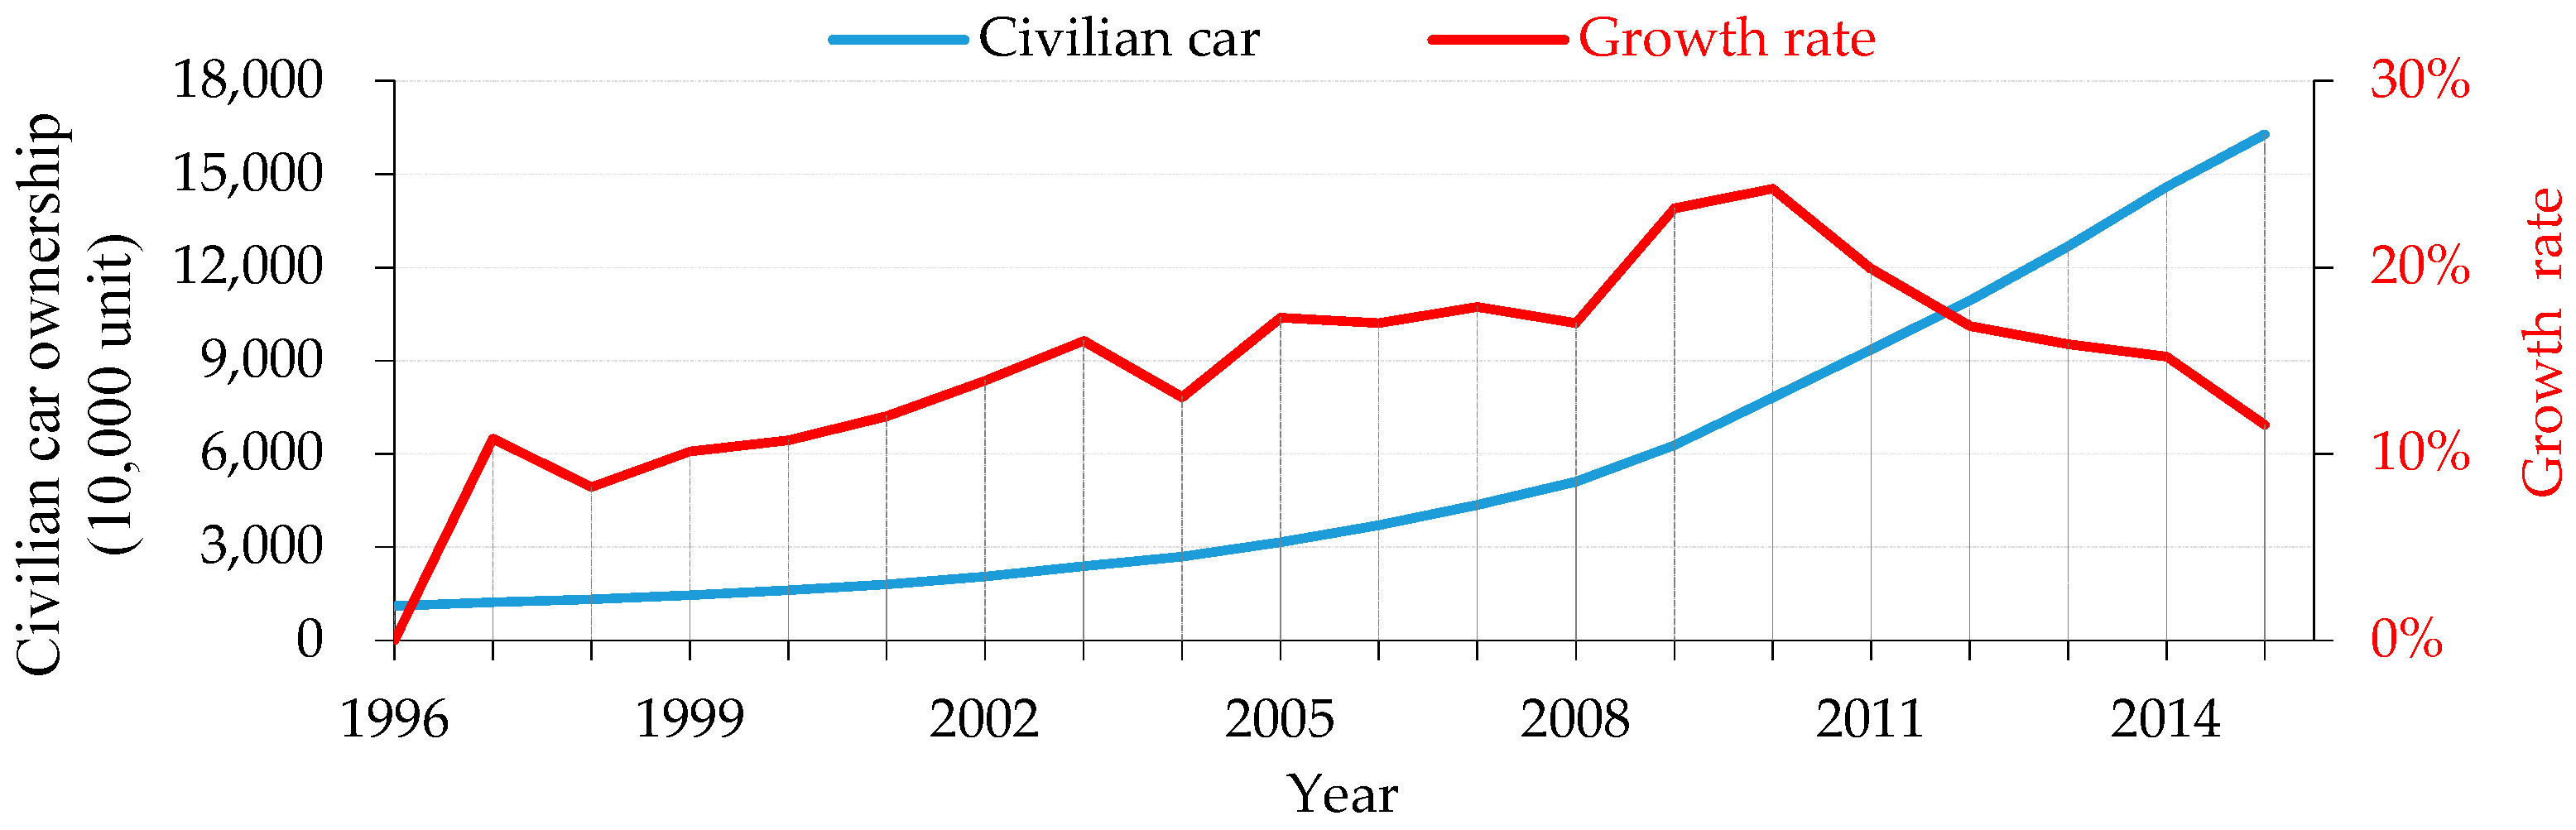
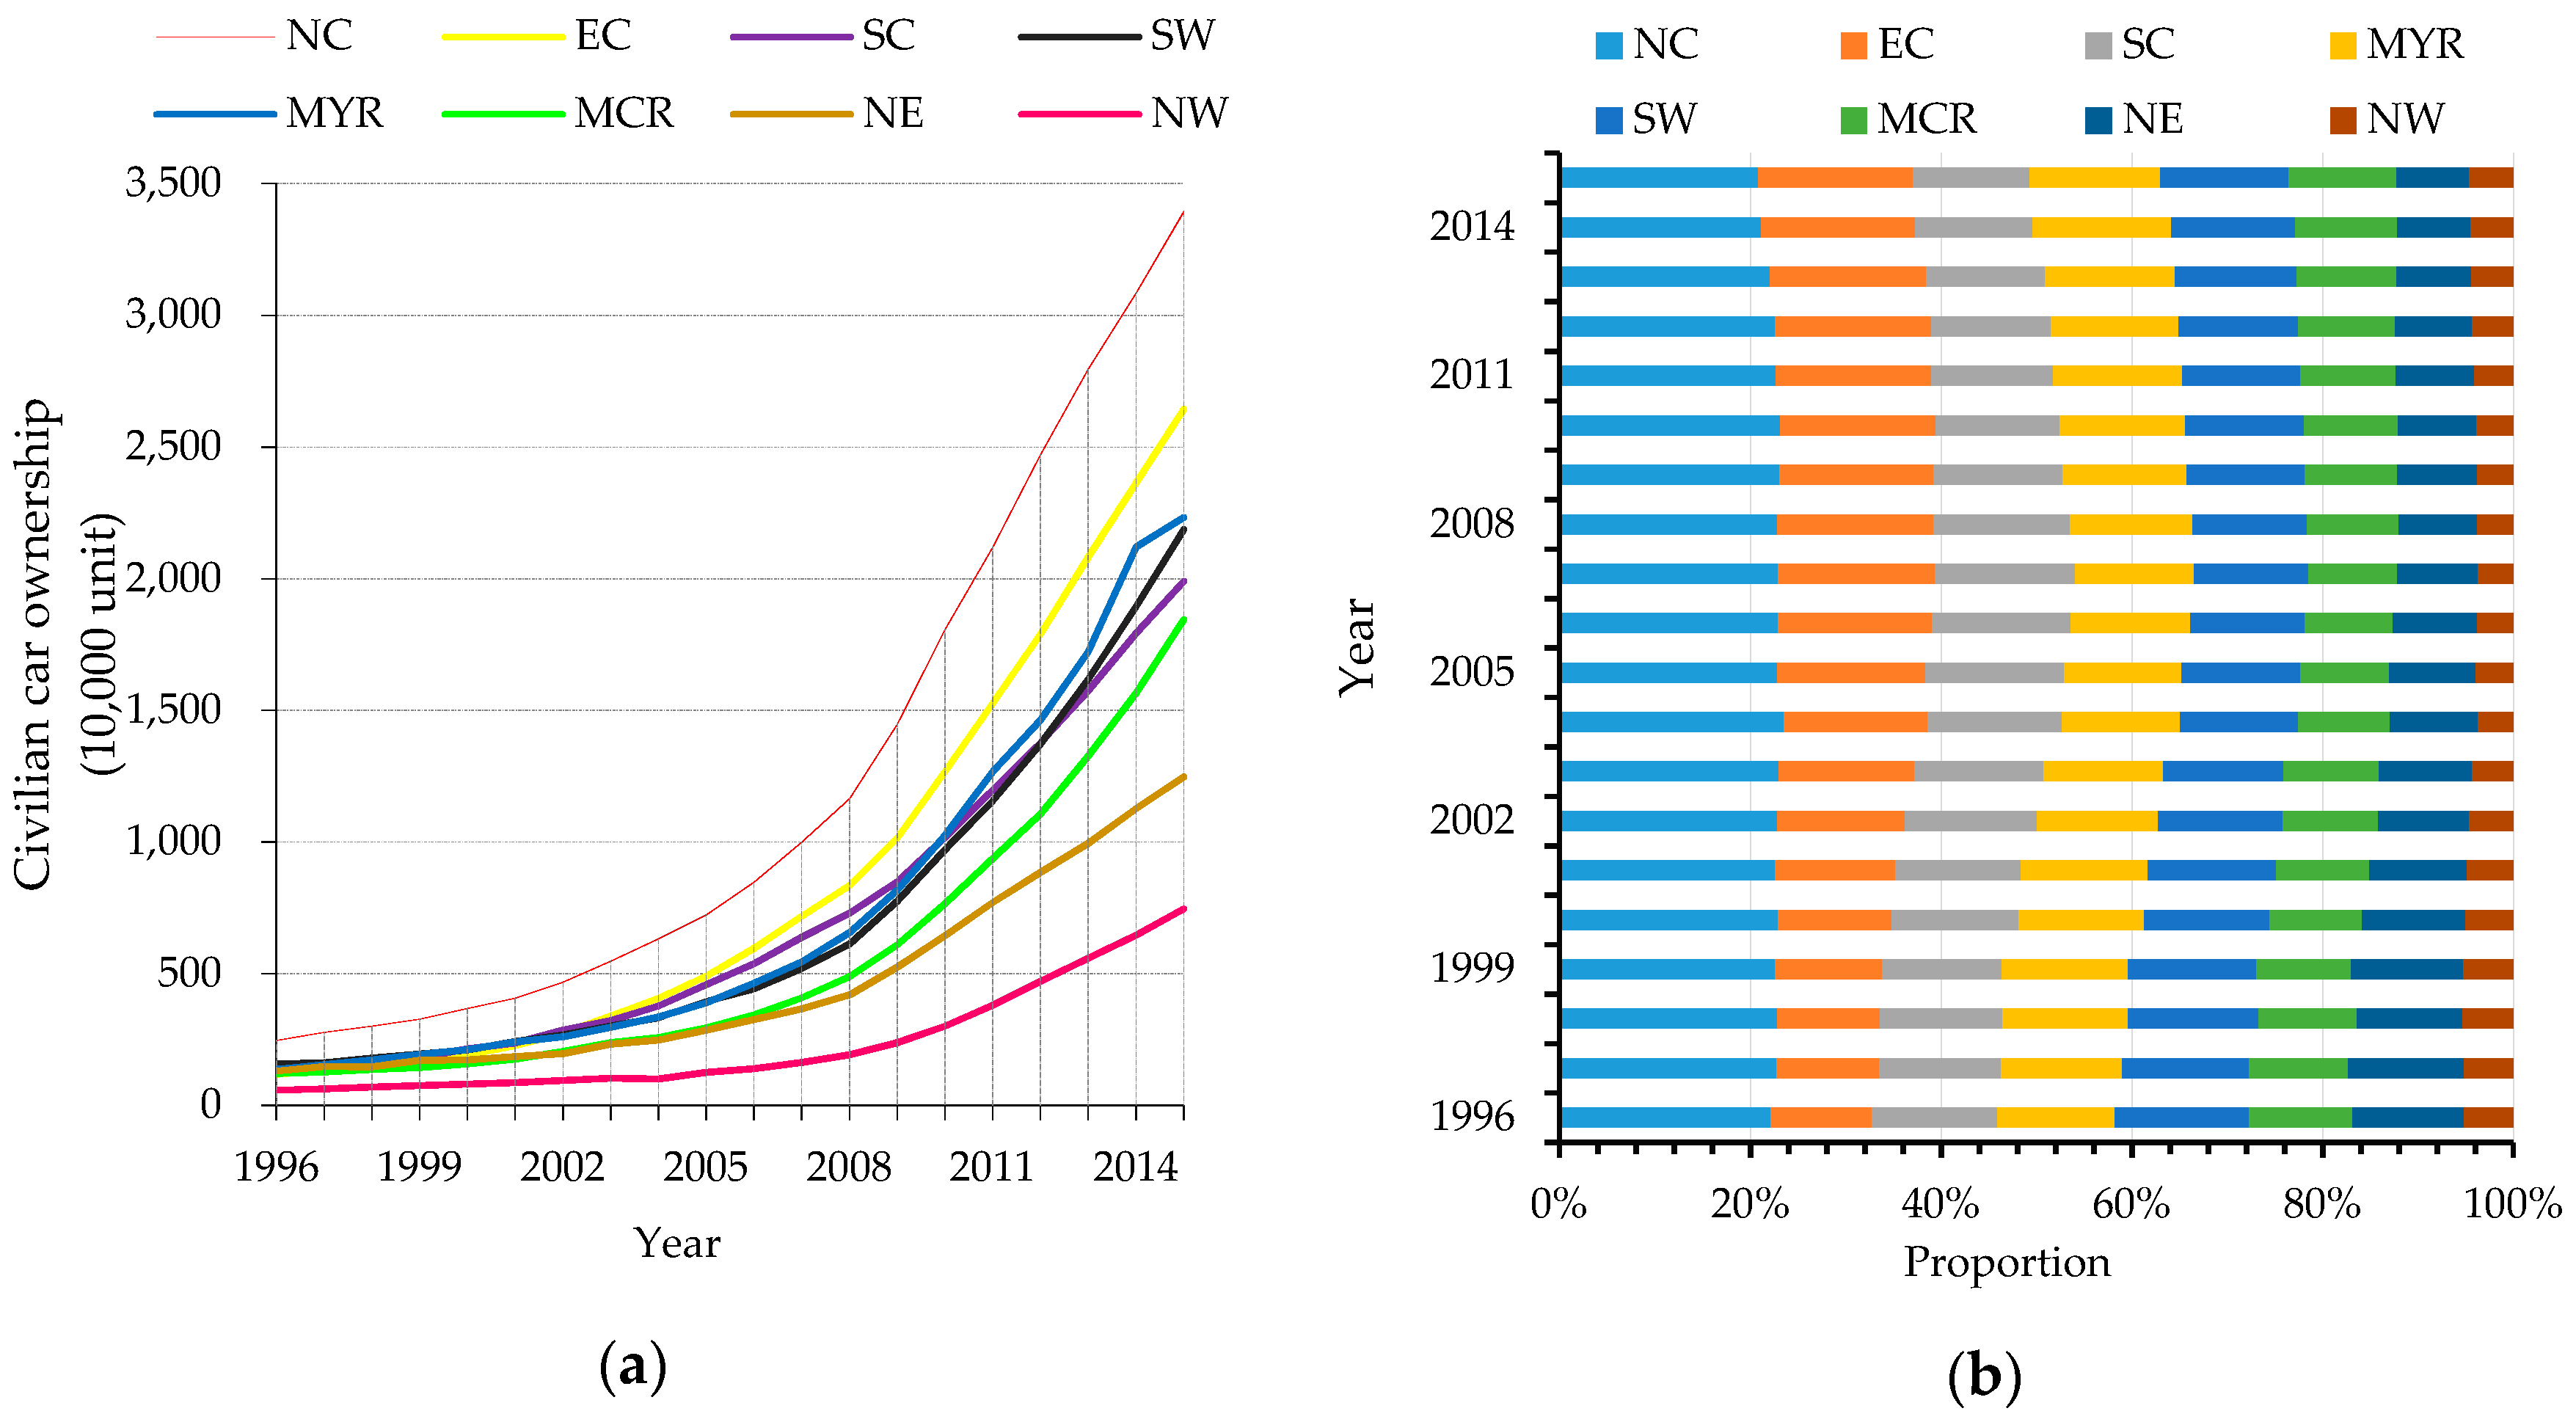
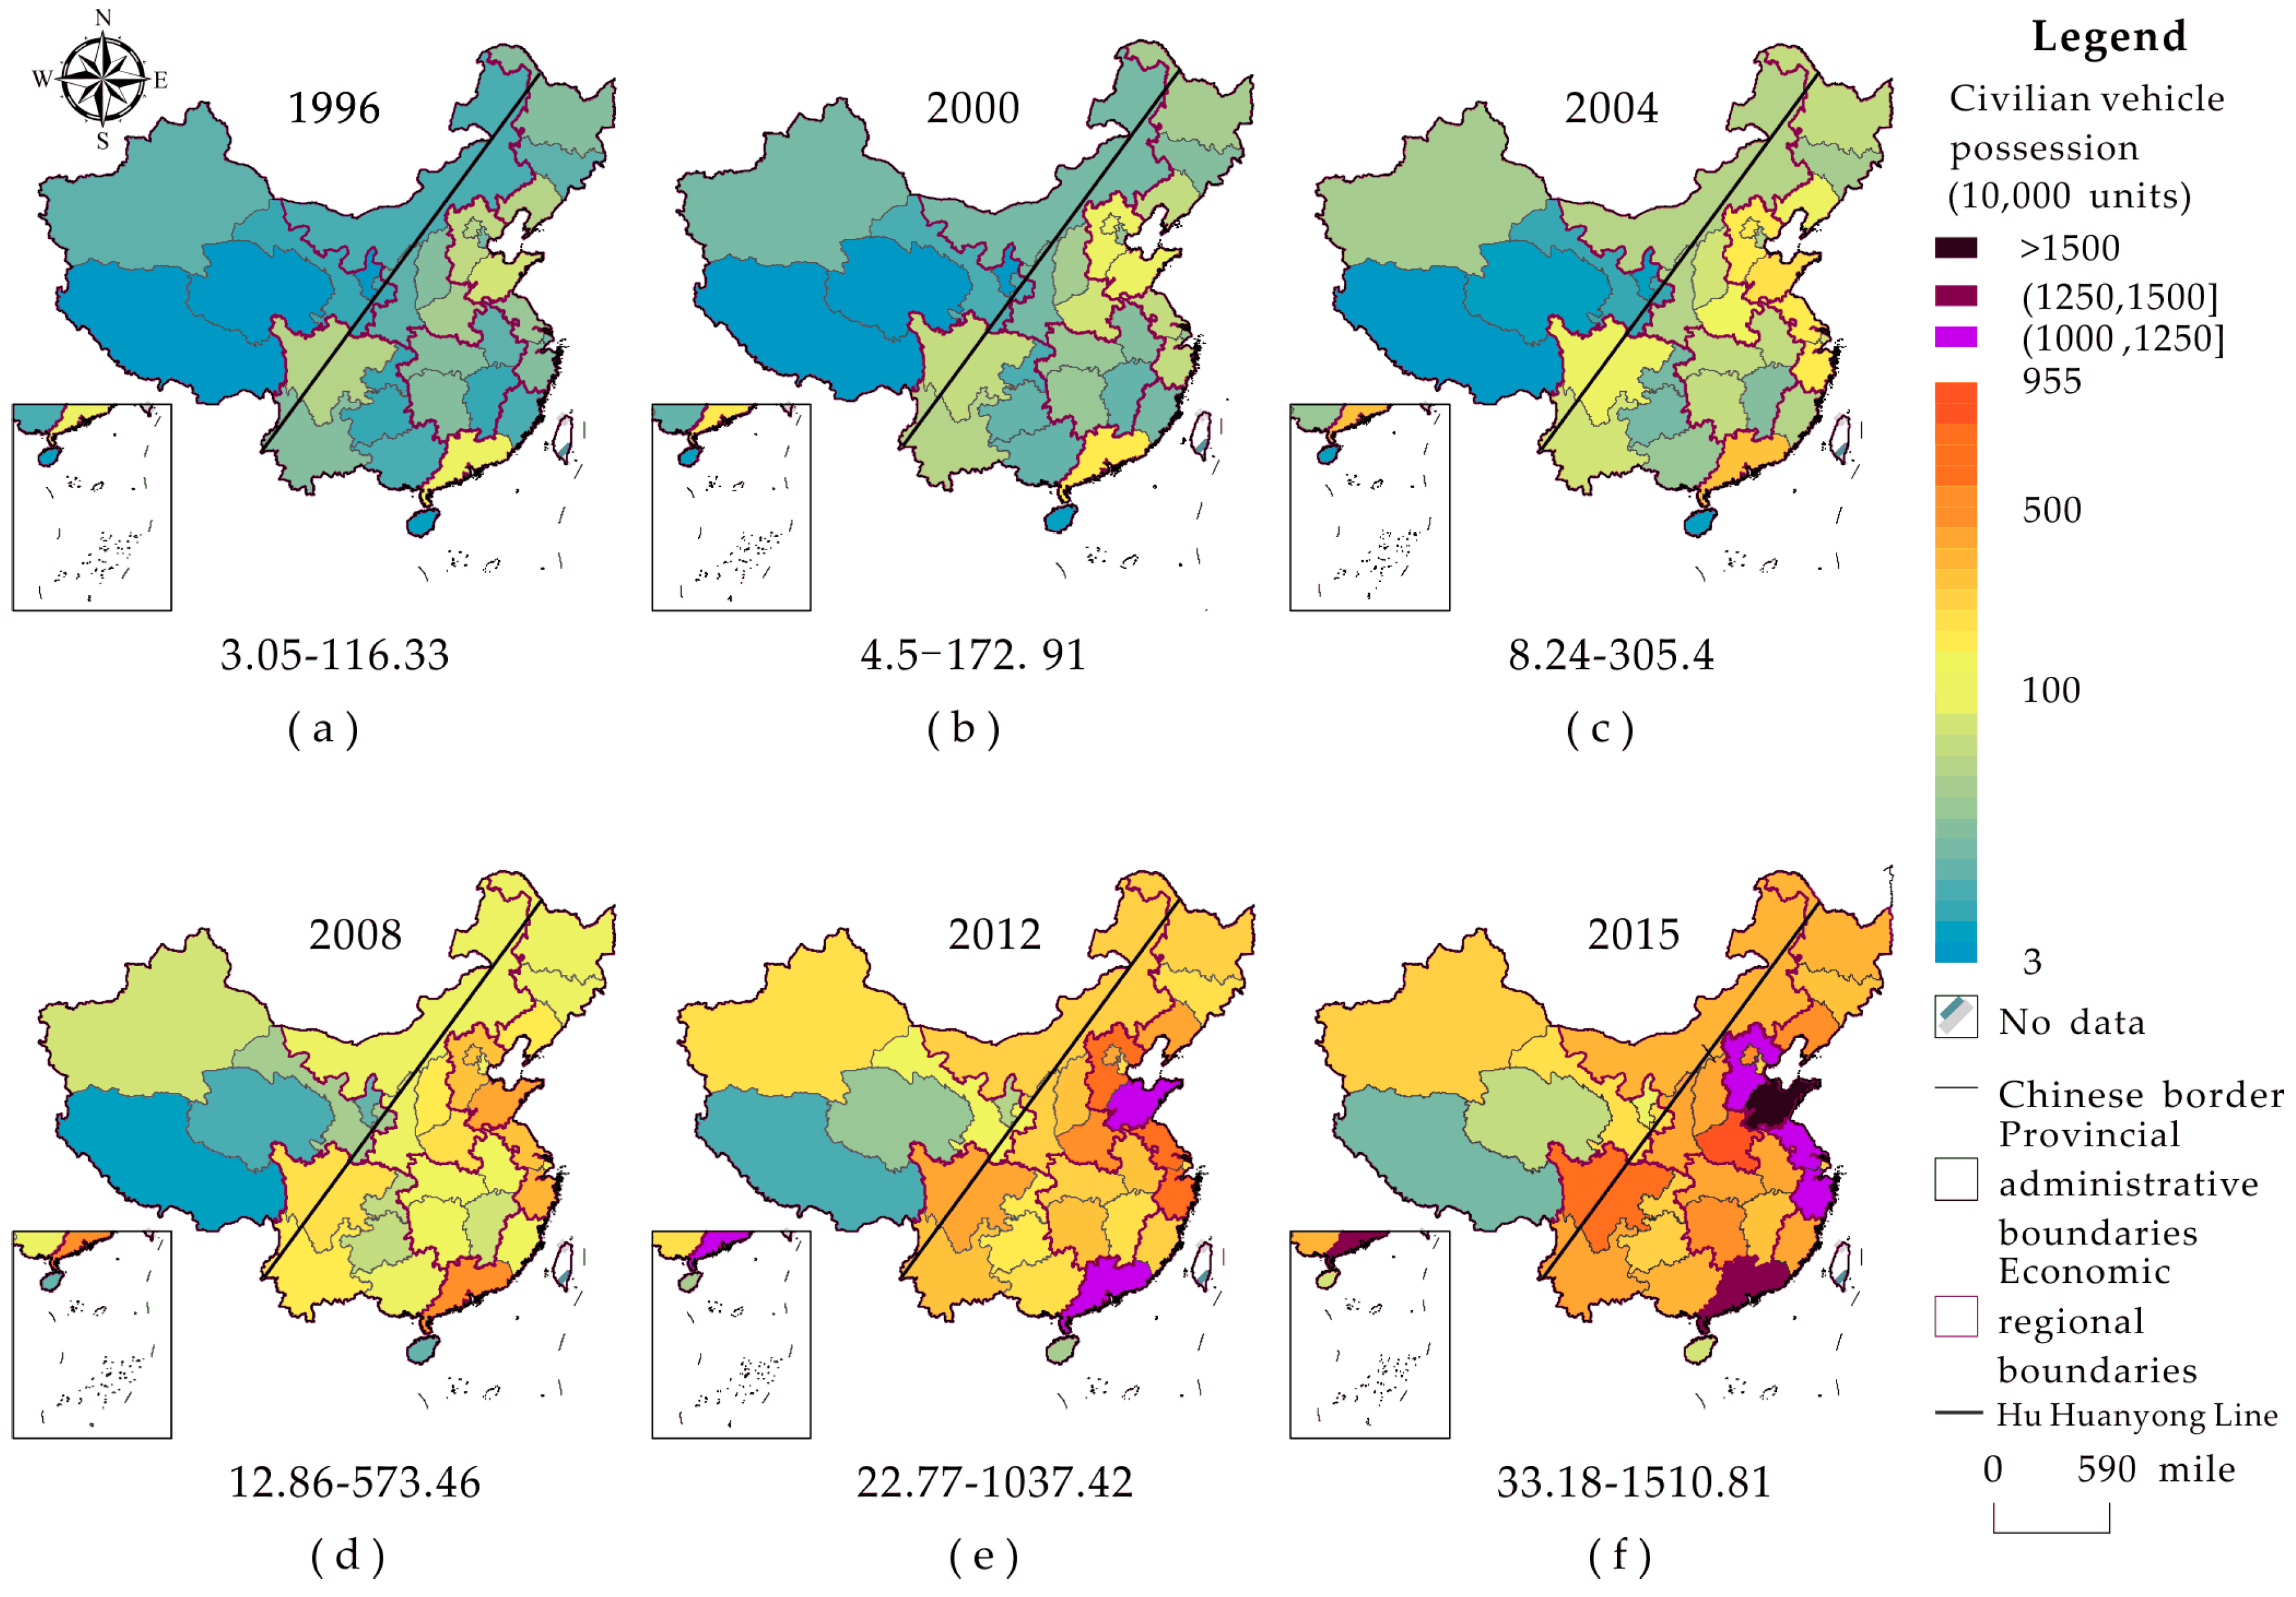
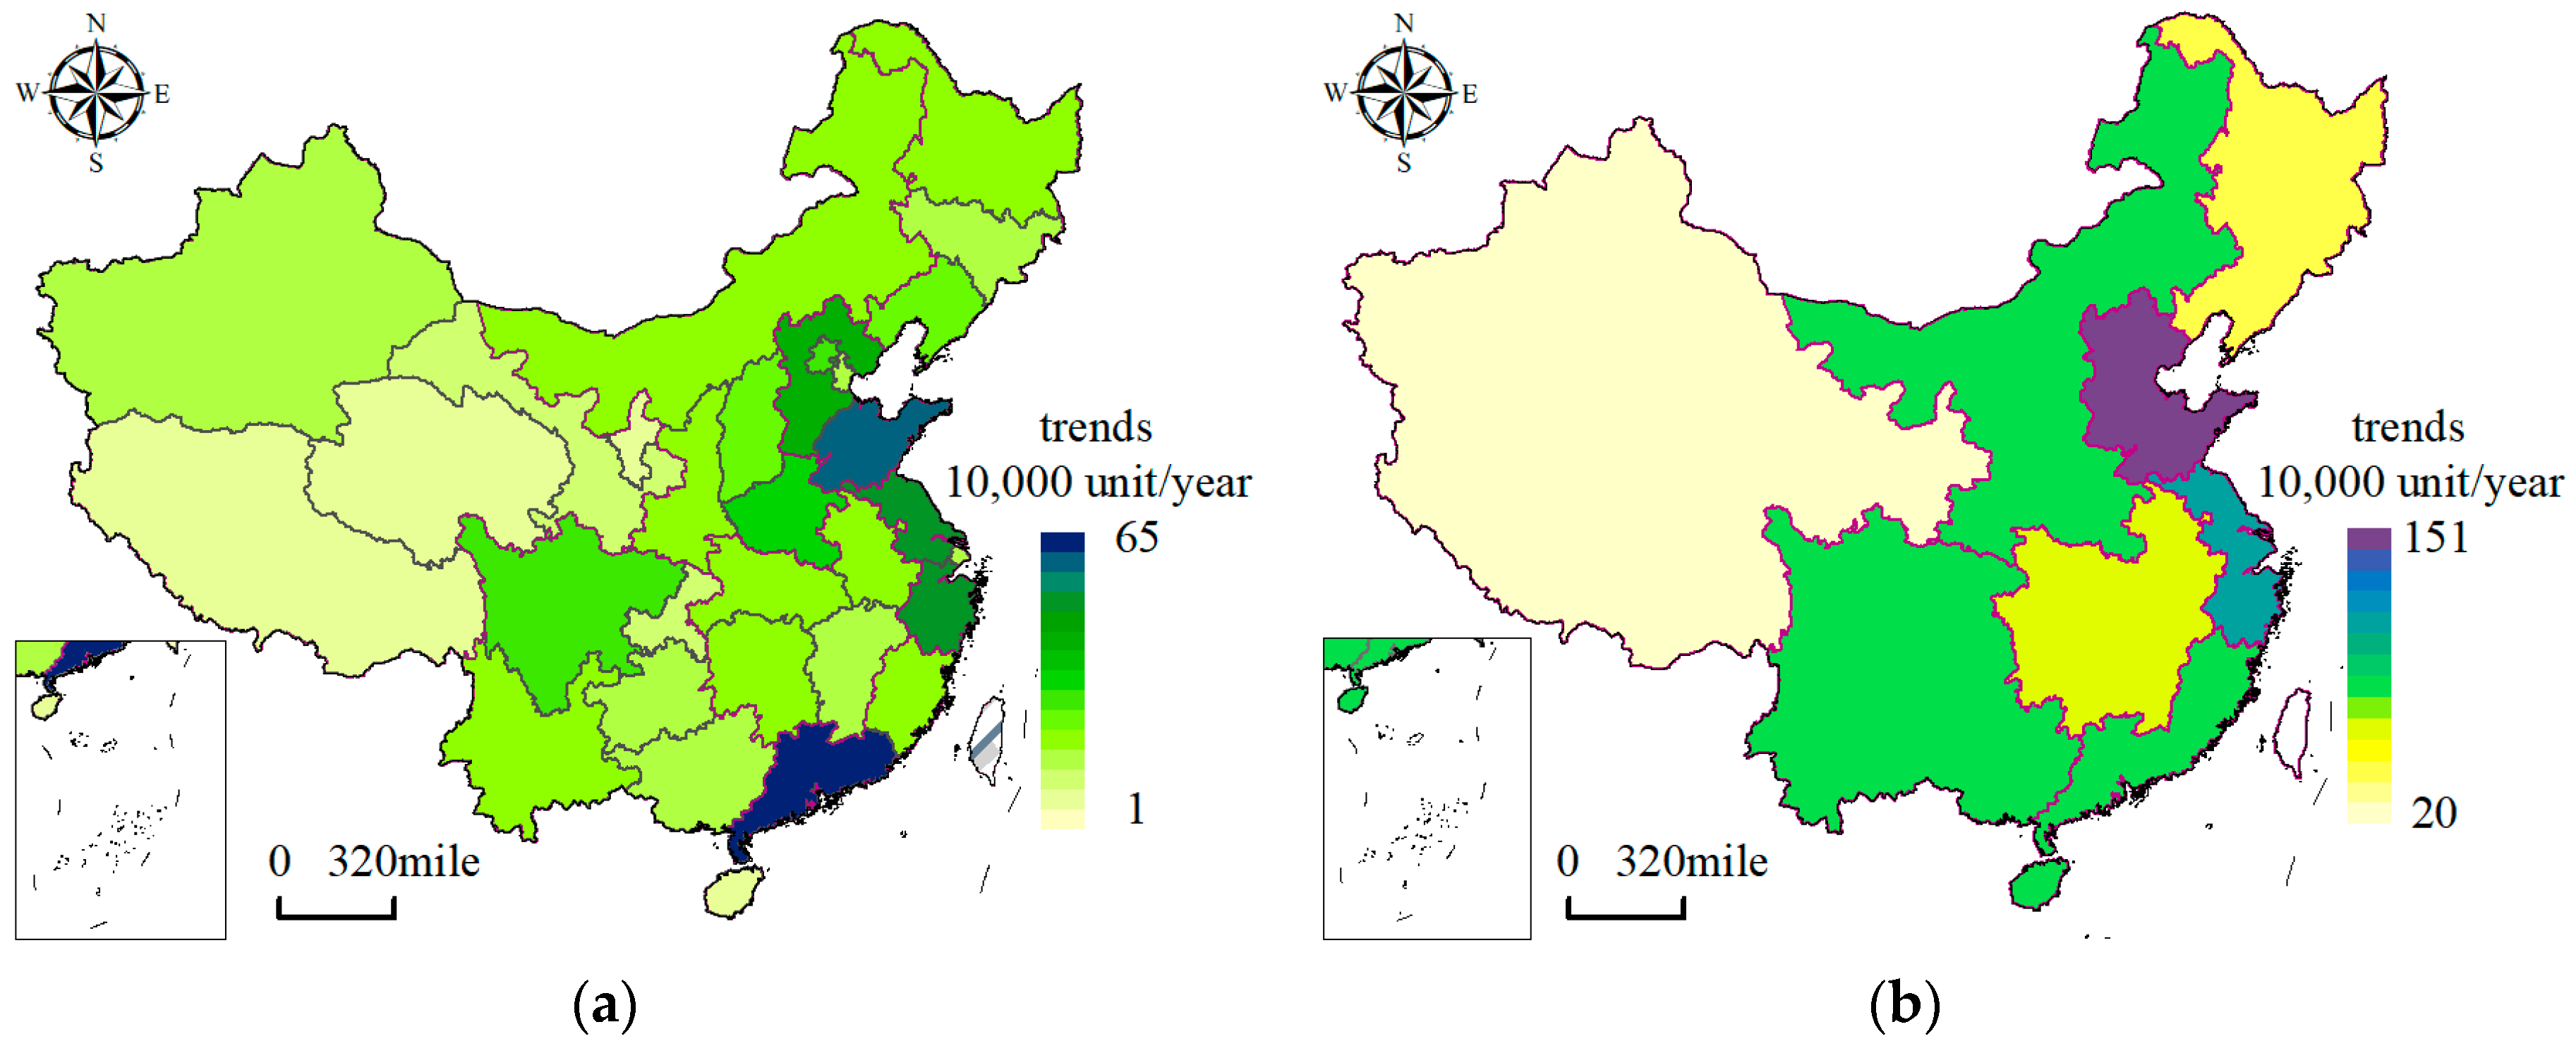
3.1. Temporal and Spatial Characteristics of Civil Vehicles’ Possession

It can be clearly seen from Figure 2 that civil vehicles’ possession in China exceeded 30 million for the first time in 2005, its annual growth rate exceeded 10% in the study period and its tendency rate is 6,638,300 units/year (α = 0.01).
It can be clearly seen from Figure 3 that from 1996 to 2015, civil vehicle possession quantity in the NC region, accounting for 20~24%, is far more than other regions (e.g., NW, MYR, SW and SC regions). Nearly 45–53% of civil vehicles are concentrated in coastal areas including NC, EC and SC regions.
Figure 4 shows the temporal-spatial profile of civil vehicle possession in 31 Chinese provinces. It can be clearly seen from Figure 4 that civil vehicle possession experienced a sharp increase from 1996 to 2015. In the study period, possession of civil vehicles in Tibet was the lowest. Possession of civil vehicles in Guangdong was the highest from 1996 to 2012 but from 2013 to 2015, Shandong overtook and became the highest province. By 2012, possession quantity of civil vehicles in Guangdong and Shandong exceeded 10 million for the first time. Possession quantity of civil vehicles in five provinces, Shandong, Jiangsu, Zhejiang, Hebei and Guangdong, has exceeded 10 million by 2015, among them, possession quantity in Shandong Province exceeded 15 million for the first time. Civil vehicle’ possession in each province has a significant trend of spatial agglomeration. Civil vehicle possession on two sides of the Hu Huanyong Line [31] shows obvious differences.
Table 1 shows the results of M-K test token on civil vehicle possession of the whole nation, each province and every economic region from 1996 to 2015. For a better understanding of the spatial distribution of the growth trend of civil vehicle possession, Figure 5 shows the spatial distribution of the tendency rate of civil vehicle possession based on province-level and region-level from 1996 to 2015. All series of civil vehicle possession sequences showed an increasing trend at the 1% significance level in three spatial scales. At the provincial scales, magnitude of the tendency rate of civil vehicle possession exceeded 500,000 units/year in Zhejiang, Jiangsu, Shandong and Guangdong, surpassing other provinces significantly. In addition, the magnitude of tendency rate of civil vehicle possession was less than 50,000 units/year with slow growth rate.
Increasing trend of civil vehicle possession was the slowest in NW region and fastest in NC regions. SW, SC, MYR regions had a similar increasing trend. Although the NC and EC regions have the fastest increasing trend in civil vehicle possession, the tendency rate of civil vehicle possession is low in Beijing, Tianjing and Shanghai. This is largely because of the policy in taking down vehicle quantity. At the regional scales and provincial scales, civil vehicle possession on two sides of the Hu Line shows obvious differences. Civil vehicle possession and its growth rate are gradually decreasing from the coast to the inland and from east to west.
Based on the Mann-Kendall rank statistic test, we found the intersection of two lines, Z1 and Z2, for each series of civil vehicle possession, which represents the beginning of changing. The change point analysis in the civil vehicle possession from 1996 to 2015 are summarized in Table 1. By analyzing, change from slow growth to rapid growth was detected in every time series of civil vehicle possession in three spatial scales and the confidence levels of all the change point are 99%. The sudden change in the national-scale civil vehicle possession began around 2005 to 2006. Change starting time in most regions and provinces was consistent with the national scale, except Hainan beginning around 2008 to 2009, Liaoning, Heilongjiang, Gansu, Qinghai and NW beginning around 2006 to 2007.

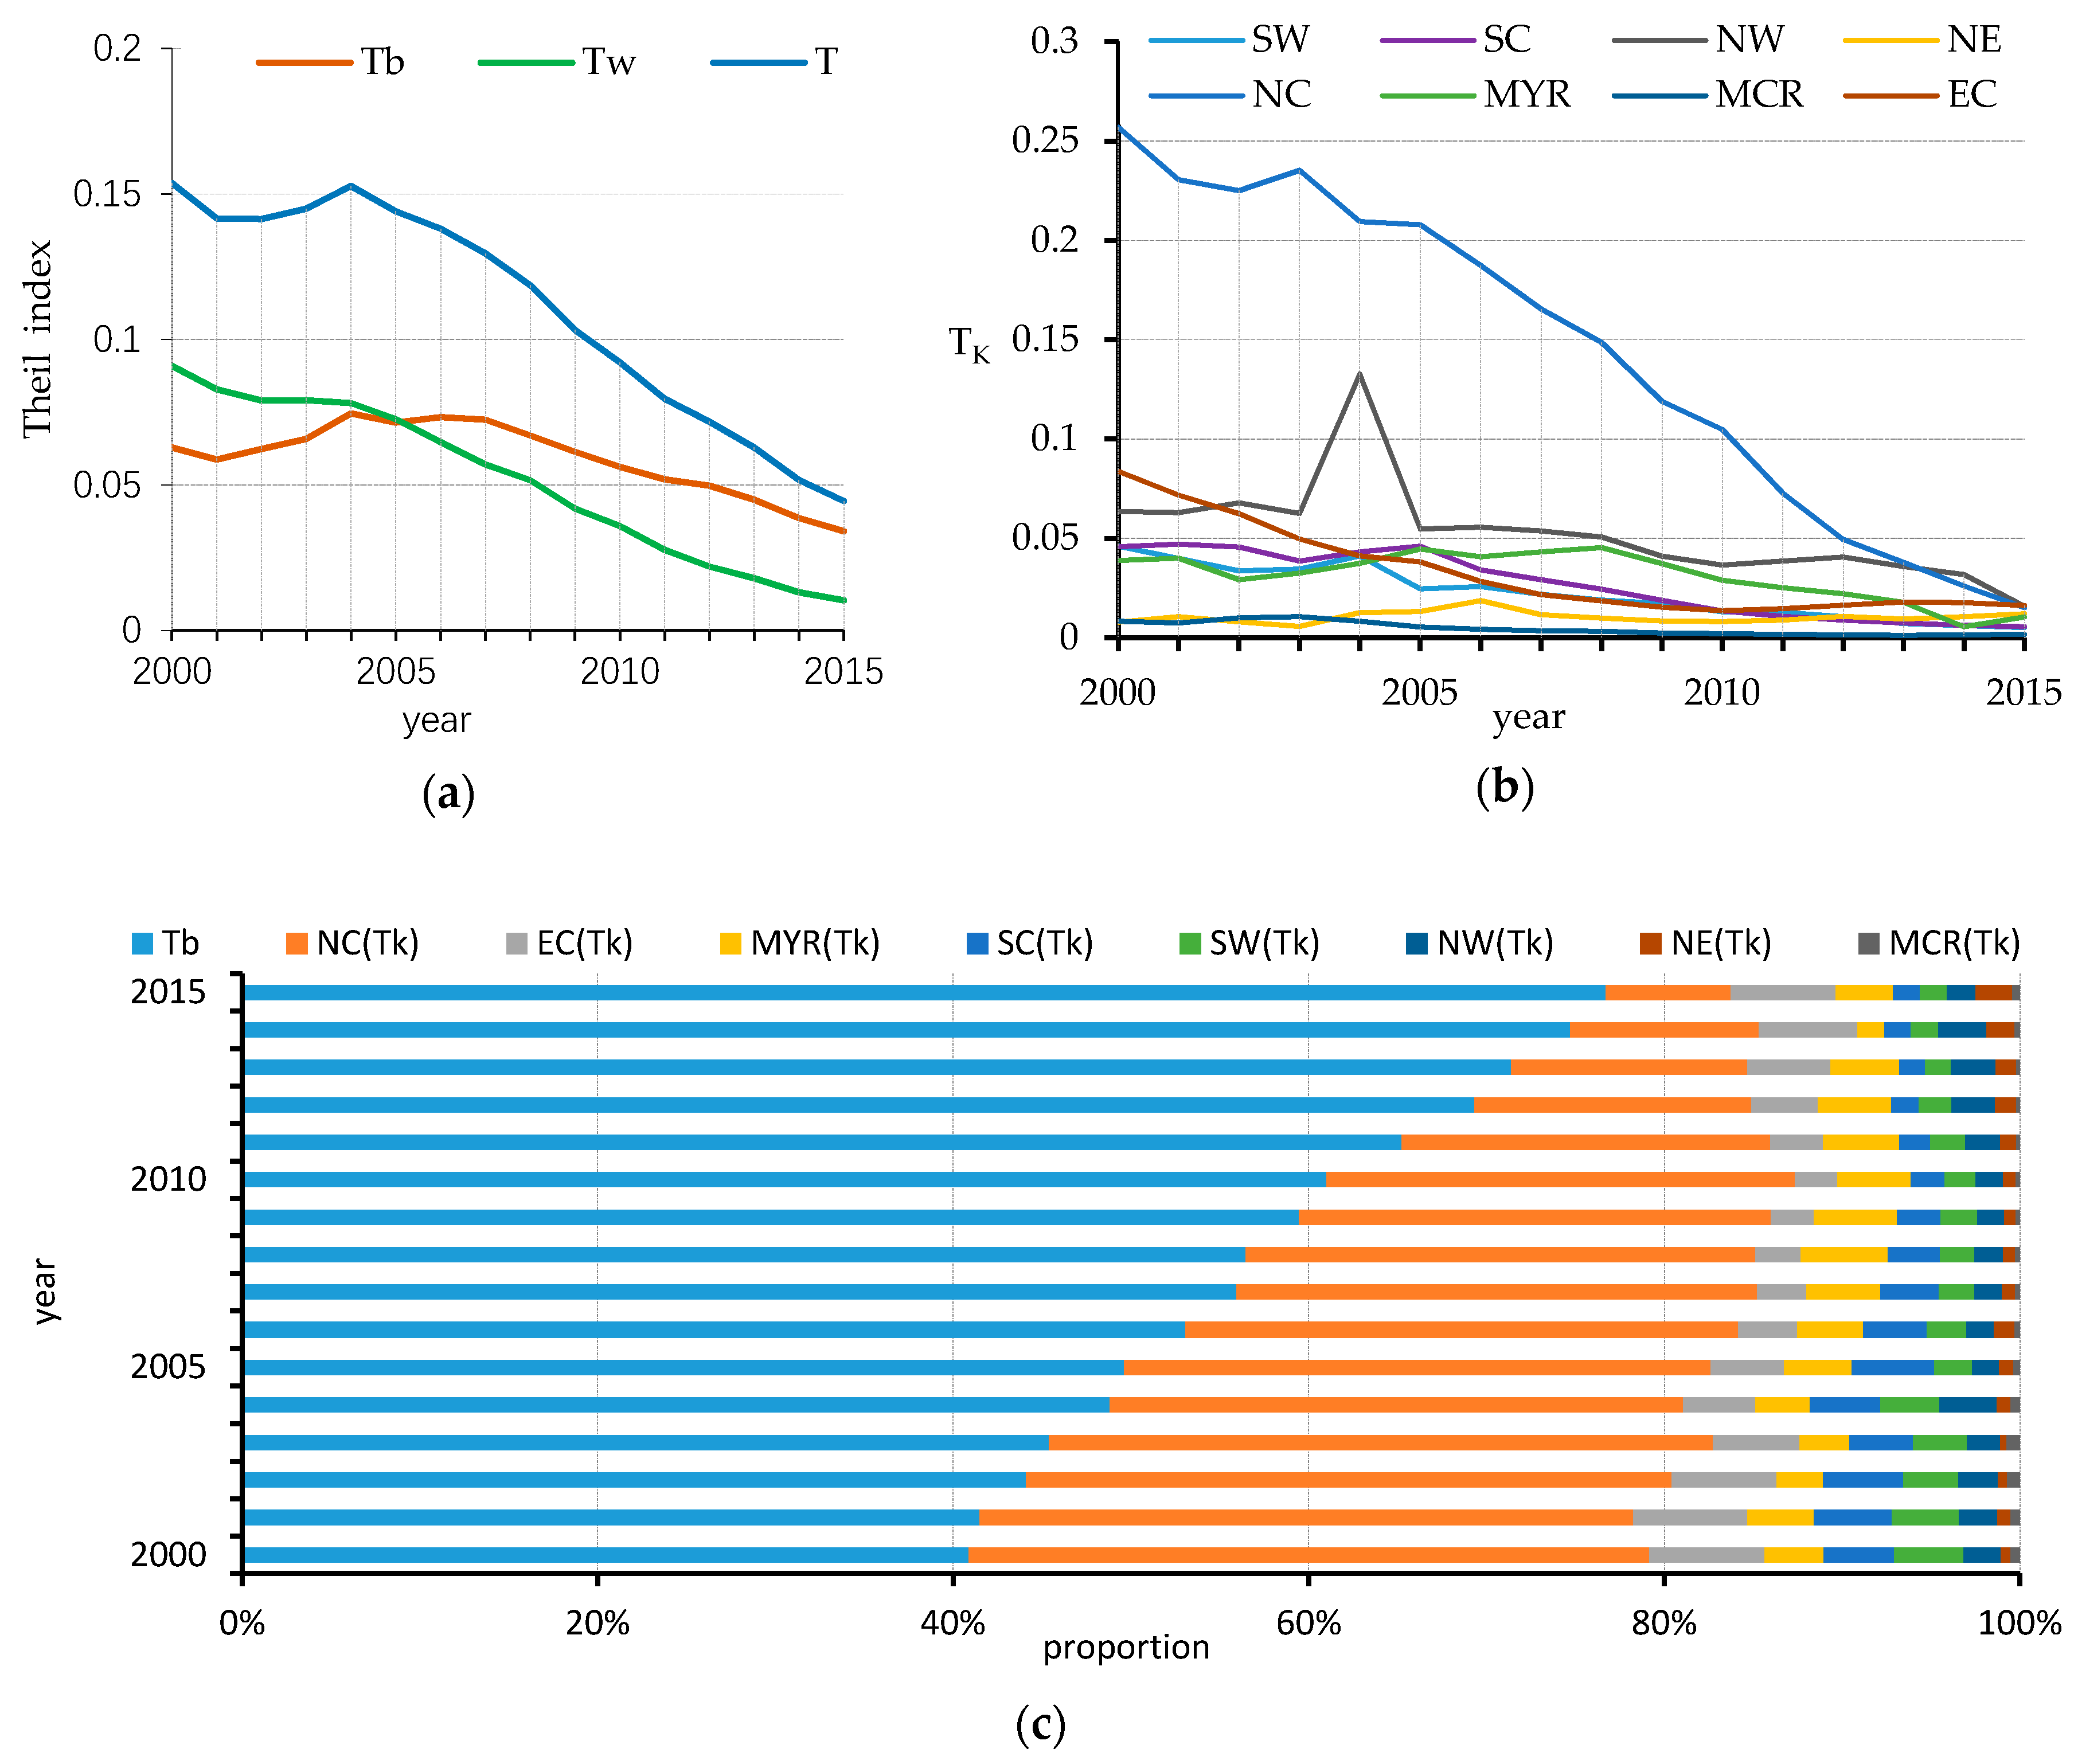
3.2. Analysis of the Civil Vehicles Inequalities

The above-mentioned analyses show that overall, the number of civil vehicles in China has increased significantly and they have shown different characteristics in different areas. However, the specific regional differences are still unknown. In this part, we aim to use the Theil index method to examine the inequality of civil vehicles in China.
Figure 6a describes the inequality of civil vehicle nationwide (T), the between-region inequality (Tb and the total within-region inequality (Tw) from 2000 to 2015. Figure 6b describes the changing situation of the inequality between provinces in each economic region (Tk) from 2000 to 2015. Calculating the contribution rates (Dw, Db, Dk) of Tw, Tb and Tk to T respectively can analyze the main components making up the inequality in the distribution of nationwide civil vehicle possession. Figure 6c describes the changing in the contribution rates. Table 2 shows the results of the M-K test for T, Tw, Tb, Tk, Dw, Db, and Dk.
It can be clearly seen that both T and Tb experienced a slight fluctuation from increasing to decreasing around 2000 to 2004. T, Tb and Tw showed a significant downward trend and the downward trend of Tw was higher than that of Tb from 2000 to 2015. Tw was greater than Tb from 2000 to 2005. Tb was close to Tw in 2005. Tb was greater than Tw from 2005 to 2015. Tb was about 3 times as large as Tw in 2015.
According to Figure 6b, Tk in NC region far exceeded other regions from 2000 to 2013, then from 2014 to 2015 Tk in the EC region greater than that in NC region. As shown in Table 2, the mean value of Tk from 2000 to 2015 is decreasing in the order of NC, SN, EC, MYR, SC, NW, NE and MCR regions, which showed the characteristics of the east high and the west low. The trend of Tk in NE region is not significant but that in other regions showed a significant downward trend (α = 0.01). The negative trend of Tk in the NC area was the largest (−0.0005/year) while the smallest is in the MCR area (−0.0019/year).
As show in Figure 6c, the within-region inequality (Tw) in the civil vehicle possession is the main component of the nationwide inequality (T) and the main component of Tb is the inequality within the Northern coastal area. From 2006 to 2015, Tb became the main component of T. Results of the M-K trend test for the contribution rate of each inequality to T for the period 2000–2015 are reported in Table 2. Both positive and negative trends were identified by the M-K test in the contribution rate of each inequality. By analyzing, the contribution rate (Dk) of Tk to T in the NE region showed non-significant decreasing trends and in MYR and SW regions showed non-significant increasing trends. Other contribution rates all passed (α = 0.01) and changing trend was detected to be outstanding. Dw showed a significant increasing trend and Db showed a significant decreasing trend. Dk in EC region showed significant increasing trends but in NE, SC, MCR and NW regions showed significant decreasing trends. Combining with the previous analyses, it can be seen that the spatial inequality in the civil vehicle possession will gradually decrease in the next a few years and inequality between regions will become the main component of the overall inequality in the development of civil vehicles. Moreover, the values of Tk in the NC and the EC regions were larger in 1996–2015; meanwhile, Dk showed a significant decrease trend of −0.0203/year in the NC region and a significant increase trend of 0.000565/year in EC region. Hence, the Tk in the EC region will be probably exceeding NC and contribute more to the Tw and the T in the future.

3.3. Impact Analysis of Economic Factors on Civilian Vehicles Possession

3.3.1. Extract Comprehensive Indicators of Economic Development Level

Scree plot of principal component analysis can be used to analyze the optimal number of extractions of the principal components [32]. The x-axis in the scree plot is the number of principal components and the y-axis is the eigenvalues. As shown in Figure 7, the first component has an eigenvalue of 3.79, which is greater than 1, starting from the second principal component, the curve decreases rapidly and the eigenvalues are all less than 1. It can be determined that it is more appropriate to extract the first component with most information being retained.
We can get the principal component PC1 according to the score coefficient for each variable in Table 3. P C 1   =   0.25547 · S 1   +   0.203776 · S 2   +   0.176927 · S 3   +   0.249195 · S 4   +   0.252361 · S 5 . Using the deviation standardization, PC1 is transformed into P’ with a value range from 0 to 1. P’ is the annual comprehensive economic development index, the greater the value of P,’ the higher the economic development level.

3.3.2. Test of Data and Model

From the above analysis, we know that the spatiotemporal development of civil vehicle shows a phased change and 2005–2006 is an important demarcation point for the development of civil vehicles in China. In order to study the dynamic relationship between economic development and civil vehicles’ growth in China, we built panel data models in three phases, including 1996–2005, 2006–2015 and 1996–2015.
Before modeling, the LLC, IPS, ADF and PP test were applied to judge whether the two variables, car and P,’ in those three phases have a unit root or not. The null hypothesis of the unit root test is that each series in the panel dataset contains a unit root, while alternatively there is at least one of the individual series in the panel is stationary (no unit root) [29]. If most of the tested statistics reject the null hypothesis, the variables are proved to be at a stationary level. The unit root test results are shown in Table 4, both p’ and car in the three phases are integrated at order I (2), there may be a long-run equilibrium relationship between them. We need to further test whether co-integration exists between the variables or not. Then the two variables car and P’ are tested by the co-integration methods of Pedroni and Kao. According to the results in Table 5, five of the eight test statistics in both 1996–2005 and 1996–2015 phases and six of the eight test statistics in 1996–2015 phases rejected the null hypothesis at the 95% confidence level that there is no co-integration relationship. Therefore, long-term co-integration relationships exist between P’ and car in the three phases and the panel data model can be built.
Based on each province’s annual P’ and car data, we constructed 30 panel data models on three time periods and three spatial scales. The results of the 30 panel data models are shown in Table 6. To verify the accuracy of the model and the parameter settings, a series of tests were performed on the model such as the F test, Hausman test. Table 6 shows the results. R2 in each model in the range of 0.91 to 0.99 and close to 1.0, indicating that the model’s performance is reasonable. In the variable coefficient panel data model at the provincial scale, the number of sections is larger than the number of periods and it is impossible to construct a random effect model. Therefore, we do not need to do the Hausman test but the F test only.

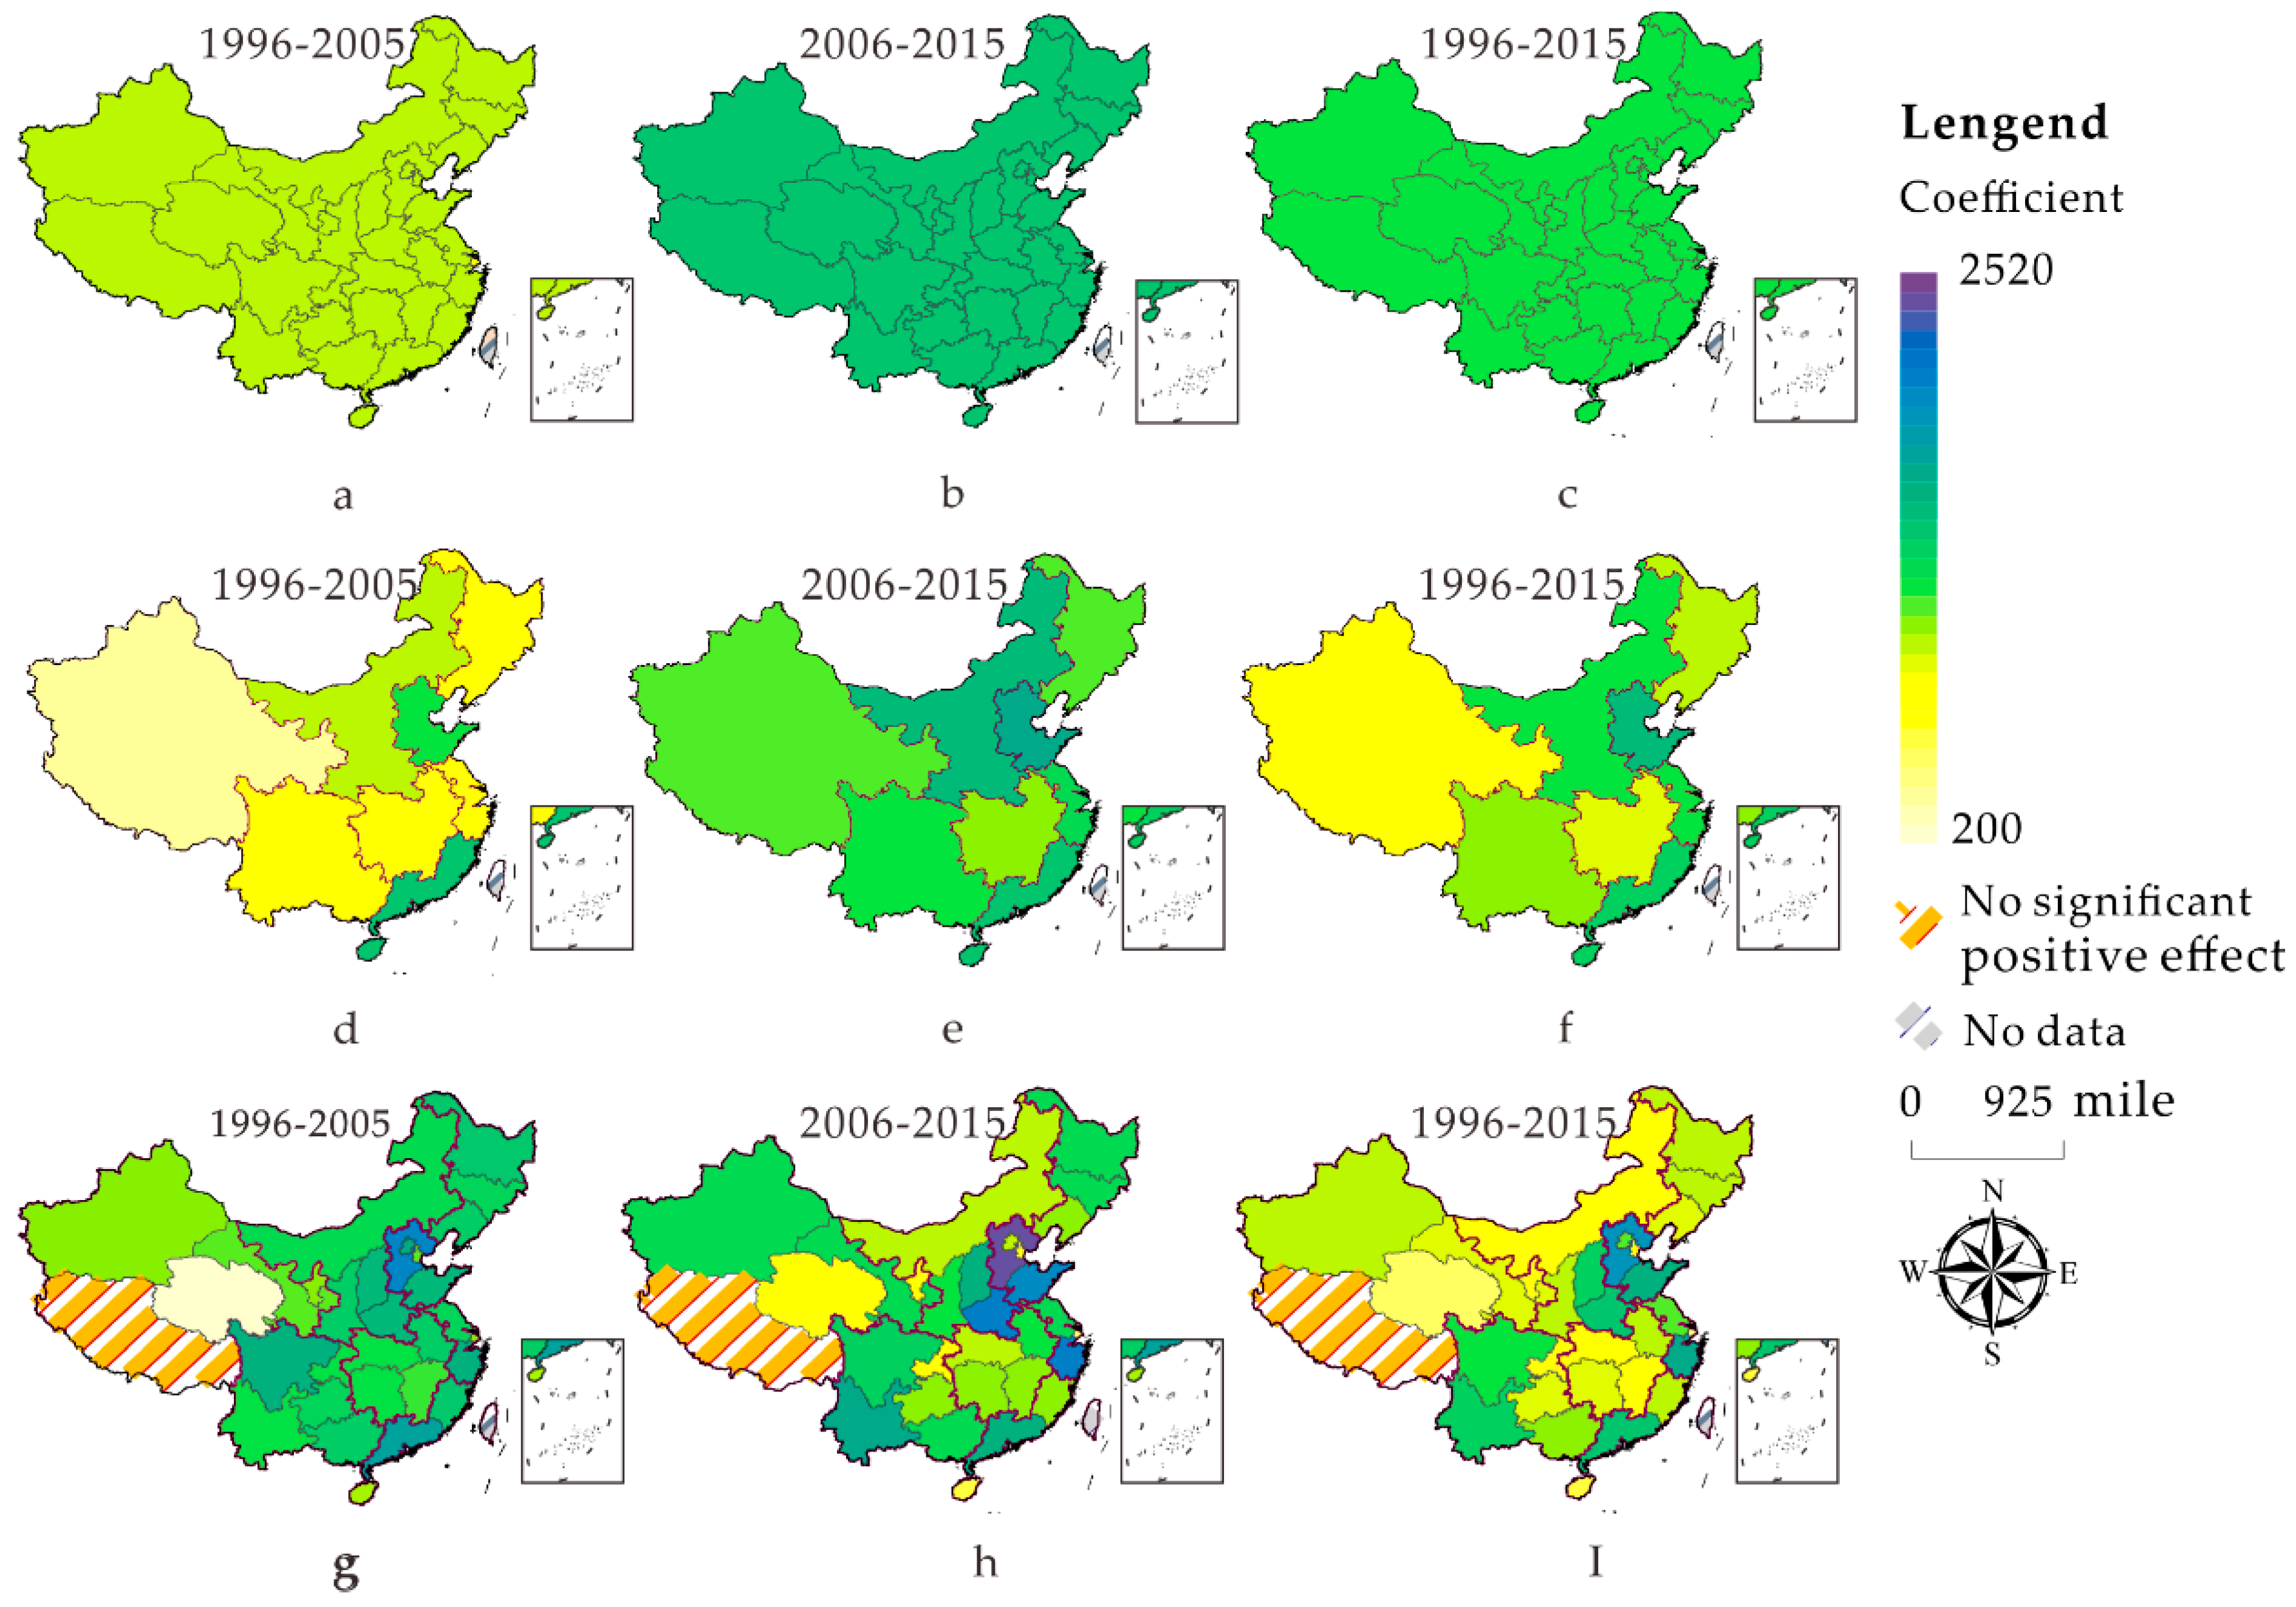
3.3.3. Impact Analysis of Economic Factors on Civilian Vehicles Possession

Results show a positive impact of economic development on the possession of civil vehicles at the national level, in various economic regions and in all provinces but only Tibet is not significant. The model coefficient reveals the extent to which the economic level affects the possession of civil vehicles. Figure 8 shows the spatial distribution of the coefficients of the panel data model established in three time periods at three spatial scales. It can be observed from the horizontal comparison in Figure 8 that the economic development level of 2005–2015 in the three spatial scales promotes the growth of civil vehicles more than the 1996–2005 period. The positive impact of economic development on civil vehicles is significantly different in different time and space and presents similar features in adjacent areas.
Figure 8d–f shows the spatial distribution of panel data model coefficients in three stages of the eight economic regions. The positive impacts in NC and SC have exceeded the national level in the three time periods. MYR is close to the national level, while SW is close to NE. In the period of 1996–2005, 2006–2015 and 1996–2015, the areas with the least positive impact are respectively the MYR, MCR and MYR.
Figure 8g–i shows the spatial distribution of panel data model coefficients at the provincial scale. As shown, the positive impacts of economic level in Guangdong, Hebei, Henan, Shandong and Zhejiang provinces on the possession of civilian vehicles in all three periods exceeded the national level, with Guangdong far surpassing other provinces. In the period 1996–2005, the significant positive impact was the smallest in Qinghai and was smaller in Hainan, Ningxia, Xinjiang and Shanghai. In the period of 2006–2015, the significant positive impact was the smallest in Shanghai and was smaller in Hainan, Qinghai and Tianjin. In the period of 1996–2015, the significant positive impact was smaller in Shanghai, Qinghai and Hainan.

4. Discussion

Based on the previous work [33,34,35] and the three spatial scales (national, regional, provincial), this manuscript first analyzed the temporal characteristics of the possession of civil vehicles. The Mann Kendall test method is used to analyze the trend of time series (i.e., civil vehicle possession, Theil index, intra-regional inequalities, inter-regional inequalities and contribution rates of inequality, etc.) and detect the sudden change of the possession of civil vehicles. We analyze the possession of civil vehicles curve and map and use the Theil index to quantify the spatial distribution. And then we used principal components analysis (PCA) to calculate the weighted composite index that quantifies the level of economic development. Finally, we used panel data modeling to comprehensively examine the impact of economic development on the possession of civil vehicles in the country, various economic regions and provinces. In most developing countries like China, regional diversity of car possession is very common. Methods used in this study can be widely applied in these countries. Results of the analysis may provide theoretical basis and scientific guidance for a rational planning in the vehicle industry in developing countries.
The possession of civil vehicles in a country or region is often an indicator of the usage of cars. In the past two decades, with a rapid development of economy, the possession of civil vehicles has a substantial increase. This trend has a major impact on the local and global environment. There are significant inequalities in the spatial and temporal distribution of civil vehicle’ possession in various provinces or regions in China. However, few studies explored the possession of civil vehicles owned by the long-term and multi-space scales in China. Results of this paper explained the regional diversity of civil vehicles’ possession in multi-space scales, including the spatial and temporal characteristics and the impacts of economic levels on the possession of civil vehicles. These results provide meaningful suggestions for policymakers and stakeholders.
During 1996–2015, the possession of civil vehicles in China increased significantly, among the possession of civil vehicles, its spatial inequalities and the positive impact of economic development on it have shown a trend of decreasing from east to west and from coastal to inland. The growth rate of civil vehicles’ possession in various provinces has intensified since 2005–2006. In general, the number of civilian vehicles in China has shown significant phased changes: Slow growth in 1996–2005 and rapid growth in 2006–2015. From 2000 to 2015, the disparities in the spatial distribution of civil vehicles’ possession showed a trend of “first increased slightly and then decreased continuously.” Results are consistent with the study of the spatial and temporal evolution of regional economic differences in China by Feng [36]. During 2000–2005, the within-regional inequalities were greater than the between-regional inequalities. The inequalities between provinces in the northern coastal areas (NC) were the main components of the within-regional inequalities, since 2006, the between-regional inequalities have been greater than the within-regional inequalities.
The level of economic development has a significant positive impact on the possession of civil vehicles, which is greater in 2006–2015 than in 1996–2005. As pointed out in many studies, the possession of civil vehicles has a strong relationship with economic level. In general, the spatial-temporal characteristics of civil vehicles were in line with economic development. 1995 to 2005 is the transitional stage of the initial establishment of the market economic system in China. The economic level at this stage is relatively low, the growth rate of civil vehicles is slow and the economic level has a less positive impact on civilian vehicles. The development strategy in China is mainly in the form of points, concentrated in Shenzhen, Shanghai, Beijing, Tianjin and other places. These strategies have created an imbalance in regional economic development and the development of the automobile industry. During the period of the 11th Five-Year Plan and the 12th Five-Year Plan (i.e., 2006 to 2015), economy had a rapid development, as a result, the growth rate of civil car possession is also accelerating. In order to achieve a sustainable development, Chinese government prepared and implemented a series of policies, such as the “Rise of Central China,” “Northeast Area Revitalization Plan,” “China Western Development” and “Coordinated rural-urban Development” to reduce regional disparities. Because of these policies, the problems of imbalanced regional economic development and the disparities in regional civil car possession have been alleviated. However, in some provinces (or cities) with higher levels of economic development, such as Beijing, Shanghai, Tianjin, the economic level has less effect on the possession of civil vehicles. This trend may be caused by stricter restrictions on vehicle possession, such as purchase lottery and odd-and-even license plate policies.
As our analysis is based on data collected for each province, it is hard to investigate civil vehicle development through the indicators of per capita road area, public transportation and building area. As a result, we only used the gross regional product, household consumption expenditure, length of highways, local governments general budgetary revenue and total investment in fixed asset to measure economic development level. Chinese government has already adopted a series of intervention policies in some areas to curb the negative effect caused by the rapid growth of civil vehicle. At this point, we are not able to measure the influence of these interventions on the rate of civil vehicle possession. this paper thus does not take this part into consideration. We will focus on these issues in our future research.

Author Contributions

Y.L. and K.Y. designed and performed this research; Y.S., D.X. analyzed the data and performed the experiments; Y.S. drafted the manuscript; X.Z. edited the manuscript.

Funding

This research was funded by National Natural Science Foundation of China (41761084), China High Technology Research and Development Program 863 (2012AA121402) and Yunnan Natural Science Foundation of China (2016FD020).

Conflicts of Interest

The founding sponsors had no role in the design of the study; in the collection, analyses, or interpretation of data; in the writing of the manuscript and in the decision to publish the results.

References

  1. National Bureau of Statistics of China. Available online: http://data.stats.gov.cn/english/easyquery.htm?cn=C01 (accessed on 2 August 2018).
  2. Hao, H.; Wang, H.; Yi, R. Hybrid modeling of China’s vehicle ownership and projection through 2050. Energy 2011, 36, 1351–1361. [Google Scholar] [CrossRef]
  3. Dargay, J.; Gately, D.; Sommer, M. Vehicle Ownership and Income Growth, Worldwide: 1960–2030. Energy J. 2007, 28, 143–170. [Google Scholar] [CrossRef]
  4. Zhang, G.; Yau, K.K.W.; Chen, G. Risk factors associated with traffic violations and accident severity in China. Accid. Anal. Prev. 2013, 59, 18–25. [Google Scholar] [CrossRef] [PubMed]
  5. Hu, X.; Chang, S.; Li, J. Energy for sustainable road transportation in China: Challenges, initiatives and policy implications. Energy 2010, 35, 4289–4301. [Google Scholar] [CrossRef]
  6. Wang, R.; Yuan, Q. Parking practices and policies under rapid motorization: The case of China. Transp. Policy 2013, 30, 109–116. [Google Scholar] [CrossRef]
  7. Sun, C.; Luo, Y.; Li, J. Urban traffic infrastructure investment and air pollution: Evidence from the 83 cities in China. J. Clean. Prod. 2018, 172, 488–496. [Google Scholar] [CrossRef]
  8. Sekine, K.; Shima, M.; Nitta, Y. Long term effects of exposure to automobile exhaust on the pulmonary function of female adults in Tokyo, Japan. Occup. Environ. Med. 2004, 61, 350–357. [Google Scholar] [CrossRef] [PubMed] [Green Version]
  9. Zhang, Z.; Jin, W.; Jiang, H. Modeling heterogeneous vehicle ownership in China: A case study based on the Chinese national survey. Transp. Policy 2017, 54, 11–20. [Google Scholar] [CrossRef]
  10. Vine, S.L.; Wu, C.; Polak, J. A nationwide study of factors associated with household car ownership in China. IATSS Res. 2017. Available online: https://www.sciencedirect.com/science/article/pii/S0386111217300614 (accessed on 2 August 2018).
  11. Wu, N.; Zhao, S. A study on the determinants of private car ownership in China: Findings from the panel data. Transp. Res. Part A Policy Pract. 2016, 85, 186–195. [Google Scholar] [CrossRef]
  12. Yang, Z.; Jia, P.; Liu, W. Car ownership and urban development in Chinese cities: A panel data analysis. J. Transp. Geogr. 2017, 58, 127–134. [Google Scholar] [CrossRef]
  13. Li, J.; Walker, J.L.; Inivasan, S. Modeling Private Car Ownership in China. Transportation Research Record. J. Transp. Res. Board 2010, 2193, 76–84. [Google Scholar] [CrossRef]
  14. Dargay, J.; Gately, D. Income’s effect on car and vehicle ownership, worldwide: 1960–2015. Transp. Res. Part A Policy Pract. 1999, 33, 101–138. [Google Scholar] [CrossRef]
  15. Dargay, J. The effect of prices and income on car travel in the UK. Transp. Res. Part A Policy Pract. 2007, 41, 949–960. [Google Scholar] [CrossRef] [Green Version]
  16. Matas, A.; Raymond, J.L. Changes in the structure of car ownership in Spain. Transp. Res. Part A Policy Pract. 2008, 42, 187–202. [Google Scholar] [CrossRef]
  17. Mogridge, M.J.H. The Prediction of Car Ownership. J. Transp. Econ. Policy 1967, 1, 52–74. [Google Scholar]
  18. Huang, X.Y.; Cao, X.S.; Li, T. The Spatio-temporal Variations of Urban Private Car Ownership in China and Their Influencing Factors. Acta Geogr. Sin. 2012, 67, 745–757. [Google Scholar] [CrossRef]
  19. Xu, X.C. China’s economic growth in future and prospect of its international economic position. Econ. Res. J. 2002, 3, 27–35. [Google Scholar]
  20. Xu, Y.Q.; Jia, X.L. The measurement and evaluation of regional economic development disparities in China recent 20 years. Econ. Geogr. 2005, 25, 600–603. [Google Scholar]
  21. Gocic, M.; Trajkovic, S. Analysis of changes in meteorological variables using Mann-Kendall and Sen’s slope estimator statistical tests in Serbia. Glob. Planet. Chang. 2013, 100, 172–182. [Google Scholar] [CrossRef]
  22. Some’e, B.S.; Ezani, A.; Tabari, H. Spatiotemporal trends and change point of precipitation in Iran. Atmos. Res. 2012, 113, 1–12. [Google Scholar] [CrossRef]
  23. Theil, H. Economics and Information Theory; North-Holland Publishing Company: Amsterdam, The Netherlands, 1967. [Google Scholar]
  24. Lin, B.; Fei, R. Regional differences of CO2 emissions performance in China’s agricultural sector: A Malmquist index approach. Eur. J. Agron. 2015, 70, 33–40. [Google Scholar] [CrossRef]
  25. Yu, W.; Zhou, W. Spatial pattern of urban change in two Chinese megaregions: Contrasting responses to national policy and economic mode. Sci. Total Environ. 2018, 634, 1362–1371. [Google Scholar] [CrossRef] [PubMed]
  26. Vyas, S.; Kumaranayake, L. Constructing socio-economic status indices: How to use principal components analysis. Health Policy Plan. 2006, 21, 459–468. [Google Scholar] [CrossRef] [PubMed]
  27. Săndică, A.M.; Dudian, M.; Ştefănescu, A. Air Pollution and Human Development in Europe: A New Index Using Principal Component Analysis. Sustainability 2018, 10, 312. [Google Scholar] [CrossRef]
  28. Yang, W.; Li, T.; Cao, X. Examining the impacts of socio-economic factors, urban form and transportation development on CO2 emissions from transportation in China: A panel data analysis of China’s provinces. Habitat Int. 2015, 49, 212–220. [Google Scholar] [CrossRef]
  29. Inglesi-Lotz, R. The impact of renewable energy consumption to economic growth: A panel data application. Energy Econ. 2016, 53, 58–63. [Google Scholar] [CrossRef] [Green Version]
  30. Pedroni, P. Panel cointegration: Asymptotic and finite sample properties of pooled time series tests with an application to the PPP hypothesis. Econ. Theory 2004, 20, 597–625. [Google Scholar] [CrossRef]
  31. Huanyong, H. The distribution, regionalization and prospect of China’s population. Acta Geogr. Sin. 1990, 45, 139–145. [Google Scholar]
  32. Gong, L.; Meng, X.; Liu, N. Evaluation of apple quality based on principal component and hierarchical cluster analysis. Trans. Chin. Soc. Agric. Eng. 2014, 30, 276–285. [Google Scholar] [CrossRef]
  33. Yang, K.; Yu, Z.; Luo, Y. Spatial and temporal variations in the relationship between lake water surface temperatures and water quality-A case study of Dianchi Lake. Sci. Total Environ. 2018, 624, 859–871. [Google Scholar] [CrossRef] [PubMed]
  34. Luo, Y.; Yang, K.; Yu, Z. Dynamic monitoring and prediction of Dianchi Lake cyanobacteria outbreaks in the context of rapid urbanization. Environ. Sci. Pollut. Res. 2017, 24, 5335–5348. [Google Scholar] [CrossRef] [PubMed]
  35. Luo, Y.; Kun, Y.; Shi, Y. Research of radiosonde humidity sensor with temperature compensation function and experimental verification. Sens. Actuators A Phys. 2014, 218, 49–59. [Google Scholar] [CrossRef]
  36. Feng, C.C.; Zeng, Z.R.; Cui, N.N. The economic disparities and their spatio-temporal evolution in China since 2000. Geogr. Res. 2015, 34, 234–246. [Google Scholar] [CrossRef]
Figure 1. Study area.
Sustainability 10 02999 g001
Figure 2. Growth of civil vehicles possession in China from 1996 to 2015.
Sustainability 10 02999 g002
Figure 3. Development of civil vehicles in the eight economic zones: (a) Development curve of civilian vehicle possession in each region. (b) Change in civilian vehicle possession percentage of the total in each region from 1996 to 2015.
Sustainability 10 02999 g003
Figure 4. Temporal-Spatial distribution of civil vehicles’ possession in each province in some years: (a) 1996; (b) 2000; (c) 2004; (d) 2008; (e) 2012; (f) 2015.
Sustainability 10 02999 g004
Figure 5. Spatial distribution of trends in the possession of civilian vehicles from 1996 to 2015: (a) Provincial scale. (b) Regional scale.
Sustainability 10 02999 g005
Figure 6. Disparities in the spatial distribution of civilian vehicles’ possession in china: (a) The changing in the T, Tb and Tw from 2000 to 2015; (b) The changing in the Tk from 2000 to 2015; (c) The changing in the contribution rates.
Sustainability 10 02999 g006
Figure 7. Scree plot of principal component analysis.
Sustainability 10 02999 g007
Figure 8. The spatial distribution of the coefficients of the panel data model established in three time: (a) The spatial distribution of panel data model coefficients in 1996–2005 at the national level; (b) The spatial distribution of panel data model coefficients in 2005–2015 at the national level; (c) The spatial distribution of panel data model coefficients in 1996–2015 at the national level; (d) The spatial distribution of panel data model coefficients in 1996–2005 of the eight economic regions; (e) The spatial distribution of panel data model coefficients in 2005–2015 of the eight economic regions; (f) The spatial distribution of panel data model coefficients in 1996–2015 of the eight economic regions; (g) The spatial distribution of panel data model coefficients in 1996–2005 at the provincial scale; (h) The spatial distribution of panel data model coefficients in 2005–2015 at the provincial scale; (i) The spatial distribution of panel data model coefficients in 1996–2015 at the provincial scale.
Sustainability 10 02999 g008
Table 1. Results of the M-K tests for the possession of civilian vehicles.
ZoneProvinceMann-Kendall Test
Mutation TimeTrends
10,000 Unit/a
NCShandong2005–2006 ***63.25 ***
Hebei2005–2006 ***43.21 ***
Beijing2005–2006 ***27.65 ***
Tianjing2005–2006 ***12.65 ***
2005–2006 ***151.20 ***
ECJiangsu2005–2006 ***52.60 ***
Zhejiang2005–2006 ***50.79 ***
Shanghai2005–2006 ***12.42 ***
2005–2006 ***115.53 ***
MYRHenan2005–2006 ***33.73 ***
Shanxi2005–2006 ***21.52 ***
Shaanxi2005–2006 ***16.81 ***
Inner Mongolia2005–2006 ***16.95 ***
2005–2006 ***89.26 ***
NWXinjiang2005–2006 ***10.42 ***
Gansu2006–2007 ***7.56 ***
Ningxia2005–2006 ***3.79 ***
Qinghai2006–2007 ***2.74 ***
Tibet2005–2006 ***1.39 ***
2006–2007 ***25.81 ***
SCGuangdong2005–2006 ***66.83 ***
Fujian2005–2006 ***19.04 ***
Hainan2008–2009 ***3.20 ***
2005–2006 ***88.38 ***
MCRAnhui2005–2006 ***18.82 ***
Hunan2005–2006 ***18.32 ***
Hubei2005–2006 ***17.08 ***
Jiangxi2005–2006 ***12.34 ***
2005–2006 ***65.88 ***
NELiaoning2006–2007 ***23.15 ***
Heilongjiang2006–2007 ***15.16 ***
Jilin2005–2006 ***12.29 ***
2005–2006 ***49.52 ***
SWSichuan2005–2006 ***29.70 ***
Yunnan2005–2006 ***18.72 ***
Guangxi2005–2006 ***13.49 ***
Guizhou2005–2006 ***10.27 ***
Chongqing2005–2006 ***9.87 ***
2005–2006 ***80.81 ***
China2005–2006 **663.83 ***
Note: **, *** respectively indicate significant at 5%, 1% level.
Table 2. China’s civil vehicle development of the spatial differences in the trend of change and mutation test.
Mean ValuesM-K Trend Test of the Tell Indices2015Contribution Rate M-K Test
TrendsStatisticsTheil IndexContribution RateTrendsStatistics
T0.0591−0.0084−4.72 ***0.044
Tw0.0516−0.0025−2.92 ***0.03457.1%0.02475.35 ***
Tb0.1106−0.0057−5.26 ***0.01042.9%−0.02473.67 ***
TkNE0.01040.00010.850.0102.1%−0.00141−2.39 *
NC0.1432−0.0174~5.17 ***0.1437.0%−0.0203−5.08 ***
EC0.0329−0.0040~4.00 ***0.0335.9%0.0005652.74 ***
SC0.0265−0.0032~4.81 ***0.0261.5%−0.00232−4.18 ***
MYR0.0312−0.0019~2.56 ***0.0313.2%0.0004190.85
MCR0.0045−0.0006~4.27 ***0.0050.4%−0.00023−2.83 ***
NW0.0224−0.0026~4.90 ***0.0221.5%−0.0015−4.45 ***
SW0.0527−0.0029~4.45 ***0.0531.6%0.00010.49
Note: *, *** respectively indicate significant at 10%, 1% level.
Table 3. Loading matrix of principal component.
VariablePC1
grp0.25547
HCL0.203776
HM0.176927
GDZC0.249195
CZSR0.252361
Table 4. Unit Root Test.
TestLLCIPSADFPP
Time
1996–2005car24.9320.061.56
P’31.0625.450.48
Δcar2.370.6786.26
ΔP’3.564.8642.21
ΔΔcar−18.76 ***−10.50 ***238.55 ***
ΔΔP’−13.36 ***−6.33 ***173.73 ***
2006–2015car1.8016.9818.48
P’0.246.7912.66
Δcar91.33−7.48 ***0.05
ΔP’46.05−3.86 ***0.51
ΔΔcar353.13 ***−10.47 ***−4.20 ***
ΔΔP’298.85 ***−8.20 ***−5.02 ***
1996–2015car27.8823.3220.18
P’27.2229.7718.36
Δcar6.3810.2013.76
ΔP’−1.051.9141.75
ΔΔcar−13.93 ***−14.38 ***311.02 ***
ΔΔP’−18.00 ***−20.20 ***441.61 ***
Note: ‘***’ indicate significant at 1% level; ‘Δ’ represents a first-order difference; ‘ΔΔ’ represents a first-order difference; ‘car’ is a civilian vehicle possession.
Table 5. Panel Co-integration Test.
Test TypePedroniKao
Time Panel v-StatisticPanel Rho-StatisticPanel PP-StatisticPanel ADF-StatisticGroup Rho-StatisticGroup PP-StatisticGroup ADF-StatisticADF
1996–20053.55 ***−1.40 **−4.99 ***−7.77 ***0.53−11.59 ***−7.13 ***−1.02 *
2006–20154.30 ***−1.11−1.27 **−1.97 ***2.20−0.44−3.04 ***−2.33 ***
1996–20150.04 **−7.74 ***−7.36 ***2.16−2.94 ***−3.87 ***3.723.72 ***
Note: ‘*,’ ‘**,’ ‘***’ indicate significant at 10%, 5% and 1%, respectively.
Table 6. Pool Estimation.
Time Eight Economic RegionsProvinceNational
NENCECSCMCRMYRSWNW
1996–2005R20.980.950.920.990.960.960.970.960.990.96
F test91.76 ***29.52 ***32.28 ***175.01 ***18.54 ***51.70 ***77.64 ***16.43 **036.58 ***
Huasman test2.63 *0.0390.060.270.960.5620.100.800.38
Cross-section
Sample size3040303040405050310310
2006–2015R20.930.940.940.990.980.930.960.960.990.96
F test31.62 ***16.49 ***3.52 **70.05 ***48.42 ***23.94 ***26.76 ***35.30 ***021.87 ***
Huasman test2.76 *0.110.0020.0030.900.130.200.030.30
Cross-section
Sample size3040303040405050310310
1996–2015R20.950.940.910.980.960.920.930.940.980.93
F test0.35 ***10.96 ***29.44 ***49.81 ***7.73 ***10.78 ***8.96 ***12.06 ***8.53 ***17.17 ***
Huasman test0.5890.0080.030.080.05260.157.91 ***1.691.20
Cross-section
Sample size608060608080100100620620
Note: ‘*,’ ‘**’ and ‘***’ respectively indicate significant at the 10%, 5% and 1% levels; ‘①’ is a fixed effect model, ‘②’ is a mixed effect model.

