Article

Performance Analysis of Peer-to-Peer Online Lending Platforms in China

School of Economics, Hefei University of Technology, Hefei 230009, China
*
Author to whom correspondence should be addressed.
Sustainability 2018, 10(9), 2987; https://doi.org/10.3390/su10092987
Submission received: 23 July 2018 / Revised: 13 August 2018 / Accepted: 14 August 2018 / Published: 22 August 2018
(This article belongs to the Section Air, Climate Change and Sustainability)

Abstract

:
In this paper we intend to check the performance of Peer-to-Peer online lending platforms in China. Different from commercial banks, Peer-to-Peer (P2P) platforms’ business process is divided into the market-expanding stage and the risk-managing stage. In the market-expanding stage, platforms are intended to help borrowers attain more money, and in the risk-managing stage, platforms try their best to ensure that the lenders’ money is repaid on time. Thus, with a sample of 66 leading big P2P platforms, and a novel two-stage slacks-based measure data envelopment analysis with non-cooperative game, the performance efficiency of each stage as well as the comprehensive efficiency are evaluated. The results show that the leading big platforms are good at managing the risk, although risk management is not the major concern of most P2P platforms in China. We also find that average performance efficiency of the platforms that are located in non-first tier cities is higher than that in first tier cities. This unexpected result indicates that development of the P2P industry may relieve the severe distortion of resource allocation and efficiency loss arising from unbalanced regional development. Then dividing the platforms into different groups according to different types of ownership, we verify that performance efficiency of the P2P platforms from the state-owned enterprise group is in a dominant position, and the robustness check indicates that the major advantage of the state-owned enterprise (SOE) group mainly lies in the risk management. We also make a further study to figure out the sources of inefficiency, finding that it mainly arises from the shortage of lenders, the lack of average borrowing balance, and the insufficient transparency of information disclosure. In the last section we conclude our research and propose some advice.

1. Introduction

In recent years, the Internet financial industry has grown rapidly in China, of which peer-to-peer (P2P) online lending is a typical business model. Although the P2P lending business does not originate in China, the amazing growth of the P2P industry in China has never fallen behind. According to the data of Wangdaizhijia (The website is: https://www.wdzj.com), there were 1553 P2P lending platforms in normal operation up to the first half of 2017. The total transaction volume of P2P lending platforms has reached 4.648 trillion RMB. In the first half of 2017, the number of online borrowers and investors respectively reached 4.32 million and 8.3 million. We take the well-known P2P platform, Lending Club (The website is: http://lendingclub.com), which is located in United States, for comparison, as shown in Figure 1. It is easy to see that the nascent Chinese P2P industry growth is much faster than the representative mature foreign platform (We simply take the well-known Lending Club for comparison because we cannot get the detailed statistics of the entire P2P industry of any other countries).
P2P lending platforms help borrowers find inclined lenders more quickly because the Internet lowers the search cost. P2P lending business can be seen as direct financing because there is no need for credit intermediaries such as banks. Although occupying a dominant position in China’s financial system, the banking industry is criticized for financial exclusion. In fact, financial exclusion is common in developing countries. Beck et al. (2007) [1] point out that in developing countries, about 40 to 80 percent of people cannot get financial services from formal banks. A report reveals that in China, up to the year 2014, the amount of the credit acquired by small business companies holds only 30.4 percent of the total. In contrast, P2P platforms are quite inclusive. Low-income individuals or small business companies that are often rejected by commercial banks, would find it easier to get access to loans through P2P platforms. As a result, the poor and small business companies benefit significantly from P2P platforms. On the other hand, helping the poor and reducing poverty is very important to China’s sustainability in economic growth. Thus, the booming P2P industry is likely to bring opportunities to Chinese sustainable development. That is why we are interested in the topic of P2P platforms.
However, the future position of P2P platforms in the financial system depends on its effectiveness. China’s economy has been transitioning from a phase of rapid growth to a stage of high-quality development. Just as mentioned in the report of the 19th National Congress of the Communist Party of China, we must put quality first and give priority to performance (Full text of report can be download on: http://www.xinhuanet.com/english/special/2017-11/03/c_136725942.htm). High-efficiency performance is the necessary requirement for P2P platforms. This motivates us to study the performance efficiency of Chinese P2P platforms.
The rapid growth of P2P industry has drawn many scholars to the field, but focus of previous literature has been too narrow. One important topic is the factors that determine whether a borrower could successfully raise enough money. In most of the relevant studies, these factors are classified as borrowers’ hard information and soft information (Duarte et al., 2012; Herzenstein et al., 2011; Barasinska and Schäfer, 2014; Emekter et al., 2015; Liao et al., 2015; Dorfleitner et al., 2016; Ravina, 2018) [2,3,4,5,6,7,8]. Another issue is how lenders behave in P2P lending activities, with representative studies such as portfolio selection (Paravisini et al., 2016) [9] and the herding effect (Zhang and Liu, 2012; Chen and Lin, 2014) [10,11]. To the best of our knowledge, very few studies have evaluated the performance efficiency of P2P platforms. However, literature on performance efficiency evaluation of commercial banks are very popular, which can offer us some helpful references. There are mainly two approaches that are applied to performance efficiency evaluation for commercial banks, namely stochastic frontier analysis (SFA) and data envelope analysis (DEA). Although SFA is common in banks’ performance evaluation (Aysan et al., 2011; Lensink and Meesters, 2014) [12,13], it is not superior to DEA (Ruggiero, 2007) [14] because of the predetermined form of production function (Silva, 2017) [15]. So far, numerous studies have employed the DEA model into banks’ performance evaluation. The DEA model has been improved from single-stage (Chen et al. 2005; Fukuyama and Weber 2009; Eskelinen et al., 2014) [16,17,18] to two-stage (BI et al., 2009; Fukuyama and Weber, 2010; Paradi et al., 2011; Akther et al., 2013; Maghbouli et al., 2014; Wanke and Barros, 2014; An et al., 2015) [19,20,21,22,23,24,25], to better capture the business process of the bank.
Although previous studies on evaluating bank performance with DEA approaches can serve as useful reference, we should note that, P2P platforms work differently rather than analogously with commercial banks, before we evaluate the P2P platforms’ performance. Beyond that, the P2P industry is nascent in China, and the regulation backgrounds need to be taken into consideration. Because of lag or lack of authoritative regulations, most P2P platforms intend to get the first move advantage, so they pay more attention to occupying the market than to managing their own risk. Incomplete statistics show that due to the ignorance of risk management and overextending, the total number of nearly-bankrupt P2P platforms reached more than 2000 up to the first half of 2018. That is a reflection that most P2P platforms are more likely to expand their market rather than manage their risk in the first place. This fact renders the typical DEA model inapplicable.
Briefly, in this article, we are aiming at checking the effectiveness of the P2P platforms, which are nascent and inclusive in China. We use a sample of 396 observations, with 66 cross-section individuals and a time span of 6 months. The novelty and utility lie in: (1) This paper studies the performance efficiency of P2P platforms systematically for the first time. Noting that P2P platforms differ from banks in terms of operating mechanism, we divide their operational process into two stages which are defined as the market-expanding stage and the risk managing stage, respectively; (2) Since we note the leader–follower relation of the second stage, we employ a non-cooperative game slacks-based measure (NCG-SBM) DEA model for evaluating the efficiency of each sub-system as well as the comprehensive efficiency.
The paper is organized as follows: in Section 2 we interpret the operational mechanism of P2P platforms. The details of the NCG-SBM DEA model and detailed information of data are presented in Section 3. The empirical test results and robustness checks are shown in Section 4. The final section is the conclusion of the article and also includes policy implications.

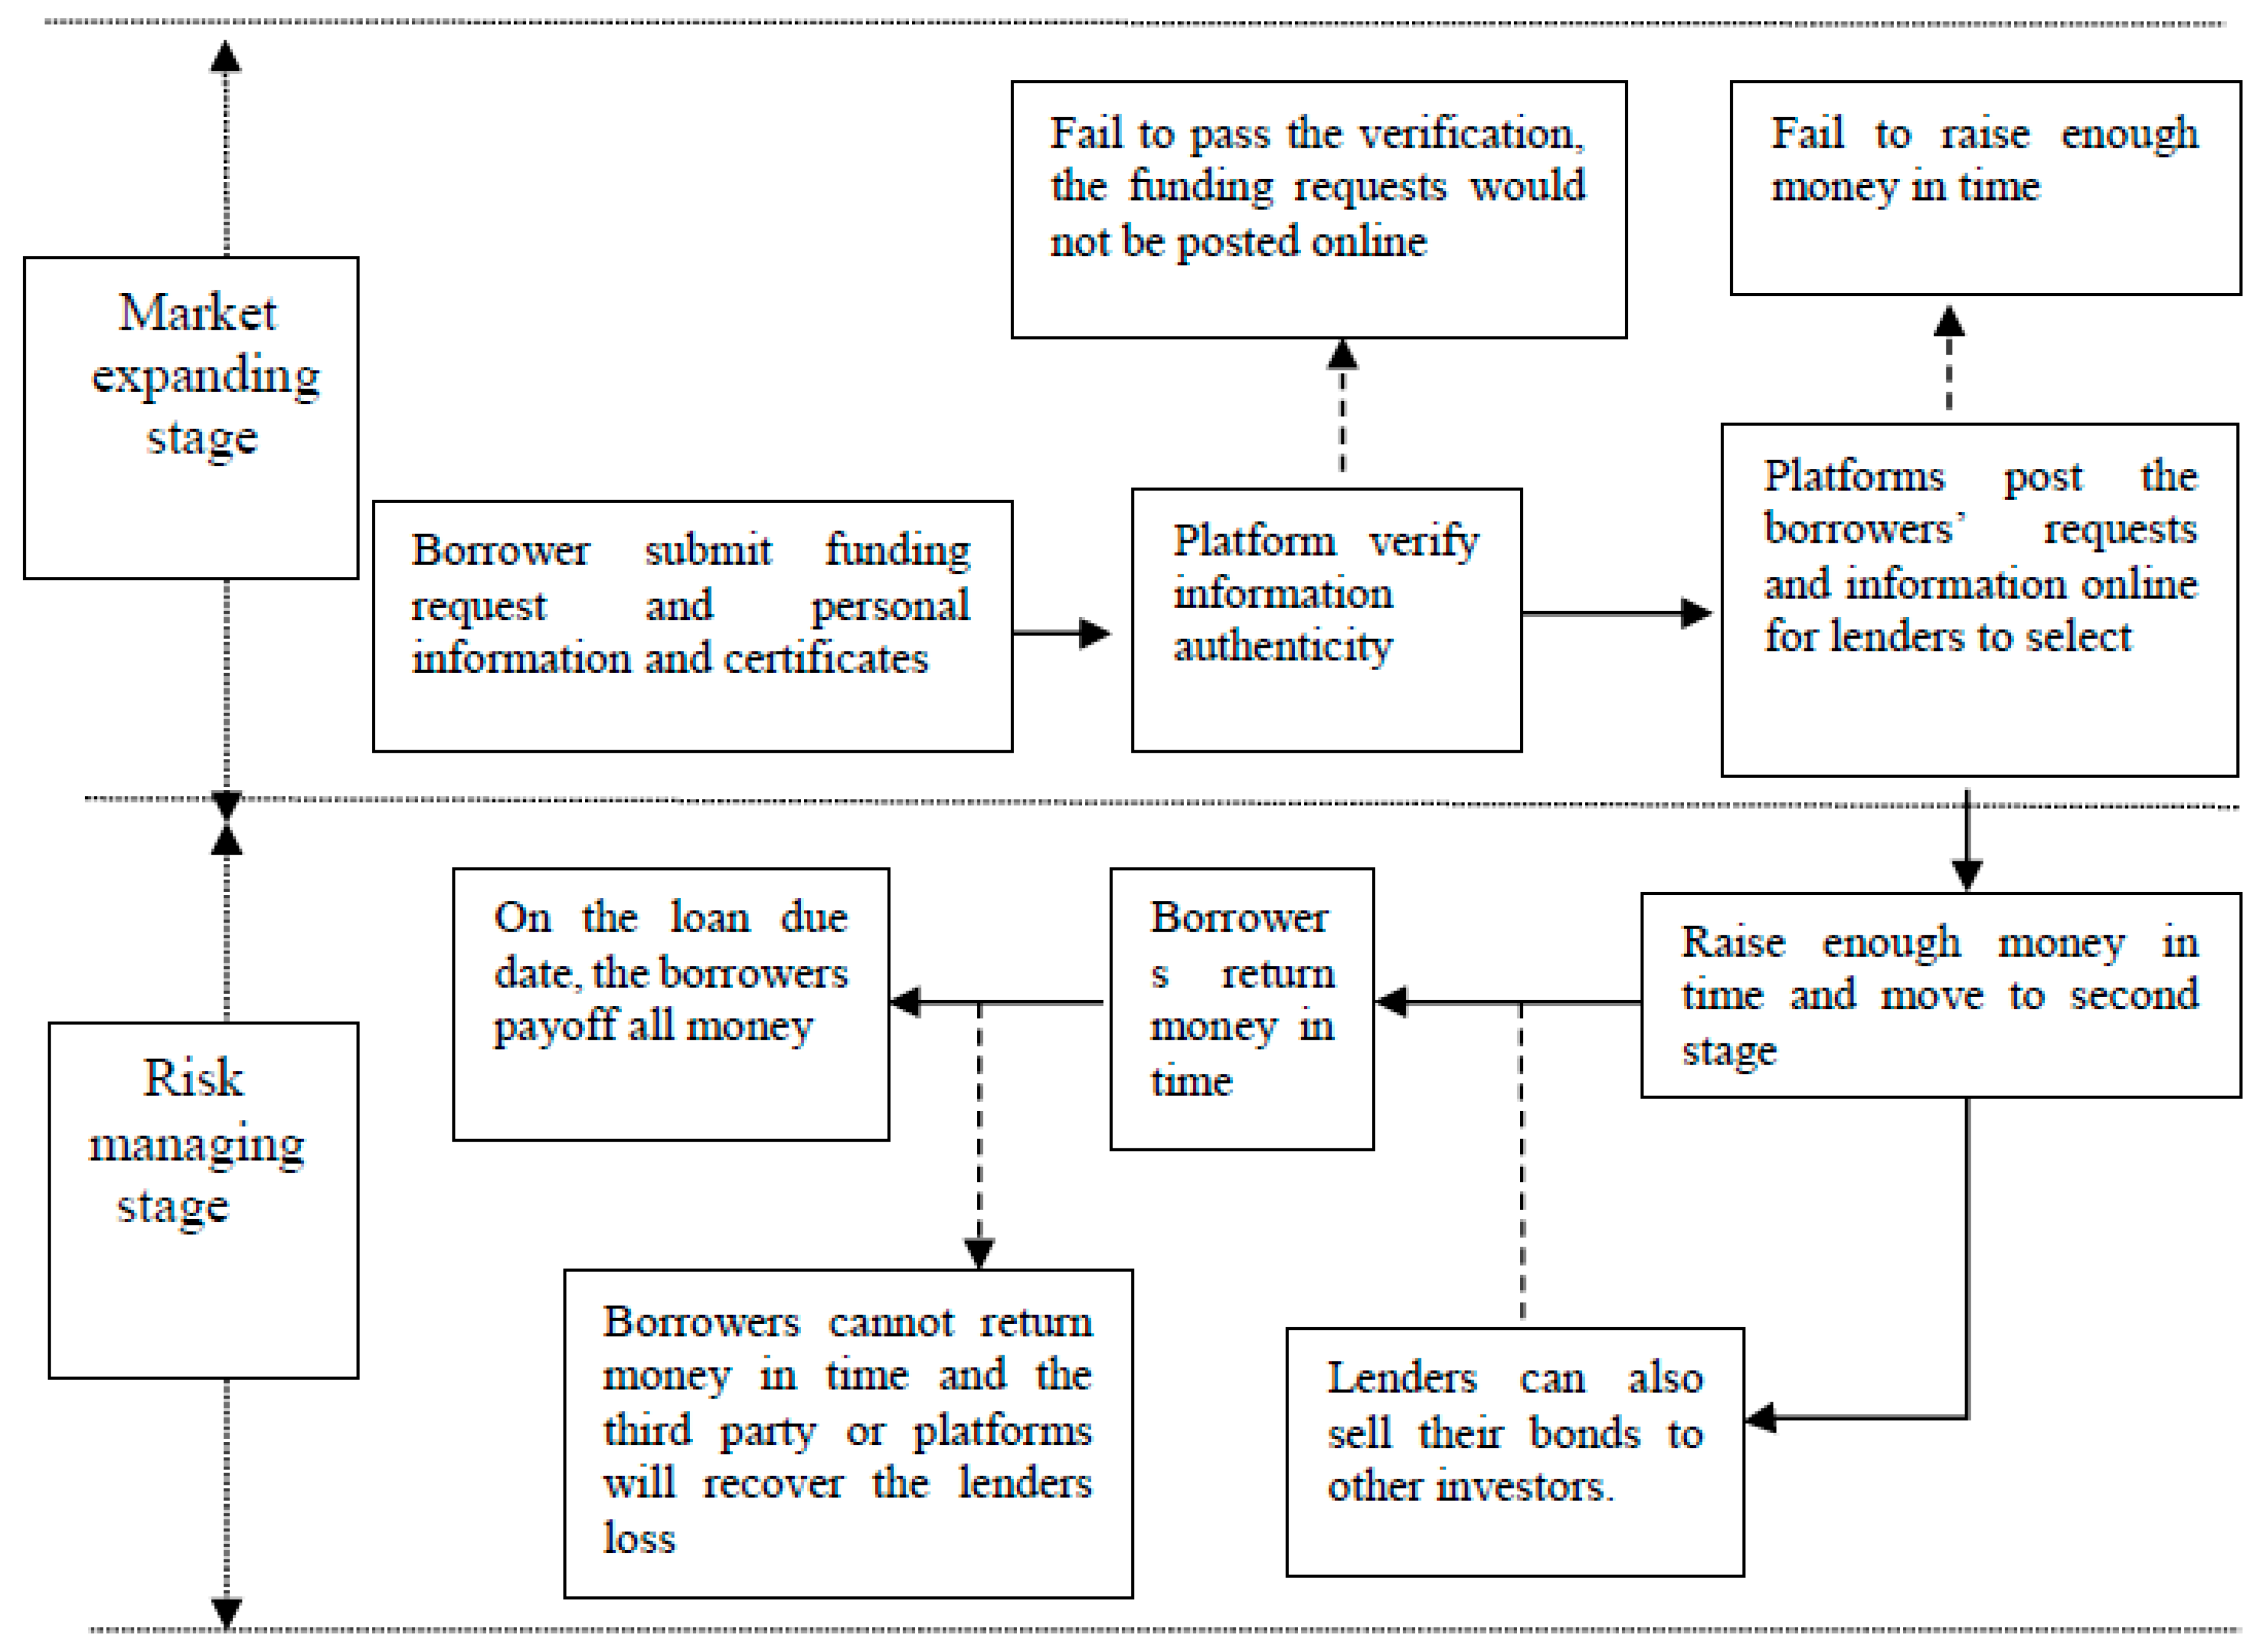
2. Operating Mechanism of P2P Platforms

The process of a typical P2P business is shown in Figure 2. P2P platforms are only responsible for matching borrowers and inclined lenders together. Firstly, borrowers submit their loan requests (including the loan amount, loan interest rate, repayment term and repayment date) as well as their personal information (such as identity certificate, income certificate, real estate ownership certificate). If the information authenticity is proved, the platforms post the borrowers’ financing requests and personal information certifications on the platforms’ websites. The lenders could select the reliable borrowers according to the disclosed information and then lend money to them. When borrowers are unable to raise enough money within the stipulated time, the loan request will be cancelled. This is the first-stage of the entire process, which is defined as the market-expanding stage. If the borrowers attract enough lenders and access sufficient money, the loan will automatically enter into the second stage, which is defined as the risk managing stage. In the second stage, lenders can choose to wait for borrowers’ regular payments, or sell their bonds to other investors. We see that in the market-expanding stage, P2P platforms aim to maximize the borrowers’ utility, in other words, try their best to help borrowers raise more money in a shorter time, and at a lower cost. In the risk-managing stage, the platforms aim to ensure the lenders’ money to be repaid on time. (Some platforms even pay for the borrowers in default with provisions of risk, which is thought to be a kind of guarantee behavior.) Instead of earning by leveraging in the manner of commercial banks, most P2P platforms provide information service to earn fees. This feature makes P2P platforms asset-light, so simple DEA models which treat capital and labor forces as inputs are not suitable for evaluating the performance of P2P platforms.
According to Fukuyama and Weber (2010) [20] and An et al. (2015) [25], we can figure out the operation process of commercial banks. Then we compare the differences between efficiency evaluation of banks and P2P platforms, and present them in Table 1.
Further, we simplify the operational process of platforms into two stages as presented in Figure 3. In the market-expanding stage, platforms help borrowers get more money in a shorter period of time or at a lower cost, thus the inputs could be the average funding time, number of requests and average loan interest rate. The desirable outputs are the total lending volume, number of lenders, borrowing balance of per borrower and average maturity of loans. Due balance is the undesirable output. Average maturity of loans and due balance are actually intermediate outputs which means that they are both the output of the first stage and the input of the second stage. The outputs of the second stage, which are defined as the risk managing sub-system or stage, are dispersity, liquidity and transparency. They are indices that are constructed and disclosed by the website Wangdaizhijia, for the purpose of making the risk status clear to investors or lenders. The implications of all above indicators are presented in Table 2.

3. Methods and Data

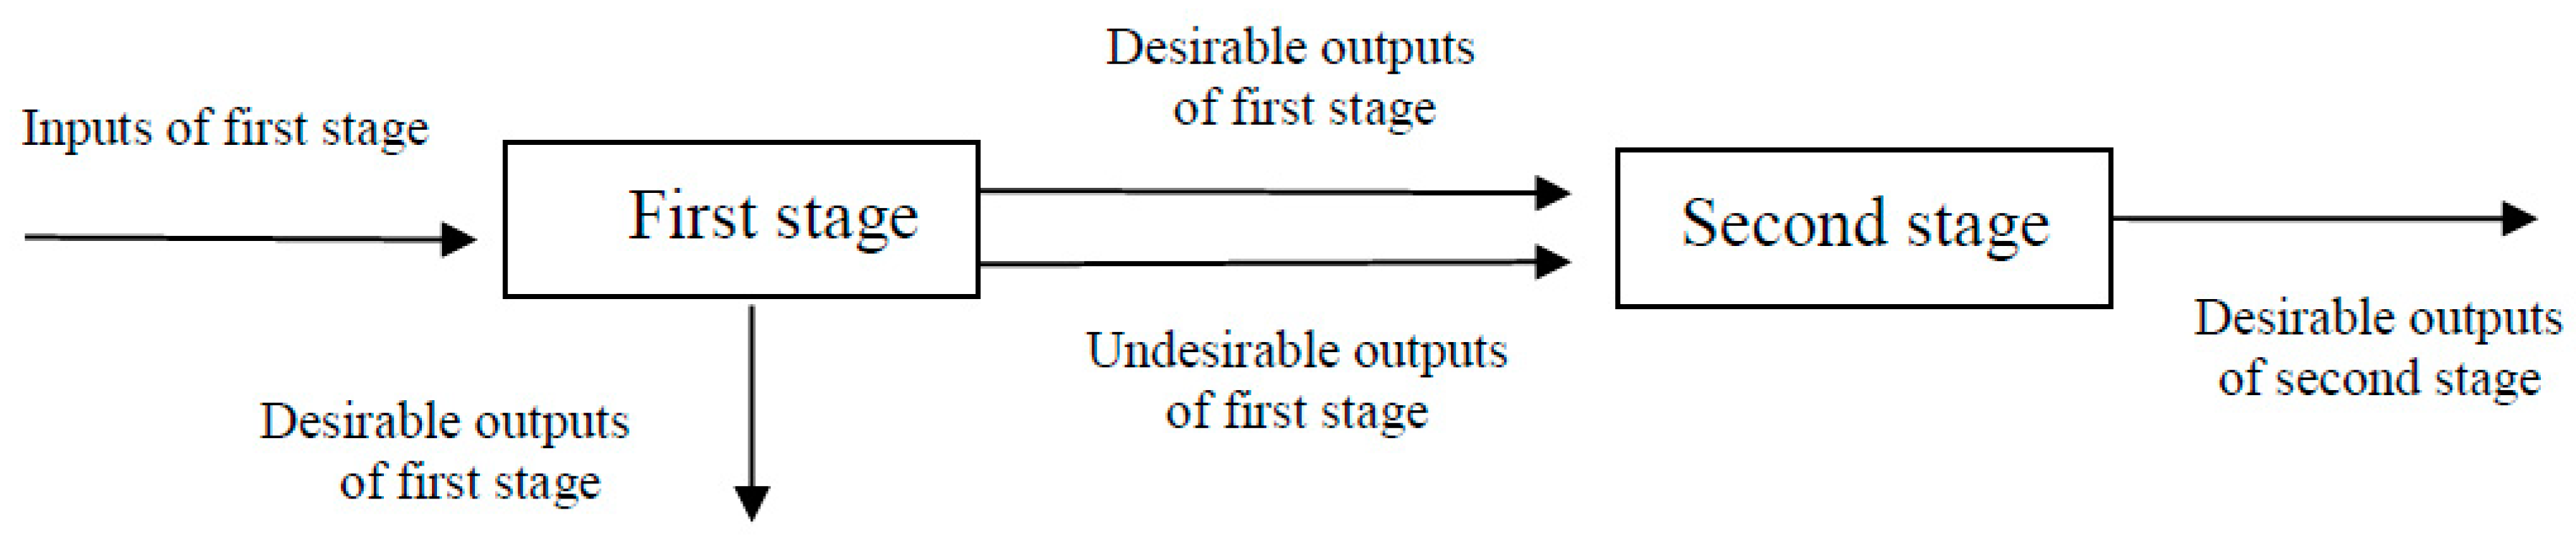
3.1. Two-Stage SBM Model Considering Undesirable Outputs

We define the efficiency of the first stage and second stage based on the SBM model proposed by Tone (2009) [26]. The inputs of the first stage are denoted as XA, which can produce desirable and undesirable outputs as {YA, ZA}. All of the undesirable outputs of the first stage are inputs for the second stage. Inputs for the second period are {XB, ZA} and {YB} for its outputs. The DEA model of the first-stage efficiency ( ρ single - I * ) can be defined as:
ρ single - I * = min 1 1 m B + s 2 ( i = 1 m B s xBi x Bi 0 + i = 1 s 2 s zBi z Ai 0 ) 1 + 1 t 1 + t 2 ( i = 1 t 1 s Bi + y Bi 0 + i t 2 s Bi z Bi 0 )
s . t .   x A 0 = X A δ A + s A y A 0 = y A δ A s A + g z A 0 = z A δ A + s A b s A 0 , s A + g 0 , s A b 0 , δ A 0
The DEA model of the second-stage efficiency ( ρ single - II * ) can be defined as:
ρ single - II * = min 1 1 m B + s 2 ( i = 1 m B s xBi x Bi 0 + i = 1 s 2 s zBi z Ai 0 ) 1 + 1 t 1 + t 2 ( i = 1 t 1 s Bi + y Bi 0 + i t 2 s Bi z Bi 0 )
s . t .   x B 0 = X B δ B + s XB z A 0 = z A δ B + s ZB y B 0 = Y δ B s B + z B 0 = Z B δ B + s B s XB 0 , s ZB 0 , s B + 0 , s B 0 , δ B 0
where δ are the weight vector of inputs and outputs and s A , s A + g , s A b , s XB , s ZB , s B + , s B are slack vectors of inputs, desirable outputs and intermediate outputs. The objective functions, namely ρ single - I * and ρ single - II * , are more than 0 and no more than 1.The slack vectors are equal to zero if and only if the objective function is equal to 1, which means the decision making unit (DMU) is efficient. When objective functions are less than 1, then the DMU is inefficient, which means that there still has space to decrease inputs or increase outputs.

3.2. Two Stage NCG-SBM Model

The above model takes the internal operational structure of the complex platform system into account, but it treats the two stages as two equal subsystems. But some studies argue that in the complex network operational process, the two stages are not equal (Bian, 2012; Li et al., 2012; Xia et al., 2016) [27,28,29], and they developed the non-cooperative game DEA model which contains two subsystems. In their model, there exists a leader–follower relationship between the first and second stage, which means that the first stage optimal objective must be obtained first.
The advantage of this model is that it is suitable for evaluating the performance of Chinese P2P platforms. The P2P industry is nascent in China, so all platforms are eager to take the first move advantage to become a top company so that it can act to attract more borrowers. The risk management work is given secondary importance. This is because the regulators care most about the security of the financial system, so they always urge the financial institutions to manage risk. But due to the lack and lag of regulation in the nascent stage of P2P industry, platforms are motivated by the first move advantage to expand their share of the market as much as possible, paying less attention to risk managing work.
Therefore, we adopt the NCG-SBM model take the market-expanding stage as the leader stage and the risk managing stage as the follower stage. The difference between the NCG-SBM model and the typical SBM model mainly exists in the second stage, which can be shown as Model (3)
ρ new II * = min 1 1 m B + s 2 ( i = 1 m B s xBi x Bi 0 + i = 1 s 2 s zBi z Ai 0 ) 1 + 1 t 1 + t 2 ( i = 1 t 1 s Bi + y Bi 0 + i t 2 s Bi z Bi 0 )
x AO = X A δ B + s A y AO = Y A δ B s A + g s XB 0 , s ZB 0 , s B + 0 , s B 0 , s A 0 , s A + g 0 , δ B 0 min 1 1 m i = 1 m s i x Ai 0 1 + 1 s 1 + s 2 ( i s 1 s Ai + g y Ai 0 + i s 2 s Bi z Ai 0 ) = ρ new I * x B 0 = X B δ B + s XB z A 0 = z A δ B + s ZB y B 0 = Y δ B s B + z B 0 = Z B δ B + s B s XB 0 , s ZB 0 , s B + 0 , s B 0 , s A 0 , s A + g 0 , δ B 0
Model (3) is nonlinear and can be transformed into the linear programming model by “C-C” transformation [30]. ρ single - I * is the performance efficiency of market-expanding stage and ρ new II * is the performance efficiency of the risk managing stage. The comprehensive efficiency of performance can be computed by Formula (4).
ρ * = 1 1 m A + m B + s 2 ( i = 1 m A s Ai x Ai 0 + i = 1 m B s xBi x Bi 0 + i = 1 s 2 s zBi z Ai 0 ) 1 + 1 s 1 + s 2 + t 1 + t 2 ( i s 1 s Ai + g y Ai 0 + i s 2 s Ai b z Ai 0 + i = 1 t 1 s Bi + y Bi 0 + i t 2 s Bi z Bi 0 )

3.3. Data Sources and Descriptions

The data of this article is collected from the website Wangdaizhijia. The website provides monthly information about the largest P2P platforms in China. The fierce competition makes P2P platforms rapidly appear and disappear. We eliminated some of our samples in order to keep the sample as a balance panel data set. The final balanced panel dataset is transferred form an unbalanced panel dataset by dropping the platforms that have less than 6 months’ continuous observation. The missing observations are due to bankruptcy or insufficient information disclosure. As a result, we obtained a dataset consisting of 396 DMUs, in which the cross-sectional number is 66, and the time period is from June 2016 to November 2016. These 66 platforms are large leading P2P platforms, so they have less chance of going bankrupt. The brief statistical description is shown in Table 3.
From these different aspects, we sort the samples into different groups. Firstly, we sort the sample in accordance with the P2P platforms’ locations. According to the statistics of Wangdaizhijia, the total number of platforms in first-tier cities, such as Beijing, Shanghai, Guangzhou and Shenzhen, accounted for 53.1% of the nationwide platforms. The other platforms are also mainly located in the capital cities of each province. The selected 66 P2P platforms in this study are of no exception (as shown in Figure 4). It indicates that the distributional density of the P2P industry is highly correlated with the level of regional economic and financial development. In order to study the impact of location on P2P platforms’ performance efficiency, we divided the samples into a first-tier cities group and the non first-tier cities group. We also divided the samples into different groups according to the platforms’ ownership type, to check what kind of P2P platforms work more efficiently. Therefore, the 66 platforms are divided into four groups named state-owned enterprise (SOE) group, private-owned enterprise (POE) group, and venture capital (VC) group and listed firm (LF) group.

4. Result Analysis

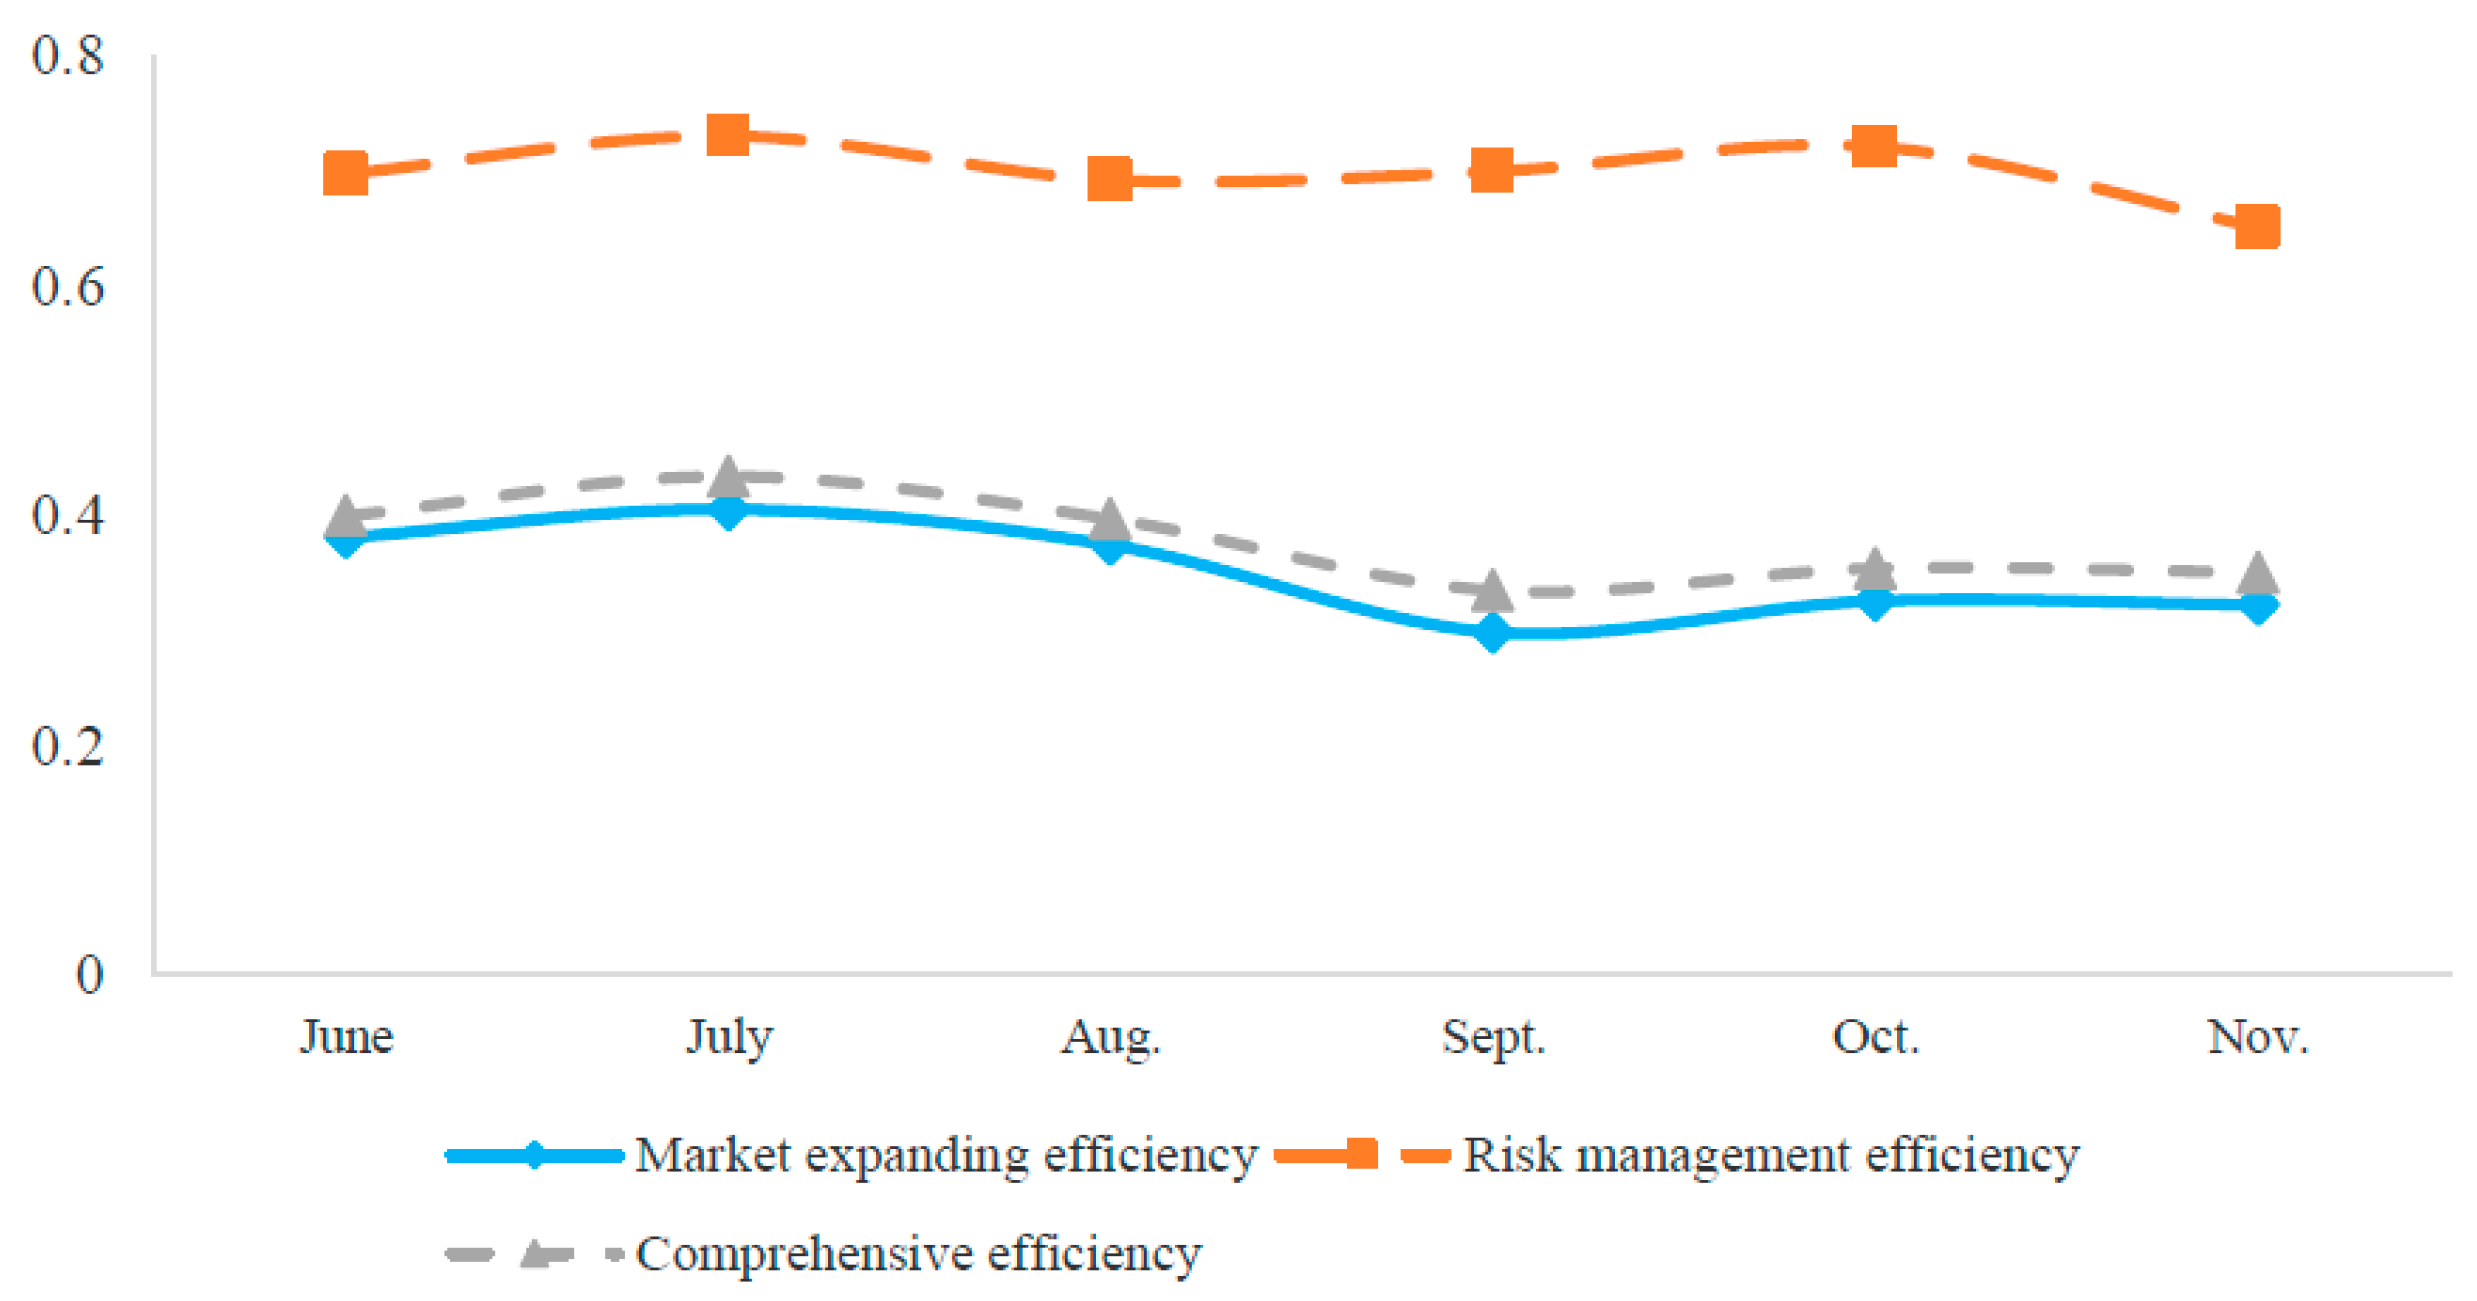
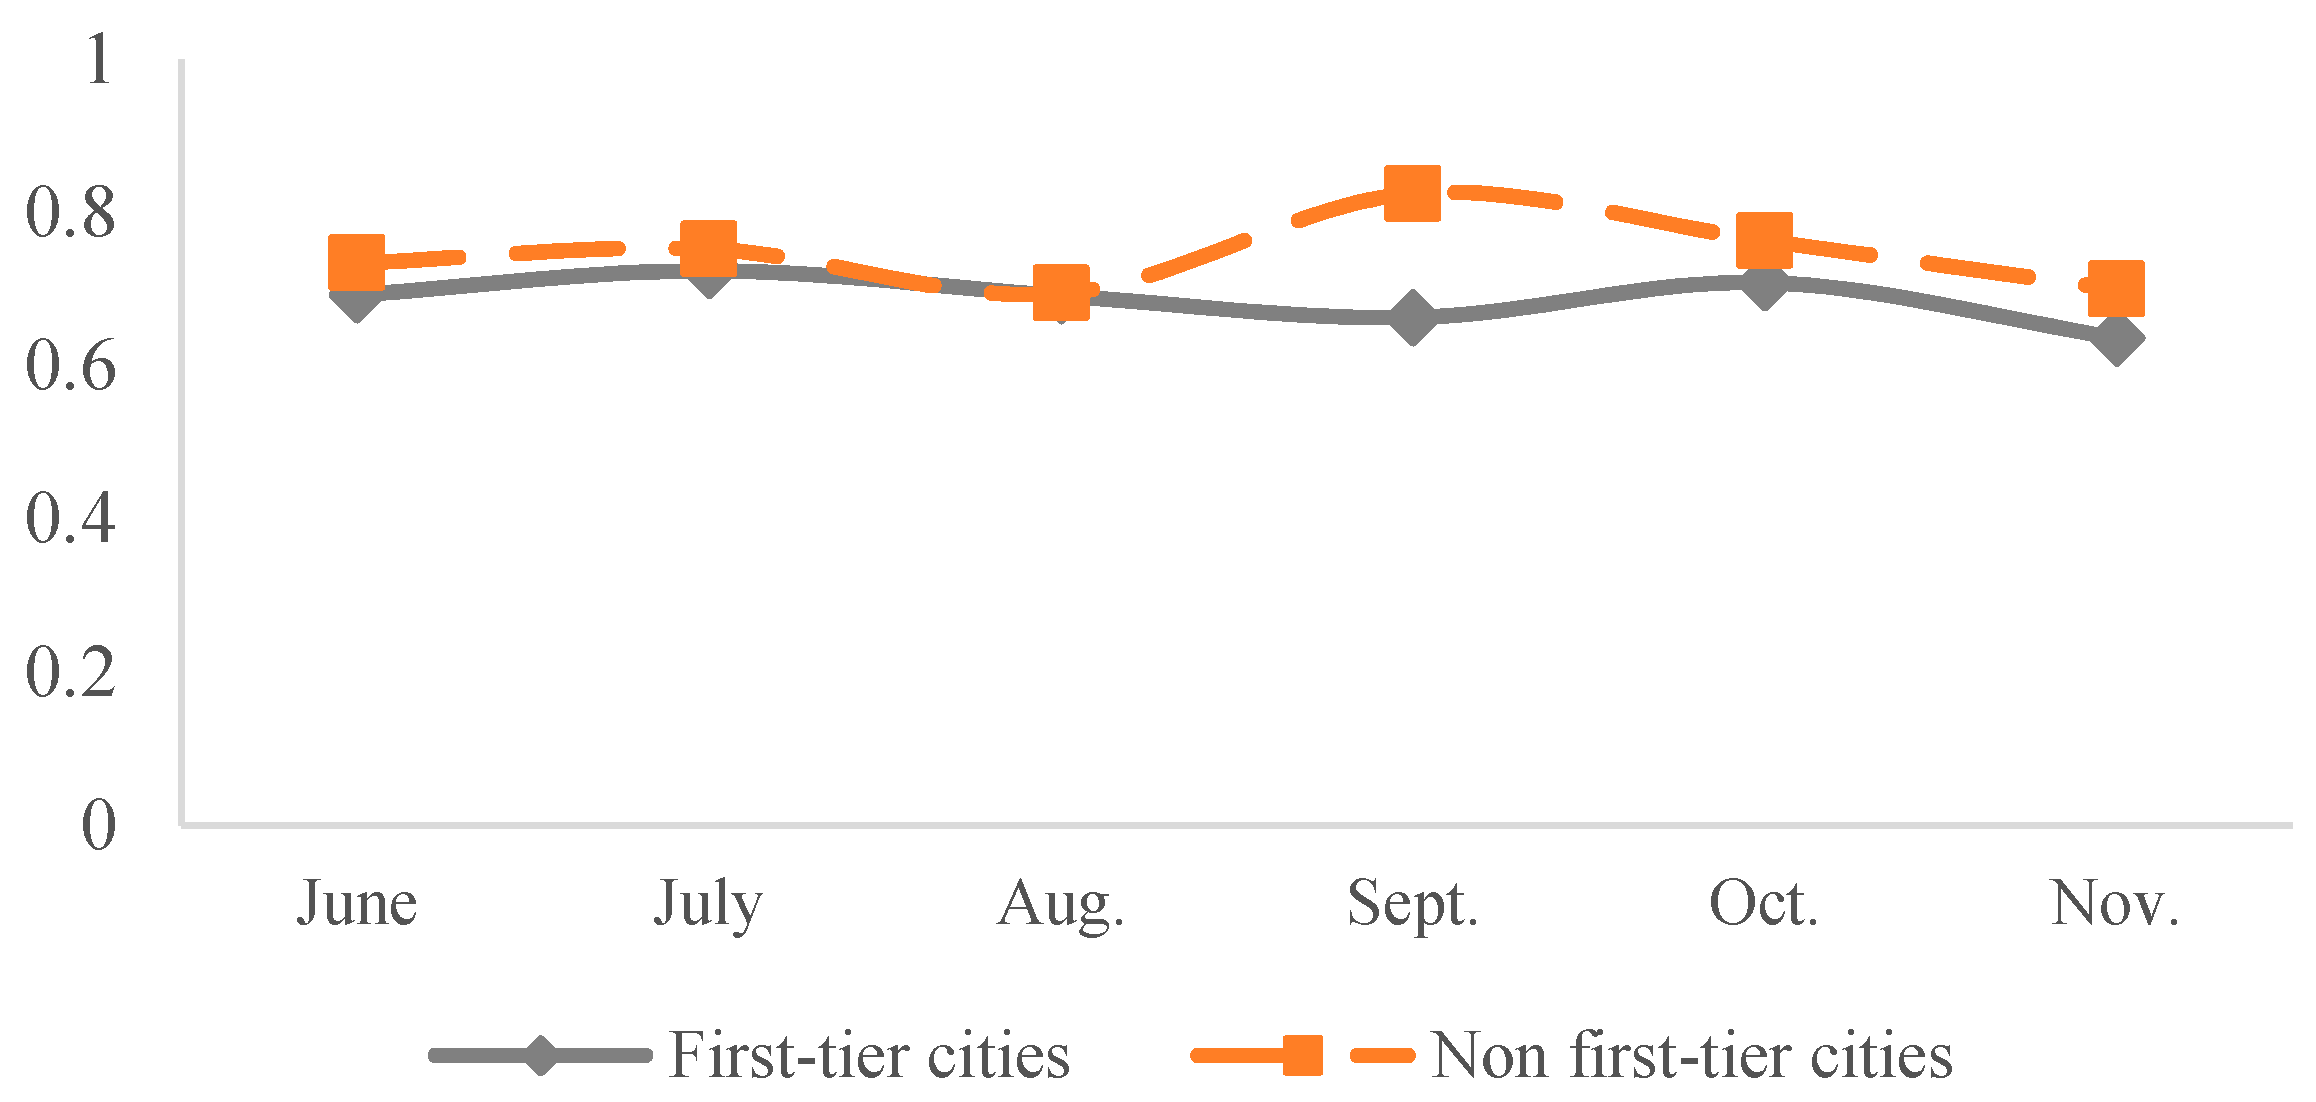
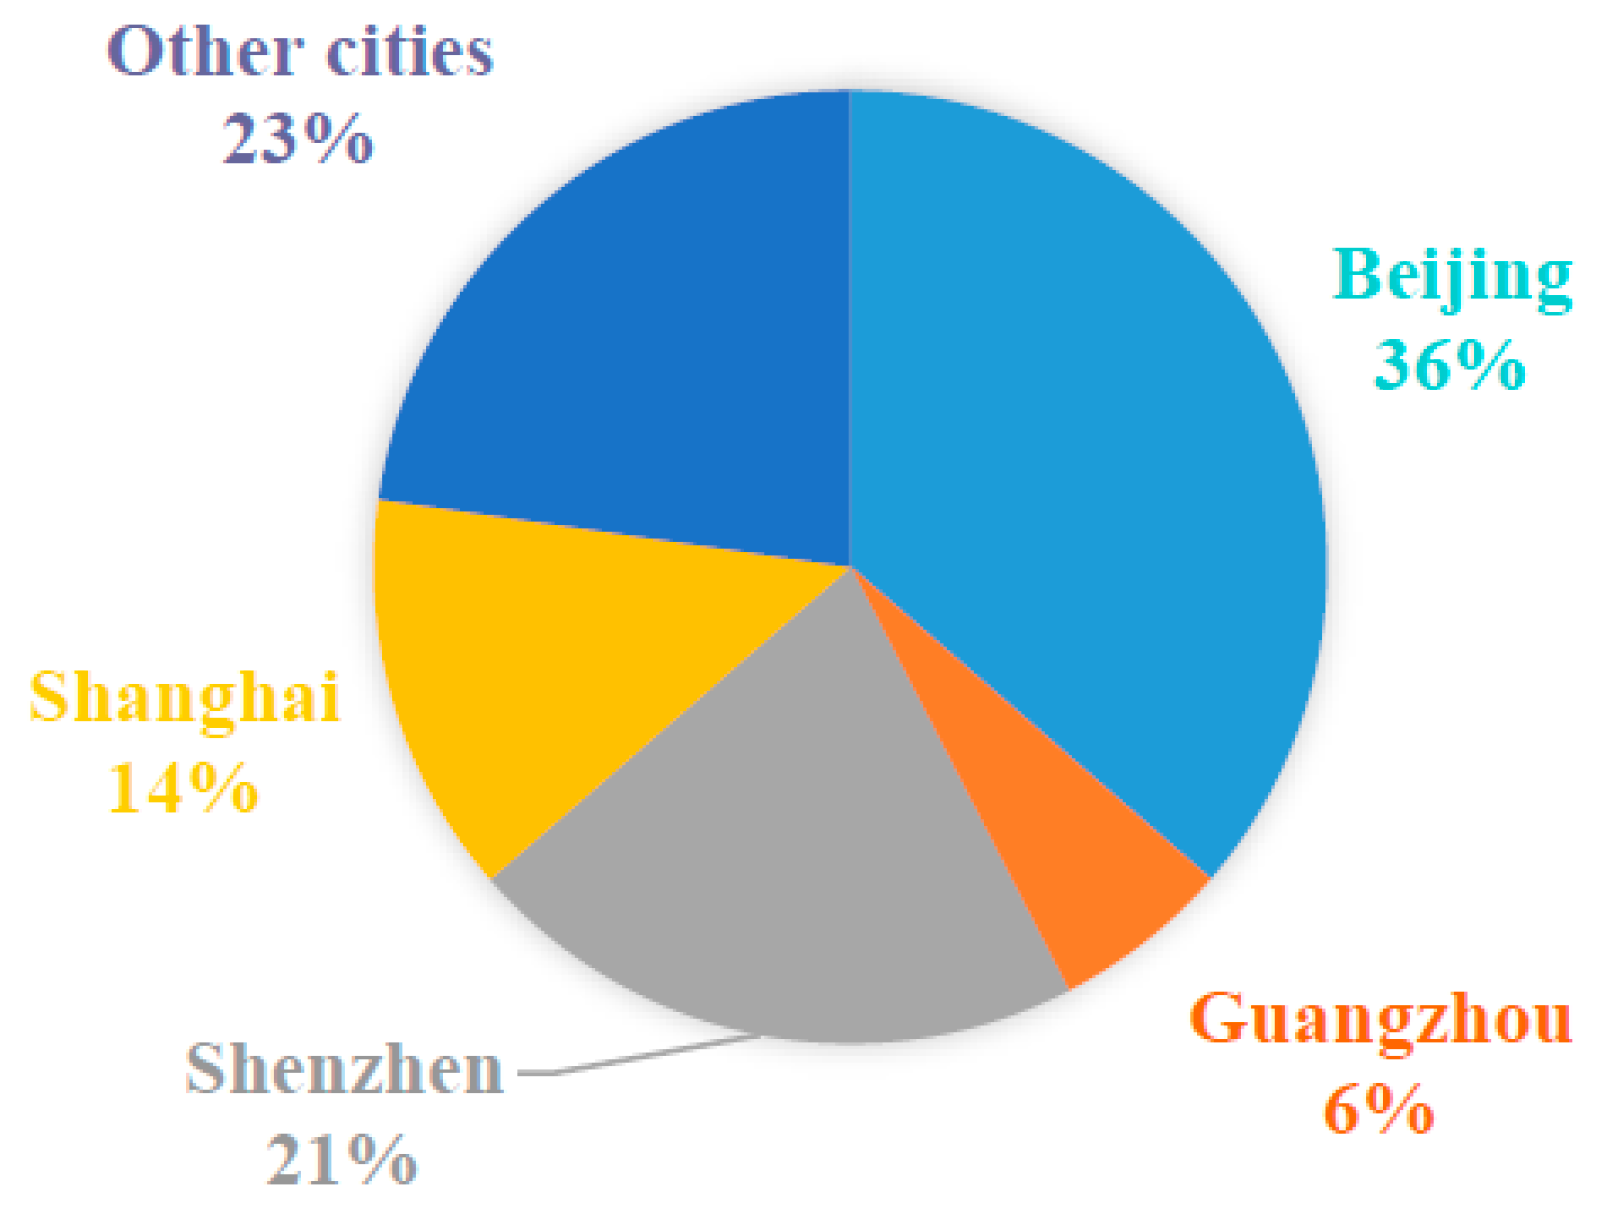
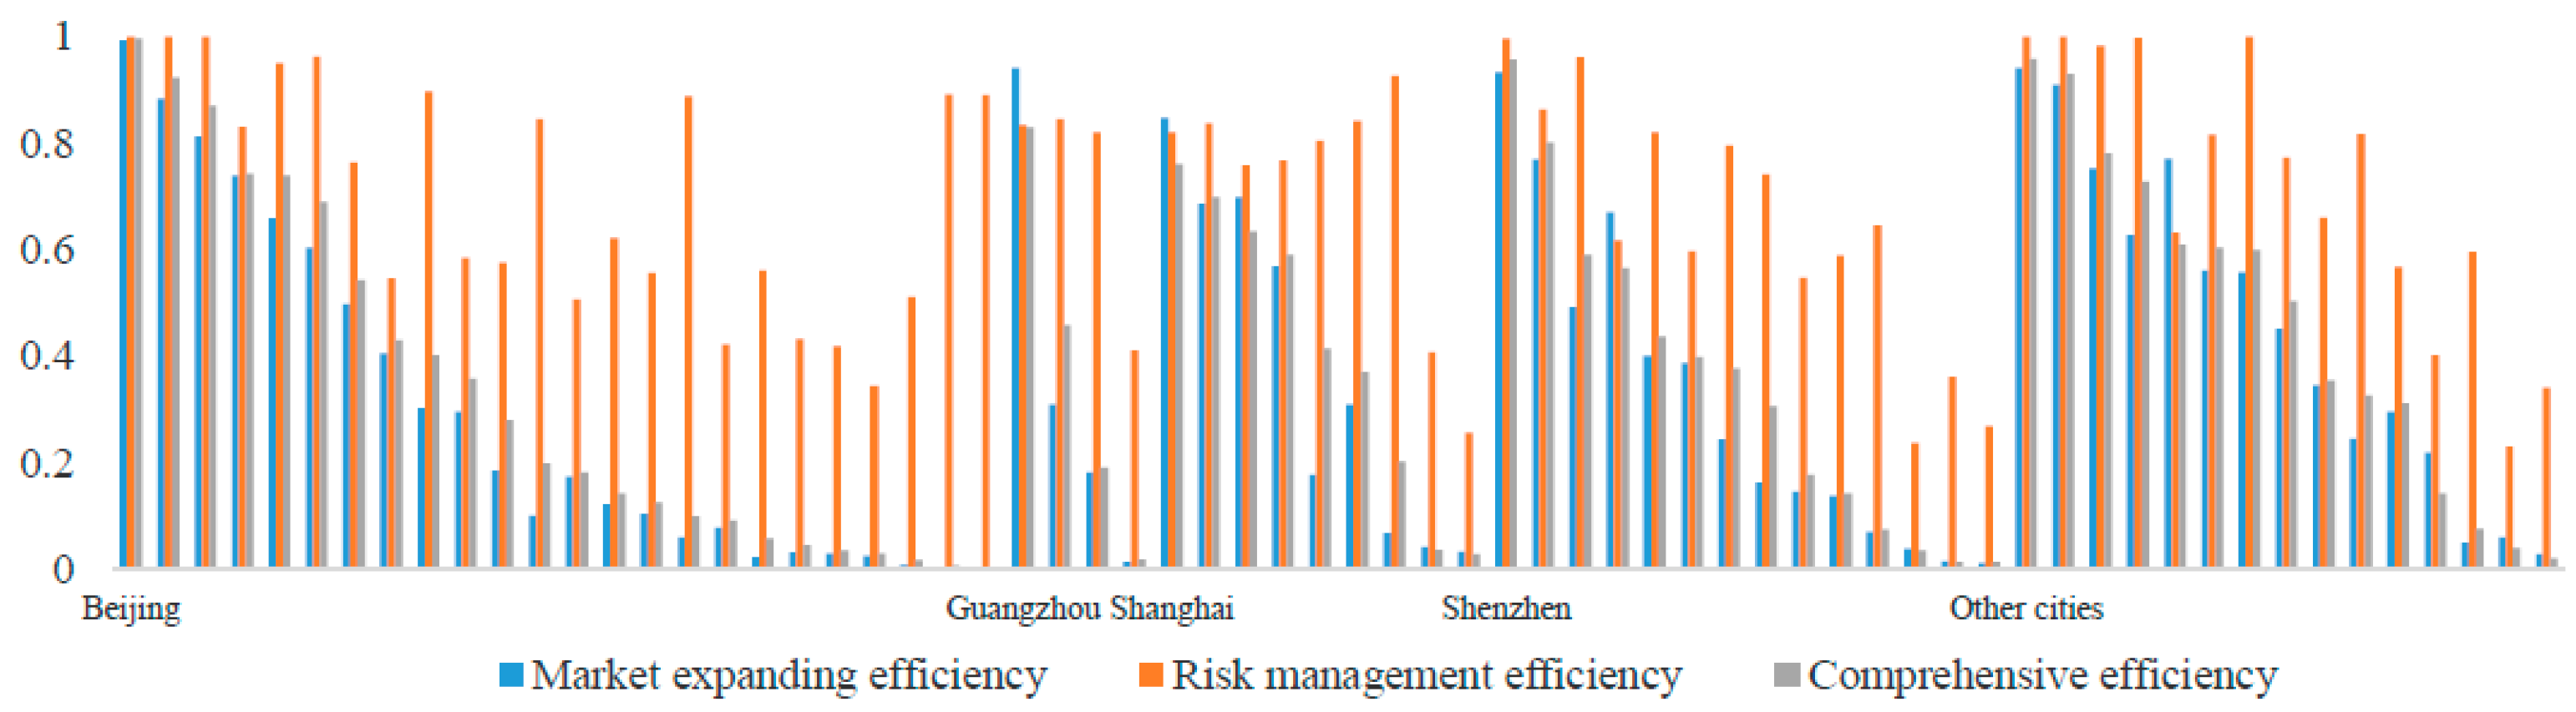
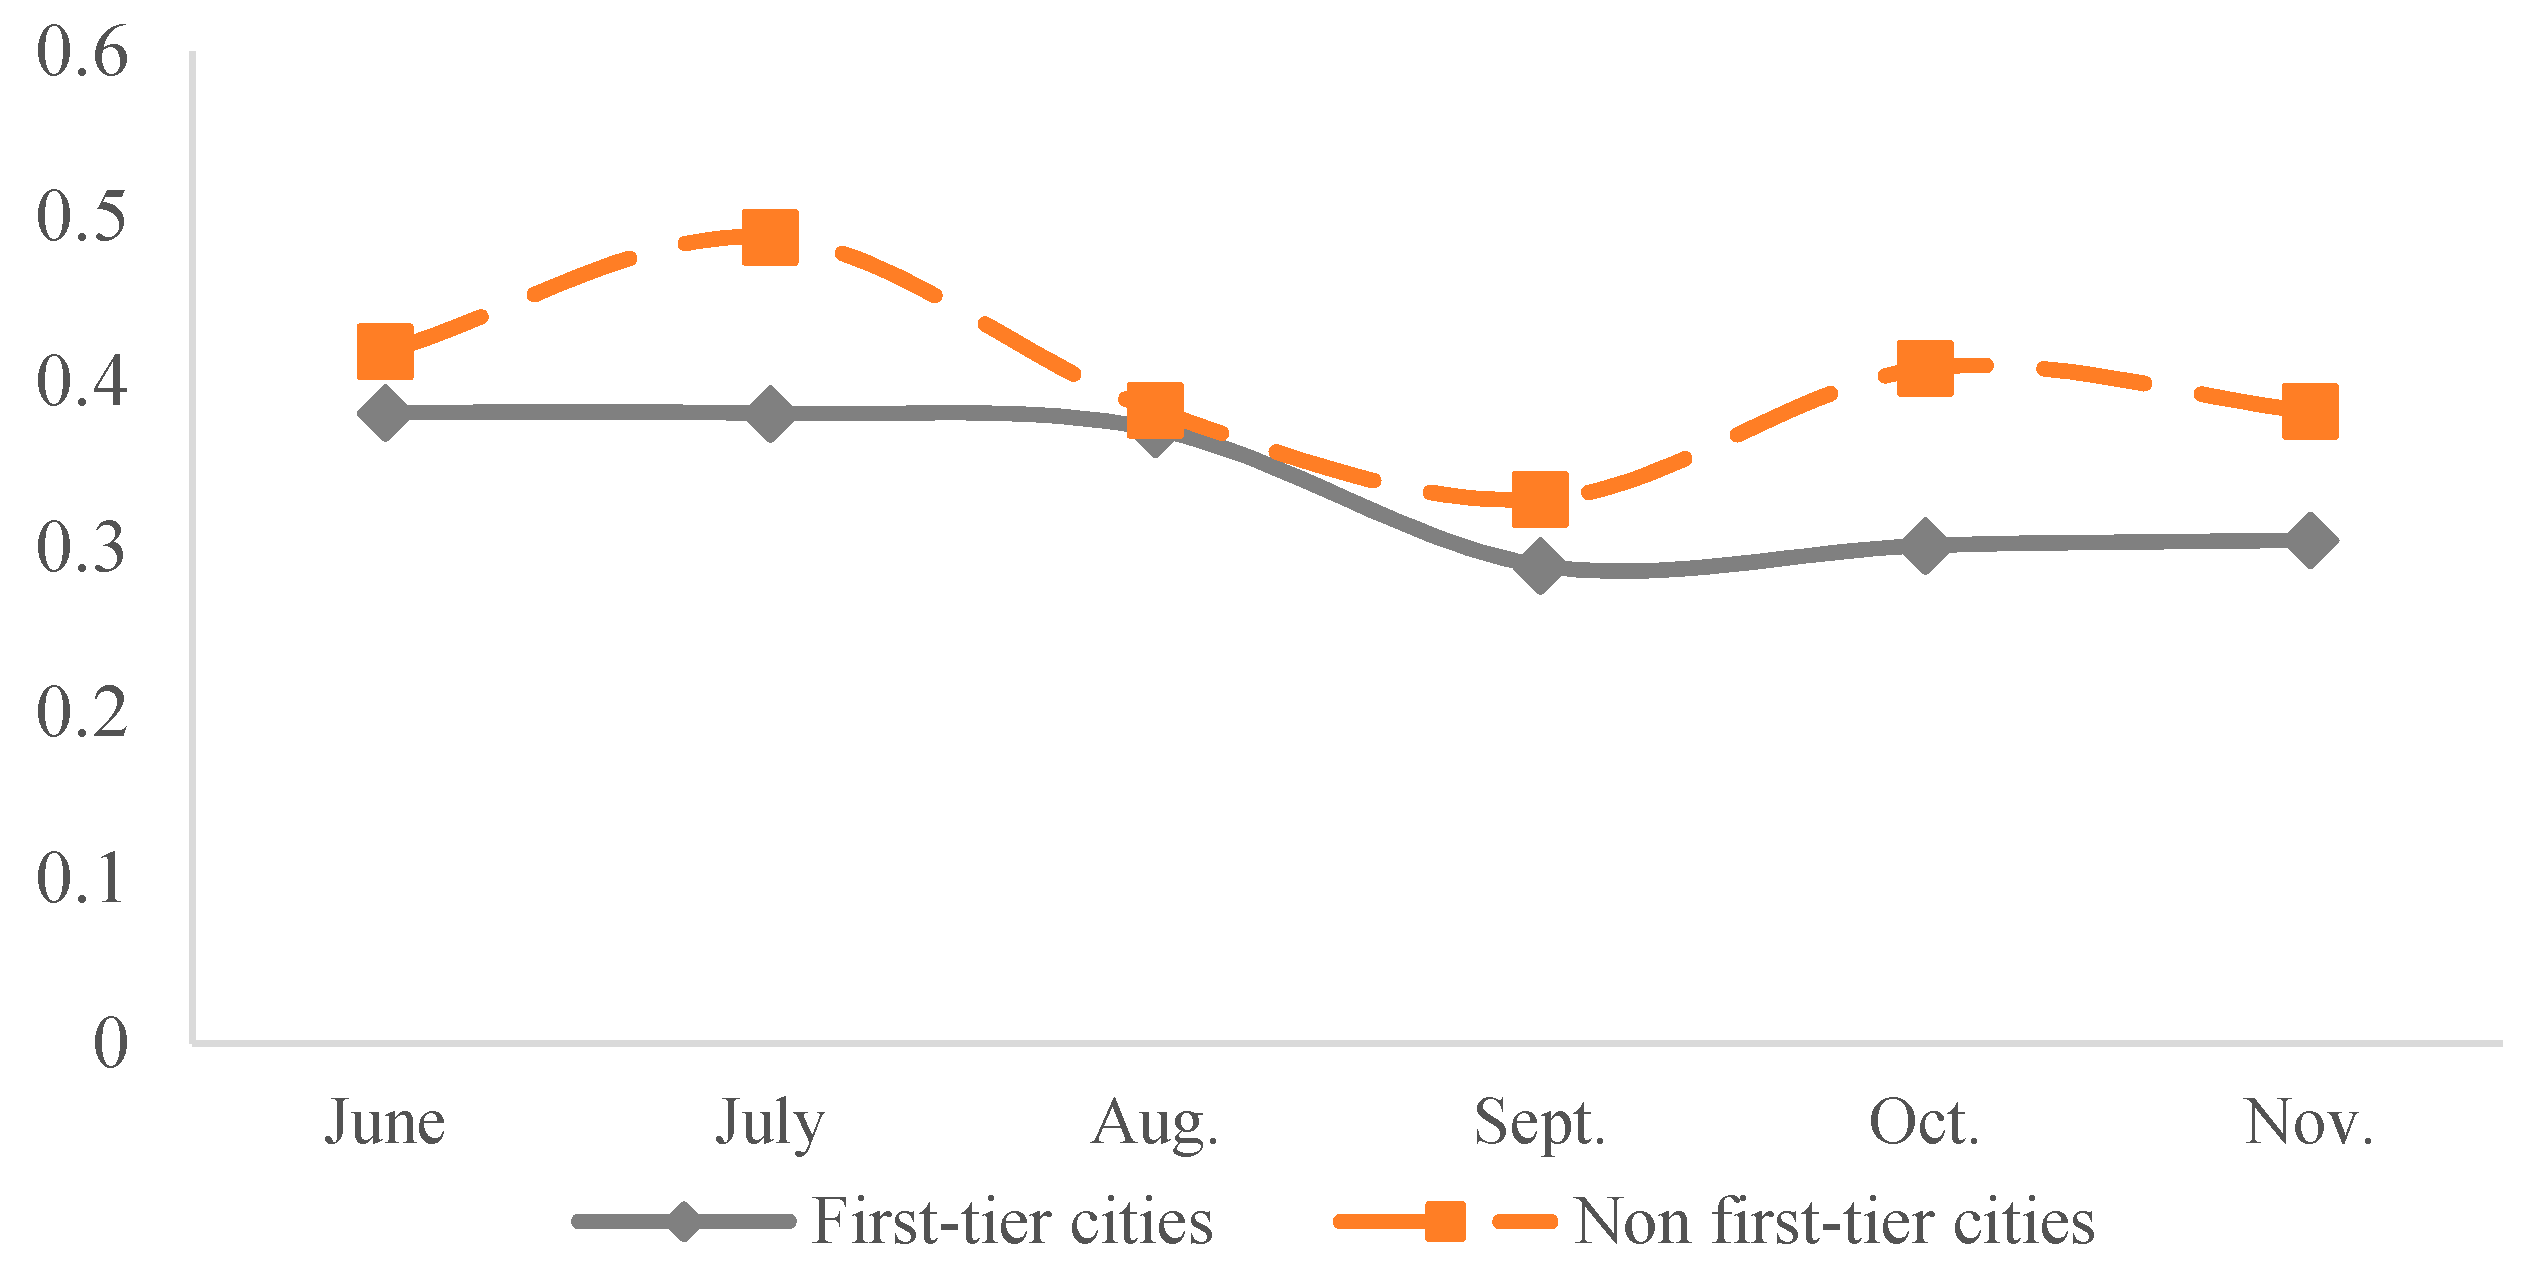
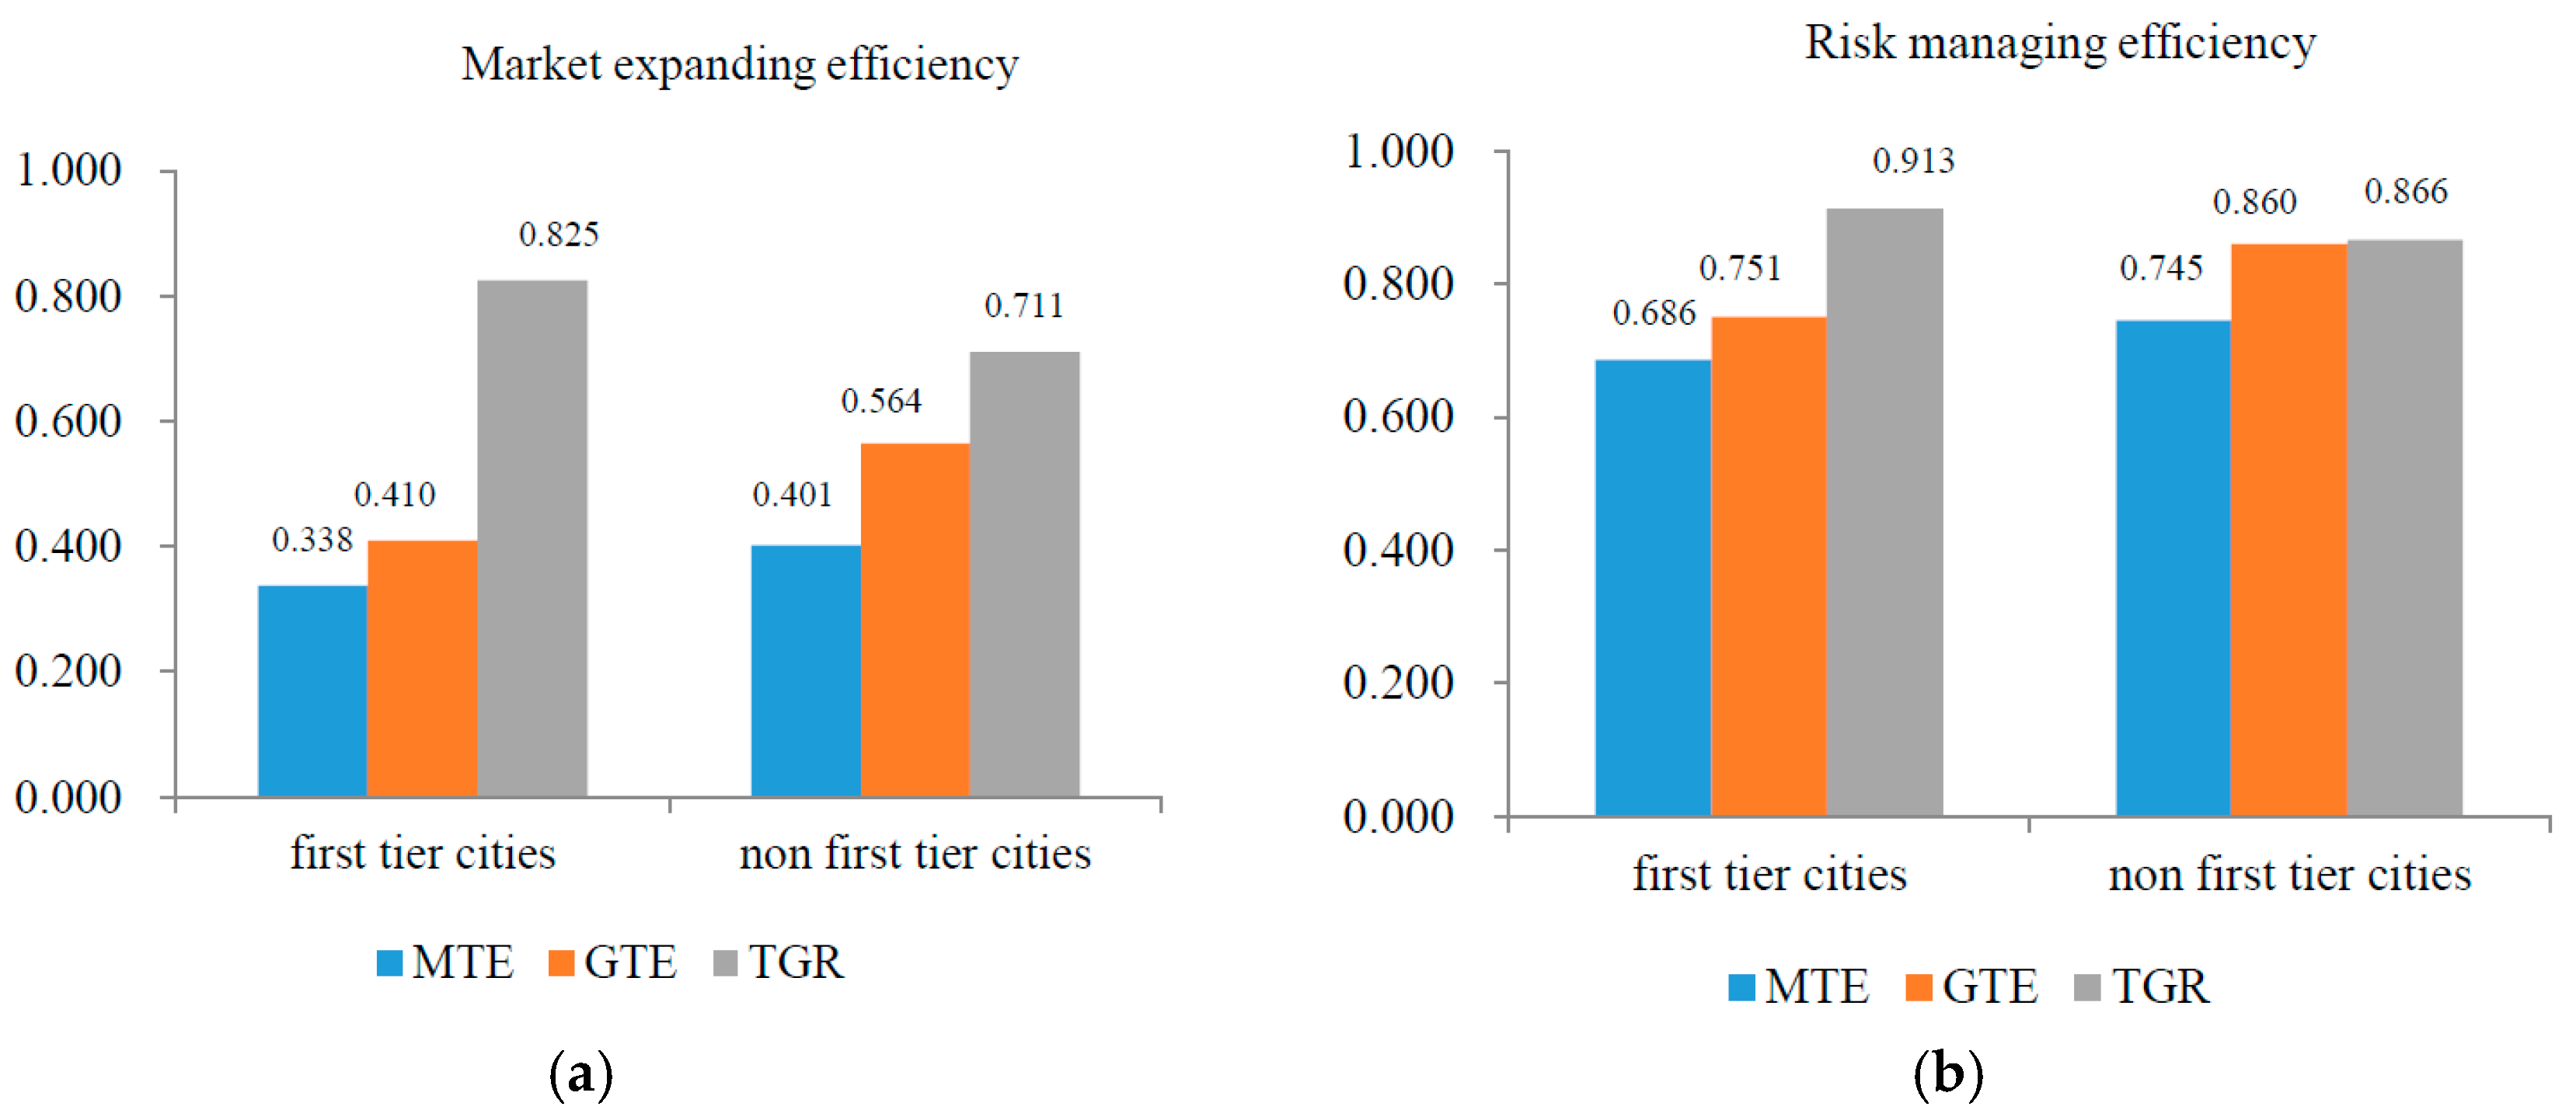
4.1. Time Trends and Spatial Characteristics

Since the NCG-SBM model can better reflect the current status of the P2P industry in China, as mentioned earlier, we focus on the empirical results of the NCG-SBM model to analyze the selected 66 representative sample platforms. Efficiency of each stage and the comprehensive efficiency are shown in Figure 5). We find the efficiency of the second stage is higher than that of the first stage. We can get important information from this result. Although the P2P platforms pay more attention to earn a larger market share in China, they truly do well in risk management. That is partially because the selected 66 P2P platforms are leading big platforms and they have the capacity to handle their own risks.
Figure 5 also shows the time trends of efficiency in each stage and the comprehensive efficiency as well. The overall trend of the risk managing efficiency seems stable, while the market expanding efficiency is not. In late August of 2016, a piece of regulatory policy of the P2P industry was carried out, with a range of impacts on the P2P platforms. The market-expanding efficiency shows a slight downward trend in September, and in the rest months’ trends are relatively stable. Meanwhile, the second stage efficiency is rising in September. Thus, we can infer that the strength of supervision enhances the platforms’ risk management and they therefore pay less attention to market expanding.
The average efficiency gap and efficiency trend of platforms in first tier cities and non-first tier cities are shown in Figure 6, Figure 7 and Figure 8. Figure 6 shows that on average, efficiency of platforms is distributed differently across different locations.
Figure 7 and Figure 8 show that during the sample period, although average efficiency of the platforms in the first-tier cities is more stable than that in non-first tier cities, platforms located in the non-first-tier cities’ platforms run more efficiently in both the market-expanding stage and the risk managing stage. This contradicts our common knowledge that the financial development of these first-tier cities is far ahead of other cities. The most important financial giants are located in these first-tier cities, which to some extent leads to the unbalanced financial development and resource distortion. But for the performance efficiency of P2P platforms, it is the opposite. We can see that P2P platforms could have better performances if located in non-first tier cities, which highlights that the development of the P2P industry will relieve the severe distortion of resource allocation and efficiency losses from unbalanced regional development.

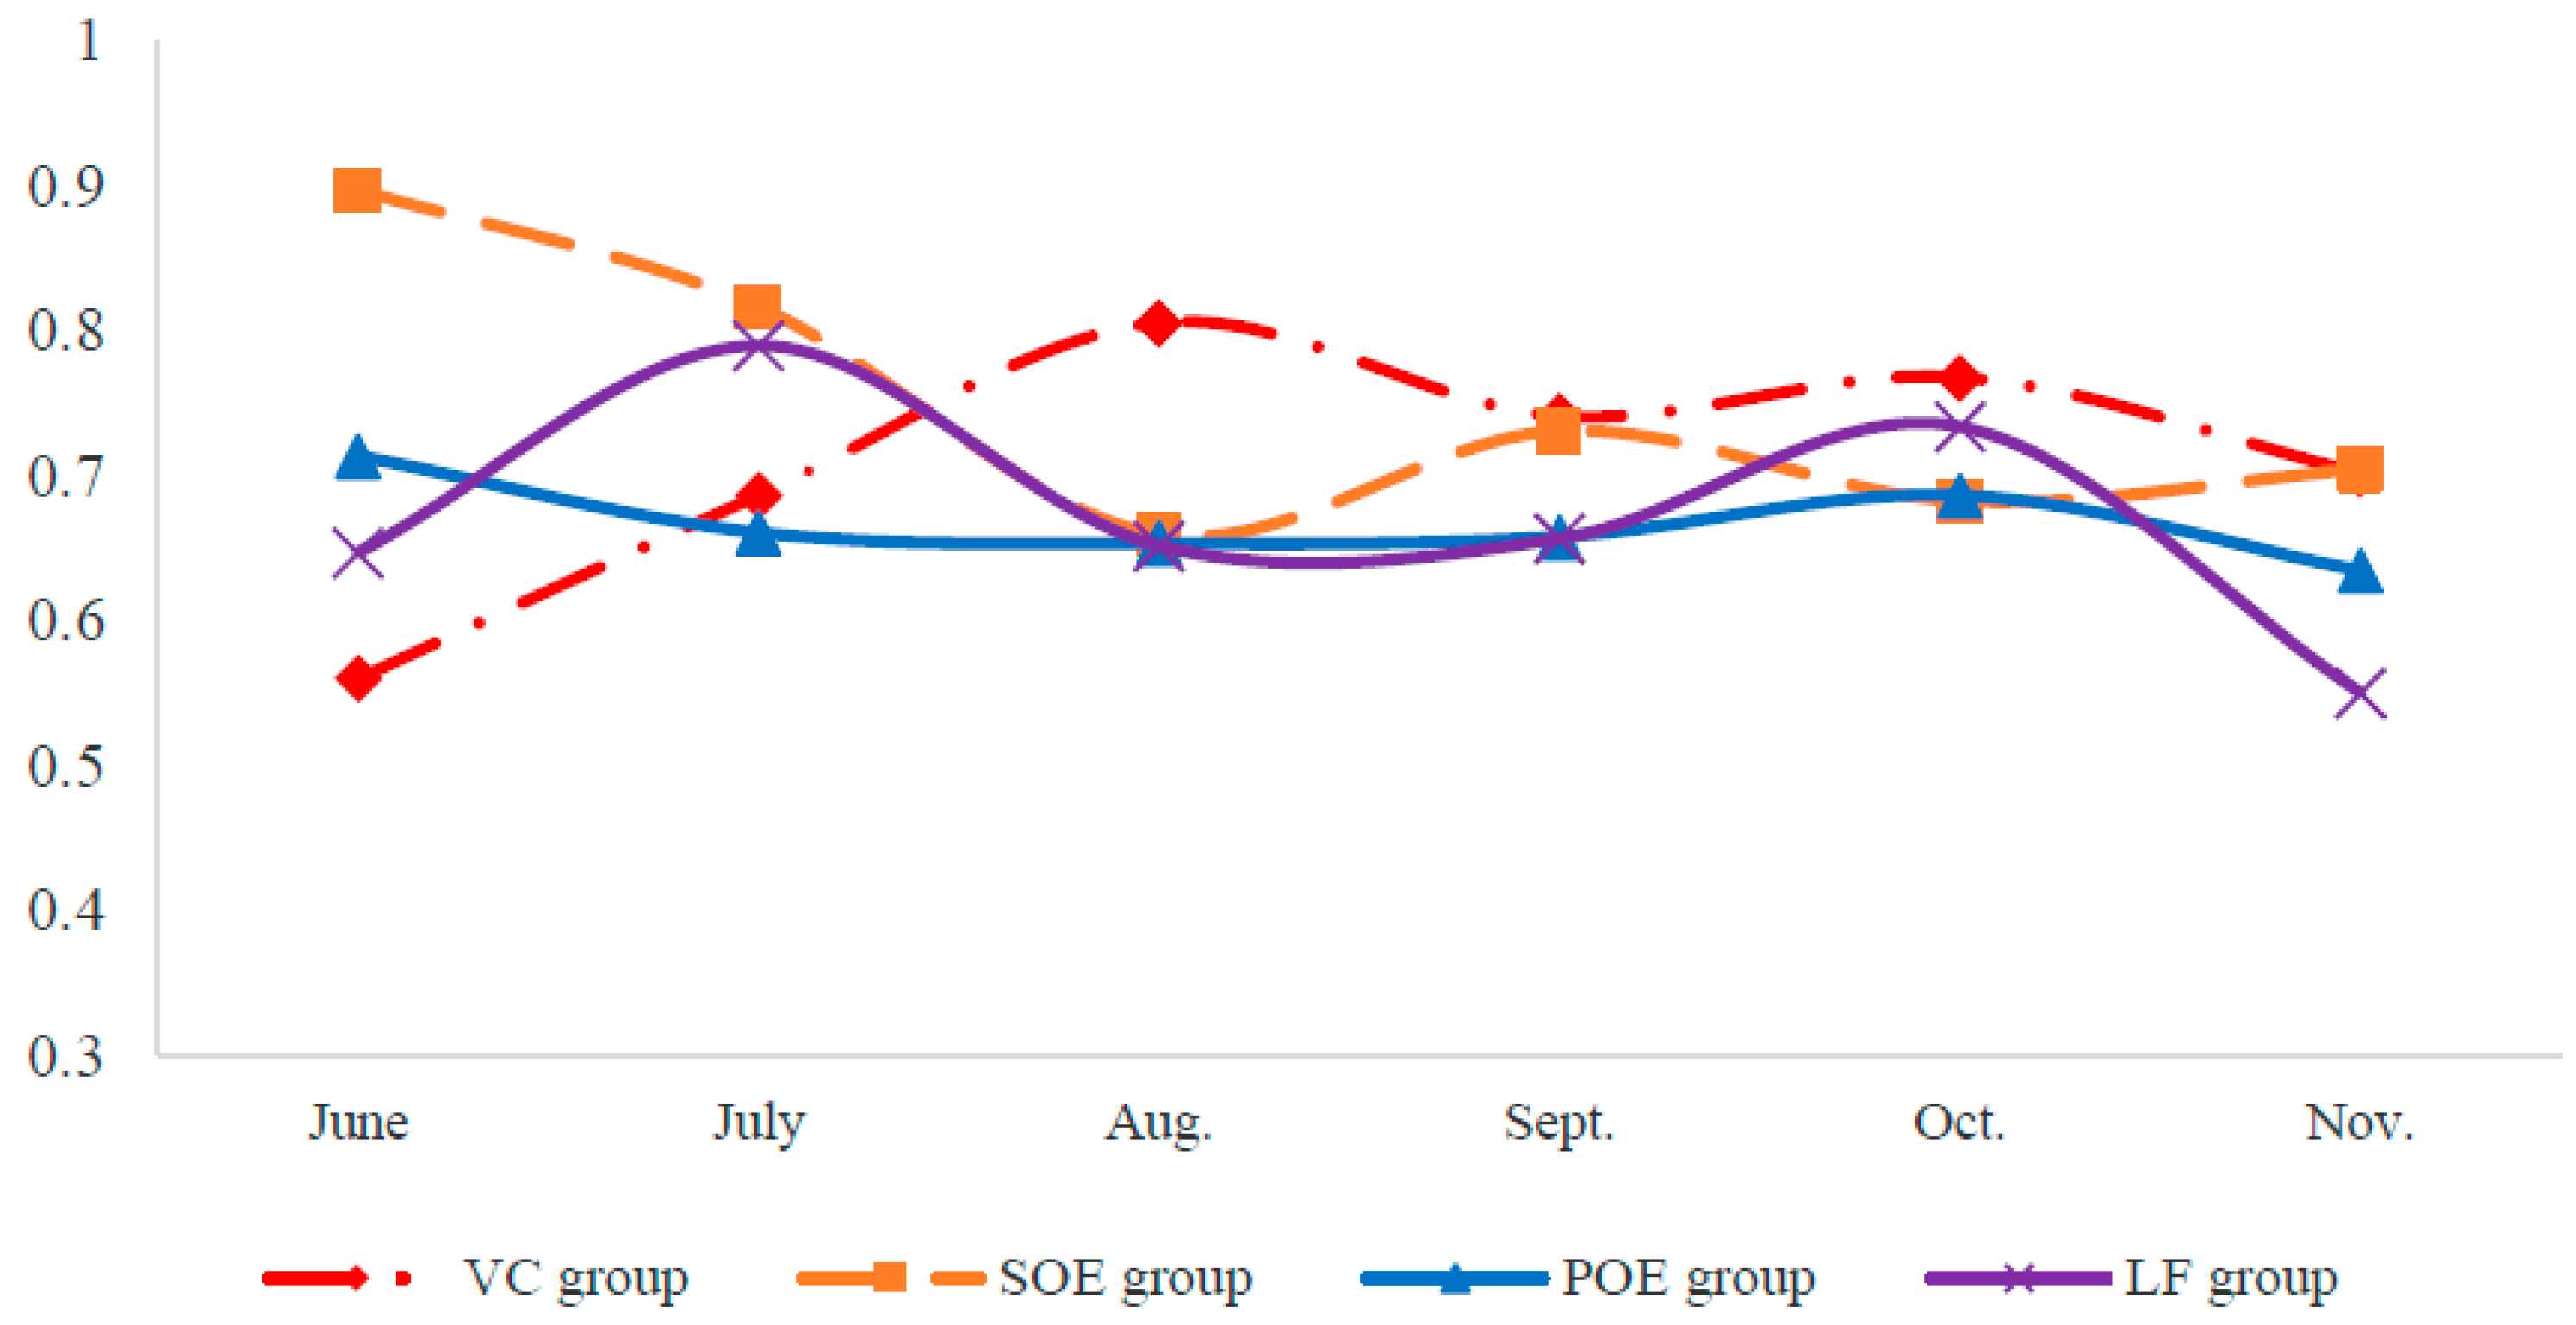
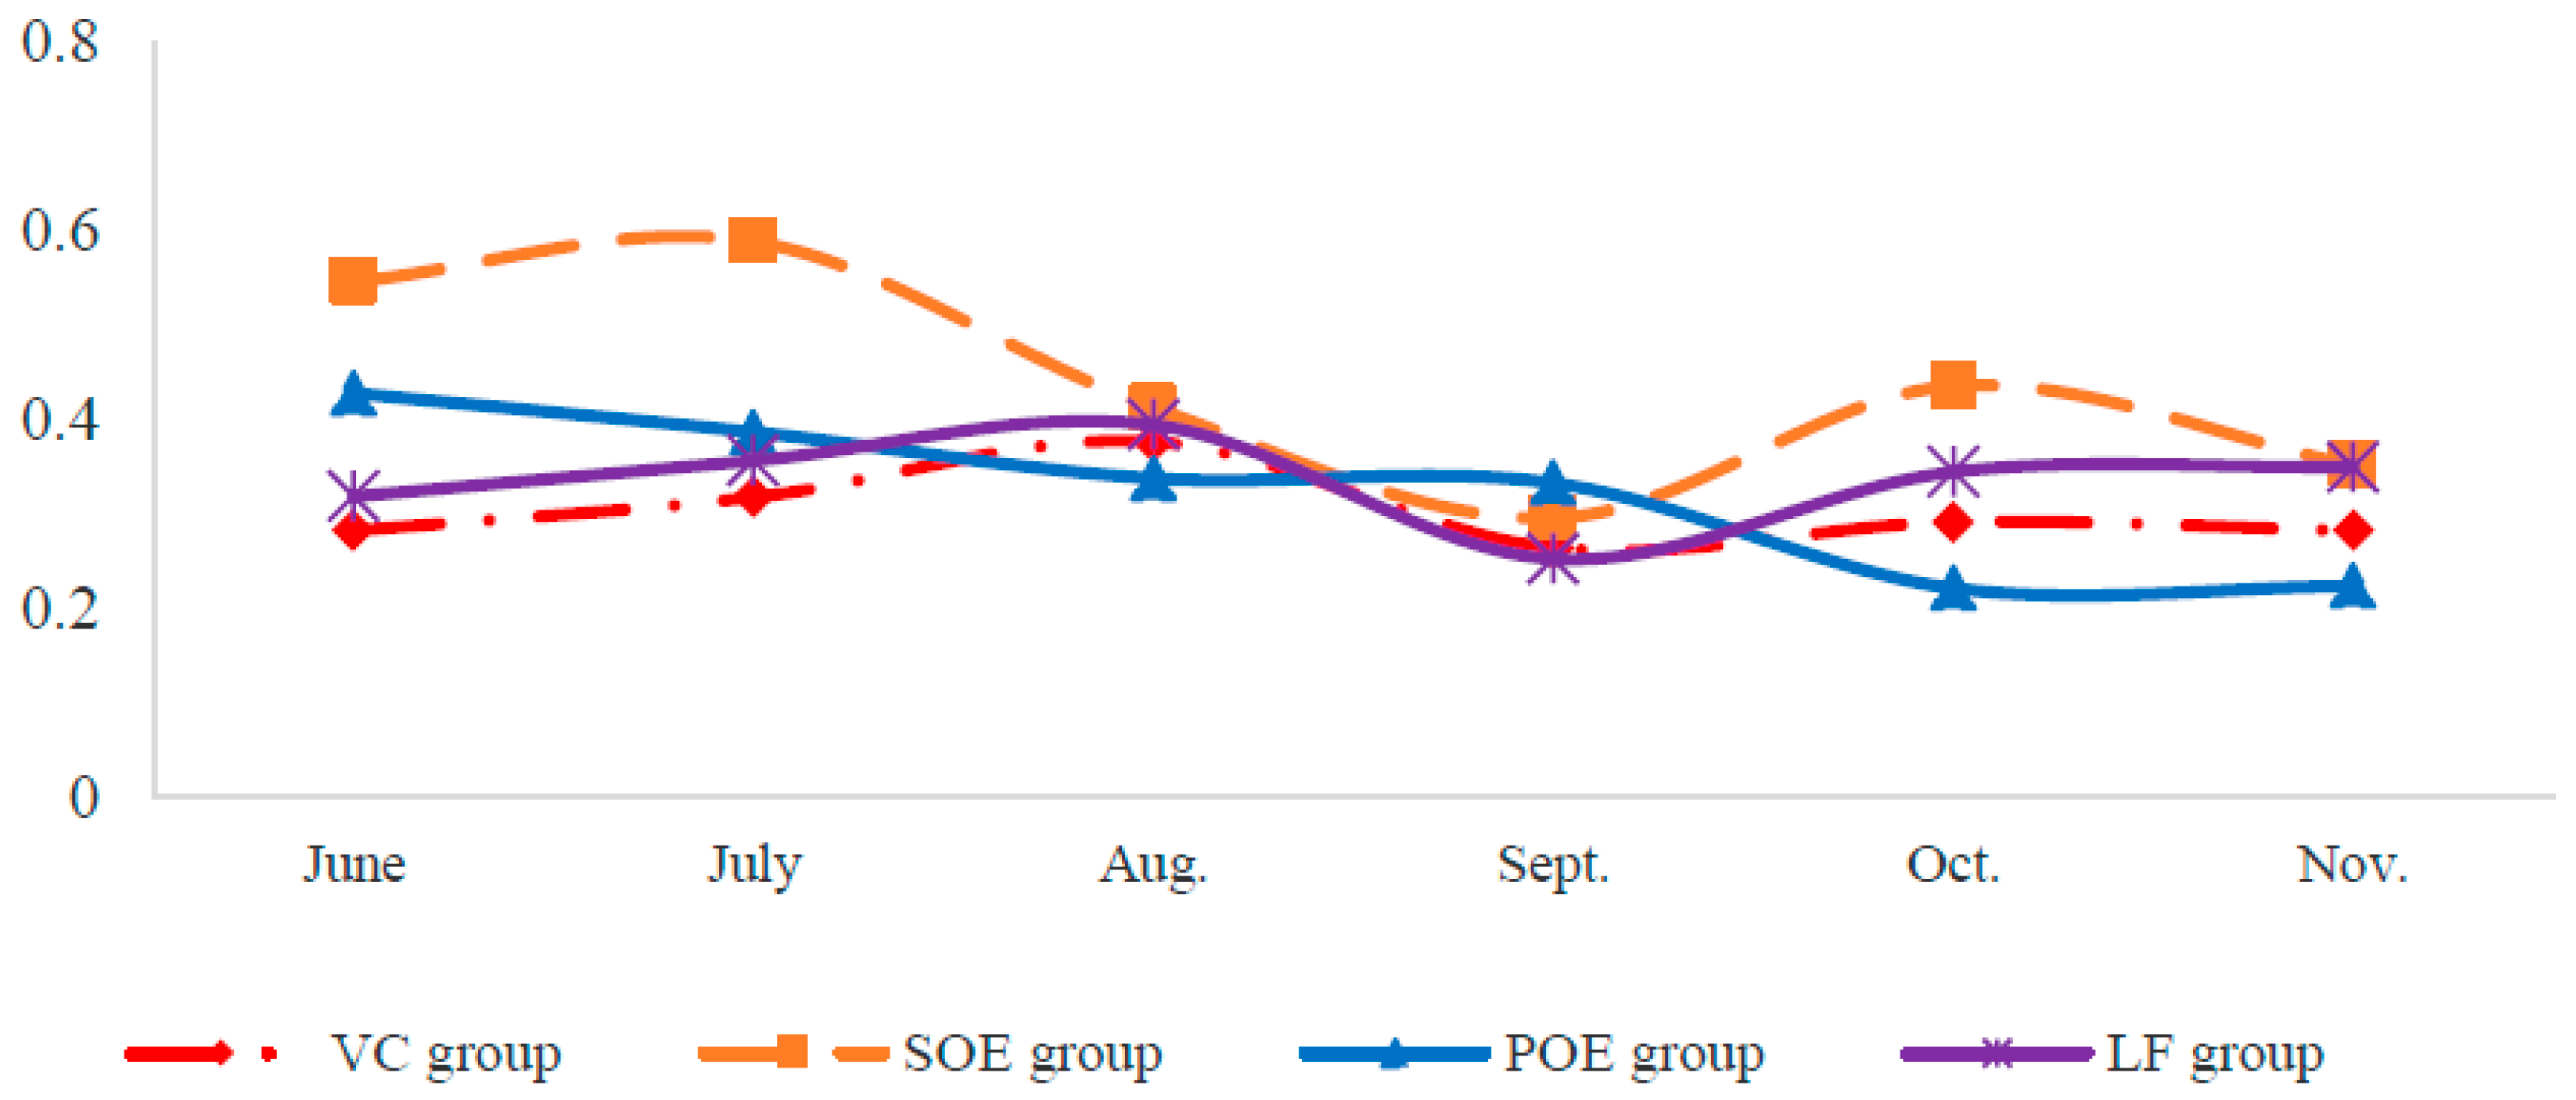
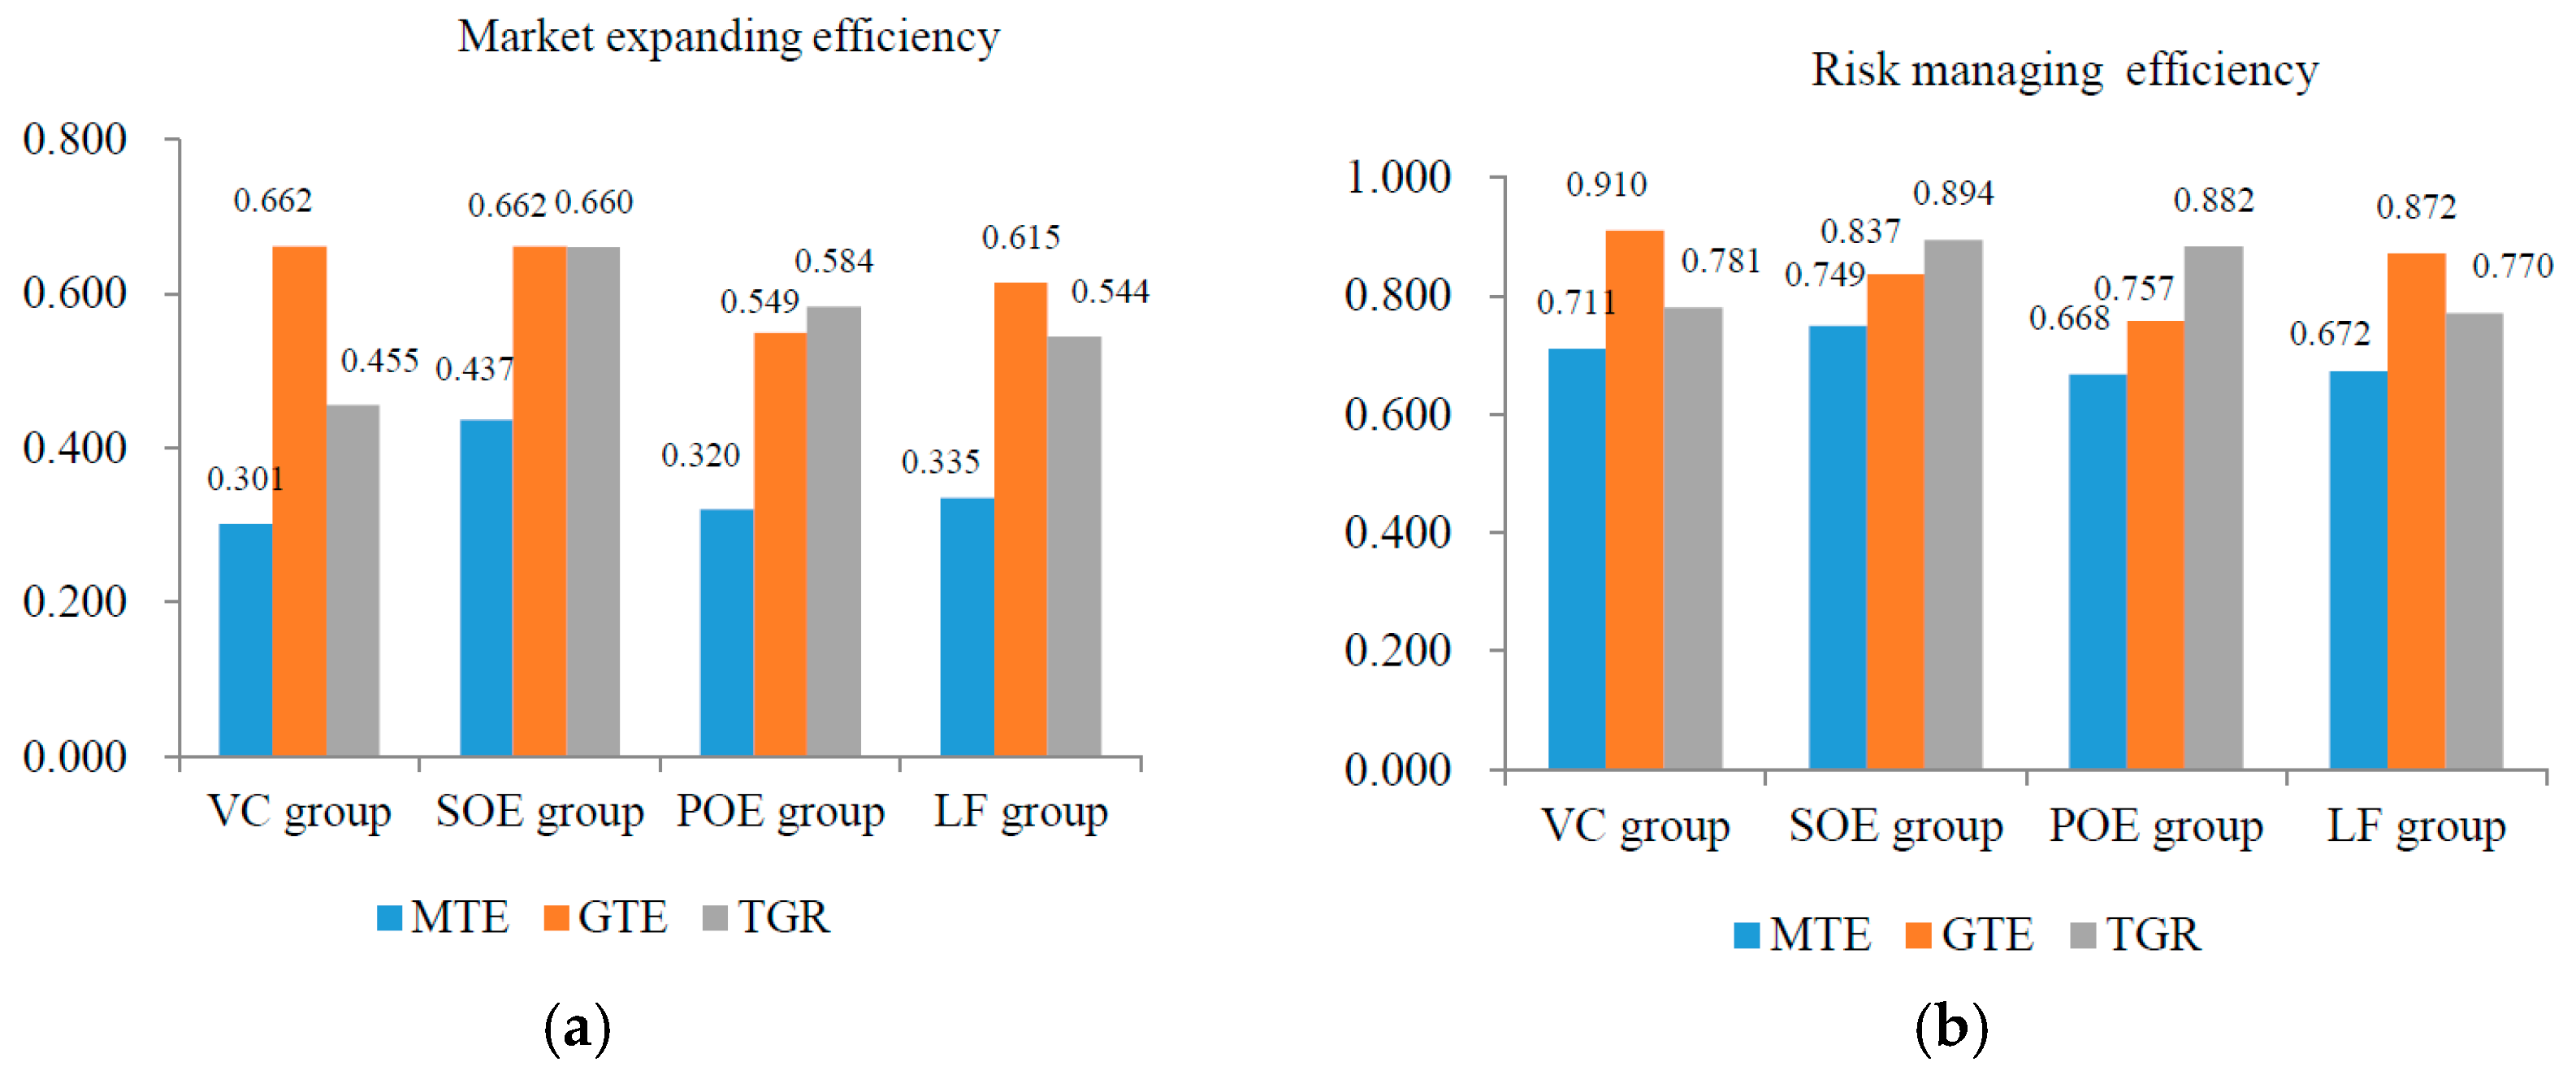
4.2. Efficiency Gap between Different Ownership Types

Figure 9 and Figure 10 show the expanding efficiency gap between different ownership types. We can see that platforms from the SOE group reveal the highest efficiency both in first and second stage. The gap between other groups is small. So we can infer that the SOE type P2P platforms have huge advantages in this industry. It can be explained by two primary factors. One reason is that in China, state-owned enterprises can gain a lot of preferential policy from the government and the regulators, and they have abundant capital, which can help them better mitigate risks. Another reason is that Chinese borrowers and lenders trust SOEs more than other types of companies. The lenders think that the SOE type platforms are too big to fall, and their investment through these platforms would be safe. The borrowers think the SOE type platforms are high-profile, so they would get more loan opportunities if borrowing on these platforms. Thus, the SOE group perform better than other groups in both the market-expanding and the risk-managing stage.

4.3. Two-Stage Inefficient Source Analysis

According to the SBM model, the input/output indicator inefficiencies can be calculated using the ratio of the slacks to the actual amount of input, output indicators. Table 4 shows the two-stage inefficient source.
As shown in Table 4, in the first stage, inefficiency mainly arises from insufficient lenders and lending volume per borrower. It shows that, although P2P platforms grow rapidly, they still cannot afford to satisfy the growing loan demand of the market. From the analysis of the second stage in Table 4, it shows that the reasons for inefficiency are mainly due to the absence of transparency, which means that P2P platforms do not do well in information disclosure. Although in China, the biggest P2P platforms have made risk controllable so far, the fuzzy information disclosure would still hinder the sustainable development of P2P businesses in the long run.

4.4. Robustness Check: A Meta-Frontier Approach

We apply the meta-frontier approach into the robustness check. In the above, we find the efficiency gap between different locations and different ownership types of the platforms. But the homogeneity assumption of DMUs may not be satisfied, which would lead to bias. According to Donnell et al. (2008) [31], we can define the group-frontier and calculate the group technical efficiency (GTE). For all groups, the 66 platforms also identify a meta-frontier, which is used to calculate a meta technical efficiency (MTE). The technology gap ratio (TGR) of DMU j is defined as TGR j = MTE j / GTE j , which is the indicator of distance between the group-frontier and the meta-frontier ( TGR ( 0 , 1 ] , since it is not difficult to show that MTE GTE ). Large valued TGR indicates the smaller distance between group-frontier and meta-frontier and less difference between MTE and GTE.
Figure 11 and Figure 12 display the average efficiency for the different locations, and different ownership types, under meta-frontier and group-frontier, as well as the technology gap ratio. Concerning the locations of platforms as shown in Figure 11, TGRs from both first-tier cities and non-first-tier cities are large valued, and there does not appear to be significant difference in either the market-expanding stage or the risk managing stage. This indicates that MTE and GTE are very close to each other, showing that the homogeneity assumption of DMUs is satisfied between first-tier cities and non-first-tier cities.
As for the different types of ownership, we find that TGRs of different groups are more valued in the risk managing stage and less valued in the market-expanding stage. Figure 12 demonstrates that, in the aspect of risk managing, homogeneity of DMUs holds. However, as for the market expanding stage, the intra-group heterogeneity does exist. To sum up, platforms from the SOE group are superior to that other groups, mainly because of the advantage of better risk management.

5. Conclusions and Enlightenment

In this study we divided P2P platforms’ operational stages into the market-expanding stage and the risk-managing stage. Based on the data collected from June 2016 to November 2016 of 66 leading P2P platforms on Wangdaizhijia and the application of the NCG-SBM model, we finally evaluate their performance efficiency innovatively. The main conclusions of this study are as follows:
(1) Although in the P2P industry, most of the small or micro platforms may suffer failure due to the low capacity of risk managing, the leading big platforms are truly doing well in risk managing work. Thus, we can conclude that the risk managing capacity is very crucial to the P2P industry.
(2) The average performance efficiency of platforms that are located in non-first-tier cities is higher than those in first tier cities. This unexpected result may indicate that the development of the P2P industry may relieve the severe unbalanced financial development between different regions. P2P platforms are also inclusive, as mentioned in this paper. Thus, the government should take measures to support the development of the P2P industry, in order to reduce the regional development gap, as well as to help the poor and small business companies.
(3) We also divided the P2P platforms according to their ownership type and found that average efficiency of the SOE group was in a dominant position. The robustness check shows that the SOE group platforms were mainly superior to others in risk management. It indirectly reflects the advantages of SOEs in China. Even in the P2P industry, platforms from the SOE group are bigger, richer and run more robustly.
(4) Last but not least, the sources of inefficiency mainly stem from the shortage of lenders, the lack of average borrowing balance, and the insufficient transparency of information disclosure. This shows areas for improvement in performance efficiency of the P2P industry. More actions should be taken to attract more lenders to participate in the P2P lending business. The information is also very important, and regulators or supervision departments should encourage P2P platforms to disclose more information. Furthermore, we suggest that an international association should be found and international norms for the P2P industry should be created and enacted. Thus, we urge the P2P platforms to make their information more transparent to the public. As the P2P market is in a virtual space, a potential crisis is likely to spread rapidly across countries. Thus, we advocate international cooperation for the regulation of the P2P industry.
Although in this article we pioneer the systematic study on performance efficiency evaluation of P2P platforms, the shortcomings include that the sample size is small. Currently, however, it is very difficult to collect a large-sized and balanced panel of data. The results and significance of our study would be enhanced if we could increase the sample size. As future research in this field, these studies can be further in the direction of how to predict crises or bankruptcy in a P2P platform, which is a current issue of public concern. In the future, we believe there will certainly be more and more meaningful topics about P2P that will be worthy of study.

Author Contributions

All authors equally contributed to the writing of the paper.

Funding

This research was supported by the National Natural Science Foundation of China (Grant No. 71701059 and 71471053) and the Fundamental Research Funds for the Central Universities of China (Grant No. JS2018HGXJ0038).

Acknowledgments

This research was supported by the National Natural Science Foundation of China (Grant No. 71701059 and 71471053) and the Fundamental Research Funds for the Central Universities of China (Grant No. JS2018HGXJ0038). We are grateful to Min Li for her useful help. We would also like to thank our anonymous reviewers for instructive advice, and the editors for language smoothing.

Conflicts of Interest

The authors declare no conflict of interest.

References

  1. Beck, T.; Demirguc-Kunt, A.; Martinez Peria, M.S. Reaching Out: Access to and Use of Banking Services Across Countries; The World Bank: Washington, DC, USA, 2005. [Google Scholar]
  2. Duarte, J.; Siegel, S.; Young, L. Trust and credit: the role of appearance in peer-to-peer lending. Rev. Financ. Stud. 2012, 25, 2455–2484. [Google Scholar] [CrossRef]
  3. Herzenstein, M.; Sonenshein, S.; Dholakia, U.M. Tell me a good story and I may lend you money: The role of narratives in peer-to-peer lending decisions. J. Market Res. 2011, 48, S138–S149. [Google Scholar] [CrossRef]
  4. Barasinska, N.; Schäfer, D. Is Crowdfunding Different? Evidence on the Relation between Gender and Funding Success from a German Peer-to-Peer Lending Platform. Ger. Econ. Rev. 2014, 15, 436–452. [Google Scholar] [CrossRef]
  5. Emekter, R.; Tu, Y.; Jirasakuldech, B.; Lu, M. Evaluating credit risk and loan performance in online Peer-to-Peer (P2P) lending. Appl. Econ. 2015, 47, 54–70. [Google Scholar] [CrossRef]
  6. Liao, L.; Ji, L.; Zhang, W.Q. Education and credit: evidence from P2P lending platform. J. Financ. Res. 2015, 3, 146–159. (In Chinese) [Google Scholar]
  7. Dorfleitner, G.; Priberny, C.; Schuster, S.; Stoiber, J.; Weber, M.; Castro, I.D.; Kammler, J. Description-text related soft information in peer-to-peer lending–Evidence from two leading European platforms. J. Bank. Financ. 2016, 64, 169–187. [Google Scholar] [CrossRef]
  8. Ravina, E. Love & Loans: The Effect of Beauty and Personal Characteristics in Credit Markets. Available online: https://papers.ssrn.com/sol3/papers.cfm?abstract_id=1101647 (accessed on 19 June 2018).
  9. Paravisini, D.; Rappoport, V.; Ravina, E. Risk aversion and wealth: Evidence from person-to-person lending portfolios. Manag. Sci. 2016, 63, 279–297. [Google Scholar]
  10. Zhang, J.; Liu, P. Rational herding in microloan markets. Manag. Sci. 2012, 58, 892–912. [Google Scholar] [CrossRef] [Green Version]
  11. Chen, D.; Lin, Z. Rational or Irrational Herding in Online Microloan Markets: Evidence from China. SSRN Electron. J. 2014. [Google Scholar] [CrossRef]
  12. Aysan, A.F.; Karakaya, M.M.; Uyanik, M. Panel stochastic frontier analysis of profitability and efficiency of Turkish banking sector in the post crisis era. J. Bus. Econ. Manag. 2011, 12, 629–654. [Google Scholar] [CrossRef]
  13. Lensink, R.; Meesters, A. Institutions and bank performance: A stochastic frontier analysis. Oxf. Bull. Econ. Stat. 2014, 76, 67–92. [Google Scholar] [CrossRef]
  14. Ruggiero, J. A comparison of DEA and the stochastic frontier model using panel data. Int. Trans. Oper. Res. 2007, 14, 259–266. [Google Scholar] [CrossRef]
  15. Silva, T.C.; Tabak, B.M.; Cajueiro, D.O.; Dias, M.V.B. A comparison of DEA and SFA using micro- and macro-level perspectives: Efficiency of Chinese local banks. Phys. Stat. Mech. Appl. 2016, 216–223. [Google Scholar] [CrossRef]
  16. Chen, X.; Skully, M.; Brown, K. Banking efficiency in China: Application of DEA to pre-and post-deregulation eras: 1993–2000. China Econ. Rev. 2005, 16, 229–245. [Google Scholar] [CrossRef]
  17. Fukuyama, H.; Weber, W.L. A directional slacks-based measure of technical inefficiency. Soc. Econ. Plan. Sci. 2009, 43, 274–287. [Google Scholar] [CrossRef]
  18. Eskelinen, J.; Halme, M.; Kallio, M. Bank branch sales evaluation using extended value efficiency analysis. Eur. J. Oper. Res. 2014, 232, 654–663. [Google Scholar] [CrossRef]
  19. BI, G.B.; Liang, L.; Yang, F. A DEA-Based Efficiency-Measuring Model for Two-Stage Production Systems with Constrained Resources. Chin. J. Manag. Sci. 2009, 17, 71–75. (In Chinese) [Google Scholar]
  20. Fukuyama, H.; Weber, W.L. A slacks-based inefficiency measure for a two-stage system with bad outputs. Omega 2010, 38, 398–409. [Google Scholar] [CrossRef]
  21. Paradi, J.C.; Rouatt, S.; Zhu, H. Two-stage evaluation of bank branch efficiency using data envelopment analysis. Omega 2011, 39, 99–109. [Google Scholar] [CrossRef]
  22. Akther, S.; Fukuyama, H.; Weber, W.L. Estimating two-stage network slacks-based inefficiency: An application to Bangladesh banking. Omega 2013, 41, 88–96. [Google Scholar] [CrossRef]
  23. Maghbouli, M.; Amirteimoori, A.; Kordrostami, S. Two-stage network structures with undesirable outputs: A DEA based approach. Measurement 2014, 48, 109–118. [Google Scholar] [CrossRef]
  24. Wanke, P.; Barros, C. Two-stage DEA: An application to major Brazilian banks. Expert Syst. Appl. 2014, 41, 2337–2344. [Google Scholar] [CrossRef]
  25. An, Q.; Chen, H.; Wu, J.; Liang, L. Measuring slacks-based efficiency for commercial banks in China by using a two-stage DEA model with undesirable output. Ann. Oper. Res. 2015, 235, 13–35. [Google Scholar] [CrossRef]
  26. Tone, K.; Tsutsui, M. Network DEA: A slacks-based measure approach. Eur. J. Oper. Res. 2009, 197, 243–252. [Google Scholar] [CrossRef] [Green Version]
  27. Bian, Y. Eco-efficiency evaluation of non-cooperative game two-stage production system. J. Manag. Sci. China 2012, 7, 11–19. [Google Scholar]
  28. Li, Y.; Chen, Y.; Liang, L.; Xie, J. DEA models for extended two-stage network structures. Omega 2012, 40, 611–618. [Google Scholar] [CrossRef]
  29. Xia, Q.; Li, M.; Wu, H.; Lu, Z. Does the Central Government’s Environmental Policy Work? Evidence from the Provincial-Level Environment Efficiency in China. Sustainability 2016, 8, 1241. [Google Scholar] [CrossRef]
  30. Cooper, W.W.; Seiford, L.M.; Zhu, J. Handbook on Data Envelopment Analysis, 2nd ed.; Springer: New York, NY, USA, 2011; pp. 199–200. [Google Scholar]
  31. O’Donnell, C.J.; Rao, D.S.P.; Battese, G.E. Metafrontier frameworks for the study of firm-level efficiencies and technology ratios. Empir. Econ. 2008, 34, 231–255. [Google Scholar] [CrossRef]
Figure 1. Growth trends of Chinese Peer-to-Peer (P2P) industry and the Lending Club.
Sustainability 10 02987 g001
Figure 2. P2P process flow chart.
Sustainability 10 02987 g002
Figure 3. The simplified flow chart of P2P two-stage operation.
Sustainability 10 02987 g003
Figure 4. Area distribution of the 66 platforms.
Sustainability 10 02987 g004
Figure 5. Two stage efficiency and comprehensive efficiency with NCG-SBM model.
Sustainability 10 02987 g005
Figure 6. Performance of the platforms in different locations.
Sustainability 10 02987 g006
Figure 7. Market expanding efficiency of different locations.
Sustainability 10 02987 g007
Figure 8. Risk managing efficiency of different locations.
Sustainability 10 02987 g008
Figure 9. Market expanding efficiency of different ownership types.
Sustainability 10 02987 g009
Figure 10. Risk managing efficiency of different ownership types.
Sustainability 10 02987 g010
Figure 11. Average efficiency of different locations under meta-frontier and group-frontier. (a) Market expanding efficiency; (b) Risk managing efficiency.
Sustainability 10 02987 g011
Figure 12. Average efficiency of different type of ownership under meta-frontier and group frontier. (a) Market expanding efficiency; (b) Risk managing efficiency.
Sustainability 10 02987 g012
Table 1. The differences of performance evaluation between banks and P2P platforms.
Commercial BankP2P Platforms
First stageA deposit-generation stage. Banks combine labor, physical capital, and financial equity capital to raise deposits, which serve as an intermediate output.A market expanding stage. Platforms help finance for borrowers. The average funding time, average loan interest rate and number of requests are inputs. Number of lenders, total lending volume, borrowing balance for per borrower and the average maturity of loans (intermediate) are outputs. The undesirable output is due balance (intermediate).
Second stageA deposit-utilization stage. In the second stage, banks use the deposits raised from the first stage to produce loans and securities investments. In the second stage some loans might become non-performing, with borrowers unable to make full or even partial repayment.A risk managing stage. The platforms think of lenders’ risk management. The average maturity of loans and due balance are treated as the inputs of the second stage. The outputs of the second stage are dispersity, liquidity and transparency.
Table 2. The implication of relevant indicators.
VariablesImplications
First StageAverage funding timeThe time total time taken when the loan is 100% funded. (unit: hour)
Average loan interest rateThe average interest rate of loans. It reflects the borrowers’ costs and the lenders’ benefit. (unit: %)
Number of requestsThe funding requests sponsored by the borrowers.
Number of lendersIt reflects the activation of the supply side.
Total lending volumeThe total money that is successfully funded by the borrowers via the platforms (unit: 10-thousands RMB).
Borrowing balance of per borrowerThe personal financing scale of each borrower, and it reflects the financing abilities of borrowers. (10-thousands RMB)
Intermediate OutputsAverage maturity of loansA longer maturity means of a higher availability of the funding money to the borrowers. (month)
Due balanceTotal money that is to be repaid (10-thousandsRMB)
Second StageDispersityIndex constructed by Wangdaizhijia. The dispersity index is for measuring the systematic risk of a platform, since we all know the famous motto that “never put all eggs in a single basket”. (unit: %)
LiquidityIndex constructed by Wangdaizhijia. The liquidity index reflects a platform’s ability to manage the mismatch problem of different loans. (unit: %)
TransparencyIndex constructed by Wangdaizhijia. The transparency index reflects information disclosure status. (unit: %)
Table 3. Data descriptive statistics.
VariablesMaxMinMeanStd. Dev.
Average funding time9403.820.00382.37899.83
Average loan interest rate16.540.509.862.39
Number of requests1,780,027.0016.0077,656.35253,475.00
Number of lenders273,722.0032.0022,493.4139,861.68
Total lending volume3,947,869.002039.35119,738.50384,846.30
Borrowing balance of per borrower3873.430.15203.90438.04
Average maturity of loans218.180.528.2212.68
Due balance10,098,488.006297.32485,334.901,304,055.00
Dispersity94.265.8958.3120.52
Liquidity100.006.8068.4715.83
Transparency70.880.0040.5410.52
Table 4. Sources for inefficiency of each stage.
First StageSecond Stage
Average funding time0.32--
Average loan interest rate0.16--
Number of requests0.31--
Total lending volume0.42--
Number of lenders21.56--
Borrowing balance of per borrower154.26--
Average maturity of loans3.300.003
Due balance0.130.03
Dispersity--0.06
Liquidity--0.48
Transparency--1860.563

